Embed Size (px)
Citation preview


© 2009
European Nuclear Society Rue Belliard 65 1040 Brussels, Belgium Phone + 32 2 505 30 54 Fax +32 2 502 39 02 E-mail [email protected] Internet www.euronuclear.org ISBN 978-92-95064-07-2 These transactions contain all contributions submitted by 20 March 2009. The content of contributions published in this book reflects solely the opinions of the authors concerned. The European Nuclear Society is not responsible for details published and the accuracy of data presented.
2 of 79

Session II
Fuel Development
3 of 79

LTA’S MANUFACTURING FOR JHR FUEL QUALIFICATION PROGRAM IN BR2 REACTOR
I. CAILLIERE & P. COLOMB AREVA-CERCA
Les Bérauds, B.P. 1114, 26104 Romans Cedex – France
MC ANSELMET(1) & P. LEMOINE(2), (1) CEA-Cadarache – 13108 Saint Paul lez Durance – Cedex - France
(2) CEA-Saclay – 91191 Gif sur Yvette – Cedex - France
F. JOPPEN & P. BENOIT & E. KOONEN SCK – CEN, Boeretang 200, B-2400 MOL, Belgium
S. BRISSON, S. GUILLOT
AREVA-TA 1100, av JR Guilibert Gautier de la Lauzière , 13593 Aix-en –Provence - France
ABSTRACT
In the frame of the JHR fuel qualification program, CEA awarded to AREVA-CERCA an order for the manufacture and delivery of twelve Lead Test Assemblies. These assemblies are made in MEU U3Si2 type fuel plates using AlFeNi cladding. They are dedicated to experimental tests performed in the BR2 reactor, with the purpose of demonstrating the good behaviour of the fuel elements under operating conditions representative of the JHR normal operation. The main challenges were to manufacture new designed fuel assemblies with specific constraints on the geometry and on the manufacturing margins, due to the high performances required for the JHR reactor; as well as to deal with the insertion of burnable poisons in the U3Si2 type fuel plates. This paper is focused on manufacturing developments performed along the project so as to finally successfully produce the LTA’s fuel elements. AREVA-CERCA, a subsidiary of AREVA NP, an AREVA and SIEMENS Company
4 of 79

1. Introduction Since 1957, date of creation, CERCA Company has always been involved in fuel development for MTR reactors.
When CEA decided to start up the study of the new French JHR MTR reactor, AREVA was early involved in the project for reactor and fuel design through AREVA TA and AREVA-CERCA companies.
In 2006, CEA awarded to AREVA – CERCA an order for the manufacture and the delivery of twelve lead test assemblies, in the frame of the JHR fuel qualification program. Five assemblies are dedicated to qualification tests performed in the “EVITA” loop of BR2 reactor, with the purpose of demonstrating the good behaviour of the fuel elements under operating conditions representative of the JHR normal operation. While, other seven assemblies are dedicated to experimental tests performed in the EOLE reactor with the purpose of JHR core modelling for “HORUS-3D” qualification.
This paper is focused on necessary developments which have been carried out in order to manufacture these new designed fuel elements.
2. Fuel element design details JHR fuel element is a cylindrical element, constituted of a fuel section fitted with an endfitting at each extremity. The fuel section is constituted of an assembly of three sectors of 8 sizes of plates (see figure 2 for a sketch of the fuel section). The plates are roll-swaged in three stiffeners which ensure the connection with endfittings. The LTA’s for EVITA and EOLE differ mainly by their endfitting. Figure 1 shows sketches of each type of LTA.
Fig 1: Sketches of fuel elements
5 of 79

Fig 2: Sketch of a LTA’s fuel section
The plates of the fuel element are distributed according to 8 sizes. The composition of each plate is the following: insertion of a fuel core in high density U3Si2 (4,8 g/cm3) and of a boron insert in an AG3 frame, cladded in an AlFeNi cover-sheet – see figure 3 for a plate sketch.
Fig 3: Sketch of a plate
3. Technical challenges and results To be successful in the LTA’s manufacturing requirement, several challenges were accepted by AREVA-CERCA. They are related to:
- Place a boron insert in a high density U3Si2 fuel plate,
- Bending of U3Si2 high density fuel plates,
- Roll-swaging of 8 sizes of plates with a narrow watergap,
- Fabrication of an assembly able to be easily dismantled.
They are all detailed hereafter.
Stiffener to 9 : 8 sizes of
plates
AlFeNi cladding
U3Si2 fuel core
Boron insert
AG3 frame
6 of 79

A
B
C
D
E iE e
3.1. Place a boron insert in a high density U3Si2 fuel plate AREVA-CERCA already had experience as regards insertion of a boron insert but only with an aluminide fuel core. The specificities of JHR’s developments were:
- The fabrication of a boron insert with a high quantity of boron,
- The fabrication of the fuel plate with mastering the occurrence of blistering and low cladding thickness.
So as to succeed, several types of boron inserts were manufactured and placed in the plates in order to test different mechanical behaviours. The parameters tested in the boron inserts were the following:
- The boron core,
- The cladding,
- The fabrication process.
Fig 4: Sketch of a boron insert
After a development period of more than one year, organised in several progressive testing phases, a design of boron insert as well as a design of fuel plate were agreed. They enabled to reach a high level of quality, as show following inspections results:
- No blister was observed by visual inspection, nor by UT,
- The cladding thickness reached was similar to other standard fabrications – see figures 5 and 6 for illustrations in the uranium and in the boron area,
- Homogeneous uranium distribution surface was obtained, even in the dog-bone area – see figure 7.
Fig 5: Metallographic inspection: dog bone area Fig 6: Metallographic inspection: boron insert area
Fig 7: Surfacic uranium distribution
These excellent results enabled to obtain the acceptance of the CEA on the designs retained and to validate the specification covering the fabrication of the plates.
Boron core
Aluminium cladding
7 of 79

3.2. U3Si2 high density fuel plates bending
JHR fuel section is constituted of 8 sizes of plates, bended according to various radius of curvatures. The radius of curvature of the most internal sizes of plates were lower than those usually manufactured in AREVA-CERCA (in particular, size # 1 with a radius of curvature of 22 mm). This meant that we had to adapt the bending tool and to develop new bending parameters enabling to distort the plate while ensuring a perfect integrity of the fuel core and no modification of the global thickness of the plate.
Fig 8 – Picture of bended JHR plates of extreme sizes
To do so, a specific study was performed to define the necessary tools to implement. Several plates in surrogate materials and then in depleted uranium were manufactured and bended with the retained tool. Detailed inspections were performed on the plates to make sure of their internal quality (radiography of the plate, metallographic inspection on the entire core and on the boron insert). For example, figure 9 - metallographic picture on the central zone of the core on an overbended plate (radius of curvature around 16 mm) – doesn’t show any crack and deformation.
Fig 9: Picture of a metallographic inspection – central zone of the plate These excellent results enabled to validate the modified tools and to install them on the bending machine.
3.3. Roll-swaging of 8 sizes of plates with a narrow watergap The aimed watergap by CEA was extremely difficult to achieve considering concentric assemblies.
The challenge for AREVA-CERCA lied in reaching the low value of 1,95 mm, while maintaining a limited tolerance of ± 0,30 mm, and this, on seven successive watergaps.
This has conducted AREVA-CERCA to design a new parametering on the roll-swaging machine with a complete modification of the existing tools.
A complex study has been launched to define a tool that would enable to perform the operation and to check the manufacturing reproducibility on each watergap. Following parameters were particularly studied: the accurate positioning of the plates inside the element, the shape of the roll-swaged wheels, …
Size 8 – Most external size
Size 1 – Most internal size
8 of 79
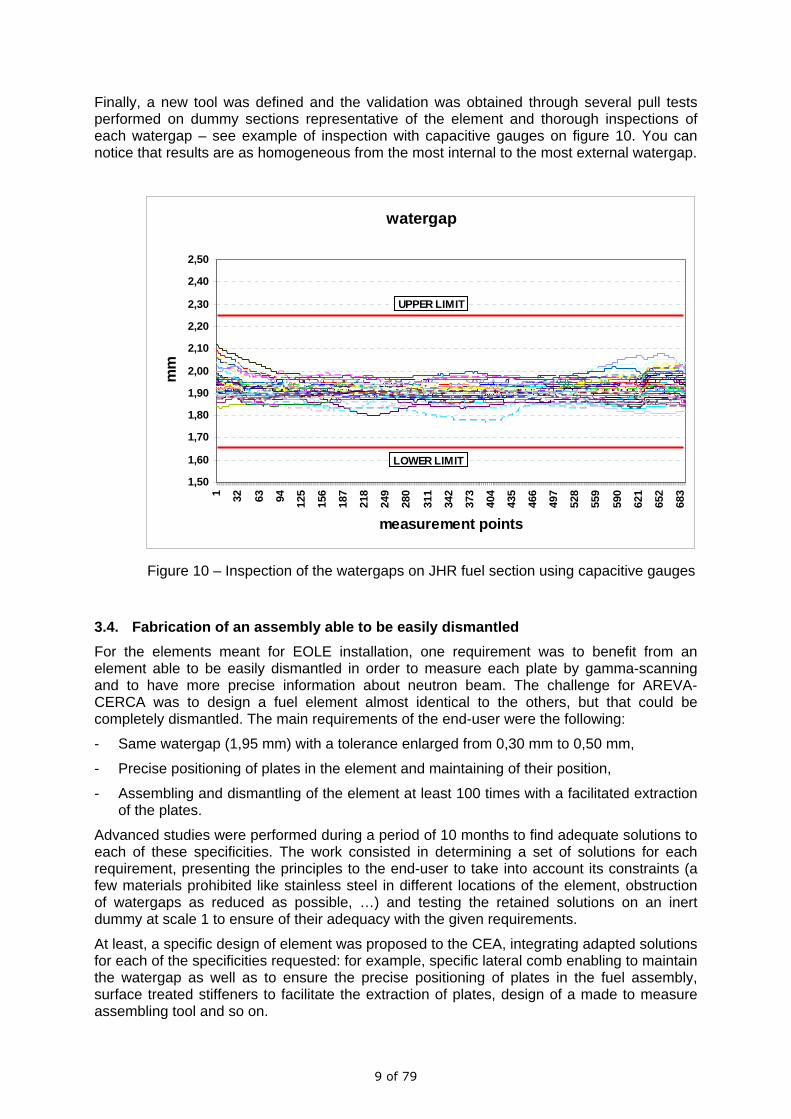
Finally, a new tool was defined and the validation was obtained through several pull tests performed on dummy sections representative of the element and thorough inspections of each watergap – see example of inspection with capacitive gauges on figure 10. You can notice that results are as homogeneous from the most internal to the most external watergap.
watergap
1,50
1,60
1,70
1,80
1,90
2,00
2,10
2,20
2,30
2,40
2,50
1 32 63 94 125
156
187
218
249
280
311
342
373
404
435
466
497
528
559
590
621
652
683
measurement points
mm
UPPER LIMIT
LOWER LIMIT
Figure 10 – Inspection of the watergaps on JHR fuel section using capacitive gauges
3.4. Fabrication of an assembly able to be easily dismantled For the elements meant for EOLE installation, one requirement was to benefit from an element able to be easily dismantled in order to measure each plate by gamma-scanning and to have more precise information about neutron beam. The challenge for AREVA-CERCA was to design a fuel element almost identical to the others, but that could be completely dismantled. The main requirements of the end-user were the following:
- Same watergap (1,95 mm) with a tolerance enlarged from 0,30 mm to 0,50 mm,
- Precise positioning of plates in the element and maintaining of their position,
- Assembling and dismantling of the element at least 100 times with a facilitated extraction of the plates.
Advanced studies were performed during a period of 10 months to find adequate solutions to each of these specificities. The work consisted in determining a set of solutions for each requirement, presenting the principles to the end-user to take into account its constraints (a few materials prohibited like stainless steel in different locations of the element, obstruction of watergaps as reduced as possible, …) and testing the retained solutions on an inert dummy at scale 1 to ensure of their adequacy with the given requirements.
At least, a specific design of element was proposed to the CEA, integrating adapted solutions for each of the specificities requested: for example, specific lateral comb enabling to maintain the watergap as well as to ensure the precise positioning of plates in the fuel assembly, surface treated stiffeners to facilitate the extraction of plates, design of a made to measure assembling tool and so on.
9 of 79

Figures 11 and 12 show local views of a standard fuel assembly (figure 11) and of the assembly able to be easily dismantled for EOLE (figure 12).
Figure 11 – Sketch of a standard fuel
assembly Figure 12 – Sketch of the fuel assembly able
to be easily dismantled 4. Project schedule
Oct Nov Dec Jan Feb Mar Apr May June July Aug Sept Oct Nov Dec Jan Feb Mar Apr May June July Aug Sept Oct Nov Dec Jan Feb Mar Apr May June
Contract between CEA and CERCA ♦
Preliminary study
CEA / CERCA / AREVA TA meetings for project review ♦ ♦ ♦ ♦ ♦ ♦ ♦
poison plate qualification
Fuel plate qualification
technical specification validation ♦ ♦ ♦
structural parts supplying
poison plate manufacturing
Fuel plate manufacturing
Fuel element manufacturing
1st EVITA fuel element witness inspection ♦
4 EVITA fuel elements witness inspection ♦
7 AMMON fuel elements witness inspection ♦
2009
LTA's manufacturing for JHR fuel qualification program schedule2007 20082006
The project is still running; the first EVITA fuel element has been delivered in due time to BR2 reactor beginning of January 2009, next step is the witness inspection for the last 4 EVITA fuel elements scheduled in March.
This project schedule shows the last phase of JHR fuel qualification program, relative to the fuel plate manufacturing developments; but, previously to this phase, technical and design evaluation developments were successfully carried out, through a close collaboration between: the designer (AREVA-TA), the manufacturer (AREVA-CERCA) and
Lateral comb
Surface treated stiffener
10 of 79

the end user (CEA), to define the final fuel element design. Many meetings were held along the project to constantly keep informed all partners about the project progress.
Many challenges, so as: narrow watergaps, fuel section with 8 size plate roll-swaged, …. were achieved before starting the final step of the program.
5. Conclusion
From the early start up of the project, close collaboration between CEA, AREVA-TA and AREVA-CERCA was carried out to give chance to succeed for the fuel element manufacturing development. Despite of the difficulties inherent to this type of project, technical options were discussed and solutions were validated together, always keeping in mind the final target of the project: to design an efficient and durable fuel for JHR reactor.
11 of 79

CHARACTERIZATION OF THE MICROSTRUCTURE OF IRRADIATED U-MO DISPERSION FUEL WITH A MATRIX THAT CONTAINS SI
D. D. KEISER, JR., A. B. ROBINSON, J. F. JUE, P. MEDVEDEV, AND M. R. FINLAY1
Nuclear Fuels and Materials Division, Idaho National Laboratory P. O. Box 1625, Idaho Falls, Idaho 83403 USA
1Austalian Nuclear Science and Technology Organization
PMB 1, Menai, NSW, 2234, Australia
ABSTRACT
RERTR U-Mo dispersion fuel plates are being developed for application in research reactors throughout the world. Of particular interest is the irradiation performance of U-Mo dispersion fuels with Si added to the Al matrix. Si is added to improve the performance of U-Mo dispersion fuels. Microstructural examinations have been performed on fuel plates with Al-2Si matrix after irradiation to around 50% LEU burnup. Si-rich layers were observed in many areas around the various U-7Mo fuel particles. In one local area of one of the samples, where the Si-rich layer had developed into a layer devoid of Si, relatively large fission gas bubbles were observed in the interaction phase. There may be a connection between the growth of these bubbles and the amount of Si present in the interaction layer. Overall, it was found that having Si-rich layers around the fuel particles after fuel plate fabrication positively impacted the overall performance of the fuel plate. 1. Introduction The United States Reduced Enrichment for Research and Test Reactors (RERTR) Fuel development program is actively developing low enriched uranium (LEU) fuels for the world’s research reactors that are currently fueled by uranium enriched to more than 20% 235U [1]. To assess the performance of U-Mo dispersion fuels with Si-doped matrices, different reactor experiments have been conducted using the Advanced Test Reactor (ATR). For the purpose of conducting scanning electron microscopy examinations on irradiated samples, the RERTR-6 experiment has been of particular interest since the experiment was extracted from ATR over three years ago, and as a result, small samples can be handled in the Electron Microscopy Laboratory (EML). This paper will discuss results of recent microstructural characterization using a scanning electron microscope (SEM) that was performed on a fuel plate with Al-2Si matrix, irradiated as part of the RERTR-6 experiment. Optical metallography (OM) data will also be included. Focus will be given to the partitioning behavior of Si amongst the microstructural phases and how the presence of Si affects the development of interaction layers at the U-7Mo/matrix interface. Comparisons are made to the other irradiation experiments that have been reported for fuel plates with U-7Mo fuel dispersed in Al-2Si matrix. 2. Experimental 2.1 Irradiation Testing The RERTR-6 experiment was the first experiment to test “second generation” U-Mo fuels designed to overcome the fuel performance problems encountered in U-Mo/Al dispersions [2]. In this experiment, the fuel materials were tested to high burn-up under moderate flux and moderate temperature conditions. The fuel plates were positioned edge-on to the core, and as a result had a neutron flux across the widths of the fuel plates.
12 of 79
Previous papers discussed characterization results for other RERTR-6 fuel plates with Si-containing fuel meat matrices [3, 4]. This paper focuses on U-7Mo dispersion fuel plates with Al-2Si matrix. The irradiation conditions for the two characterized fuel plates with Al-2Si matrix are enumerated in Table 1. One plate (R2R020) was characterized using only OM and the other plate (R2R010) was characterized using OM and SEM. R2R010A is a punching taken from the low flux side of the fuel plate that was used for SEM, and R2R010B was taken from the high flux side. Included in this table are the irradiation conditions for other reported experiments that used plate-type, U-7Mo dispersion fuel with Al-2Si matrix.
Table 1. Irradiation conditions for U-7Mo/Al-2Si dispersion fuel plates irradiated as part of RERTR-6, IRIS-3 [5], and IRIS-TUM [5] reactor experiments.
Fuel Plate Label Peak Temp.(˚C)
Ave. Fission Density (1021 f/cm3)
Ave. Fission Rate (1014 f/cm3s)
Peak Heat Flux
(W/cm2) R2R010A 94 2.4 2.0 98 R2R010B 109 4.5 3.8 148 R2R020 104 3.1 2.7 139 IRIS-3 83 3.4 3.0 196
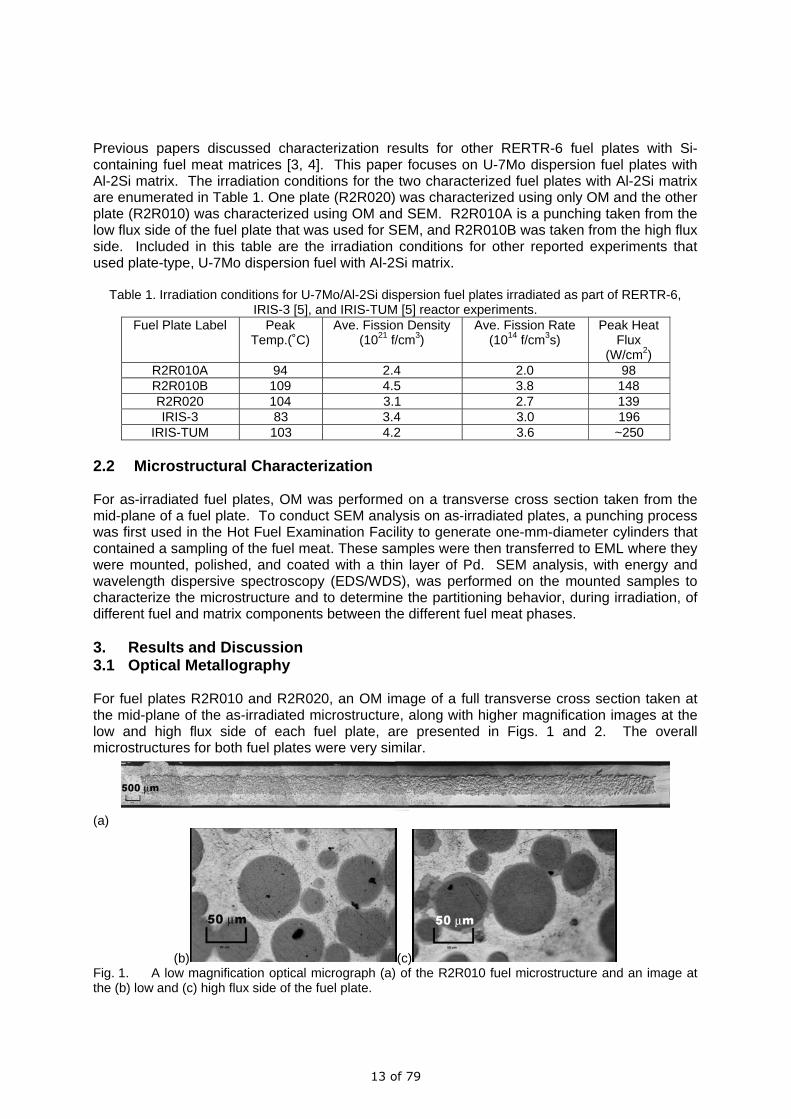
IRIS-TUM 103 4.2 3.6 ~250 2.2 Microstructural Characterization For as-irradiated fuel plates, OM was performed on a transverse cross section taken from the mid-plane of a fuel plate. To conduct SEM analysis on as-irradiated plates, a punching process was first used in the Hot Fuel Examination Facility to generate one-mm-diameter cylinders that contained a sampling of the fuel meat. These samples were then transferred to EML where they were mounted, polished, and coated with a thin layer of Pd. SEM analysis, with energy and wavelength dispersive spectroscopy (EDS/WDS), was performed on the mounted samples to characterize the microstructure and to determine the partitioning behavior, during irradiation, of different fuel and matrix components between the different fuel meat phases. 3. Results and Discussion 3.1 Optical Metallography For fuel plates R2R010 and R2R020, an OM image of a full transverse cross section taken at the mid-plane of the as-irradiated microstructure, along with higher magnification images at the low and high flux side of each fuel plate, are presented in Figs. 1 and 2. The overall microstructures for both fuel plates were very similar.
(a)
(b) (c) Fig. 1. A low magnification optical micrograph (a) of the R2R010 fuel microstructure and an image at the (b) low and (c) high flux side of the fuel plate.
13 of 79

(a)
(b) (c) Fig. 2. A low magnification optical micrograph (a) of the R2R020 fuel microstructure and an image at the (b) low and (c) high flux side of the fuel plate. 3.2 Scanning Electron Microscopy SEM analysis was performed on punching samples generated from fuel plate R2R010. Images of the microstructure observed for a sample produced at the low flux side of the fuel plate are presented in Fig. 3. Like was the case for the OM images (see Fig. 1), the nominal thickness of the interaction layer was observed to be around 1-2 μm. X-ray mapping was employed to determine the partitioning behavior of fuel and matrix components (see Fig. 4). Si was enriched in the interaction layer, except in some discrete locations where “nodules” were present in the interaction layer (see Fig. 4e). A higher magnification image of a “nodule” is presented in Fig. 3d. For the gaseous fission products, Kr was observed in the fuel and interaction layer phases, and Xe and Cs could also be found in the fuel meat matrix. Some of the highest Xe concentrations were found at the interface between two contacting U-7Mo particles. The solid fission products Nd and Ru were primarily found in the fuel and interaction layer phases, and small concentrations seemed to be present in the fuel meat matrix.
(a) (b)
(c) (d Fig. 3. Backscattered electron images of the low flux side of the R2R010 fuel microstructure. The image in (d) shows a Si-deficient nodule that developed in the interaction layer.
14 of 79

(a) (b) (c)
(d) (e) (f)
(g) (h) (i)
(j) Fig. 4. Secondary electron image (a) and X-ray maps for (b) U, (c) Mo, (d) Al, (e) Si, (f) Xe, (g) Kr, (h) Cs, (i) Nd, and (j) Ru. The arrows in (e) indicate Si-deficient “nodules” that were present in the interaction layer. For the punching from the high flux side of the fuel plate, relatively narrow Si-rich interaction layers were also observed around the U-7Mo fuel particles. SEM micrographs of the microstructure are presented in Fig. 5. Like was the case for the sample from the low flux side of the plate, some local regions in the interaction layer were observed to be relatively thicker. Compositional analysis indicated that these regions contained negligible Si. Detailed analysis of one of these regions (area 1 in Fig. 5a) revealed the presence of fission gas bubbles in the interaction layer. This microstructural feature has never been observed before in any other RERTR-6 samples characterized to date. Composition analysis along a line shown in Fig. 6a indicated that where Si concentrations remained relatively high in the interaction layer no fission gas bubbles could be resolved up to high magnifications. On the other hand, where the Si concentration was significantly lower, easily resolvable fission gas bubbles could be observed. It was only in this very localized region of the sample that fission gas bubbles could be resolved in the interaction layer.
15 of 79

(a) (b) Fig. 5. Backscattered electron images of the high flux side of the R2R010 fuel microstructure. Location 1 in (a) is where fission gas bubbles were observed in the interaction layer, and location 2 is near an area of a fractured fuel particle where fission gas bubbles could be resolved in the U-7Mo.
(a) (b) Fig. 6. Backscattered electron images (a,b) of an area of the R2R010 fuel microstructure on the high flux side of the fuel plate. The line in (a) indicates the location where a linescan compositional analysis was taken, and (b) shows how the right side of the line, which passed through a Si-depleted region of interaction layer, coincided with an area where relatively large fission gas bubbles could be observed. Characterization of as-fabricated dispersion fuel plates before insertion into ATR has shown that Si-rich layers are present around the fuel particles after fabrication of dispersion fuel plates with Al-2Si matrix [3], and based on the results reported here for the as-irradiated samples with Al-2Si matrix, these initial layers do not exhibit an overall significant increase in thickness and do not develop significantly large areas of gross porosity. This agrees well with the SEM characterization that has been performed on other fuel plates with matrices that contain significant Si (0.88 wt% or greater) that were irradiated as part of the RERTR-6 experiment [3, 4]. This type of interaction layer behavior during irradiation is a significant improvement compared to the RERTR fuel plates that were tested in ATR with just Al as the matrix, which developed wide interaction layers and large pores at the interaction layer/Al interface [6]. For another plate-type, dispersion fuel with Al-2Si matrix (IRIS-3) that was irradiated in the OSIRIS reactor, an irradiation behavior that differed from RERTR-6 fuel plates was observed [7]. Characterization of the IRIS-3 fuel plate indicated that the fuel/matrix interaction layers around the U-7Mo particles were similar to those that have been observed for U-7Mo dispersion plates with just Al, in that most of the interaction layers that formed did not contain significant Si. However, it was observed that in regions near Si-rich matrix particles an enrichment of Si was present in the interaction layer. Similarly, a pin-type fuel element with Al-2Si matrix (KOMO-3) that was irradiated developed interaction layers without significant Si [8]. However, the characterization results for both these fuel plates seemed to indicate that there was a positive effect of having Si present in the matrix in that it reduced the amount of fuel/matrix interaction.
16 of 79

The results of a third reported irradiation test, which used ground U-7Mo powders and Al-2Si matrix (IRIS-TUM), also indicated a reduction in interaction layer growth because of Si in the matrix [9]. One potentially significant difference between the RERTR-6, Al-2Si-matrix plates and those irradiated in IRSIS-3 and KOMO-3 is that Si-rich interaction layers were present in the RETR-6 plates before irradiation, whereas the KOMO-3 and IRIS-3 plates did not have these layers, since they were processed at lower temperatures. This suggests that having Si-rich fuel/matrix interaction layers present after fabrication may play a significant role in improving the performance of U-Mo dispersion fuel plates, because these layers do not change much in thickness and do exhibit stable behavior under the conditions of the RERTR-6 experiment. The fact that some resolvable porosity could be found in the interaction layer of the sample from the high flux side of R2R010 suggests that there is a link between the Si concentration of the interaction layer and the stability of the very fine fission gas bubbles that typically cannot be resolved using an SEM. When the local Si concentration in the interaction layer is below a certain threshold under certain reactor conditions, the fission gases present in very fine bubbles may begin to agglomerate to form larger bubbles, which in turn may become mobile resulting in movement to the interaction layer/Al-Si alloy matrix interface. In [10], it was suggested that 5 at% Si is required in the interaction layer to retain stable behavior. Future characterization of irradiated samples will continue investigating how the Si concentration in the interaction layer affects the behavior of fission gas bubbles. 4. Conclusions 1. Si-enriched fuel/matrix interaction layers produced during fabrication of U-Mo dispersion fuels with Al-2Si matrix exhibit overall stable behavior when fuel plates are irradiated up to the conditions of the RERTR-6 experiment (moderate power and burnup). This means that the layers remain relatively thin and do not develop areas of significantly large porosity. 2. The local Si content within the fuel/matrix interaction layers may affect the behavior of the fission gases that are dissolved. Depending on the reactor conditions of an experiment, there may be a minimum Si content required to keep the behavior of dissolved fission gases stable. If concentrations fall below a certain level, then relatively large fission gas bubbles can grow, and the fission gases could become more mobile. Acknowledgments This work was supported by the U.S. Department of Energy, Office of Nuclear Materials Threat Reduction (NA-212), National Nuclear Security Administration, under DOE-NE Idaho Operations Office Contract DE-AC07-05ID14517. Personnel in the Hot Fuel Examination Facility are recognized for their contributions in destructively examining fuel plates. References [1]. D. Wachs, et al., Proc. of GLOBAL 2007, Boise, ID, September 9-13, 2007. [2]. C. R. Clark et al., RRFM 2004, Munich, Germany, March, 2004. [3]. D. D. Keiser, Jr. et al., RERTR 2008, Washington, D. C., October, 2008. [4]. D. D. Keiser, Jr. et al., RRFM 2008, Hamburg, Germany, 2008. [5]. S. Dubois, et al., RRFM 2007, Lyon, France, March, 2007 [6]. G. L. Hofman et al., RERTR 2003, Chicago, IL, October, 2003 [7]. A. Leenaers et al., RRFM 2008, Hamburg, Germany, March, 2008. [8]. J. M. Park et al., RRFM 2008, Hamburg, Germany, 2008. [9]. M. Ripert et al. RRFM 2008, Hamburg, Germany, March, 2008. [10] G. L. Hofman et al., RRFM 2007, Lyon, France, March, 2007.
17 of 79

EXPERIMENTAL SIMULATION OF AL FUEL PLATE OXIDATION
A. BURKART, R. HADDAD, C. LAFONT Departamento Materiales, Comisión Nacional de Energía Atómica Av. General Paz 1499, B650KNA San Martín (Bs. As.) Argentina
R. AMORUSO,
Departamento Combustibles, Comisión Nacional de Energía Atómica Av. General Paz 1499, B650KNA San Martín (Bs. As.) Argentina
ABSTRACT
MTR fuel aluminium plates undergo oxidation in heat transfer conditions during operation in Research or Production Reactors. The aluminium oxide is a poor thermal conductor; hence, the fuel plate’s temperature tends to increase with time, as the oxide grows, up to a point in which it may become dangerous for the fuel integrity. In order to evaluate this effect, an experimental facility which simulates heat transfer in a fuel channel was used to measure the amount of oxidation in different operating conditions. A parabolic growth as a function of time has been verified, which can be adequately predicted by available published correlations. Oxidation in a slightly acid environment (pH=5.2) is one order of magnitude lower than in near neutral water. Pre-filming of the aluminium plates does not seem to influence the ulterior oxidation behaviour.
1. Introduction Aluminium clad MTR fuel undergoes oxidation during operation in Research Reactors. Aluminium oxides are poor heat conductors; hence, heat transfer between fuel and coolant could be disturbed by the growth of a thick layer. If this should happen, fuel plate temperature will increase, even at constant coolant temperature, due to the temperature drop across the oxide layer, thus accelerating the oxidation process, generating a vicious circle. Aluminium and its alloys may suffer corrosion in water at temperatures above 150-200 °C (range which could conceivable be attained in the fuel plate if the oxide film exceeds certain thickness), with penetrating intergranular attack, blistering and oxide exfoliation. As oxide growth is a function of plate temperature, water condition, coolant flow and other reactor parameters, the heat transfer situation will vary from reactor to reactor, depending on thermal power and other specific characteristics. A reliable performance prediction may then be relevant to fuel design. Several empirical regressions are available, which are just valid for the conditions of the experiments used to develop them; it can be mentioned, among them, those by Griess [1], Kritz [2] and the so called “Correlation II” [3]. More recently, a predictive model was published [4] taking into account various different variables, which is so far the most comprehensive attempt to describe the influence of all relevant parameters. However, as can be seen in Figure 1, slight variations in pH (from 7 to 5) give place to a two orders of magnitude change in the predicted oxide thickness. An experimental approach is presented, which intends to supply a way of directly measure oxide growth in different conditions, in order to foresee fuel performance in a variety of situations. These may include variations in inlet and outlet coolant temperature, heat transfer, coolant flow and/or speed, coolant chemistry conditions, plate metallurgical conditions, etc 2. Experimental method
18 of 79

In order to reproduce the heat transfer conditions which are present in the interface between fuel plates and flowing coolant, a double loop device was built, which simulates a fuel channel segment. The heart of the system is composed by two parallel aluminium alloy plates separated by a channel distance (around 2.5 mm). A water flow passes between them, which takes out the heat supplied by a hot fluid which circulates on the two external sides of the channel, as depicted in the schematic diagram displayed in Figure 2.
Figure 1: Difference in predicted oxide thickness by various models, for the same heat transfer conditions: heat flux 200W/cm2, inlet temperature 50 ºC, temperature increment 5.3
ºC in 8 cm heat transfer length, coolant mass flow 2.7 Kg/sec.
Figure 2: Schematic Diagram of the test device. TI Inlet Temperature, TO Outlet Temperature,
TP Plate Temperature
A detailed description of the experimental system can be found in a previous publication [5]. An on-line purification system permits to keep the water quality in nuclear grade standards (conductivity below 1µS/cm, no detectable amounts of dissolved ions, etc.). However, for the tests to be carried at a controlled pH, the on-line purification was cancelled and a weekly
TI (°)
TO (°C)Coolant Flow (m/s)
Aluminium PlatesTP (°C)
HOT FLUID
19 of 79

batch water renewal was performed instead. The addition of controlled amounts of nitric acid to the coolant torrent permitted to regulate the acidity with a precision of 0.2 pH units. Test plates were manufactured with aluminium alloy 6061. Some tests were made with the plates in the normal factory outlet condition (the rolled plates are pickled in a hot sodium hydroxide solution, rinsed and dried). In other cases, they were oxidised by immersion in distilled water at 80 ºC for 33 hours, to test the ability of such a pre-filming to inhibit ulterior corrosion. This treatment is known to produce a layer resistant to corrosion at room temperature in pure water [6]. Oxide thickness determinations were performed using an Eddy Current Probe (Fischer Dualscope with probe ETD 3.3). The instrument resolution is ±1µm. Figure 3 shows a scheme of the oxidised plate; the whole of the channel length (31 cm) was surveyed, although the heat was transferred only in the central portion (8 cm).
Figure 3: Coolant channel scheme. Two oxide thickness determinations were made in three places of each surveyed position. In the transfer zone the positions were established at 1 cm
intervals and in the rest at 2 cm. Tests of various durations, up to 36 days, were performed in the same nominal conditions: heat flux 200W/cm2, inlet temperature 50 ºC and temperature increment of 5.3 ºC in an 8 cm heat transfer length. Additionally, three tests of one week of duration were carried out in identical physical conditions: thermal fluid temperature 200 ºC, coolant flow 1.95 m3/h, coolant speed 7.3 m/sec, inlet temperature 60 ºC and outlet temperature 64.7 ºC. These were made to compare the oxidation in water of free pH, water at pH=5.2 and in water with free pH on pre-oxidised plates. In the experiments performed at free pH, coolant water conductivity was continuously maintained below 1 µS/cm (normally between 0.2 and 0.4 µS/cm). When the coolant was kept at pH=5, instead, the conductivity reached values of up to 2.5 µS/cm at the end of the test (as pointed out previously, the water was not subjected to purification in this case). 3. Results The time dependence of oxide thickness seems to fit a parabolic curve, which could approximately be adjusted by one of the published correlations [4], as can be seen in Figure 4, when adequate values for the relevant parameters are applied (pH=7, heat flux of 2 MW/m2, coolant speed 8 m/sec), which nominally coincide with those used. The time covered by the experiments (less than 1000 hours) corresponds to the very initial part of the calculated regression (see Figure 1) and a perfect fit should not be expected.
0 31
ENTRADA SALIDA
ZONA DE TRANSFERENCIA
0 31
ENTRADA SALIDA
ZONA DE TRANSFERENCIAHEAT TRANSFER
ZONE
INLET OUTLET
20 of 79

OXIDE THICKNESS
0
5
10
15
20
25
0 200 400 600 800 1000Time (hours)
Thic
knes
s (µ
m)
Kim et al pH=7Experimental
Figure 4: Time evolution of measured oxide thickness, compared with predicted trend [4] for the similar nominal conditions. Values correspond to the plate centre (maximum thickness).
The comparison of film profile histograms corresponding to oxide growth in a test conducted in free pH water and other carried out in water at pH=5.2 clearly demonstrate a strong pH effect on oxidation. Film thickness is roughly reduced by a factor of 4 to 5 in the acid environment, but this number could be higher, taking into account that the smaller measured thickness is in the order of instrument resolution.
Figure 5: Distribution of oxide thickness along the length of the coolant channel (Inlet at 0 cm and outlet at 31 cm). Left: free pH test. Right: water pH=5.2
Whereas the surfaces tested in uncontrolled pH bears clear signs of oxidation (the heat transfer zones covered by a grey layer), those produced in acid water are oxide-free, but they show a slightly brownish colouration. This may be due to the deposition of iron coming from the coolant circuit. Pre filming of the aluminium plates does not seem to have any beneficial effect with respect to oxidation. On the contrary, corrosion appears to be stronger than on polished surfaces (Figure 6) although part of the difference in thickness could be attributed to the initial layer.
21 of 79

Figure 6: Distribution of oxide thickness along the length of the coolant channel (Inlet at 0 cm and outlet at 31 cm) for the test with pre-filmed plates.
4. Discussion and conclusions The development of the oxide in heat transfer conditions can be approximately adjusted by one of the published models [4] with values of experimental parameters similar to those nominally used in the tests. The correlation between both experimental and theoretical curves should be checked with tests of longer duration. The strong pH effect observed in 120 hours tests could be related to the stability of formation of aluminium oxides, which is known to be maximum at pH=5.07 [7]. A layer grown in that particular condition may be more compact, thereby more protective. The tested pre-oxidation treatment does not provide any corrosion protection in the conditions of the experiments. Te pre-filming temperature was chosen above 70 ºC, which is the known limit for the bayerite-bohemite transition; bohemite is said to provide a better protection. It is possible that a higher formation temperature may be needed for the layer to show this quality. 5. References [1] J. C. Griess et al., "Effect of heat flux on the corrosion of Aluminium by water. Part IV", ORNL-3541 (1964). [2] R. S. Ondrejcin, "Evaluation of Mark 22 cladding", Savannah River Laboratory DPST-83-324 (1983). [3] S. J. Pawel et al., "Influence of coolant pH on corrosion of 6061 Aluminium under reactor heat transfer conditions", report ORNL/TM-13083 (1995). [4] Yeon Soo Kim et al, “Prediction Model for Oxide Thickness on Aluminium Alloy Cladding During Irradiation.”, 25th Int. Meeting on RERTR, Chicago (Illinois), October 5-10 (2003). [5] R. Haddad et al, “Study of Al Fuel Plate Oxidation”, Proceedings of RRFM 2008, Hamburg March 2-5 2008. [6] “Corrosion of Research Reactor Aluminium Clad Spent Fuel in Water, IAEA-TRS-418 (2003). [7] M. Pourbaix, Atlas of Electrochemical Equilibria in Aqueous Solutions, Pergamon Press, Oxford (1976).
22 of 79
1
Heavy ion irradiation of UMo7/Al fuel: methodological approach
E. Welcomme, H. Palancher, C. Sabathier, Ph. Martin, J. Allenou, C. Valot, F. Charollais, M.C. Anselmet
CEA/Cadarache, DEN/DEC, 13108 Saint Paul Lez Durance - France
R. Jungwirth, W. Petry
FRM II Technische Universität München, Lichtenbergstr. 1, 85747 Garching - Germany
L. Beck
Maier Leibnitz Laboratorium, LMU/TUM, Am Coulombwall 6. 85748 Garching - Germany
C. Jarousse AREVA-CERCA♦, Les Berauds, B.P. 1114, 26104 Romans Cedex - France
R. Tucoulou
ESRF, 6 rue Jules Horowitz, 38042 Grenoble - France
P. Lemoine
CEA/Saclay, DEN/DSOE, 91191 Gif sur Yvette - France
ABSTRACT
Heavy ion irradiation with an 80 MeV 127I beam is used as out-of-pile technique in order to simulate the in-pile growth of the UMo/Al interaction layer. However, irradiation conditions used in 2005-2006 do not fully allow reproducing the characteristics of the in-pile interaction layer (IL). In this paper, a study focussing on the influence of the different irradiation parameters on the thickness, nature and composition of the interaction layer, is presented. The results are in excellent agreement with SRIM calculations. The interest for heavy ion irradiation is supported by the evidence for a phase transition γ-UMo(a) + α-U γ-UMo(b) as observed in pile (in this reaction, γ-UMo(a) has a higher Mo content than γ-UMo (b)).
1. Introduction
During in-pile irradiation, U-Mo high density nuclear fuel is impacted by the formation of a large interaction layer (IL) at the periphery of the U-Mo particles, embedded in the Al matrix. This problem reduces the irradiation performance of the fuel element due to the development of large porosities leading to pillowing and sometimes to breakaway swelling. Thus to allow further use of UMo particular fuel, technological solutions to stabilize and minimize the IL have to be found. Furthermore, this objective must be supported by an effort to improve our understanding of the ILs nature and its kinetic of formation. To simulate the in-pile growth of an IL in an UMo7/Al fuel, out-of-pile techniques have been envisaged. Among them heavy ion irradiations using a typical fission fragment (Iodine energy of 80 MeV) have demonstrated their efficiency to study the irradiation enhanced diffusion in UMo/Al fuel [1, 2, 3 and 4]. However many experimental aspects regarding this technique have to be analysed in detail in order to rigorously interpret the results and to make this tool more robust and more representative of the in-pile irradiation phenomena. The main objective is the routine use of ion irradiation to discriminate technological solutions envisaged for limiting the growth of the UMo/Al IL.
♦ AREVA-CERCA, a subsidiary of AREVA NP, an AREVA and SIEMENS company
23 of 79
2
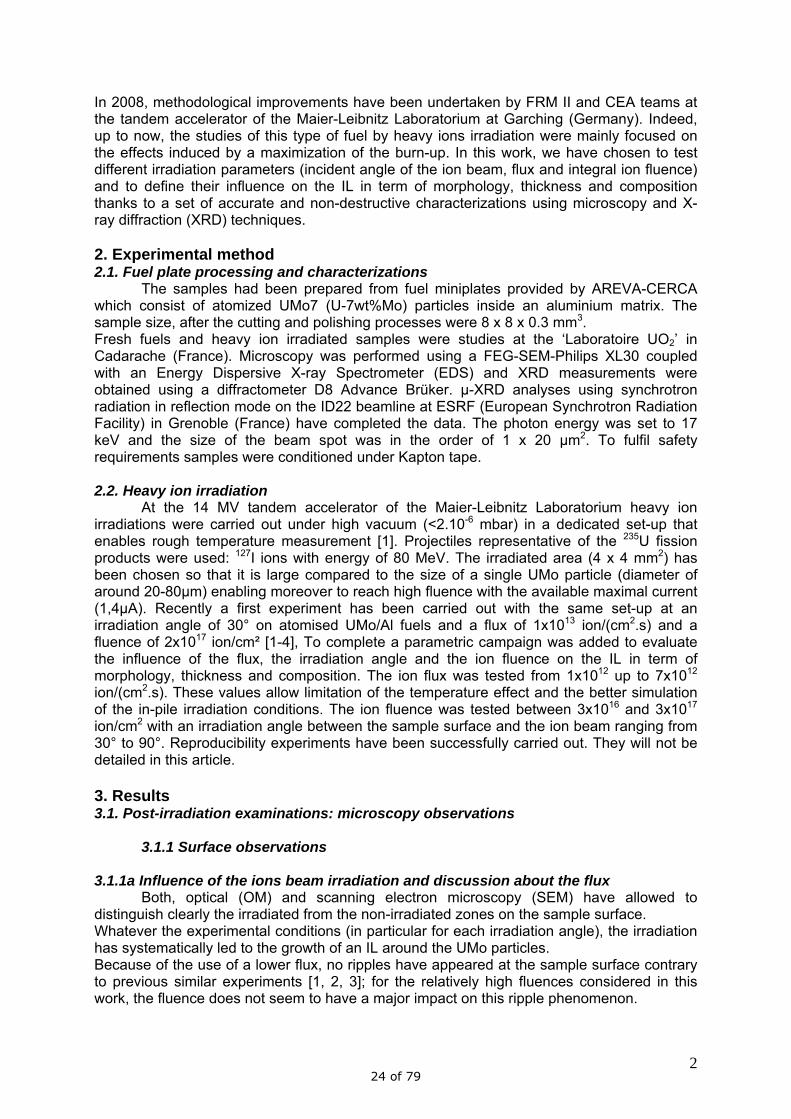
In 2008, methodological improvements have been undertaken by FRM II and CEA teams at the tandem accelerator of the Maier-Leibnitz Laboratorium at Garching (Germany). Indeed, up to now, the studies of this type of fuel by heavy ions irradiation were mainly focused on the effects induced by a maximization of the burn-up. In this work, we have chosen to test different irradiation parameters (incident angle of the ion beam, flux and integral ion fluence) and to define their influence on the IL in term of morphology, thickness and composition thanks to a set of accurate and non-destructive characterizations using microscopy and X-ray diffraction (XRD) techniques. 2. Experimental method 2.1. Fuel plate processing and characterizations The samples had been prepared from fuel miniplates provided by AREVA-CERCA which consist of atomized UMo7 (U-7wt%Mo) particles inside an aluminium matrix. The sample size, after the cutting and polishing processes were 8 x 8 x 0.3 mm3. Fresh fuels and heavy ion irradiated samples were studies at the ‘Laboratoire UO2’ in Cadarache (France). Microscopy was performed using a FEG-SEM-Philips XL30 coupled with an Energy Dispersive X-ray Spectrometer (EDS) and XRD measurements were obtained using a diffractometer D8 Advance Brüker. µ-XRD analyses using synchrotron radiation in reflection mode on the ID22 beamline at ESRF (European Synchrotron Radiation Facility) in Grenoble (France) have completed the data. The photon energy was set to 17 keV and the size of the beam spot was in the order of 1 x 20 µm2. To fulfil safety requirements samples were conditioned under Kapton tape. 2.2. Heavy ion irradiation At the 14 MV tandem accelerator of the Maier-Leibnitz Laboratorium heavy ion irradiations were carried out under high vacuum (<2.10-6 mbar) in a dedicated set-up that enables rough temperature measurement [1]. Projectiles representative of the 235U fission products were used: 127I ions with energy of 80 MeV. The irradiated area (4 x 4 mm2) has been chosen so that it is large compared to the size of a single UMo particle (diameter of around 20-80µm) enabling moreover to reach high fluence with the available maximal current (1,4µA). Recently a first experiment has been carried out with the same set-up at an irradiation angle of 30° on atomised UMo/Al fuels and a flux of 1x10¹³ ion/(cm2.s) and a fluence of 2x10¹⁷ ion/cm² [1-4], To complete a parametric campaign was added to evaluate the influence of the flux, the irradiation angle and the ion fluence on the IL in term of morphology, thickness and composition. The ion flux was tested from 1x10¹² up to 7x10¹²
ion/(cm2.s). These values allow limitation of the temperature effect and the better simulation of the in-pile irradiation conditions. The ion fluence was tested between 3x10¹⁶ and 3x10¹⁷ ion/cm2 with an irradiation angle between the sample surface and the ion beam ranging from 30° to 90°. Reproducibility experiments have been successfully carried out. They will not be detailed in this article. 3. Results 3.1. Post-irradiation examinations: microscopy observations 3.1.1 Surface observations 3.1.1a Influence of the ions beam irradiation and discussion about the flux Both, optical (OM) and scanning electron microscopy (SEM) have allowed to distinguish clearly the irradiated from the non-irradiated zones on the sample surface. Whatever the experimental conditions (in particular for each irradiation angle), the irradiation has systematically led to the growth of an IL around the UMo particles. Because of the use of a lower flux, no ripples have appeared at the sample surface contrary to previous similar experiments [1, 2, 3]; for the relatively high fluences considered in this work, the fluence does not seem to have a major impact on this ripple phenomenon.
24 of 79

3
For the lowest flux values tested during this campaign, the global organisation of the sample is preserved after irradiation (see figure 1). For the highest fluxes, the interaction compounds are not strictly limited to the periphery of the UMo particles but also cover the surface. In this last case, post irradiation experiments and results are difficult to interpret. Thus, moderate flux has been preferred for the major part of these irradiation experiments.
3.1.1b Influence of the irradiation angle The morphologies of the IL at the surface are strongly affected by the irradiation angle (figure 2). With normal incidence, the IL is homogeneously organized around the particle; however in the others cases and especially for the lowest incident angle (30°), the interaction morphology has clearly changed.
a b Figure 2: Influence of the ion beam angle on the morphology of the interaction layer; SEM observations in BSE mode of a fuel plate irradiated (a) at 90°and (b) at 30°
3.1.1c Influence of the ion fluence on the interaction layer thickness During this parametric irradiation campaign, it has been possible to confirm that the ion fluence has a direct influence on the IL thickness. In fact, if we compare two samples irradiated under the same conditions except for the ion fluence (figure 3), we can note an unambiguous evolution of the IL thickness which ranges from 3 µm for 3x10¹⁶ ion/cm2 to around 15 µm for 3x10¹⁷ ion/cm2. It does not seem to depend on the size of the particles; smallest particles may fully be consumed (figure 3b).
Figure 1: Influence of the heavy ion irradiation. Microscopy images have been taken on the same zone before (a: OM observation of the sample surface) and after irradiation (b: OM observation, c: SEM observation in BSE mode of the irradiated sample surface). The darker parts on OM observations and dark grey coloured zones on SEM observations correspond to the interaction compounds.
25 of 79

4
a
3 µm3 µm
b
15 µm15 µm
Figure 3: Influence of the ion fluence on the interaction layer thickness. Comparison of two plates irradiated at 30° with an ion flux fixed at about 4x10¹¹ ion/(cm2.s) and different ion fluences. a: SEM observation of a fuel plate irradiated at 3.1016 ion/cm2); b: SEM observation of a fuel plate irradiated at 3x10¹⁷ ion/cm2. 3.1.1d Conclusion It has been shown that irradiation conditions control the morphology and the thickness of the IL, implying the use of strictly the same conditions (flux and irradiation angle) for a fuel discrimination study [4]. However surface examinations are not adapted for analyzing the samples irradiated with the highest flux; strong sample modifications prevent the measurement of the interaction layer size. 3.1.2 Understanding of the “in depth” behaviour 3.1.2a Influence of the ions beam irradiation In case of 90° incidence angle the penetration depth of 127I ions with 80 MeV energy reaches 5 µm inside γ-UMo and 13 µm in Al. Calculations of the ions penetration length using the SRIM2003 code [5] show that this distance evolves with the beam incidence angle as shown the table 1. The surface observations allow having an overview of the irradiation effect but they don’t allow understanding the behaviour in depth. Consequently, they do not describe a significant part of the modification induced by irradiation in this material. In-depth analyses are thus required. Indeed, thanks to calculations one would expect that each UMo/Al interface located at a depth ranging from the surface down to 13 µm (in the normal incidence case) would be decorated by an IL. To confirm this hypothesis transversal cross sections of the UMo/Al plates have been prepared in the irradiated zone and they have been observed by SEM [2]. For samples irradiated using a beam normal to the surface, we can observe the formation of an IL around a UMo particle down to 13 µm (figure 4a). When UMo particles are present at the sample surface and are thinner than 5 µm, an interaction layer has grown below the particles (figure 4b). This IL has also been identified above UMo particles that are buried in the Al matrix (sufficiently close to the surface (figure 4b)). It is important to note that deeper zones are not affected by interaction phenomena. The results are totally in agreement with the SRIM calculations reported on the Table 1.
127I mean penetration depth for different irradiation angle (µm) Material 90° 60° 45° 30° UMo 5,0 4,6 3,5 2,5 Al 12,7 11,0 9,0 6,4 Table 1 : Penetration length of the ions simulated using the SRIM2003 code in pure UMo and Al materials.
26 of 79

5
127I beam
Depth
0
5
10
15
20
20 µm
127I beam
Depth
0
5
10
15
20
20 µm
127I beam
Depth
0
5
10
15
20
20 µm
a
127I beam
Depth
0
5
10
15
20
25 20µm
127I beam
Depth
0
5
10
15
20
25 20µm
b
Figure 4: SEM observations of transversal cross sections prepared in irradiated UMo7/Al fuel plates. (Irradiation angle equals to 90°). Red dashed lines indicate the deepest part of the IL. 3.1.2b Influence of the irradiation angle SRIM calculations enable to estimate the influence of the irradiation angle on the 127I penetration depth (Table 1): If the irradiation angle differs from 90°, the penetration depth becomes smaller. An asymmetry of the IL profile has been detected inside samples irradiated under low angles of 30° and 45° (figure 5). At the left side of the biggest particle, the IL has been formed up to 11µm whereas at the right side only 5 µm have been affected by the phase transformation. It is easily interpreted by the geometry of the particle and by the orientation of the ion beam as the transversal cross section has been cut parallel to the beam orientation.
127I beam127I beam
Figure 5: Influence of the angle between the sample surface and the ion beam during irradiation on the morphology of the IL in depth.
Figure 6: Influence of the ion fluence on the IL in depth. Case of the highest final fluence tested (3x10¹⁷ ion/cm2).
3.1.2c Influence of the ion fluence on the interaction layer In case of the highest ion fluence (3x10¹⁷ ion/cm2), the profile is slightly different to samples irradiated with moderate ion fluence. In fact, we see in the figure 6 a quasi continuous IL from the surface to the first micrometers under the sample surface. 3.1.2d Conclusion The analysis of cross sections appears to be very fruitful. Indeed the measurement of the IL thickness can be performed more accurately since it can be decoupled from surface phenomena. It opens the way to model the IL growth kinetics which is one of the main goals of this out-of-pile program. Moreover the composition in depth of IL may fluctuate since heavy ion energy loss phenomena are different between the near surface (electronic) and the few last hundred nanometres (ballistic) of the heavy ion pathway. Further studies on this last point by EDX are under progress.
27 of 79

6
However the transversal cross section study is destructive and time consuming, since many preparations and observations are needed for having enough statistics. 3.3. Crystallographic evolution of the UMo/Al fuel plate under irradiation 3.3.1 Crystallographic composition of the interaction layer The previous studies [1, 2, 3] using X-ray diffraction analyses have demonstrated that the main component of the IL was the crystalline UAl3 phase. X-ray diffraction analyses have enabled us to characterize globally the U7Mo/Al plate surfaces after irradiation. We note the presence of α-U, γ-UMo, Al, UO2 (pollutions) and UAl3 but not any UxMoyAlz ternary compound. Although the flux and the irradiation temperature have been decreased the IL remains mainly crystalline. Further improvements of the experimental set-up have to be achieved for limiting the irradiation temperature and thus improving the significance of this out-of-pile simulation. 3.3.2 Evolution of the metallic phases under irradiation 3.3.2a Analysis of the irradiated fuel plates The comparison of µ-XRD diagrams obtained in the irradiated area with those obtained in the non-irradiated one has shown clearly the decrease of the α-U weight fraction without significant change for the γ-UMo weight fraction (table 2). Moreover this ion irradiation has led to a slight increase of the γ-UMo cell parameter from 3.425 Å up to 3.431 Å. Further interpretation will be given in the next paragraph. Note that a very limited oxidation has occurred during irradiation as shown by the presence of the UO2 in the irradiated part of the sample (table 2).
Weight fractions (%) U(α) UO2 γ-UMo Al UAl3
U(α)/U(γ) (%)
Non irradiated area 13 3 62 22 - 21 Irradiated area 3 9 62 22 4 5
Table 2: Comparison of the composition of the irradiated and the non irradiated zone of an atomised U7-Mo fuel plate irradiated at the maximum ion fluence. The weight fractions had been deduced from the quantitative analysis of the µ-XRD diagrams and performed thanks Rietveld refinement [8].
3.3.2b Discussion on the γ-UMo stability under irradiation As in atomised fuel plates, the same trend has been observed in ground UMo8/Al dispersion fuel [4]: heavy ion irradiation has induced both the decrease of the α-U weight fraction and the increase of the γ-UMo cell parameter from 3.396 Å for the fresh fuel, up to 3.423 Å for the irradiated sample (table 3). For the fresh fuel, it corresponds to a molybdenum depletion of the γ phase from UMo13 (27%at.) down to UMo9 (19%at.). These results are consistent with the stabilization of the γ-UMo phase: γ-UMo (a) + α-U γ-UMo (b) In this reaction, γ-UMo(a) has a higher Mo content than γ-UMo (b). It has to be stressed that this stabilization of the γ-UMo phase occurs also in-pile. This has been demonstrated many years ago [10, 11] and observed recently thanks to the IRIS 1 experiment [9]. This result appears as a new element of validation of the out-of-pile experiment for simulating the in-pile behaviour. A future experiment is planned on bulk U-Mo alloys to confirm these first results.
28 of 79

7
Weight fractions (%) U(α) UO2 γUMo Al
U(α)/U(γ) (%)
Non irradiated area 20 27 43 10 47 Irradiated area 8 25 41 26 21
Table 3: Comparison of the composition of the irradiated and the non irradiated zone (fresh fuel) of a ground U8-Mo fuel plate irradiated in 2005 (in comparable conditions) [4]. The weight fractions had been deduced from the quantitative analysis of the XRD diagrams, performed thanks Rietveld refinement [8].
4. Conclusions After the demonstration experiments performed in 2005 and 2006, heavy ion irradiation on UMo needed further methodological studies. They aimed at better controlling of the experimental conditions and improving the quality of the subsequent PIE. The results of this collaboration between CEA and FRM II demonstrate the robustness of simulating in-pile irradiation behaviour by out-of-pile ion irradiation. Furthermore progresses in the PIE through the analysis of transversal cross sections have been obtained. For completing these analyses (mainly SEM), a depth resolved crystallographic method (XRD tomography [13]) will have to be used. Moreover it has been shown that under these heavy irradiation conditions the γ-UMo cubic phase is stabilized as is observed under in-pile irradiation. This is an additional argument in favour of heavy irradiation. In 2009 further technical efforts to improve the temperature control will be performed to promote the growth of amorphous phases in the IL as observed in in-pile experiments. The fabrication of a new cooled sample holder is in progress. Taking advantage of these improved experimental conditions the next step will consist in the irradiation of technological solutions. REFERENCES [1] N. Wieschalla, A. Bergmaier, F. Böni, K. Böning, G Dollinger, R. Grossman, W. Petry, A. Röhrmoser, J. Schneider, J. Nucl. Mater 357 (2006) 191 [2] H. Palancher, N. Wieschalla et al., J. Nucl. Mater, (2009), in press [3] R. Jungwirth, W. Petry, W. Schmid, L. Beck, in: Proceedings of the 12h International Meeting on Research Reactor Fuel Management (RRFM), Hambourg, Germany, 2008, p371 [4] H. Palancher, P. Martin, C. Sabathier, S. Dubois, C. Valot, N. Wieschalla, A. Röhrmoser, W. Petry, C. Jarousse, M. Grasse, R. Tucoulou, in: Proceedings of the 10th International Meeting on research Reactor Fuel Management (RRFM), Sofia, Bulgaria, 2006, p99 [5] J. F. Ziegler, J. P. Biersack, SRIM – the Stopping and Range of Ions in Matter, Srim-2003, Computer Code, 2003 [6] K. Colon, D. Sears, in: Proceedings of the 10th International Meeting on Research Fuel Management (RRFM), Sofia, Bulgaria, 2006, p104. and K. Colon, D. Sears, in: Proceedings of the 11th International Meetings on Research Reactor Fuel Management (RRFM), Lyon, France, 2007, p140 [7] S. Van den Berghe, W. Van Renterghem, A. Leenaers, J. Nucl. Mater. 375 (2008) 340 [8] J. Rodriguez- Carjaval, FullProf, version 3.40, LLB, CEA/Saclay, France, 1990, http://www.llb.cea.fr/fullweb/poudres.htm [9] CEA internal report [10] M. L. Bleiberg, J. Nucl. Mater 2 (1959) 182 [11] S. T. Konobeevskii, N. F. Pravdiuk, K. P. Dubrovin, B. M. Levitskii, L. D. Panteleev and V. M. Golianov, J. Atomic Energy 1958 4- 1 p33-45 [12] M.K. Meyer, G.L. Hofman, S.L. Hayes, C.R. Clark, T.C. Wiencek, J.L. Snelgrove, R.V. Strain, K.-H. Kim, Journal of Nuclear Materials 304 (2002) 221–236 [13] H. Palancher, E. Welcomme, P.Martin, F. Mazaudier, S. Dubois, C. Valot, R. Tucoulou, P. Lemoine, in: Proceedings of the 30th International Meeting on Reduced Enrichment for Research and Test Reactors, Washington, United States, 2008
29 of 79
IAEA Publication on Good Practices for Qualification of High Density LEU Research Reactor Fuels*
J.L. Snelgrove
Nuclear Engineering Division, Argonne National Laboratory (Retired) 9700 S. Cass Avenue, Argonne, Illinois 60439 – USA
Abstract
The International Atomic Energy Agency, through a consultancy, has prepared a document describing good practices for the qualification of LEU research reactor fuel. The rationale for the preparation of the document and the document’s organization and content are discussed. Publication is anticipated during the first half of 2009.
1. Introduction
Increasingly critical non-proliferation concerns resulting from the use of high-enriched uranium (HEU) fuels in training, research, test, and isotope-production reactors† have resulted in a number of national and international fuel development and qualification programmes aimed at allowing these reactors to fully achieve their missions while using low-enriched uranium (LEU) fuels‡ and isotope-production targets. One result of international collaboration in fuel development and qualification has been the realization that participants from different countries do not always understand the terminology in the same way; e.g., the term ‘qualification’ is currently interpreted differently in different countries. Therefore, one goal of this document is to suggest a set of commonly accepted definitions for the terminology of fuel development and qualification activities. Also, it is expected that the high level of fuel development and qualification activity around the world will lead to a high level of demand for the qualified fuels for conversion of existing, and use in new, research reactors. Such demand will mean that fuel-supply arrangements must be made with research reactor fuel manufacturers and that regulatory bodies will be faced with the need to judge the suitability of the newly developed fuels in the research reactors that they oversee. The International Atomic Energy Agency (IAEA), recognizing the need for a universal understanding of what is required to qualify a new fuel and what information a potential user of the fuel or a regulatory body should expect the fuel developer to provide, convened a consultancy in Vienna during March 2005 to discuss the issue and recommend further
* Work supported in part by the US Department of Energy, National Nuclear Security Administration, Office of Global Threat Reduction, Office of European and African Threat Reduction (NA-212) under contract DE-AC02-06CH11357.
† Hereinafter in this paper, the term “research reactor” is used to refer to training, research, test, and isotope-production reactors unless explicitly stated otherwise.
‡ Hereinafter in this paper, the term “fuel” will be assumed to refer only to LEU research-reactor fuel unless explicitly stated otherwise.
30 of 79

activities to meet the need. The consultants*, representing a broad cross section of experts active in the international fuel development community, determined that preparation of a document providing a common definition of qualification and outlining good practices in developing and qualifying new research reactor fuels would provide valuable information for fuel developers and qualifiers, fuel manufacturers, fuel users, and regulatory bodies. Subcommittees of the consultants prepared drafts of specific parts of the document, which were subsequently integrated into the final draft document presented to the IAEA for publication. The Good Practices Document† is expected to be published during the first half of 2009, and this paper presents a summary of its contents.
2. Structure and Content of the Good Practices Document 2.1. Guiding principle of fuel development Developing fuel, fuel elements, and fuel assemblies that will operate safely under the specified operating conditions is the ultimate goal of any fuel developer and reactor core designer. In the context of fuel development, operating conditions are normally considered to include both normal operating conditions and at least some incident conditions. The guiding principles are that (a) a heat transfer path from the fuel meat to the cladding must be maintained, (b) the fuel element must maintain its integrity to prevent fission products from entering the coolant, and (c) the fuel meat swelling must remain stable to beyond the highest fission density that could be achieved during irradiation. 2.2. Basic document structure The chapters of the Good Practices Document are listed in Table 1.
Chapter Number Chapter Title 1 Introduction 2 Scope 3 Definitions 4 Information obtained by the fuel developer
for fuel qualification 5 Overview of the fuel development and
qualification process 6 Fuel development and qualification
processes currently being used Appendix I Supplement to Chapter 4 containing
additional detailed information Appendix II Fuel development and process examples
Table 1. Titles of Good Practices Document Chapters
* The initial group of consultants included: M. Salvatore – INVAP, H. Taboada – CNEA (Argentina); D. Sears – AECL (Canada); J.-P. Durand – Areva-CERCA, P. Lemoine – CEA (France); C.K. Kim – KAERI (Republic of Korea); A. Enin – NCCP (Russia); G. Gale – BWXT, M. Meyer – INL, J. Snelgrove – ANL (United States of America); and P. Adelfang-IAEA. In 2006, M. Salvatore resigned; C. Jarousse replaced J.-P. Durand; N. Arkhangelskiy – Rosatom (Russia) was added; M. Nilles replaced G. Gale, and T. Totev – ANL (USA) was added. In 2007, D. Wachs replaced M. Meyer, and D. Keiser – INL was added.
† The full title of the document is ‘Good Practices for Qualification of High Density LEU Research Reactor Fuels.’ Hereinafter it will be referred to as the ‘Good Practices Document.’
31 of 79
2.3. Definitions As indicated in the introduction of this paper, the terminology of fuel development and qualification currently is not used in a consistent manner by all those involved in this work. Therefore, after the Introduction and Scope, precise definitions are given of a number of terms specifically used in fuel development and qualification. For example, the definition of ‘fuel qualification’ agreed upon by the consultants is:
A process carried out by (1) a Fuel Developer to provide sufficient information about a new fuel type or about a new use for an existing fuel for a regulatory body to license that fuel type for use under a set of bounding geometric configurations and irradiation conditions and (2) a Fuel Manufacturer to demonstrate to a regulatory body and a customer that Fuel Elements and Fuel Assemblies of the new fuel type can be reliably and consistently manufactured to the required specifications.
Under this definition, the process clearly involves both the fuel developer and the fuel manufacturer, and both the regulatory body and the customer are involved in determining if a fuel is qualified. 2.4. Information that should be provided by the fuel developer Following Chapter 3’s definitions of critical terms, Chapter 4 provides a discussion of the information that should be provided by the fuel developer and the justification for each item; additional detailed information and discussion are provided in the Appendix. This information is summarized in Table 2.
Information Rationale for Providing this Information Basic Fuel Properties Fuel chemical and phase composition
Provides basis for the acceptable composition and metallurgical condition of the fuel material
Density Needed to determine the volume fractions of fuel meat constituents, and, hence, the fuel meat uranium density
Heat Capacity Needed to calculate the fuel meat temperature in nonequilibrium situations and needed for measurement of fuel meat thermal conductivity by the laser-flash method
Thermal Expansion Coefficient
Needed to determine the thermal expansion coefficient of monolithic fuel meat and, perhaps, of high-density dispersion fuel meat
Method used to produce fuel powder for dispersion fuels
Describes acceptable methods to manufacture fuel powder having the required properties
Particle size distribution (for dispersion fuels)
Influences fuel meat and/or fuel element fabricability and fuel performance
Fuel foil properties (for monolithic fuel)
Influence fuel meat swelling and fuel element areal heat flux and mechanical strength
As-Manufactured Fuel Meat and Fuel Element Properties
Volume and constituent volume fractions
Needed to determine fuel meat swelling
32 of 79

Information Rationale for Providing this Information
Heat capacity Needed to calculate the fuel meat temperature in nonequilibrium situations and needed for measurement of fuel meat thermal conductivity by the laser-flash method
Thermal conductivity Needed to calculate fuel meat temperature during irradiation and during post-irradiation cooling
Thermal expansion coefficient
Needed to evaluate stress resulting from differential thermal expansion during design of fuel element
Exothermic energy release Needed to evaluate fuel temperatures during slow transients or loss-of-coolant situations
Mechanical properties Needed during design of the fuel element and fuel assembly
Fuel Meat and Fuel Element Irradiation Properties
Fission density distribution Needed itself and needed to estimate the time history of fuel fission rates, both of which are required to interpret data from post-irradiation examinations
Fuel element and fuel meat swelling
Needed to determine if fuel is behaving in a stable manner and to estimate the narrowing of coolant channels between fuel elements
Fuel meat and fuel particle microstructures
Needed to accurately characterize the nature of fuel/matrix or fuel/cladding interaction and the nature of fuel material and fuel meat swelling
Mechanical integrity Needed to assure that an adequate heat transfer path and containment of fission products is maintained
Blister threshold temperature
Provides a figure of merit of the fuel element’s ability to withstand high temperatures during incidents
Cladding corrosion behaviour
Needed to assure integrity against the release of fission products and to estimate the thermal history of the fuel element
Fission product release Needed to estimate the radiological source term in accident situations
Fuel Assembly Properties
Hydraulic and mechanical properties
Needed to calculate coolant flow rates and to assure that the fuel assembly can withstand hydraulic and thermal stresses during irradiation
Irradiation behaviour Needed to demonstrate that fuel assemblies will perform under irradiation as expected, based on all of the properties listed above in this table.
Table 2. Information that should be provided by the fuel developer
33 of 79

2.5. Generic approach to fuel development and qualification A generic approach for developing and qualifying of a new fuel is described in the first three sections of Chapter 5. The fourth section describes the variations in the process needed when qualifying an already-qualified fuel type for use under the existing qualification limits (that is, when a potential user of a previously qualified fuel wants to use that fuel in a fuel element or fuel assembly with a different design than the one in which the fuel was originally qualified) and for use outside the existing qualification limits. The approach described is a consistent and integrated approach based on the experience of organizations previously involved in LEU fuel development and on international best practices. The description of the fuel development and qualification process focuses on the tasks to be accomplished and the logical sequence of events. The tasks are not described in detail and the way in which the tasks should be accomplished are not prescribed, because such details depend on the policies, practices, methodologies, and standards of the particular country and organizations involved. It is noted that before its implementation, the fuel qualification programme for a new fuel should be discussed with the Regulatory Body in order to address the requirements for additional data related to fuel behaviour under accident conditions. A phased approach is recommended for LEU fuel development and qualification, with the first phase focused on research work and development/testing activities leading to the selection of a preferred fuel type, the second phase focused on fuel performance qualification to demonstrate that the selected fuel meets specified performance requirements, and the third phase focused on qualification of the fuel manufacturer. The recommended activities are summarized in Table 3.
Activity Results of Activity Phase 1: Research and Development
Fuel conceptual design Rationale for developing a new fuel Choice of design concept for the fuel element and fuel assembly Initial selection of candidate fuel and cladding materials Initial selection of candidate manufacturing technologies
Fuel manufacturing development Fissile material (meat) manufacturing process Cladding manufacturing process Fuel element (plates, rods, tubes) manufacturing process
Out-of-pile testing Basic fuel properties (before and after manufacturing) Compatibility of fuel meat components or fuel and cladding (before and after manufacturing) Integrity of the fuel meat/cladding bond Resistance of the fuel to corrosion in the presence of the coolant (after manufacturing)
Irradiation testing and post-irradiation examination
Determination of required materials properties and performance levels Selection of irradiation devices and facilities Preparation of safety report Performance of in-pile measurements
34 of 79

Activity Results of Activity Performance of PIE Preparation of final PIE report
Decision point Proceed to the final design and qualification phase or continue the development phase
Phase 2: Fuel Performance Qualification
Detailed design Design requirements Design description
Technical specification Technical specification for qualification fuel elements and fuel assembly
Prototype manufacturing assessment and development
Fuel material (powder or monolithic) process Fuel element process Fuel assembly process
Prototypic fuel element and fuel assembly manufacturing
Full-size fuel assemblies for irradiation tests
Qualification test planning Qualification irradiation test plan
Prototype full-size fuel assembly irradiation testing, including post-irradiation examinations
Demonstration that the behaviour of fuel elements and fuel assembly is satisfactory and consistent with results from Phase 1
Fuel qualification report Report demonstrating that the newly developed fuel can be safely used in its intended applications
Fuel licensing Approval by a regulatory body for use of the newly developed fuel in a licensed reactor
Manufacturer qualification Subcomponent manufacturing qualification
Manufacturing of statistically significant quantities of subcomponents to required specifications
Full-size fuel element and assembly manufacturing qualification
Manufacturing of prototype or lead test assemblies to customer specifications for irradiation to compare behaviour with that of qualified reference fuel
Requalification (if needed) Demonstration that manufacturing quality is under control Demonstration that the workers are still trained Demonstration that the inspection equipment is still able to perform properly Demonstration that special process qualifications (welding, heat-treatment, etc) are still valid Demonstration that previous or new subcontractors and/or material/component suppliers are either still qualified or have been requalified
Table 3. Steps in generic approach to fuel development and qualification
35 of 79

Chapter 6 discusses the generally similar qualification processes used in a number of countries other than Russia engaged in fuel development and qualification and the process used in Russia. The discussions of Chapter 6 both demonstrate that actual qualification programs are consistent with the generic approach described in Chapter 5 and provide additional detail to emphasize the good practices recommended in Chapter 5. Examples of specific past and present qualification programs are described in Appendix II: (a) U3Si2-Al dispersion fuel through an international collaboration during the 1980s led by the US Reduced Enrichment for Research and Test Reactor (RERTR) programme, (b) U3Si2-Al dispersion fuel by the French CEA for the enhanced conditions required for use in the OSIRIS reactor and in the Jules Horowitz reactor currently being designed, (c) U3Si-Al dispersion fuel for use in AECL’s NRU and Maple-type research reactors, (d) high-density TRIGA® fuel, and (e) high-density UO2-Al dispersion fuel (IRT-4M) fuel assemblies in Russia for use in several reactors outside Russia. 3. Conclusion The IAEA initiated preparation of and will soon publish a document on ‘GOOD PRACTICES FOR QUALIFICATION OF HIGH DENSITY LEU RESEARCH REACTOR FUELS.’ In addition to recommending good practices to any organization undertaking a fuel development programme in the future, this document will bring research reactor fuel manufacturers, fuel users, and regulatory bodies up to date on the information expected to be available to support licensing of newly developed fuels for conversion of research reactors from the use of HEU fuels to the use of LEU fuels and for use in new reactors.
ACKNOWLEDGEMENT
The author gratefully acknowledges the contributions of the other consultants who worked on this project and of the IAEA coordinator. Without their significant contributions, both in writing and through hours of discussion, preparation of the Good Practices Document and of this paper would not have been possible. The author also thanks the IAEA for its support through a Special Services Agreement that allowed the author the luxury of concentrating for a month on compiling and editing the document.
36 of 79

IRIS PROGRAM: IRIS4 FIRST RESULTS
F. CHAROLLAIS, M. RIPERT, MC. ANSELMET Commissariat à l’Énergie Atomique -Cadarache, DEN/DEC,
13108 St Paul lez Durance – Cedex – France
P. BOULCOURT, X. TIRATAY Commissariat à l’Énergie Atomique - Saclay, DEN/DRSN,
91191 Gif sur Yvette – Cedex – France
P. LEMOINE Commissariat à l’Énergie Atomique - Saclay -DEN/DSOE,
91191 Gif sur Yvette – Cedex – France
C. JAROUSSE AREVA-CERCA◊
Les Bérauds – BP1114 – 26104 Romans –– Cedex – France
ABSTRACT
In the framework of the French IRIS program of high density UMo/Al fuel development, the latest alternative solution was focused on the development of advanced UMo atomised particles surrounded by a tailored oxide layer. The IRIS4 irradiation, launched in October 2008 in OSIRIS, is currently testing this concept where the oxide layer is aimed to act as a protective barrier. The potential positive contribution of silicon effect is also studied since two kinds of matrix are tested: pure Al and Al + 2.1wt% Si. This paper describes the IRIS4 experiment and reminds its main objectives. First visual examinations and plate thickness measurements at the current level of irradiation are compared to those of previous irradiations allowing the discussion of both effects of oxide layer and silicon addition on the irradiation behavior.
1. Introduction Despite the intrinsically good irradiation stability of UMo alloys, the UMo dispersion fuel development has still to challenge the poor in-pile behaviour of the (atomised) UMo dispersed in pure Al evidenced by past in-pile experiments such IRIS2, FUTURE and RERTR irradiations [1, 2, 3]. Extensive porosity is formed in the reaction layer, at the fuel/matrix interface, resulting in an unacceptable pillowing and/or swelling of the fuel plate. A large part of the instability of (atomised) UMo/Al fuel is attributed to the behaviour of the fission gas release and the properties of the UMoAl interaction layer (IL) formed during the irradiation. In that context, current development of advanced UMo/Al dispersion fuel has two main objectives:
- either decrease the IL formation kinetics, - or/and improve the IL in-pile behaviour, i.e. to enhance its fission gas retention.
To reach these goals, the French IRIS program has already tested two kinds of improvement on full-size plates in the OSIRIS reactor using high density UMo fuel by modifying the Al matrix composition and/or the UMo powder characteristics [4].
◊ AREVA-CERCA, a subsidiary of AREVA NP, an AREVA and SIEMENS Company
37 of 79

Four various experiments IRIS1 [5], IRIS2 [1], IRIS3 [6] and IRIS-TUM (in collaboration with German FRMII and TUM) [7] were carried out with ground or atomised powder, dispersed in pure or silicon enriched aluminium matrix. Ground fuel particles showed a good in-pile behaviour in IRIS1 experiment confirmed by IRIS-TUM one, performed at higher heat flux and reaching higher equivalent burn-up. Benefit of silicon addition into the Al matrix was particularly evidenced in the IRIS3 (2.1%Si) fuel plates involving atomised UMo particles. For the plates made of ground UMo powders (case of IRIS-TUM), the positive effect of Si is less discernable and certainly covered by the intrinsic characteristics of the ground fuel (shape microstructure, defects, oxidized powder surface, induced porosity…) supposed to be at the origin of the good in-pile behaviour as discussed in previous papers [4, 8]. Based on these European irradiation results, on recent Russian in-pile experiments with UO2 coated UMo particles [9] and on CEA out-of-pile studies attesting that an oxide layer deposited on atomised UMo particles appear to be a promising protective barrier as regard to UMo/Al interdiffusion [8, 10, 11], a new IRIS4 experiment was designed to further evaluate the oxide layer effect. Atomised UMo particles were selected because of manufacturing aspects and particularly the difficulties to industrialize a grinding process. IRIS4 experiment has been defined by CEA, within a specific collaboration with AREVA-CERCA. The irradiation has begun in October 2008 in OSIRIS Reactor. The first objective of IRIS4 experiment is to discriminate the role of the oxide layer on the irradiation behaviour of the UMo fuel independently of the contribution of the Si. The potential positive effect of both modifications (silicon + oxide layer) will also be studied since two kinds of matrix are tested: pure Al and Al + 2.1wt% Si. The second objective of IRIS4 is to test the fuel at the OSIRIS’ maximum authorized irradiation conditions (by the French Nuclear Regulatory Commission) i.e. a maximum heat flux of about 290 W/cm² and an outer cladding temperature of about 100°C. The IRIS4 irradiation targets a minimum burn-up of 50% 235U. This paper presents the IRIS4 fabrication, the irradiation parameters and deals with the first plate thickness measurements after 4 cycles. 2. IRIS4 Plates fabrication and characterization Since the main objective of IRIS4 was to test the influence of a tailored oxide layer on fissile particle in a UMo/Al dispersion fuel, a preliminary lab-scale study at CEA was made to define a reliable and optimised oxidation treatment procedure to obtain the desired uranium oxide layer characteristics, keeping in mind to not strongly modify the current manufacturing rolling [11]. A compromise between the oxide layer uniformity around atomised UMo particles, the decrease of the uranium density and the integrity of the barrier allowed to specify an oxide layer thickness of 1.5 µm ± 0.5 µm. After a scale-up oxidising treatment step performed by AREVA-CERCA, four full-size AlFeNi cladded fuel plates made of oxidised atomised UMo particles were fabricated by AREVA-CERCA [12]. The plates have a high uranium meat loading of ~7.8 gU.cm-3 and a uranium enrichment of about 19.8 % 235U. The meat consists of oxidised U7.3wt%Mo atomised particles dispersed in either a pure (A5) aluminium matrix (plates 8053 and 8054) or an Al matrix to which 2.1 wt% Si is added (plates 8043 and 8044). The IRIS4 fuel meat characteristics are similar to those of the IRIS2 [1] and IRIS3 [6] experiments with a fuel volume fraction close to 50%. The as-fabricated porosity is comprised between 1.1 to 4.5 vol%.
38 of 79

The main characteristics of the IRIS4 fuel plates are summarized in table 1. The length, width and thickness of the IRIS4 plates are identical to previous IRIS experiments ones, respectively close to 641 mm, 73 mm, 1.30 mm. The fuel plate inspections, such as metallographic examinations, X-ray diffraction, blister tests, indicated that the plates met the usual OSIRIS specifications.
Plate ID Matrix composition
Mo/UMo (wt%)
235U/U (%)
Utotal
(g) U density(gU.cm-3)
Mean plate thickness
(mm)
Porosity(%)
U7MZ 8043
Al + 2.1 wt% Si 19.78 131.3 7.7 1.31 3.8
U7MZ 8044
Al + 2.1 wt% Si 19.78 129.7 7.9 1.31 1.1
U7MZ 8053 Pure Al 19.75 131.3 7.8 1.30 2.4
U7MZ 8054 Pure Al
7.3
19.75 131.3 7.7 1.30 4.5
Table 1: Characteristics of IRIS4 oxidised UMo plates From a microstructural point of view [12], the fuel meat presents a typical shape of rolled plate made of atomised particles (cf. Fig.1a) with a homogeneous meat thickness. Some UMo particles interpenetration can not be avoided due to the high uranium density and the rolling process, leading up to some local cracks in the oxide layer. Such fuel characteristics must be kept in mind for the on-going irradiation and further PIE, notably in the case of the plates with Al added with Si, where Si can play its recognised protective role.
Fig. 1a and 1b : As-fabricated cross-section of IRIS4 plate (left) and
detail of as-fabricated IRIS4 microstructure (right) 3. Irradiation history The irradiation of the four plates is being carried out in the IRIS device loaded in the OSIRIS reactor at the core cell #52 which was already the irradiation position of the IRIS2 experiment (cf. Fig. 2). This position leads to a slight flux gradient between the 2 most irradiated objects (plates 8044 and 8053) and the 2 less ones situated in the inner part of the IRIS device (plates 8043 and 8054) as illustrated by Fig. 2. The irradiation has started in October 2008 and should last up to reach a minimum of 50% 235U, expected by mid-2009.
39 of 79

Fig. 2 : IRIS4 loading in the OSIRIS core Peak Heat Flux (PHF) of the four plates are given in Table 2 for each cycle. At this step of the IRIS4 experiment, those PHF values must be considered as first estimated results which will be consolidated after spectrometry measurements and neutronic calculation. An average burn-up at Maximal Flux Plane of ~38% and ~35% is estimated for the two outer plates (8044 and 8053) and the two inner plates (8043 and 8054) of the IRIS4 experiment respectively. The two most irradiated plates (8044 with Si and 8053 without Si) have seen a maximal heat load above 285 W.cm-2. All the four plates have been reinserted mid-February for the 5th cycle F233 since no pillowing or important swelling1 occurred.
Peak Heat Flux2 (W.cm-2)
Cycle EFPD* Plate 8044 Plate 8043 Plate 8054 Plate 8053
F229 8 295 275 265 280
F230 14 290 275 270 285
F231 16 250 235 230 245
F232 18 230 220 220 230
Table 2: Maximum Flux Plane (MFP) irradiation conditions of IRIS4 (*Equivalent Full Power Day)
1 The admissible swelling limit is 250 µm. Above this value, it is not possible to reinsert the incriminate plate. 2 These PHF are preliminary values based on the OSIRIS loading. Definitive results of PHF will be available after neutronic calculations.
Plate 8054 (0% Si)
Plate 8044 (2.1%Si )
Plate 8043 (2.1% Si)
IRIS-4
Plate 8053 (0% Si)
40 of 79
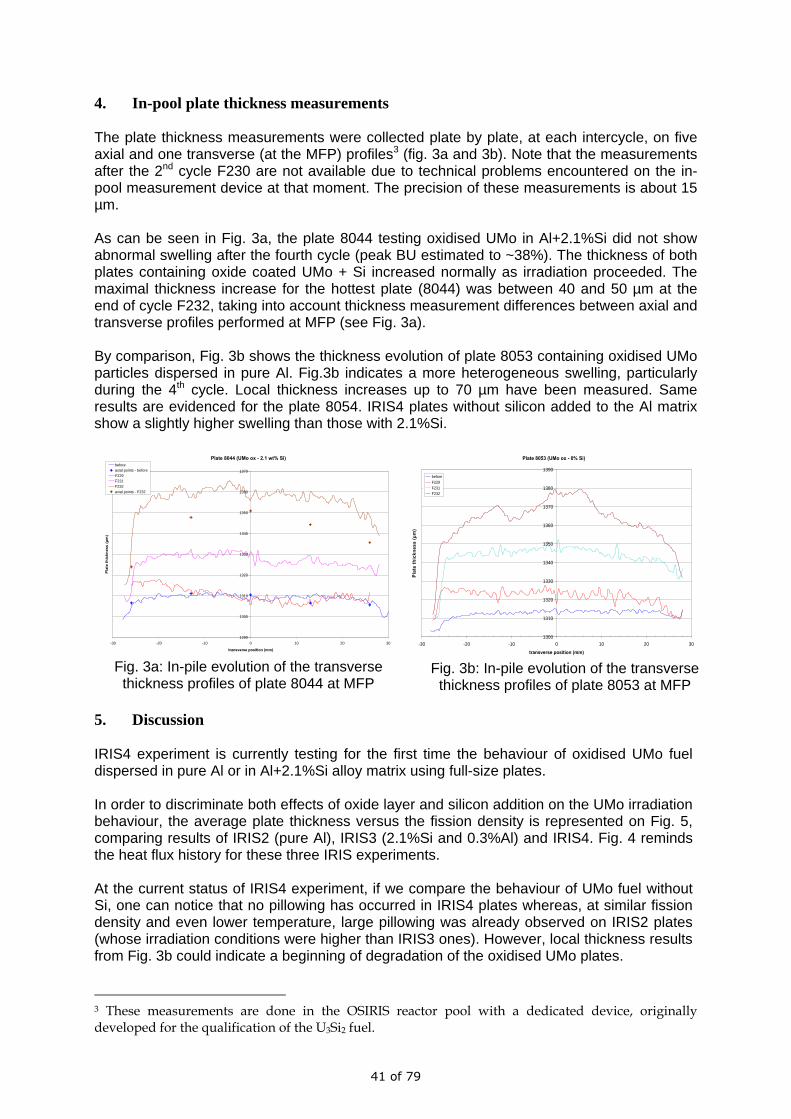
4. In-pool plate thickness measurements The plate thickness measurements were collected plate by plate, at each intercycle, on five axial and one transverse (at the MFP) profiles3 (fig. 3a and 3b). Note that the measurements after the 2nd cycle F230 are not available due to technical problems encountered on the in-pool measurement device at that moment. The precision of these measurements is about 15 µm. As can be seen in Fig. 3a, the plate 8044 testing oxidised UMo in Al+2.1%Si did not show abnormal swelling after the fourth cycle (peak BU estimated to ~38%). The thickness of both plates containing oxide coated UMo + Si increased normally as irradiation proceeded. The maximal thickness increase for the hottest plate (8044) was between 40 and 50 µm at the end of cycle F232, taking into account thickness measurement differences between axial and transverse profiles performed at MFP (see Fig. 3a). By comparison, Fig. 3b shows the thickness evolution of plate 8053 containing oxidised UMo particles dispersed in pure Al. Fig.3b indicates a more heterogeneous swelling, particularly during the 4th cycle. Local thickness increases up to 70 µm have been measured. Same results are evidenced for the plate 8054. IRIS4 plates without silicon added to the Al matrix show a slightly higher swelling than those with 2.1%Si.
Plate 8044 (UMo ox - 2.1 wt% Si)
1290
1300
1310
1320
1330
1340
1350
1360
1370
-30 -20 -10 0 10 20 30
transverse position (mm)
Plat
e th
ickn
ess
(μm
)
beforeaxial points - beforeF229F231F232axial points - F232
Fig. 3a: In-pile evolution of the transverse thickness profiles of plate 8044 at MFP
Plate 8053 (UMo ox - 0% Si)
1300
1310
1320
1330
1340
1350
1360
1370
1380
1390
-30 -20 -10 0 10 20 30
transverse position (mm)
Plat
e th
ickn
ess
(μm
)
beforeF229F231F232
Fig. 3b: In-pile evolution of the transverse
thickness profiles of plate 8053 at MFP 5. Discussion IRIS4 experiment is currently testing for the first time the behaviour of oxidised UMo fuel dispersed in pure Al or in Al+2.1%Si alloy matrix using full-size plates. In order to discriminate both effects of oxide layer and silicon addition on the UMo irradiation behaviour, the average plate thickness versus the fission density is represented on Fig. 5, comparing results of IRIS2 (pure Al), IRIS3 (2.1%Si and 0.3%Al) and IRIS4. Fig. 4 reminds the heat flux history for these three IRIS experiments. At the current status of IRIS4 experiment, if we compare the behaviour of UMo fuel without Si, one can notice that no pillowing has occurred in IRIS4 plates whereas, at similar fission density and even lower temperature, large pillowing was already observed on IRIS2 plates (whose irradiation conditions were higher than IRIS3 ones). However, local thickness results from Fig. 3b could indicate a beginning of degradation of the oxidised UMo plates.
3 These measurements are done in the OSIRIS reactor pool with a dedicated device, originally developed for the qualification of the U3Si2 fuel.
41 of 79

In that case, one can assume that oxidised UMo would hinder the interaction rate UMo/Al without really modifying its intrinsic characteristics. Behaviour of plates 8053 and 8054 during the further cycles will definitely confirm or not this assumption.
0
50
100
150
200
250
300
0,00 0,50 1,00 1,50 2,00 2,50 3,00 3,50 4,00 4,50Fission density (1021 f/cm3 UMo)
Plat
e th
ickn
ess
incr
ease
(µm
)
IRIS2 0%Si (U7MT2002)IRIS2 0%Si (U7MT2003)IRIS2 0%Si (U7MT2007)IRIS3 0,3%Si (U7MV8011)IRIS3 2,1%Si (U7MV8021)IRIS4 UMo ox - 2,1%Si (U7MZ8044)IRIS4 UMo ox - 2,1%Si (U7MZ8043)IRIS4 UMo ox - 0%Si (U7MZ8054)IRIS4 UMo ox - 0%Si (U7MZ8053)
IRIS2 0% SiP < 240 W/cm²
1237 µm
IRIS3 0,3% SiP < 183 W/cm²
IRIS3 2,1% SiP < 201 W/cm²
IRIS2 0% SiP < 230 W/cm²
371 µm 1056 µm pillowing
Fig. 5: Plate swelling of IRIS2, IRIS3 and IRIS4 plates
6. Conclusion IRIS4 consists in four full-size plates with high uranium loading and U-7.3 wt %Mo oxidised atomised powder dispersed in pure or added with silicon aluminium matrix. In this latest IRIS4 experiment still on-going, a modification of the UMo/Al interface is considered. The concept of protective barrier with the use of an oxide layer surrounding UMo particles was promoted by out-of-pile results [10, 11]. Up to now, the IRIS4 plates were irradiated during 58 EFPD at OSIRIS reactor at a peak power of more than 290 W.cm-2. The first results show that in the tested conditions, i.e. fission density of about 2.5 1021 f.cm-3
UMo, no pillowing occurred. For oxidised UMo fuel dispersed in pure Al, plate thicknesses have slightly more increased than for plates with Si added in Al.
The behaviour of the two others plates (8043 and 8044) testing the both contribution of the oxide layer and the Si addition is promising since the thickness increase of those plates is of the same order of magnitude as that of the IRIS3 plate 8021 containing Al+Si but irradiated at much lower heat flux (below 200 W/cm² against more than 285 W/cm² for the IRIS4 plates). Until now, positive effect of 2.1%Si addition in the Al matrix is confirmed in higher irradiation conditions. The potential contribution effect of oxidised UMo particle should be discriminate in the further irradiation cycles.
Power history
0
50
100
150
200
250
300
350
0 50 100 150Duration (days)
Peak
Hea
t Flu
x (W
.cm
-2)
IRIS 2 (Pure Al) 2002IRIS 3 (Al+2.1%Si) 8021IRIS 4 (UMo ox +2,1%Si) 8044
Fig.4: IRIS2, IRIS3 and IRIS4 power history comparison
42 of 79

At that stage of IRIS4 irradiation progress, it is too early to conclude to a really promising effect of oxide layer on the UMo/Al behaviour. Positive effect of Si observed after 4 cycles needs to be confirmed. Further OSIRIS cycles planned by mid-2009 are compulsory to test IRIS4 device at higher burn-up in order to complete the comparison with former IRIS experiments and thus confirm or not current tendencies. 7. References [1] F. Huet et al., « Post irradiation examinations on UMo full sized plates – IRIS2
experiment », Proc. of the 9th Int. Meeting on Research Reactor Fuel Management (RRFM 2005), Budapest, Hungary, April 10-13, 2005.
[2] A. Leenaers, S. Van den Berghe, E. Koonen, C. Jarousse, F. Huet, M. Trotabas, M. Boyard, S. Guillot, L. Sannen, M. Verwerft, “Post irradiation examination of U-7wt% Mo atomised dispersion fuel”, J. Nucl. Mater. 335, 2004, p. 39-47.
[3] G. L. Hofman et al., “Recent observations at the postirradiation examination of low-enriched U-Mo Miniplates irradiated to high burnup”, Proc. of the 8th Int. Meeting on Research Reactor Fuel Management (RRFM 2004), München, Germany, March 21-24, 2004.
[4] S. Dubois et al., « Comprehensive overview on IRIS program : irradiation tests and PIE on high density UMo/Al dispersion fuel », Proc. of the 11th Int. Meeting on Research Reactor Fuel Management (RRFM, 2007), Lyon, France, 11-15 March, 2007.
[5] F. Huet et al., « Full-sized plates irradiation with high UMo fuel loading – Final results of IRIS1 experiment”, Proc. of the 25th Int. Meeting on RERTR2003, Chicago, Illinois, USA, 2003.
[6] M. Ripert et al., “IRIS3 Experiment – status and results of thickness increases”, Proc. of the 10th Int. Conf. on Research Reactor Fuel Management (RRFM 2006), Sofia, Bulgaria, April30-May3, 2006.
[7] A. Röhrmoser et al., “Results of UMo dispersive fuel plates irradiations for FRMII”, Proc. of the 11th Int. Conf. on Research Reactor Fuel Management (RRFM 2007), Lyon, France, March 11-15, 2007.
[8] M. Ripert et al., “Overview on high density UMo fuel in-pile experiments in OSIRIS”, Proc. of the 12th Int. Conf. on Research Reactor Fuel Management (RRFM 2008), Hamburg, Germany, March 2-5, 2008.
[9] G.A. Birzhevoy et al., “Results of post-irradiation examination of the (U-Mo)-Aluminium matrix interaction rate”, Proc. of the 11th Int. Conf. on Research Reactor Fuel Management (RRFM 2007), Lyon, France, March 11-15, 2007.
[10] S. Dubois et al., “Development of UMo/Al dispersion fuel: an oxide layer as a protective barrier around the UMo particles”, Proc. of the 28th Int. Meeting on RERTR2006, Cap Town, RSA, Oct. 29-Nov. 2, 2006.
[11] F. Mazaudier et al., “Thermodynamic and kinetic features of the oxidation treatment of U7Mo Particles”, Poster presented at the 28th Int. Meeting on RERTR2006, Cap Town, RSA, Oct. 29-Nov. 2, 2006.
[12] C. Jarousse et al., “Latest dispersed UMo fuel plate manufacturing results at AREVA-CERCA”, Proc. of the 12th Int. Conf. on Research Reactor Fuel Management (RRFM 2008), Hamburg, Germany, March 2-5, 2008.
43 of 79
UPDATE ON FRESH FUEL CHARACTERIZATION OF U-MO ALLOYS
D.E. BURKES, D.M. WACHS, D.D. KEISER, M.A. OKUNIEWSKI, J.-F. JUE, F.J. RICE, and R. PRABHAKARAN
Nuclear Fuels and Materials Division, Idaho National Laboratory P.O. Box 1625, 83415-6188 Idaho Falls – U.S.A.
ABSTRACT
The need to provide more accurate property information on U-Mo fuel alloys to operators, modellers, researchers, fabricators, and government increases as success of the GTRI Reactor Convert program continues. This presentation provides an update on fresh fuel characterization activities that have occurred at the INL since the RERTR 2008 conference in Washington, D.C. The update is particularly focused on properties recently obtained and on the development progress of new measurement techniques. Furthermore, areas where useful and necessary information is still lacking is discussed. The update deals with mechanical, physical, and microstructural properties for both integrated and separate effects. Appropriate discussion of fabrication characteristics, impurities, thermodynamic response, and effects on the topic areas are provided, along with a background on the characterization techniques used and developed to obtain the information. Efforts to measure similar characteristics on irradiated fuel plates are discussed.
1. Introduction Characterization of fresh U-Mo fuel alloys is a key element of the GTRI Reactor Convert fuel development program for three main reasons: (i) effectively document available information for current and future fuel and material researcher use, (ii) establish a link between fresh fuel properties and irradiated fuel observations so that the effect(s) of irradiation can be confidently deduced, and (iii) provide a feedback loop into the fuel plate preparation methods to optimize behaviours for additional fabrication processes and the best possible irradiation performance. As the fuel development campaign progresses, the necessity of bridging the gap between lab-scale process demonstration and commercial scale development intensifies. Characterization of fabrication processes and material properties is at the forefront of bridging this gap, so that continuity between lab-scale and bulk production is maintained. For example, the INL employs arc melting (lab-scale) for mini-plate experiments while Y-12 has employed induction melting (bulk production) for full-size plate experiments. Two different encapsulation methods are being investigated: friction bonding at the INL for mini- and full-size plate experiments and hot isostatic pressing at the INL for mini-plate experiments and Babcock & Wilcox for full-size plate experiments. Forming operations required for some reactor designs also introduce considerations for processing. The continuity of these two scales is of the utmost importance to ensure that desired fuel performance behaviour and attributes are maintained. For the most part, this paper will serve as a progress report of the characterization techniques being employed and developed at the Idaho National Laboratory (INL) since the RERTR 2008 conference in Washington D.C. Specific progress has been made performing needed material property measurements and further identifying areas where improved material property information is needed to support fuel fabrication and qualification. Furthermore, progress has been made on characterization technique development in terms of equipment procurement and installation. 2. Thermophysical Property Measurements Thermal properties of nuclear fuel, specifically thermal conductivity, play a vital role in fuel performance. However, evaluation of these properties is both challenging and very expensive to determine experimentally. Furthermore, fuel performance codes must assume
44 of 79

extrapolated thermal property values or values calculated employing the Neumann-Kopp approximation, even though there is insufficient data for pure elements in some cases at elevated temperatures. Thermal conductivity is most commonly determined experimentally employing three different measurement methods: differential scanning calorimetry (DSC) for specific heat capacity, dilatometry for density, and laser flash for thermal diffusivity (LFTD). Errors associated with each of these measurements can be compounded in determination of thermal conductivity, and must be appropriately understood. Measurements have been conducted on alloys encompassing the proposed range of fuels, i.e. U alloyed with 7 to 12 wt% Mo, with each of these techniques. Combined data plots for each of these alloys and techniques are provided in Fig. 1. For the alloy containing 10 wt% Mo, the specific heat capacity, density, and thermal diffusivity behaviour is as expected, from near room temperature up to 800oC. For the alloys containing 7 and 12 wt% Mo, a change in behaviour is observed between 400 and 600oC. In both cases, the behavioural change is attributed to decomposition of the desired high temperature γ-U(Mo) phase into α-U(Mo) and/or U2Mo. Based on time-temperature-transformation diagrams (TTT) on the U-Mo system, the rate at which the quenched γ-U(Mo) phase will decompose into α-U(Mo) phase in a homogeneous alloy is strongly dependent upon the isothermal treatment temperature, being more pronounced when the alloy is near the eutectoid temperature (550oC) [1,2]. The α-U phase forms continuously by a cellular matrix decomposition reaction as a function of time, nucleating primarily at sub-grain boundaries and leading to precipitation at the grain boundaries [3]. For the 7 wt% Mo alloy, decomposition of γ-U(Mo) into α-U(Mo) is relatively rapid as defined by the TTT diagram, with the kinetics becoming much more sluggish with increased wt% Mo. For the 12 wt% Mo alloy, decomposition would not necessarily be expected. However, the foil sample used for DSC measurements contained a significant amount of chemical banding that resulted from inadequate homogenization during the arc-melting fabrication process. Conversely, the cast samples used for dilatometry and LFTD did not exhibit the banding. Chemical banding is the result of Mo-rich and Mo-lean zones, and XRD and
Fig. 1. Combined specific heat capacity, density, and thermal diffusivity data plots for
representative DU-7, -10, and -12 wt% Mo alloys microhardness measurements performed on the foil sample more accurately placed the Mo content in the 13-14 wt% range, rather than the nominal 12 wt% range [4,5]. The kinetics
45 of 79

associated with the decomposition of γ-U(Mo) into α-U(Mo) and U2Mo begin to accelerate rapidly beyond the 12 wt% content. Thus, thermal cycling of the samples during measurements on these alloys will result in a mixed microstructure of γ-(Mo), α-U(Mo), and U2Mo for the 7 and 12 wt% Mo alloys, rather than a single phase as was the case for the 10 wt% Mo alloy. The thermophysical properties of these phases are different, and therefore result in unexpected alloy behaviour. This is demonstrated by the thermal conductivity determined by the combined data plots presented in Fig. 1. The results of these determinations are provided graphically in Fig. 2. These measurements illustrate the importance of solid characterization and understanding of alloy behaviour on desired material attributes, such as thermal conductivity. Furthermore, values available from literature were determined by electrical conductivity measurements and converted to thermal conductivity employing the Wiedemann-Frantz law. Thermal conductivity measurements obtained from electrical conductivity are lower than those measured in a direct or semi-direct manner, since electrical conductivity only considers the electronic contribution to thermal conductivity and phonon-phonon scattering is not taken into account. Sound knowledge of the fresh fuel thermal conductivity is necessary in order to determine separate effects such as burn-up and fuel temperature. In addition, in order to understand overall integrated behaviour of the fuel plate, one must be able to effectively deconvolute the effects of modifications made to the fuel alloy, including any modification made to the interface, e.g. Si or Zr. 3. Instrumented indentation One of the most important aspects of monolithic fuel forms is the behaviour of the interface. Integrity of the bond between the U-Mo monolith and cladding material must be measured as a function of processing method, processing parameters, and interface modifications, e.g. Si or Zr. Instrumented indentation offers a unique capability to measure the normal and lateral forces simultaneously in order to determine the cohesive strength of the interface. Basically, a conical indenter is placed near the interface of interest and a load applied. As the normal load increases, lateral force changes accordingly as the tip is pushed away from the cohesive interface. As the interface delaminates, the indenter moves backward towards the interface as the normal load continues to increase. Thus, a change in slope for the Fx-t curve corresponds to delamination or cracking, and the decohesive force is taken as the normal load at that point. A FEA model can be developed to calculate cohesive strength of
Fig. 2. Thermal conductivity of the DU-7, -10, and -12 Mo alloys determined from the
combined data plots in Fig. 1. the interface from the normal load. A tribometer has been procured from CETR (California) to perform this function at the INL. The instrument is capable of both vertical and lateral displacement measurement, modular load capacity (up to 1kN), and comes equipped with an
46 of 79

optical microscope, acoustic emission detector, and an environmental chamber capable of temperatures up to 1000oC. 4. Shear Punch Testing Small scale specimen testing is desirable to determine mechanical properties of fuel alloys. Specifically, such techniques are desirable to correlate beginning of life mechanical behavior with end of life behaviour in terms of burn-up and temperature, while also investigating the effects of microstructure, impurities, and the interface layer. Shear (or small) punch testing is ideal for this purpose and is based on blanking a circular disk from a fixed sheet specimen. The technique is relatively simple and straightforward in the fact that a cylindrical punch with a flat end is utilized to punch a hole in the circular disk. The technique is currently being developed for both out-of-pile and in-cell measurements. Deformation and failure processes that occur during shear punch testing are analogous to those that occur in uniaxial tension. The load displacement data can be interpreted in terms of and correlated with uniaxial mechanical properties data (flow properties such as yield stress, UTS, work hardening exponent and ductility parameters). Verification and validation of the SPT fixture and procedure is continuing out-of-pile. Stainless steel 304 samples are being employed as a calibration standard. SPT measurements performed on these calibration samples are in good agreement with uniaxial tension measurements. Furthermore, the technique is being validated on fresh U-Mo alloy samples. Examples of SPT measurements performed on a DU-10 wt% Mo alloy are provided in Fig. 3. In-cell SPT development continues, with an Instron being prepared for insertion into the INL Hot Fuel Examination Facility in mid March. A photograph of the instrument is provided in Fig. 3. The first SPT on irradiated fuel alloys will begin in mid May on the AFIP-2 experiment. 5. Through-thickness Flash Thermography Through-thickness flash thermography is an alternative non-destructive evaluation tool currently being investigated at the INL for use on plate-type fuels. Theoretically, the technique should allow the minimization of errors, increase product yield due to reduced measurement time, increase fuel performance confidence, and offer additional information to better understand potential effects that may result in performance deterioration. The technique can be qualitative or quantitative. Qualitative analysis uses differences in contrast to identify areas with flaws or material differences. Quantitative analysis determines the specimen’s thermal diffusivity, α, as a function of location. The technique is
Fig. 3. Examples of SPT measurements performed on a fresh, DU-10Mo alloy (left) and a
photograph of the in-cell Instron at INL (right)
47 of 79

Fig. 4. Simple schematic of the through-thickness flash thermography technique illustrating
qualitative analysis capability (left); Example thermal diffusivity profile obtained from through-thickness flash thermography illustrating quantitative analysis capability (right).
currently being evaluated for application to both out-of-pile and in-cell measurements. A simple schematic of the through-thickness flash thermography method and an example thermal diffusivity profile is provided in Fig. 4. 6. Conclusions Fresh fuel characterization is a key element in understanding and predicting fuel behaviour, optimization of fabrication processes to tailor properties to desired performance, and vital to transfer of knowledge and technologies to current and future researchers and developers. A number of characterization techniques are being utilized at the INL to accomplish the mission of qualifying usable U-Mo dispersion and monolithic fuel forms. This has culminated in vast educations and experiences to the benefit of the GTRI Reactor Convert Program. Specific areas of technique development to provide links to use out-of-pile characterization to better understand post-irradiation observations are also essential. These techniques must therefore be developed for both beginning of life and end of life measurement. 5. References 1. G.L. Hofman, M.K. Meyer, and A. Ray, “Design of High Density Gamma-Phase
Uranium Alloys for LEU Dispersion Fuel Applications,” Proc. of the International Meeting of RERTR, Prague, Sao Paulo, Brazil (1998).
2. R.J. Van Thyne and D.J. McPherson, “Transformation Kinetics of Uranium-Molybdenum Alloys,” Trans. ASM 49 (1957) pp. 598-621.
3. F.B.V. Oliveira, M. Durazzo, E.F.U. Carvalho, A.M. Saliba-Silva, and H.G. Riella, “Powder Formation of γ-Uranium-Molybdenum Alloys Via Hydration-Dehydration,” Proc. of the International Meeting of RERTR, Prague, Czech Republic (2007).
4. D.E. Burkes, T. Hartmann, R. Prabhakaran, and J.-F. Jue, “Microstructural Characteristics of DU-xMo Alloys with x = 7 to 12 wt%,” accepted J. Alloys Comp., 2008.
5. D.E. Burkes, R. Prabhakaran, J.-F. Jue, and F.J. Rice, “Mechanical Properties of DU-xMo Alloys with x = 7 to 12 wt%,” accepted Met. Mat. Trans. A, 2008.
6. Acknowledgements As with any large and dynamic program, people are the greatest asset. There are a number of people involved with the fresh fuel characterization efforts at the Idaho National Laboratory and at other institutions throughout the U.S. and globally. The author’s would graciously like to acknowledge all past and current researchers that have contributed to this effort. Specifically, the author’s would like to acknowledge Dr. Ralph Dinwiddie of Oak Ridge National Laboratory for his assistance with measurements employing the flash thermography technique. Work supported by the U.S. Department of Energy, Office of the National Nuclear Security Administration (NNSA), under DOE Idaho Operations Office Contract DE-AC07-05ID14517.
48 of 79

*AREVA-CERCA, a subsidiary of AREVA NP, an AREVA an SIEMENS company
CD WIRES AS BURNABLE POISON FOR THE BR2 FUEL ELEMENT
N.FRANCK AREVA♦CERCA*
Les Bérauds, B.P. 1114, 26104 Romans Cedex - France
S.KALCHEVA & E.KOONEN BR2 reactor SCK●CEN
Boeretang 200, B-2400 MOL Belgium
ABSTRACT
SCK-CEN intends to replace the current burnable poisons, which are mixed in the fuel meat, by cadmium wires which should be more appropriate for a future LEU fuel element. This paper describes the present status and planning of this modification project. In a first step theoretical and computational evaluations have been performed by BR2 to determine an optimum configuration of burnable poisons for the future LEU element. Various Cd wires design were studied in order to define an optimal solution. Mechanical studies and design modifications were investigated at AREVA-CERCA in order to evaluate the manufacturing feasibility of a BR2 fuel element using Cd wires inserted in the stiffeners instead of Sm2O3 and B4C powder mixed in the aluminium matrix of the fuel meat. It is the intention to deliver 2 prototypes with the new design of burnable absorbers to BR2 by mid-2010 and to irradiate them shortly there after. The final objective is to have this new type of burnable poisons qualified by mid-2011 to be able to use them for future LEU fuel elements.
1. Introduction Burnable absorbers are used in most nuclear reactors. These are isotopes with high neutron absorption cross section, which purpose is to lower the reactivity at the start up of the reactor operation. The idea behind is that the burnable absorbers will capture neutrons and transmute all along the cycle in order to completely disappear at the end of the cycle, thus allowing to limit the reactivity penalties.
The BR2 reactor is a multi-purpose Material Testing Reactor which main activity is to test advanced fuel designs, including new LEU types, and structural materials for different reactors types like LWR, fusion reactor (ITER), ADS. BR2 belongs to the European Network of reactor dedicated to the production of Mo99. When the BR2 was designed in the 60's, the fuel was foreseen to be Highly Enriched Uranium (93% U5) in aluminium matrix with burnable absorber, B4C and Sm2O3, homogeneously mixed in the fuel meat. HEU is a concern in the proliferation of nuclear weapon framework, from one side and from the other side, mixing burnable absorber (boron) in the fuel meat causes some concerns for the fabrication of such fuel. Therefore, a 'BR2 conversion project' has been initiated in 2008 under the RERTR programme for non-proliferation of nuclear weapon, which is managed by U.S. DOE and supported by IAEA. The first aim of this project is to re-consider the current fuel assembly design, in particular the localization and the nature of the burnable absorber in the fuel assembly. The requirements for the burnable absorber are: to have high absorption cross section at beginning of life and relatively short lifetime, which allows compensating for depletion of the fissile material at the end of cycle.
Preliminary studies for the choice of an optimal material, geometry and localization of the burnable absorber in the fuel assembly, which provides at least the same (as for the
49 of 79

*AREVA-CERCA, a subsidiary of AREVA NP, an AREVA an SIEMENS company
presently used fuel) or enhanced fuel utilization, have been performed in the frame of the 'BR2 conversion project'. The preliminary results of these studies have been discussed in joint BR2-ANL meetings under the RERTR programme in May-June'08 and reported at the RERTR'08 meeting in Washington [1]. A detailed analysis about the impact on the neutronics of the reactor for different fuel types, including standard HEU and LEU types, can be found in the Master Thesis of B. Guiot, which considers insertion of burnable absorber wires inside the aluminum stiffeners of the standard BR2 fuel assembly design [2].
2. Optimization of the burnable absorber The main objective in the utilization of burnable absorbers is to reduce the energy costs of the fuel cycle. Therefore the optimization problem was to find an optimal control strategy and optimal burnable absorber among materials with large microscopic cross section and to optimize the geometry and localization of the poisons in the fuel assembly. The solution of these optimization problems were discussed in [1]&[2]. The criteria for an optimal control strategy were formulated as: extended fuel cycle length, enhanced fuel utilization, flattened reactivity evolution, reduced control rods motion during an operation cycle. At the same time the optimized burnable absorber should satisfy the safety criteria, such as shut down margin. 2.1 Simulation of conversion through transition cores In the process of the conversion from HEU to LEU fuel, the reactor will be gradually loaded with the new fuel type. A preliminary choice for a Reference Core Load was made, assuming that the loading keeps a pattern similar to that of the cycle "04/2007A.5" of the BR2 reactor, which has been operated at P=55 MW during T~20 days. The new type of fuel is loaded in the channels 'C' in the second reactor core ring where fresh fuel of the old type is usually loaded. Calculation of the flux and local consumption of the fuel and the burnable absorber is made. In the next cycle, the burnt six fuel assemblies are put in the six channels 'A' or 'B' in the central crown and six new fresh fuel assemblies are loaded again in the 'C' channels. The same calculations are made. Then the burnt fuel assemblies from channels 'A', 'B' are moved to channels 'D', 'F', 'G' in the core periphery in the next cycle. The process is repeated through five to six transition cores until the entire core is converted with the new fuel type. The neutronics and burn up calculations have been performed using the combined MCNPX&ORIGEN-S method (BR2 development) and the Monte Carlo burn up code MCNPX 2.6.F (LANL). 2.2 Optimization of geometry and localization of BA The geometry of the standard BR2 fuel element of MTR type, composed of 6 annular concentric tubes maintained by 3 aluminium stiffeners, is suitable for localization of the burnable absorbers in the aluminium stiffeners. It was decided to preserve the current fuel plate design in order to avoid significant changes in the thermal-hydraulics characteristics of the reactor. Therefore, the same fuel plate thickness, same number of fuel plates, same cladding and same water gap thickness were used in the calculations. The choice of geometry for the burnable absorber was limited to cylinder (in form of wires) or slab (in form of plates) as shown in Fig. 1. An option of homogeneously mixed boron with the powder of the aluminium stiffeners was also considered.
50 of 79

*AREVA-CERCA, a subsidiary of AREVA NP, an AREVA an SIEMENS company
Figure 1. MCNP geometry model of fuel element with burnable absorber lumped in 36 wires or 3 slabs in the aluminium stiffeners.
2.3 Optimization of burnable absorber composition The criteria for choice of optimal burnable absorber material was based on: (i) maximum efficiency (macroscopic absorption cross section; reactivity worth); (ii) maximum burn up rate; (iii) the daughter isotopes of the burnable poison should have small absorption macroscopic cross section compared to the cross section of their precursors; (iv) high melting point is preferable for the chosen burnable absorber. The best of these options should have high macroscopic effective absorption cross section in the beginning of cycle and burn up most rapidly in order to end the cycle with the lowest burn up penalty. Suitable burnable absorbers are cadmium, gadolinium, boron, samarium; also erbium and dysprosium. Europium and hafnium have high cross sections of daughter isotopes, therefore they were excluded as candidates for burnable absorber. Samarium possibly will be included as additional burnable absorber, mixed in the fuel meat as in the current fuel after the final selection of main burnable absorber. The burnable absorber samarium burns in ~ 2 days and it is added to the fuel with purpose to compensate the rapid production rate of xenon-135 at the reactor start-up.
A comparative analysis of the macroscopic absorption cross sections, burn up rate, reactivity effects was performed for the selected burnable poisons and presented in [1-2]. Three major candidates as burnable absorber for the new BR2 fuel were selected: Cd, Gd2O3, B4C. The preliminary evaluations with erbium did not show satisfactory results for the reactivity excess during the transition cores, therefore it was excluded from further studies. On the basis of the absorption properties of the considered 3 burnable absorbers it was concluded that reducing the wire diameter enhances the burn up rate.
2.4 Comparison of BA absorption properties in transition cores
Preliminary studies for the feasibility of the BR2 fuel cycle with different fuel types (HEU, 90% U5, 1.3 gUtot/cc, UAlx; LEU, 20% U5, UMo, 8.5 and 7.5 gUtot/cc; LEU, 20% U5, U3Si2, 4.8 gUtot/cc) and various burnable absorber options have been performed for the transition and fully converted cores. The reactivity excess during the transition and fully converted cores was evaluated and compared for the different burnable absorbers. The diameter of the wires has been varied between 0.2 mm and 0.6 mm with purpose to adjust the burn up rate of the poison to the desired reactivity excess for the different fuel types. The gain in reactivity is maximum (+3.30$) for UMo, 8.5 gUtot/cc with Cd-wires with diameter D=0.4 mm. The reactivity excess in UMo, 8.5 gUtot/cc with borated aluminium stiffeners is similar (+3.22 $) to the same core with Cd-wires with D=0.4 mm. The gain for UMo, 7.5 gUtot/cc is similar to the reference load (+0.36$). The preliminary calculations of the reactivity evolution of fully converted cores with cadmium wires (D=0.4 mm) have shown flattened reactivity evolution
51 of 79

*AREVA-CERCA, a subsidiary of AREVA NP, an AREVA an SIEMENS company
and longer fuel cycle length for UMo core (8.5 gUtot/cc) in comparison to the reference load with standard BR2 fuel with mixed absorbers.
A preliminary choice was made to lump the new burnable absorber in 36 Cd wires in the Al stiffeners of the fuel element. The optimum diameter for the different fuel types is as follows: D=0.55 mm for HEU (1.3 gUtot/cc); D=0.4 to 0.5 mm for fuel type UMo (8.5 gUtot/cc); D=0.4 mm for UMo (7.5 gUtot/cc).
The preliminary calculations of the axial distributions of the neutron fluxes for the UMo core have shown a significant impact on the performance goals: reduction of the thermal fluxes in the axis of the fuel channels (30 to 35%) and about 10% in the experimental positions in reflector channels, which needs future optimization studies.
3. Sheathed Cd wires design and manufacturing 3.1 Sheathed Cd wires design Following the conclusions of SCK●CEN concerning the replacement of the current poisons, mixed in the fuel core, by cadmium wires in the stiffeners, two options were investigated by AREVA-CERCA: sheathed or not sheathed cadmium wires. BR2 early decided to eliminate the use of not sheathed cadmium wire: (i) cadmium is soluble in acid environment, (ii) reactor water pool pH is slightly acid, (iii) cadmium solubility increases with temperature. AREVA-CERCA studied different methods to sheath the cadmium wires: by coating or by cadmium wire insertion into an aluminium sheath. As regard to the specification, the second technical principle was selected as the most appropriated. This solution is already used since years by some other customers. AREVA-CERCA masters this manufacturing and has a long experience feedback. 3.2 Sheathed Cd wires manufacturing The cadmium wires are inserted into an aluminium alloy sheath. End plugs made of the same aluminium alloy close the both extremities in Fig 2.
Figure 2: Sheathed cadmium wire
Various inspections are performed:
- Leak-tightness test - Dimensional inspection. - Dimensions as well as the positioning of the cadmium inside the sheath. - Cadmium integrity - Visual inspection.
4. BR2 fuel element design and mechanical studies A design study was performed to insert the cadmium wires in the stiffeners. In order to avoid any major change on the fuel assembly or plate design, the following criteria have been
52 of 79

*AREVA-CERCA, a subsidiary of AREVA NP, an AREVA an SIEMENS company
considered carefully: (i) maintain the geometry of the fuel core, of the plates and of the fuel element in order to ensure the same thermo-hydraulic characteristics, (ii) ensure the swaging criteria, (iV) keep the stiffeners mechanical characteristics and (iiii) keep the current assembling process. As a part of the project, the manufacturing costs and delivery schedule of 2 BR2 fuel elements at Mol by Mid 2010 were took into consideration. 4.1 Mechanical calculations and proposed technical solution The stiffener geometry, principally the thickness, has to be modified in order to maintain the mechanical characteristics as well as ensure a perfect insertion of cadmium wires (see figure 3). The Cd wire dimension was selected by BR2. The design modification may avoid any major change on the fuel plate design. Figure 3: Fuel section with sheathed cadmium wires
The new stiffener design and the stiffener mechanical characteristics were defined and validated by a series of specific mechanical tests. According to our experience on swaging, a technical investigation has shown that the mechanical modifications do not change the swaging parameters that were already qualified for BR2. As a consequence of the stiffener width modification, an analysis of the fuel plate geometry was performed in order to confirm their correct adaptation to the new design. Regarding the conventional criteria, some margin was found on plate and fuel dimension to successfully perform the modification without cost (processing modification…) and safety impact (thermo-hydraulic cooling aspect on the border edge in between the stiffener and the fuel area…). Taking into account our quality approach, the margin was validated throughout a full measurement campaign on existing plates. Thus, for the new fuel elements design, the border edge aluminium area (AA) and the stiffener groove edge (D), will remain the same as in the current BR2 fuel element (see figure 4). Most of all, the fuel element geometry will not be modified avoiding any long and costly safety demonstration and qualification program. As one of the most critical manufacturing step, a global approach was carried out to validate the swaging processing phase.
AA53 of 79
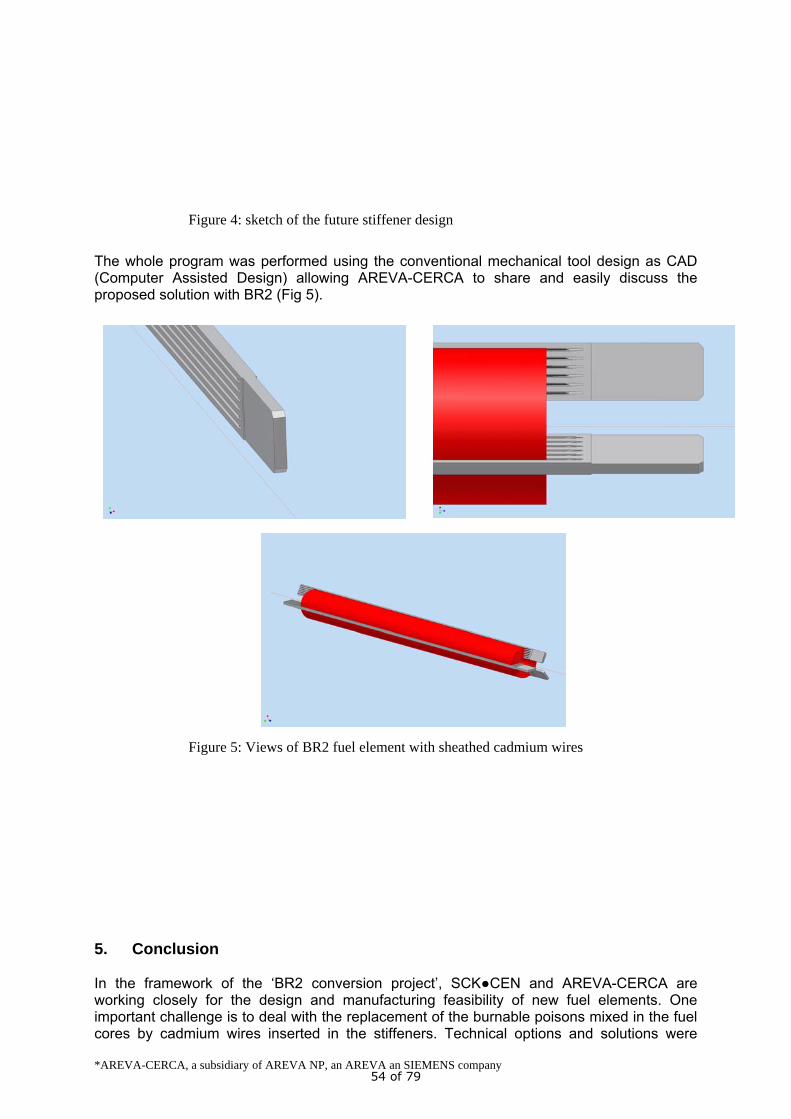
*AREVA-CERCA, a subsidiary of AREVA NP, an AREVA an SIEMENS company
Figure 4: sketch of the future stiffener design
The whole program was performed using the conventional mechanical tool design as CAD (Computer Assisted Design) allowing AREVA-CERCA to share and easily discuss the proposed solution with BR2 (Fig 5). Figure 5: Views of BR2 fuel element with sheathed cadmium wires
5. Conclusion In the framework of the ‘BR2 conversion project’, SCK●CEN and AREVA-CERCA are working closely for the design and manufacturing feasibility of new fuel elements. One important challenge is to deal with the replacement of the burnable poisons mixed in the fuel cores by cadmium wires inserted in the stiffeners. Technical options and solutions were
54 of 79

*AREVA-CERCA, a subsidiary of AREVA NP, an AREVA an SIEMENS company
discussed and validated together, keeping in mind the project target: delivery of 2 prototypes with the new ‘Cd wire’ design at Mol Mid 2010. 6. References [1] S. Kalcheva, E. Koonen, "Optimized BA for the BR2 Reactor", RERTR 2008 – 30th International Meeting On Reduced Enrichment For research And Test Reactors, October 5-9, 2008, Washington D.C., USA. [2] B.Guiot, "Improved BR2 Fuel Cycle With Optimized Burnable Absorber", Master Thesis, Mentors: E.Koonen, S.Kalcheva, Promoter: Prof. J.M.Noterdaeme, BNEN, SCK, Belgium. August, 2008.
55 of 79

EFFECT OF Si ADDITION IN Al IN U-Mo/Al DISPERSION PLATES: OBSERVATIONS FROM SIDE-BY-SIDE IRRADIATIONS
FROM RERTR-6, -7A, -9A AND -9B *
YEON SOO KIM, G.L. HOFMAN Argonne National Laboratory
9700 S Cass Ave, Argonne, IL 60439 – USA
A.B. ROBINSON
Idaho National Laboratory, P.O. Box 1625, Idaho Falls, ID 83415-6188 – USA
ABSTRACT
The interaction layer (IL) thicknesses of four plate pairs with different Si content in the matrix irradiated side-by-side from RERTR-6, -7A, -9A and -9B were compared. The plate pairs from each test have the same fabrication and irradiation condition (temperature, fission rate, burnup, etc). The pair from the RERTR-7A showed that a pure-Al matrix plate (R0R010) had three times larger IL thickness on the hot side than a 2% Si-added plate (R2R040). The Si addition also showed that pore formation was effectively suppressed up to around full LEU burnup at typical RERTR test conditions. However, the pair from RERTR-9B (8.5 gU/cm3) with extremely high burnup (119% LEU equiv.) showed that an initial stage of pore formation in plate regions with thick ILs. The minimum as-fabrication Si content that needs to be added to provide the beneficial effect is also assessed.
1. Introduction The concept of adding Si in the Al matrix to reduce interaction layer (IL) growth and suppress the formation of deleterious pores in the ILs has been tested extensively. The out-of-pile [1,2] and in-pile [3-5] tests showed generally consistent results with the theoretical predictions [6-8]. However, direct comparisons for the effect of Si addition using test plates with the same irradiation conditions were not available. In the RERTR program, the effect of Si has been in-pile tested extensively from the RERTR-6 to the RERTR-9B. Some of the results from the RERTR-6 and RERTR-7A were reported previously [3,4]. In the RERTR-7A, -9A and -9B, pairs of plates with different Si contents were tested side-by-side. From these plates, we could examine more systematically the effect of Si and the minimum Si content necessary to preserve its effectiveness on IL thickness reduction and suppression of pore formation in ILs. The plate pairs from the RERTR-7A have plate-average burnups of about 75% (LEU-equiv.) and 100% for those from the RERTR-9B. The maximum Si content tested in the RERTR program was 5%. Because of the extremely high burnup for the RERTR-9, some plates showed evidence that the as-fabrication Si content in the Al matrix was insufficient to sustain its effectiveness throughout their lives.
* Work supported by US Department of Energy, Office of Global Threat Reduction, National Nuclear Security Administration (NNSA), under Contract DE-AC-02-06CH11357. The submitted manuscript has been authored by a contractor of the U. S. Government under contract NO.DE-AC-02-06CH11357. Accordingly, the U. S. government retains a nonexclusive royalty-free license to publish or reproduce the published form of this contribution, or allow others to do so, for U.S. Government purposes.
56 of 79

The as-fabrication Si contents in the Al matrix used in the tests were decided on the prediction using out-of-pile test results available in the literature [9]. An analysis was performed to estimate the minimum as-fabrication Si content for the plates examined that is necessary throughout their lives. 2. Irradiation test The general test data for the plates used in this paper are summarized in Table 1. It is noticeable that the RERTR-9B test has extremely demanding conditions in terms of fission rate, temperature, and burnup. The information is for dispersion fuel plates used in this paper and not entirely applicable for monolithic fuel plates. RERTR-7A, -9A and -9B included plates with different Si content that were tested side-by-side in the test capsules. Therefore, the plate pairs have the same irradiation condition: temperature, fission rate, and burnup are almost identical.
Table 1 Average irradiation data of plates used in the analyses
Test
U-loading *
(gU/cm3)
enrichment(%U-235)
Meat Temperature
BOL (oC)
Time (EFPD)
Average ** fission rate
(1014 f/cm3-s)
BU *** (% LEU equiv.)
RERTR-6 6 19.5 114 135 3.0 48 RERTR-7A # 6 58 114 90 6.3 72 RERTR-9A 8 58 120 98 5.4 65 RERTR-9B 8.5 44 120 115 7.1 99
* Some information is specific only for dispersion fuel plates. ** The fission rate is for fuel particles averaged over life and plate. *** Meat average, for hot side, typically ~1.2 power factor is multiplied. # RERTR-7A has fuel particle size (~150 μm) and the others have ~90 μm.
Figure 1 shows a schematic of plate locations in test capsules. A pair of plates from the RERTR-6 that had similar irradiation conditions are also included in this paper to extend to the lower burnup regime.
A1 A2 A3 A4
A5 A6 A7 A8
B1 B2 B3 B4
B5 B6 B7 B8
C1 C2 C3 C4
C5 C6 C7 C8
D1 D2 D3 D4
D5 D6 D7 D8
Coolantflow
Coreaxialmid-plane
Burnup
Temperature
Fig. 1 Schematics of plate locations in test capsules applicable to typical RERTR tests
and burnup and temperature profiles. From the RERTR-6, metallographs of R5R020 (C5) having 0.2% Si and R2R010 (C3) having 2% Si are examined. From the RERTR-7A, R2R040 (B2) having 2% Si and R0R010 (B3) having 0.1% Si are examined. The effect of Si-content on IL thickness growth was examined in the
57 of 79

RERTR-9A and -9B. From the RERTR-9A, R3R108 (C2 with 5%Si) and R2R078 (C3 with 2%Si) achieved plate-average fuel particle BU of 64% LEU Equiv. for 98 EFPD. From the RERTR-9B, R2R088 (B6 with 2%Si) and R6R018 (B7 with 3.5%Si) have plate-average BU of 100% LEU Equiv. for 115 EPFD. 3. Results The effect of the Si addition to the matrix for suppressing IL growth is clearly distinguishable when we compare the microstructures of the post-irradiation metallographs of pairs of plates irradiated side-by-side. As shown in Fig. 2, the IL thickness and microstructure are remarkably different between the left-hand-side plate and the right-hand-side plate. The low Si-content plate on the left-hand-side consistently shows a thicker IL than the one with 2% Si-content on the right-hand-side. For the RERTR-6 and -7A, the low Si-content plates consistently give approximately three times thicker ILs than the 2% Si-content plates.
Fig. 2 Postirradiation metallographs of side-by-side test plates from RERTR-6, -7A, -9A and -9B tests. The micrographs are from the hot side and the burnup is at the spot.
The ILs of Si-added plates are commonly uneven and the thicknesses are different among neighboring particles. This is due to the local difference of the IL growth rate caused by the non-
58 of 79

uniform Si diffusion and consequently the non-uniform Si concentration in the IL. In addition, for the fuel particles in densely populated regions, the available amount of Si for diffusion is effectively restricted by the region enclosed by the fuel particles. This also causes Si diffusion to be locally heterogeneous. As the IL grows thicker, the Si effect to suppress its growth diminishes and simultaneously the IL becomes more uniform akin to a low Si-content plate. This suggests that RERTR-9B plates, with extremely high burnup, reached to the point where the IL reduction power of Si addition is depleted. From the RERTR-6, -7A and -9A tests, it is a common observation that U-Mo/Al with addition of 2wt% or more of Si in the matrix are free of pore formation in the ILs. Instead, highly burned fuel particles show the formation of pore-like fission gas bubbles in their peripheries. The pore surface has sharp edges and is rough. However, the extremely high burnup plates from the RERTR-9B show the formation of pores in ILs. As shown in the bottom row of Fig. 2, these pores are generally smooth and located in the ILs. Figure 3 compares IL thicknesses and microstructures of plates with 2% Si addition having different burnups. The IL thickness gradually increases with burnup and time and, as R2R078 and R2R088 show, the IL thickness appears to reach a critical point where pores form in the ILs at high burnup. We believe that deficiency in Si content in the ILs is the reason for this change.
Fig. 3 Comparison of microstructures of plates with 2wt%Si additions at similar temperature.
4. Discussion Unlike in the out-of pile tests [1], Si accumulation in the ILs is weak from some tests with a low process-temperature and a low fission rate [9]. Keiser et al. [10] observed that the IL thickness measured in low temperature regions in Si-added plates was predominantly formed during fabrication. Ryu et al. [11] also suggested that a preferential Si diffusion during irradiation is
59 of 79

small in a plate having a low fission rate and, hence, typically a low temperature. These observations suggest that Si accumulation in the ILs occurs primarily during a heating process of the fabrication stage and additionally by fission enhanced diffusion when the fission rate is high. It is fortunate that the Si diffusion is fast in a plate with a high fission rate and therefore high temperature in which the effectiveness of Si addition is needed the most. The IL thicknesses observed in R2R040 and other plates with 2wt% or more Si addition is small, smaller than in U3Si2/Al at the same condition. This remarkable effectiveness of Si addition is similar to the test results by Ugajin [12], although he added Mo in U3Si2. Ugajin observed that U3Si2+0.5wt%Mo/Al dispersion grew thinner ILs than U3Si2/Al dispersion. This observation and the present result show that Si has a superior effectiveness when combined with Mo. As discussed earlier, no porosity was observed in the ILs in plates with the addition of 2wt% or more Si to a burnup close to 90%. This stability improvement by the presence of Si in the IL was theorized by Ryu [13]. Ryu showed that the enthalpy of formation of IL decreases, or becomes a larger negative number, when Si is added to the IL. The average bond strength typically increases with decreasing enthalpy of formation, by which the viscosity of the IL increases to better retain fission gas. However, as the IL thickness increases, Si deficiency eventually will occur in the IL. Then, the IL growth rate increases and pores may form in the ILs as observed in R2R088 and R6R018 from the RERTR-9B. In order to estimate the minimum as-fabrication Si content to avoid the Si deficiency, we assume the following: (1) Fuel particles have a uniform size (~90 μm) and distribution in the meat. (2) Thermal diffusion during fabrication reaches equilibrium. (3) For conservative results, fission enhanced diffusion is neglected. (4) By analogy to UAl3 [14], the minimum Si concentration is 5at% in the IL. (5) The amount of Si diffused into the ILs is equal to the amount in the ILs. Figure 4 shows the estimated Si contents in ILs for two IL thicknesses that have as-fabrication Si content of 2% in the Matrix. As shown in Fig. 4(b), the estimated Si content in ILs is slightly higher for the high U-loading cases than the minimum Si content. This overprediction suggests that some of the assumptions for the model may be unrealistic. The inhomogeneity of fuel particle size and distribution seems to be the most sensitive assumption.
U-loading (gU/cm3)
5 6 7 8 9
IL v
olum
e fra
ctio
n
0.0
0.2
0.4
0.6
0.8
1.0
Si c
onte
nt in
IL (%
)
0
2
4
6
8
10
U-loading (gU/cm3)
5 6 7 8 9
IL v
olum
e fra
ctio
n
0.0
0.2
0.4
0.6
0.8
1.0
Si c
onte
nt in
IL (%
)
0
2
4
6
8
10
(a) IL = 5 μm and 2% as-fabrication Si in Al (b) IL = 9 μm and 2% as-fabrication Si in Al Fig. 4 Estimated Si content in IL for Al-2wt% as-fabrication Si for typical RERTR test
condition. The broken lines indicate the minimum Si content in the IL necessary for the Si addition to be effective.
60 of 79

Recently, fuel relocation induced by creep has been observed at the fuel transverse edge region close to the rail [15]. Because of fuel accumulation at the ‘hot side’ of the transverse cross sections where the micrographs were obtained, a tensile stress in the thickness direction builds up and is thought to adversely enhance pore formation. This also contributes to the discrepancy between observation and estimation. The high U-loading of the RERTR-9A and -9B restricts the absolute amount of Si available for diffusion. This is considered the reason why RERTR-9A plates showed thicker ILs and earlier pore-formation than RERTR-7A plates (see Fig. 3). High U-loading and particle size distribution have a significant effect that limits the full use of the advantage of Si addition. Therefore, increasing the as-fabrication Si content must accompany a method to provide Si where it is needed most. The observation in R6R018 from the RERTR-9B indicates that the addition of 3.5% Si is locally insufficient, suggesting that the addition of at least ~4% as-fabrication Si content is necessary for U-loading greater than 8 gU/cm3 and irradiation conditions similar to RERTR-9B. 5. Conclusions The side-by-side irradiations of plates with various Si contents showed the efficacy of Si addition in the Al matrix to reduce IL growth and suppression of the formation of pores in the ILs. Plates with 2% Si addition have IL thicknesses a factor of three smaller than those without Si. An analysis shows that 2% Si addition in the matrix is sufficient to sustain the Si effect during irradiation under typical conditions. However, in a plate with 3.5% Si addition from the RERTR-9B that had high U-loading (8.5 gU/cm3) and extremely high burnup (119% LEU equiv.), IL grew thicker than normal and pore started to form because of the insufficient Si content in ILs. Therefore, for a practical purpose, the addition of at least ~4% as-fabrication Si content appears to be necessary for U-loading greater than 8 gU/cm3 and irradiation conditions similar to RERTR-9B. 6. References [1] M. Mirandou, S. Arico, L. Gribaudo, S. Balart, RERTR Meeting, 2005. [2] J.M. Park, H.J. Ryu, S.J. Oh, D.B. Lee, C.K. Kim, Y.S. Kim, G. L. Hofman, RERTR
Meeting, 2006. [3] G.L. Hofman, Y.S. Kim, J. Rest, M.R. Finlay, RRFM Meeting, 2006. [4] G.L. Hofman, Y.S. Kim, H.J. Ryu, D. Wachs, M.R. Finlay, RERTR Meeting, 2006. [5] Y.S. Kim, H.J. Ryu, G.L. Hofman, S.L. Hayes, M.R. Finlay, D. Wachs, G. Chang RERTR
Meeting, 2006. [6] G.L. Hofman, M.R. Finlay, Y.S. Kim, RERTR Meeting, 2004. [7] Y.S. Kim, G.L. Hofman, H.J. Ryu, J. Rest, RERTR Meeting, 2005. [8] J. Garces, G. Bozzolo, G. Hofman, J. Rest, RERTR Meeting, 2005. [9] J.M. Park, H.J. Ryu, C.K. Kim, Y.S. Kim, RRFM Meeting, 2008. [10] D.D Keiser, J.F. Jue, RERTR Meeting, 2008. [11] H.J. Ryu, J.M. Park, C.K. Kim, Y.S. Kim, RERTR Meeting, 2008. [12] M. Ugajin, M. Akabori, A. Itoh, H. Someya, T. Nakagawa, K. Ohsawa, RERTR Meeting,
1992. [13] H.J. Ryu, Y.S. Kim, G.L. Hofman, J.M. Park, C.K. Kim, J. Nucl. Mater., 358 (2006) 52. [14] W.C. Thurber and R.J. Beaver, ORNL-2602, Oak Ridge National Laboratory, 1959. [15] G.L. Hofman, Y.S. Kim, A.B. Robinson, RRFM Meeting, 2009.
61 of 79

Micro-XRD coupled with SEM+EDS characterization of U-Mo/Al-Si diffusion couples
J. Allenou, H. Palancher, X. Iltis, E. Welcomme, Ph. Martin, F. Charollais, M.C. Anselmet
CEA/Cadarache, DEN/DEC, 13108 Saint Paul Lez Durance - France
M. Cornen, O. Tougait
Université de Rennes 1, UMR-CNRS 6226, Campus de Beaulieu, 35042 Rennes Cedex - France
R. Tucoulou ESRF, 6 rue Jules Horowitz, 38042 Grenoble - France
P. Lemoine
CEA/Saclay, DEN/DSOE, 91191 Gif sur Yvette - France
ABSTRACT
A set of U-Mo7/Al-Si diffusion couples, with silicon content going from 2 wt% to 10 wt% were obtained by thermal annealing. These couples were systematically characterized by SEM+EDS and by µ-XRD. Thanks to these characterizations, we have shown that two main types of interaction layers (ILs) are evidenced, depending on the silicon content in the aluminium alloy, with a threshold value of about 5 wt%. Below the threshold value, the ILs are three-layered, with : a first sub-layer, close to U-Mo, containing the UAl3 + U6Mo4Al43 phases, an intermediate one with the U(Al,Si)3 phase and a third one, close to Al-Si, with the U(Al,Si)3 + UMo2Al20 phases. Above this threshold, the ILs are mainly bi-layered, with an U(Al,Si)3 + U3Si5 sub-layer, close to U-Mo, and an U(Al,Si)3 + UMo2Al20 sub-layer, close to Al-Si. A mechanism is proposed for explaining the formation of these two types of ILs.
1. Introduction U-Mo/Al dispersed fuel is developed as an high-uranium-density for Materials Testing Reactors (MTR) cores. In operating conditions, a reaction between U-Mo particles and the Al matrix occurs and can lead to a poor irradiation behaviour [1]. The addition of Si into the Al matrix seems to be a promising solution for solving this problem. Microstructural examinations carried out on interaction layers (IL) formed between U-Mo and Al-Si, after out-of-pile and in-pile tests, have shown that the decrease of the interaction rate seems to be linked to a silicon accumulation process in the IL (see for example [2-9]). However, these results differ in terms of Si accumulation level and Si gradient throughout the IL (this IL being multi-layered, in certain cases), depending on the Si content of the Al-Si alloy and the interaction conditions (temperature, irradiation or not, type of samples : diffusion couples or fuel plates with dispersed U-Mo particles). Many questions remain also open concerning the Si-rich phases present in the U-Mo/Al-Si interaction zones. To our knowledge, the most detailed study concerning the Si-rich phases identification, in the U-Mo/Al-Si ILs, was performed by Mirandou et al. [2-3], thanks to synchrotron characterization of diffusion couples. The authors have shown that, at 550°C, the IL developed between an U-7wt%Mo alloy and an Al-7.1wt%Si alloy has two sub-layers : the first one, located close to the Al-Si alloy, comprises the U(Al,Si)3 main phase and the second one, more Si-enriched, is located close to the U-Mo side of the couple and comprises an U3Si5 phase, mixed with an unidentified one. At 340°C, on thinner ILs, U3Si5 phase was also found in a U-7wt%Mo/Al-0,6%Si couple. Our previous work, also performed on U-Mo/Al-Si diffusion couples, has shown that two main types of ILs could exist, depending on the Si content of the Al alloy [4-5]. This complementary study is aimed to achieve a better knowledge of the microstructural
62 of 79

characteristics of ILs obtained in U-Mo/Al-Si diffusion couples, depending on the silicon content (from 2wt% to 10 wt%) in aluminium. A special attention is given to the stratification of the ILs. For this purpose : - the ILs are first studied by SEM+EDS, in order to determine the layers and sub-layers thicknesses and elementary compositions, - µ-XRD characterizations are then performed on areas of the ILs previously characterized. 2. Experimental details 2.1. Raw materials U-Mo alloys : homogenized arc melted ingots of γU-Mo, containing 7 wt.% Mo (U-Mo7), were supplied by AREVA-CERCA (a subsidiary of AREVA NP) fuel manufacturer. Some uranium carbides (UC phase) are precipitated in the γ matrix. Al alloys : aluminium alloys, with a Si content ranging from 2 to 10 wt% (see Table I) were supplied by ALCAN (France), in the form of rolled plates (thickness ~ 3 mm). At reception state, Si precipitates can be either inter- or intra-granular, depending on the alloys. After an heat treatment of 2 hours at 450°C (corresponding to that used for preparing diffusion couples), the Al grain size increases more or less sharply and reaches a few hundreds of micrometers. The Si precipitates also become larger and are only intergranular (Figure 1). 2.2. Diffusion couples preparation Diffusion couples were prepared with samples of approximately 2 x 5 x 5 mm3, cut out from U-Mo ingots and Al alloys plates. Both parts were mechanically polished (to a final mirror polished state) and chemically etched. During the annealing, they were maintained in contact thanks to a clamping device. Two sets of 4 couples (one per Al-Si alloy) were prepared : - the first one was annealed at 450°C for two hours, under Ar + 5 % H2 atmosphere, in order to induce the U-Mo/Al-Si interaction process, - the second one underwent the same heat treatment + a complementary annealing of 2 months at 350°C (performed in vacuum sealed fused quartz tubes). The first annealing conditions were chosen for obtaining relatively thick ILs, with well defined stratifications (at least, in certain cases). The aim of this choice was to try to obtain, as far as possible, a "complete" interaction system, in terms of concentration gradients and phases involved in the process. The second long annealing at a lower temperature was performed in order to obtain a better equilibrium state and study potential modifications in the IL characteristics without a significant increase in thickness of this area. 2.3. Characterizations After their annealing, the diffusion couples were polished in cross-section. Each couple was characterized by SEM+EDS (Philips XL30 FEG SEM + EDAX EDS system), for determining the IL thickness, its possible stratification (presence of sub-layers) and its local elementary composition at different locations, by reference to the Al-Si and the U-Mo interfaces. The characterized areas were then marked with Vickers micro-indentations, in order to be able to localize them precisely, for further µ-XRD characterization.
BalanceAl
0.21 FeOther (wt%)
107.452Si (wt%)
4045(Al-Si10)
4343(Al-Si7)
4043(Al-Si5)
Al98-Si2(Al-Si2)
Al alloy
Table I : Al alloys composition.200 µm
Figure 1 : Al-Si5 microstructure after annealing(450°C – 2h) - optical microscopy.
BalanceAl
0.21 FeOther (wt%)
107.452Si (wt%)
4045(Al-Si10)
4343(Al-Si7)
4043(Al-Si5)
Al98-Si2(Al-Si2)
Al alloy
Table I : Al alloys composition.
BalanceAl
0.21 FeOther (wt%)
107.452Si (wt%)
4045(Al-Si10)
4343(Al-Si7)
4043(Al-Si5)
Al98-Si2(Al-Si2)
Al alloy
Table I : Al alloys composition.200 µm200 µm
Figure 1 : Al-Si5 microstructure after annealing(450°C – 2h) - optical microscopy.
63 of 79

The µ-XRD measurements were performed in reflection mode, on the ID22 beam line at the ESRF (European Synchrotron Radiation Facility) in Grenoble (France). To fulfil safety requirements, samples were conditioned under kapton tape. The photon energy was set to 17 keV and the beam size on the samples was of the order of 2x20 µm2. The length of the beam print was positioned parallel to the reaction front and the sample was moved µm per µm, perpendicularly to this front, between each acquisition. 3. Results 3.1. SEM+EDS characterization of ILs As previously shown by M. Cornen et al. [4-5], in the conditions used in this work for performing interdiffusion annealings, the IL thickness decreases when the Si content in Al increases, with a threlshold value of about 5 wt%, beyond which an increase of the Si content doesn't lead to a significant additional decrease of the IL thickness. SEM+EDS characterizations have shown that this critical value of about 5 wt% is also linked to a significant change in the IL microstructure and composition. That's the reason why two cases were more particularly taken into consideration in this study : - U-Mo7/Al-Si2 couples (Si content : below the threshold value), - U-Mo7/Al-Si7 and U-Mo7/Al-Si10 couples (Si content : above the threshold value). The U-Mo7/Al-Si5 samples will also be shortly described. The results given below are valid for those annealed at 450°C but also for those which underwent a complementary heat treatment at 350°C. Indeed, no significant evolutions of the ILs compositions occurred during this complementary annealing. The ILs thicknesses can vary from one place to the other along the reaction interface, in the same sample or from one sample to another (for the same type of couple and the same annealing). This is due to a relatively high dispersion of the kinetics results, linked to the experimental procedure. All the elementary compositions, determined by EDS, are given in at%. They are only semi-quantitative and, thus, must be considered caustiously especially when low concentrations are measured (of the order of one to a few at%, the accuracy of the measurements being estimated to about 1 at%). Figures 2 and 3 summarise the results obtained on U-Mo7/Al-Si2 and U-Mo7/Al-Si7 diffusion couples, as representative of the two main types of ILs that can be found in the studied samples : - Type 1 (Si content : from 2 to 5 wt%) : characterized by the absence of Si, close to the U-Mo side, a slight and progressive Si enrichment, in the intermediate part of the IL and a Si enrichment of the order of 13 at%, close to Al-Si.
Figure 2 : SEM+EDS typical results obtained on an U-Mo7/Al-Si2 diffusion couple.
Third area U17Mo2Al69Si13 (at%) R (Al+Si /U+Mo) ~ 4.4 Thickness : ~ 12.5% of total IL one
Second area From U17Mo2Al81 to U17Mo2Al78Si3 (at%) Thickness : ~ 75% of total IL one
First area U17Mo2Al81 (at%) Thickness : ~ 12,5% of total IL one Presence of periodic sub-layers
Al-Si2
UMo7
100 µm
64 of 79
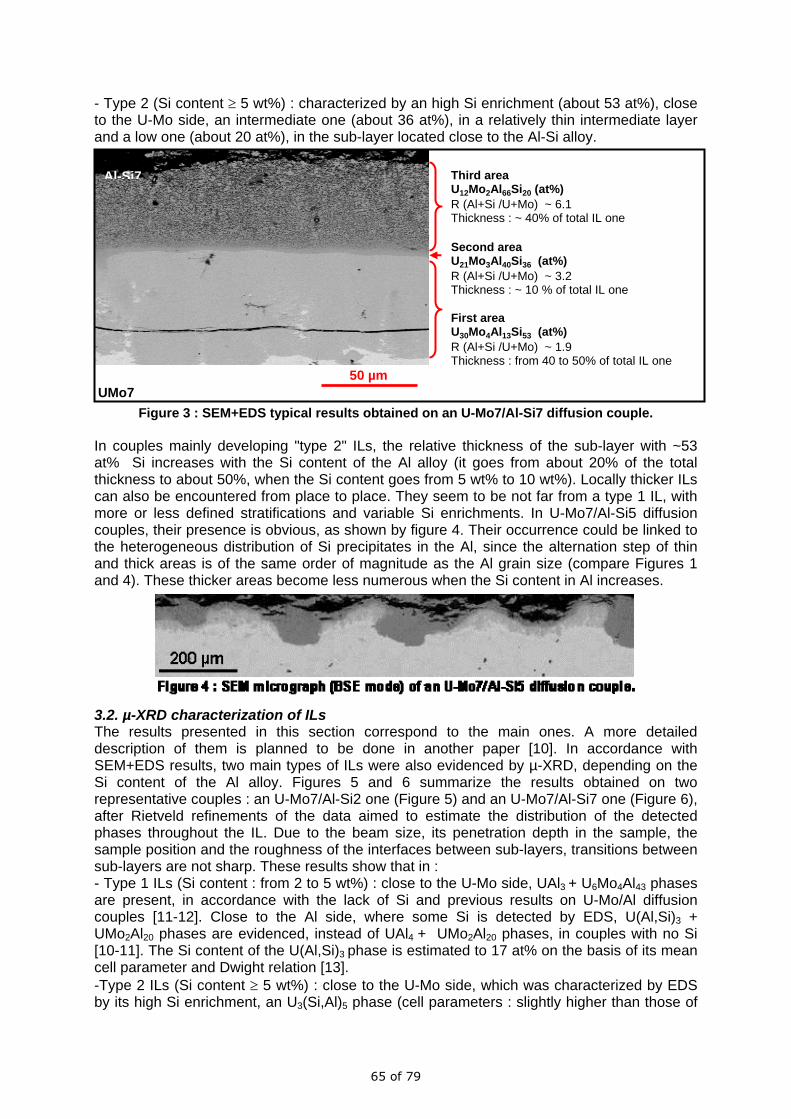
- Type 2 (Si content ≥ 5 wt%) : characterized by an high Si enrichment (about 53 at%), close to the U-Mo side, an intermediate one (about 36 at%), in a relatively thin intermediate layer and a low one (about 20 at%), in the sub-layer located close to the Al-Si alloy.
Figure 3 : SEM+EDS typical results obtained on an U-Mo7/Al-Si7 diffusion couple. In couples mainly developing "type 2" ILs, the relative thickness of the sub-layer with ~53 at% Si increases with the Si content of the Al alloy (it goes from about 20% of the total thickness to about 50%, when the Si content goes from 5 wt% to 10 wt%). Locally thicker ILs can also be encountered from place to place. They seem to be not far from a type 1 IL, with more or less defined stratifications and variable Si enrichments. In U-Mo7/Al-Si5 diffusion couples, their presence is obvious, as shown by figure 4. Their occurrence could be linked to the heterogeneous distribution of Si precipitates in the Al, since the alternation step of thin and thick areas is of the same order of magnitude as the Al grain size (compare Figures 1 and 4). These thicker areas become less numerous when the Si content in Al increases. 3.2. µ-XRD characterization of ILs The results presented in this section correspond to the main ones. A more detailed description of them is planned to be done in another paper [10]. In accordance with SEM+EDS results, two main types of ILs were also evidenced by µ-XRD, depending on the Si content of the Al alloy. Figures 5 and 6 summarize the results obtained on two representative couples : an U-Mo7/Al-Si2 one (Figure 5) and an U-Mo7/Al-Si7 one (Figure 6), after Rietveld refinements of the data aimed to estimate the distribution of the detected phases throughout the IL. Due to the beam size, its penetration depth in the sample, the sample position and the roughness of the interfaces between sub-layers, transitions between sub-layers are not sharp. These results show that in : - Type 1 ILs (Si content : from 2 to 5 wt%) : close to the U-Mo side, UAl3 + U6Mo4Al43 phases are present, in accordance with the lack of Si and previous results on U-Mo/Al diffusion couples [11-12]. Close to the Al side, where some Si is detected by EDS, U(Al,Si)3 + UMo2Al20 phases are evidenced, instead of UAl4 + UMo2Al20 phases, in couples with no Si [10-11]. The Si content of the U(Al,Si)3 phase is estimated to 17 at% on the basis of its mean cell parameter and Dwight relation [13]. -Type 2 ILs (Si content ≥ 5 wt%) : close to the U-Mo side, which was characterized by EDS by its high Si enrichment, an U3(Si,Al)5 phase (cell parameters : slightly higher than those of
UMo7
Al-Si7
50 µm
First area U30Mo4Al13Si53 (at%) R (Al+Si /U+Mo) ~ 1.9 Thickness : from 40 to 50% of total IL one
Second area U21Mo3Al40Si36 (at%) R (Al+Si /U+Mo) ~ 3.2 Thickness : ~ 10 % of total IL one
Third area U12Mo2Al66Si20 (at%) R (Al+Si /U+Mo) ~ 6.1 Thickness : ~ 40% of total IL one
65 of 79

U3Si5 pure phase, probably due to some Al substitution) is found in coexistence with an highly Si enriched U(Al,Si)3 phase (according to its cell parameter [13]). The thin intermediate layer shown by SEM+EDS examinations is not clearly evidenced by µ-XRD measurements, perhaps because it just corresponds to a transition zone, with no specific "signature" in terms of phases. Close to the Al side, as in type 1 ILs, U(Al,Si)3 + UMo2Al20 phases are present, the Si enrichment of the U(Al,Si)3 phase being greater than that found in type 1 ILs. Some α-U is also evidenced in U-Mo : its presence was not systematically noticed and could be linked to a local destabilisation of γU-Mo.
Figure 5 : µ-XRD analysis of an U-Mo7/Al-Si2 diffusion couple. (a) Major phases distribution throughout the IL, (b) simplified summary of the results
Figure 6 : µ-XRD analysis of an U-Mo7/Al-Si7 diffusion couple. (a) Major phases distribution throughout the IL, (b) simplified summary of the results
In U-Mo7/Al-Si5 couples, type 2 areas, with thinner U(Al,Si)3 + U3(Si,Al)5 sub-layers, were also characterized by µ-XRD. No destabilisation of γU-Mo was evidenced beneath these areas, contrary to that observed in U-Mo, by Komar et al, beneath locally thicker IL areas, in U-Mo7/Al 6061 diffusion couples [14]. By comparing the results obtained on diffusion couples annealed at 450°C with those concerning couples which underwent a complementary long annealing at 350°C, we have checked that no significant evolution occurred in both types of ILs, apart an increase of the grain size of the phases, despite of a massive destabilisation of the underlying γU-Mo7 alloy (as expected, by reference to TTT curves [15]).
Al +Si
0
10
20
30
40
50
60
70
80
90
100
0 50 100 150 200Vertical position (µm)
Wei
ght f
ract
ion
(%)
Al
U-Mo
U(Al,Si)3AlUMo2Al20U3Si5UMo7UCUalpha
Al + Si
Al
U(Al,Si)3 (amoy = 4.16 Å 43 at% Si)+ UMo2Al20
U(Al,Si)3 (amoy = 4.17 Å 39 at% Si)+ U3(Si,Al)5
γU-Mo7 + traces (UC…)
(a) (b)
0
10
20
30
40
50
60
70
80
90
100
0 50 100 150 200Vertical position (µm)
Wei
ght f
ract
ion
(%)
Al
U-Mo
U(Al,Si)3AlUMo2Al20U3Si5UMo7UCUalpha
0
10
20
30
40
50
60
70
80
90
100
0 50 100 150 200Vertical position (µm)
Wei
ght f
ract
ion
(%)
Al
U-Mo
U(Al,Si)3AlUMo2Al20U3Si5UMo7UCUalpha
U(Al,Si)3AlUMo2Al20U3Si5UMo7UCUalpha
Al + Si
Al
U(Al,Si)3 (amoy = 4.16 Å 43 at% Si)+ UMo2Al20
U(Al,Si)3 (amoy = 4.17 Å 39 at% Si)+ U3(Si,Al)5
γU-Mo7 + traces (UC…)
Al + Si
Al
U(Al,Si)3 (amoy = 4.16 Å 43 at% Si)+ UMo2Al20
U(Al,Si)3 (amoy = 4.17 Å 39 at% Si)+ U3(Si,Al)5
γU-Mo7 + traces (UC…)
(a) (b)
0
10
20
30
40
50
60
70
80
90
100
0 100 200 300 400 500 600Vertical position (µm)
Wei
ght f
ract
ion
(%)
UAl3U(Al,Si)3AlUMo2Al20U6Mo4Al43UMo7UC
Al U-Mo Al + Si
Al
U(Al,Si)3 (amoy = 4.23 Å 17 at% Si)+ UMo2Al20
UAl3 (amoy = 4.27 Å)+ U6Mo4Al43
γU-Mo7 + traces (UC…)
(a) (b)
0
10
20
30
40
50
60
70
80
90
100
0 100 200 300 400 500 600Vertical position (µm)
Wei
ght f
ract
ion
(%)
UAl3U(Al,Si)3AlUMo2Al20U6Mo4Al43UMo7UC
Al U-Mo
0
10
20
30
40
50
60
70
80
90
100
0 100 200 300 400 500 600Vertical position (µm)
Wei
ght f
ract
ion
(%)
UAl3U(Al,Si)3AlUMo2Al20U6Mo4Al43UMo7UC
UAl3U(Al,Si)3AlUMo2Al20U6Mo4Al43UMo7UC
Al U-Mo Al + Si
Al
U(Al,Si)3 (amoy = 4.23 Å 17 at% Si)+ UMo2Al20
UAl3 (amoy = 4.27 Å)+ U6Mo4Al43
γU-Mo7 + traces (UC…)
Al + Si
Al
U(Al,Si)3 (amoy = 4.23 Å 17 at% Si)+ UMo2Al20
UAl3 (amoy = 4.27 Å)+ U6Mo4Al43
γU-Mo7 + traces (UC…)
(a) (b)
66 of 79

4. Discussion The main contribution of this study, in our point of view, is the underlining of two main types of ILs in the U-Mo/Al-Si interaction system, depending on the Si content in the Al and annealing conditions. Assuming that the reaction product growth occurs at the U-Mo/reaction layer interface, as proposed by Mazaudier et al [11], the oldest part (that formed fistly) of the ILs is that located close to the Al side of the couple. In both types of ILs, it is constituted by U(Al,Si)3 + UMo2Al20 (with a more or less important Si enrichment of the U(Al,Si)3 phase. This tends to show that, at the beginning of the interaction, in all the studied cases, enough Si is present close to the reactional interface for leading to the U(Al,Si)3 + UMo2Al20 phases formation, instead of UAl4 + UMo2Al20 when no Si is present [11-12]. This result confirms that Si acts as an inhibitor of the UAl4 formation, as shown first by Thurber et al [16] and confirmed later by many other authors. At this stage of the interaction process, Al and Si have to diffuse through this U(Al,Si)3 + UMo2Al20 layer in order to react with U-Mo. According to Savchenko et al [17], Si diffuses through U(Al,Si)3 phase much faster than Al. Then, two cases have to be considered in our point of view : - case 1 : Si depletion in Al, in front of the IL, becomes too important for maintaining a sufficient diffusion flux of this specie, through the IL, and the interaction system becomes dominated by Al diffusion (i.e. identical to that observed in U-Mo/Al diffusion couples), - case 2 : despite of a progressive Si depletion in Al, a sufficient Si diffusion flux through the IL can be kept (at least during a certain time), leading to the formation of a silicide phase (U3Si5) close to the U-Mo side. On this basis, the case 1 should logically lead to a type 1 IL and the case 2, to a type 2 IL. Complementary experiments including the characterization of couples obtained after different annealing durations could give interesting clues about these hypotheses. Remembering that, in U-Mo7/Al-Si5 couples ("threshold couples" in this study, according to SEM+EDS results), variations of the IL thickness seem to be linked to the Al grain size, it seems reasonable to assume that the local distribution of Si plays probably also a major role in these phenomena. Studying couples obtained with Al-Si alloys which are characterized by significantly different Si precipitates distributions (if its possible to maintain significant differences at the annealing temperature) could also give additional information about the mechanisms to be considered. Other very important parameters to be taken into account are obviously temperature and time because they influence directly the activation of diffusion processes and especially the diffusion kinetics of Al and Si in Al and in the IL (more especially in the UX3 phase). To our knowledge, data concerning these kinetics are lacking. It would be very interesting to obtain such data and to use them for modelling the thermally activated U-Mo/Al-Si interaction process. To summarize, the occurrence of two types of ILs in U-Mo/Al-Si diffusion couples seem to be directly linked to (i) the Si precipitates distribution in the Al alloy, (ii) the diffusion conditions (temperature and time). That's the reason why the formation of one type of IL or the other cannot be simply associated to a Si threshold value. Discrepancies between the results obtained in this study and those of other authors (see for example [2-3, 18-19]) could be explained on this basis. 5. Conclusions A set of U-Mo7/Al-Si diffusion couples, with silicon content going from 2 wt% to 10 wt% were obtained by thermal annealing. These couples were systematically characterized by SEM+EDS and by µ-XRD. Thanks to these characterizations, we have shown that two main types of interaction layers (ILs) are evidenced, depending on the silicon content in the aluminium alloy, with a threshold value of about 5 wt% (in the conditions tested in this study). Below the threshold value, the ILs are three-layered, with : a first sub-layer, close to U-Mo, containing the UAl3 + U6Mo4Al43 phases, an intermediate one with the U(Al,Si)3 phase and a third one, close to Al-Si, with the U(Al,Si)3 + UMo2Al20 phases. Above this threshold, the ILs
67 of 79
are mainly bi-layered, with an U(Al,Si)3 + U3Si5 sub-layer, close to U-Mo, and an U(Al,Si)3 + UMo2Al20 sub-layer, close to Al-Si. The occurrence of two types of ILs in U-Mo/Al-Si diffusion couples seem to be directly linked to (i) the Si precipitates distribution in the Al alloy, (ii) the diffusion conditions (temperature and time). That's the reason why the formation of one type of IL or the other cannot be simply associated to a Si threshold value. Acknowledgments : C. Jarousse and M. Grasse, from AREVA-CERCA (Romans, France) are gratefully acknowledged for supplying the U-Mo samples used in this study. J. Miragaya and L. Silvestre (CEA/Cadarache) are warmly thanked for diffusion couples preparation. REFERENCES [1]. A. Leenaers, S. Van den Berghe, E. Koonen, C. Jarousse, F. Huet, M. Trotabas, M. Boyard, S. Guillot, L. Sannen, M. Verwerft, J. Nucl. Mater. 335 (2004) 39. [2]. M. Mirandou, S. Arico, S. Balart, L. Gribaudo, A.M. Fortis, in : Proceedings of the 2007 RERTR International Meeting, Prague, Czech Republic, sept. 23-27, 2007 [3]. M. Mirandou, S. Arico, M. Rosenbusch, M. Ortiz, S. Balart, L. Gribaudo, J. Nucl. Mater. 384 (2009) 268. [4]. M. Cornen, M. Rodier, X. Iltis, S. Dubois, P. Lemoine, in : Proceedings of the 2008 RRFM ENS Meeting, Hamburg, Germany, march 2-5, 2008 [5]. M. Cornen, X. Iltis, F. Mazaudier, S. Dubois, P. Lemoine, in : Proceedings of the 2007 MRS Fall Meeting, Boston, USA, nov. 27-29, 2007 [6]. D.D. Keiser, A.B. Robinson, D.E. Janney, J.F. Jue, in : Proceedings of the 2008 RRFM ENS Meeting, Hamburg, Germany, march 2-5, 2008 [7]. A. Leenaers, S. Van den Berghe, S.Dubois, J. Noirot, M. Ripert, P. Lemoine, in : Proceedings of the 2008 RRFM ENS Meeting, Hamburg, Germany, march 2-5, 2008 [8]. A. Leenaers, C. Detavernier, S. Van den Berghe, J. Nucl. Mater. 381 (2008) 242. [9]. J.M. Park, H.J. Ryu, S.J. Oh, D.B. Lee, C.K. Kim, Y.S. Kim, G.L. Hofman, J. Nucl. Mater. 374 (2008) 422. [10] J. Allenou, H. Palancher, X. Iltis et al, to be published. [11]. F. Mazaudier, C. Proye, F. Hodaj, J. Nucl. Mater. 377 (2008) 476. [12]. H. Palancher, Ph. Martin, V. Nassif, R. Tucoulou, O. Prous, J.L. Hazemann, O. Tougait, E. Lahéra, F. Mazaudier, C. Valot, S. Dubois, J. Appl. Cryst. 40 (2007) 1064. [13]. A.E. Dwight, ANL 82-14 report, September 1982. [14]. C. Komar Varela, M. Mirandou, S. Arico, S. Balart, L. Gribaudo, in : Proceedings of the 2007 RRFM ENS Meeting, Lyon, France, 11-15 march, 2007. [15]. P.E. Repas, R.H. Goodenow, R.F. Hehemann, Transactions of the ASM 57 (1964) 150. [16]. W.C. Thurber, R.J. Beaver, ORNL-2602 report, 1959. [17]. A. Savchenko, A. Vatulin, I. Dobrikova, Y. Konovalov, in : Proceedings of the 2006 RRFM ENS Meeting, Sofia, Bulgaria, 30 april – 3 may, 2006. [18]. H.J. Ryu, J.M. Park, C.K. Kim, Y.S. Kim, G.L. Hofman, Journal of Phase Equilibria and Diffusion 27 (2006) 651. [19]. H.J. Ryu, J.M. Park, C.K. Kim, Y.S. Kim, in : Proceedings of the 2008 RERTR International Meeting, Washington D.C., USA, oct. 5-9, 2008.
68 of 79

METHODS OF INCREASING THE URANIUM CHARGE IN FUEL ELEMENTS OF RESEARCH REACTORS
G.A. BIRZHEVOY, A.D. KARPIN, V.V. POPOV, V.N. SUGONYAEV RF State Scientific Centre IPPE
(Bondarenko Sq. 1, 249033, Obninsk, Kaluga Reg., Russia)
ABSTRACT
Based on the analysis of possible ways of the U-Mo/Al fuel composition radiation resistance increasing, we suggested to create the coatings on U-Mo fuel particles for decreasing the radiation damage of Al matrix. Post-reactor tests of U-Mo/Al and U-Mo/Al-12%Si fuel compositions with the Nb, Zr-1%Nb and UO2 barrier layer around the fuel particles irradiated to 60% 235U burn-up at 19,7% fuel enrichment showed their high radiation resistance. Based on these data and results of the calculations, the construction of the fuel element of impregnated type with the Zr-1% Nb alloy cladding with the increased uranium charge was suggested for Russian research reactors. As the fuel particles the U-9% Mo particulates covered with the Nb barrier layer is used, as the matrix material - Al-12% Si alloy. Results of first investigations of given fuel compositions are presented.
1. Introduction Our investigations showed that using the barrier coatings on U-Mo fuel particles and using as the matrix Al-12%Si alloy instead of Al give possibility to increase radiation resistance of U-Mo/Al fuel composition considerably. For high flux research reactors it is necessary to increase the uranium charge at the same time preserving the required level of 235U enrichment. The maximum volume part of fuel particulates charge in extrusive type fuel elements is ~30%, because there is mechanical interaction between the fuel particles during extrusion. In case of using the fuel particles with coatings the mechanical interaction is inadmissible, because it may lead to destruction of the barrier layer. This report presents the results of experimental study of methods of the uranium charge increasing in fuel elements of Russian research reactors. 2. Experimental base of methods of the uranium charge increasing in fuel elements As a result of analysis of possible ways of radiation resistance of U-Mo/Al fuel composition increasing we suggested to create the coatings on U-Mo fuel particles for decreasing the radiation damage of Al matrix [1]. The next variants of fuel compositions were chosen for irradiation (bold type is used for coating materials) [2]:
• U-9%Mo/Al (basic composition); • U-9%Mo/Nb/Al; • U-9%Mo/Zr-1% Nb/Al; • U-9%Mo/UO2/Al • U-9%Mo/Al-12%Si; • U-9%Mo/UO2/Al-12%Si.
Thus, in given experiment we tested the influence of both coatings and Si on the decrease of radiation damage of U-Mo/Al fuel composition. Al-0.3%Si powder and Al-12%Si alloy were used as the matrix. The fuel particles were being coated by Nb and Zr-1% Nb alloy using the plasma method [1]. The barrier layer thickness
69 of 79

was ~ 1-2.5 and 1-2 μm correspondingly. UO2 layer was being produced on fuel particles by oxidizing them at air, the layer thickness was ~ 0.3 μm. Foregoing fuel compositions were being used for fabricating the mini-elements of diameter ~ 10.88-11.0 and height ~ 5.07-5.28 mm. Mini-elements were being irradiated in the interior of the fuel assembly of IVV-2M reactor during 118 days at mean heat flux of 60 W/cm2. The mean fission rate was equal to 4.0×10¹⁴ fis./(cm3·c). The mean fission density of 4.1 ×10²¹ fis./cm3 and the equivalent 235U burn up of 60% have been achieved to the irradiation end. The fuel composition temperature during irradiation process did not exceed 90ºC. Post-irradiation tests confirmed our suggestions [2,3]:
• There were not visible failures on the mini-elements, the bulges on the claddings were not observed. Cracking of the composition was not observed in all cases.
• Coating U-Mo particles by Nb and Zr-1% Nb alloy reduces the swelling of mini-elements (of the basic U-Mo/Al composition) with technically clean Al-0.3%Si matrix by 20-27%, and oxidizing – by ~45%.
• Using the Al-12%Si alloy as the matrix and the particles without the coating leads to the swelling reducing by comparison with the basic composition by 20%, and using the UO2 coatings – more than two times.
• Coating the fuel particles by barrier metallic layers hinders to penetration of U and Mo atoms and also fission fragments from fuel to matrix.
• Gas-filled pores were observed in the basic fuel composition both in the fuel particles and in the interaction layer which width was equal to ~5 μm.
• The width of the interaction layer in U-9%Mo/UO2/Al fuel composition is less by ~10% only by comparison with the basic one, but pores are absent in this layer.
• The interaction layer in U-9%Mo/Nb/Al fuel composition consists of two parts: the Internal one (remnants of Nb coating) with width of 1 μm and external one (Nb3Al, Nb2Al, NbAl3 combinations) which width is equal to 3 μm. There are no pores in these layers.
• The width of the interaction layer in U-9%Mo/Zr-1%Nb/Al fuel composition is ~1 μm. There are no pores in this layer also.
• The mean width of the layer observed around the fuel particles in U-9%Mo/Al-12%Si fuel composition is equal to ~ 4.3 μm. This value is less by ~15% by comparison with the basic fuel composition. Gas-filled pores were not observed.
• The mean width of the layer around the fuel particles in U-9%Mo/ UO2/Al-12%Si fuel composition is equal to ~3.3 μm. This value is less by ~30% by comparison with the basic fuel composition. Gas-filled pores are absent also.
Thus, all barrier coatings which we used decrease the rate of (U,Mo)Alx layer growth. It should note that according to data of the post-reactor tests the thickness of oxidic layer of 0.3 μm is insufficient for protection against the interaction between the Al matrix and components of the fuel particles. Based on these data and results of the calculations [4], we suggest the fuel elements of impregnated type for using as fuel elements for Russian research reactors instead of elements fabricated by the extrusion technique:
• the impregnated fuel element of monolithic type with the Zr-1% Nb alloy cladding; • the fuel composition – the U-9% Mo particulates coated by the Nb protective layer; • the Al-12% Si alloy is used as the matrix material impregnated into the fuel element.
The increased charge of fuel particulates (up to 65% of volume) is the main advantage of impregnated type fuel elements, this value is more than two times larger than analogous characteristic (29%) in extrusive type fuel elements. Moreover, the impregnated type fuel elements possess some other advantages as compared with extrusive type fuel elements with the Al cladding:
• under the impregnating the mechanical interaction between the fuel particles, which is inevitable during the extrusion, is absent; moreover, the integrity of the protective metallic barrier on the particulates is preserved;
70 of 79

• strength properties of Zr-1% Nb alloy exceed considerably (~4 times) the corresponding parameters of Al, that, under other equal conditions, possibly will enable to avoid the bulging of the cladding observed in the fuel elements of extrusive type with the Al cladding at large burn up.
The photographs of cross-section of such fuel element with the fuel particulates coated by Nb are shown in Fig. 1, 2. The mean diameter of the fuel particles is 140 μm. According to metallographic data it is observed:
• good coupling of matrix with both the cladding and the fuel particles; • the fuel particulates distribution is sufficiently uniform; • defects of impregnation are practically absent; • interaction between the cladding and the matrix is absent; • the thickness of the Nb protective layer measured at large magnifications is 2-5 μm; • the single partially destroyed fuel particles have been observed, these particles were
surrounded by zones with increased microhardness and susceptibility to etching which is different from corresponding value for matrix;
• the thickness of the layer of interaction between Nb and Al-12% Si alloy is insignificant.
×43 Figure 1 – Microstructure of the part of tubular fuel element cross-section
Part of fission fragments leaving the fuel particle is defined as 3
b161
b43
⎥⎦⎤
⎢⎣⎡λ−
λ=Ψλ , where
λ – mean fission fragment range, b - mean particle radius. The estimations carried out for particle sizes and protective barrier thicknesses which we have chosen show that ~ 95% of fission fragments flying out the fuel particle stop in the Nb layer which thickness is 3.5 μm; otherwise speaking, only ~ 25% of the whole number formed fission fragments get to the Al-12% Si matrix. Thus, the protective metallic layer around the fuel particles not only prevent the diffusion interaction at the fuel-matrix boundary, but also delay the main part of fission fragments flying out the fuel particles and decrease the degree of matrix radiation damage.
71 of 79

×172 Figure 2 – Microstructure of U-9% Mo / Nb / Al-12% Si fuel core
3. Conclusions 1. Based on the analysis of possible ways of the U-9%Mo/Al fuel composition radiation resistance increasing, results of post-irradiation tests and calculations, the fuel elements of impregnated type are suggested for using as fuel elements for Russian research reactors instead of the elements fabricated by the extrusion technique:
• the impregnated fuel element of monolithic type with the Zr-1% Nb alloy cladding; • the fuel composition – the U-9% Mo particulates coated by the Nb protective layer; • the matrix material impregnated into the fuel element is the Al-12% Si alloy.
The main advantage of impregnated type fuel elements is the increased charge of fuel particulates (up to 65% of volume), this value is more than two times larger than analogous characteristic (~30%) in extrusive type fuel elements. Moreover, the impregnated type fuel elements possess some other advantages as compared with extrusive type fuel elements with the Al cladding:
• under the impregnating the mechanical interaction between the fuel particles which is inevitable during the extrusion is absent; moreover, the integrity of the protective metallic barrier on the particulates is preserved;
• strength properties of Zr-1% Nb alloy exceed considerably (~4 times) the corresponding parameters of Al, that, under other equal conditions, possibly will enable to avoid the bulging of the cladding observed in the fuel elements of extrusive type with the Al cladding at large burn up.
2. The estimations carried out for particle sizes and protective barrier thicknesses which we have chosen show that ~95% of fission fragments flying out the fuel particle stop in the Nb layer which mean thickness is 3.5 μm; otherwise speaking, only ~25% of the whole number formed fission fragments get to the Al-12% Si matrix. Thus, the protective metallic layer around the fuel particles not only prevent the diffusion interaction at the fuel-matrix boundary, but also delay the main part of fission fragments flying out the fuel particles and decrease the degree of matrix radiation damage.
72 of 79
4. References 1. Birzhevoy G.A., Karpin A.D., Popov V.V., Sugonyaev V.N. «Some approaches to solving the problem of diminishing the interaction between U-Mo fuel particles - Al matrix». 10th International Topical Meeting Research Reactor Fuel Managements , 30.04-3-05.06, Sofia, Bulgaria, Transaction European Nuclear Society, p.79-82. 2. Birzhevoy G.A., Popov V.V., Golosov O.A., Shushlebin V.V., Rychkov V.А., Lyutikova М.S. «Results of post-irradiation examination of the (U-Mo)–aluminium matrix interaction rate» 11-th International Topical Meeting Research Reactor Fuel Managements (RFRM) and Meeting of the International Group on Reactor Research (IGORR). Lyon, France, 11-15.03.2007, p.468-472. 3. Golosov O.A., Averin S.А., Lyutikova М.S., Shushlebin V.V., Popov V.V., Birzhevoy G.A. «Electron microscopy tests of barrier coatings on U-9%Mo fuel irradiated up to 60% burn-up». Int. Meeting RERTR-2008, October 5-9, 2008, Washington, D.C. USA (in press). 4. Baranaev Yu.D., Glebow A.P., Karpin A.D., Popov V.V. «Evaluation of the feasibility of applying cermet fuel pins on basis of uranium enriched up to 20% 235U to uprated power research reactors», Transactions 11th International Topical Meeting Research Reactor Fuel Managements (RRFM-2007) and Meeting of the International Group on Reactor Research (IGORR), Lyon, France, 11– 15.03.2007.
73 of 79
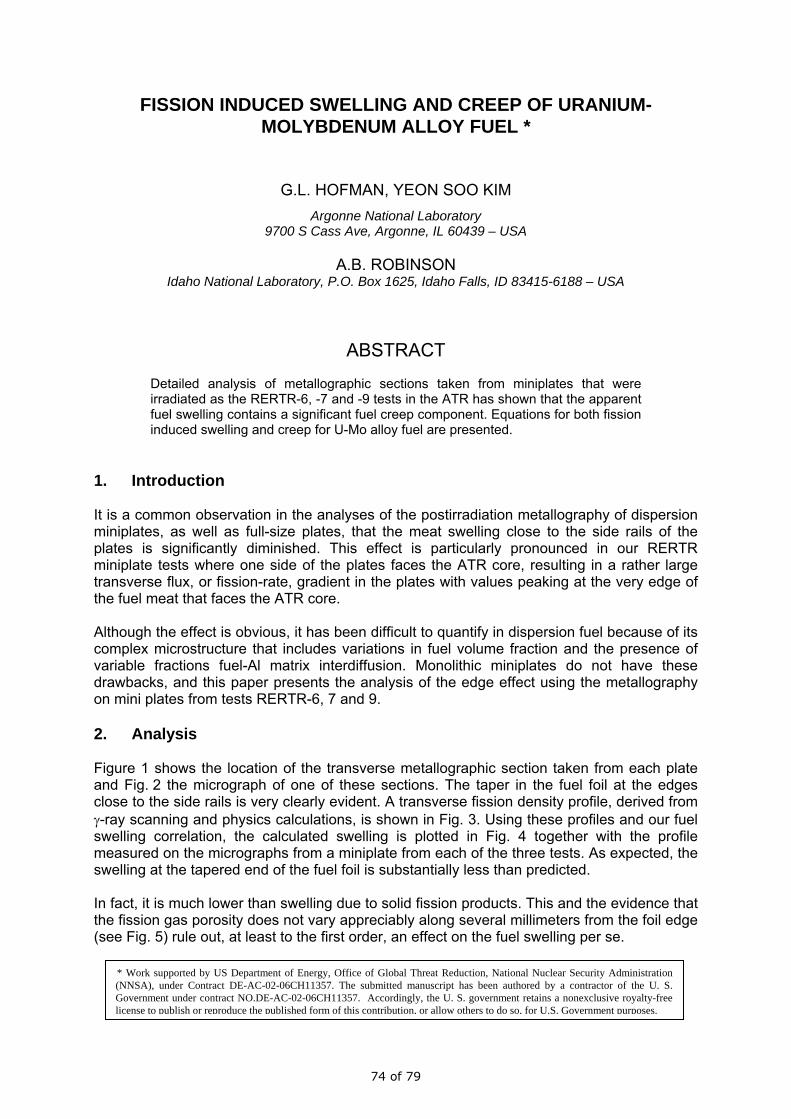
FISSION INDUCED SWELLING AND CREEP OF URANIUM-MOLYBDENUM ALLOY FUEL *
G.L. HOFMAN, YEON SOO KIM Argonne National Laboratory
9700 S Cass Ave, Argonne, IL 60439 – USA
A.B. ROBINSON
Idaho National Laboratory, P.O. Box 1625, Idaho Falls, ID 83415-6188 – USA
ABSTRACT Detailed analysis of metallographic sections taken from miniplates that were irradiated as the RERTR-6, -7 and -9 tests in the ATR has shown that the apparent fuel swelling contains a significant fuel creep component. Equations for both fission induced swelling and creep for U-Mo alloy fuel are presented.
1. Introduction It is a common observation in the analyses of the postirradiation metallography of dispersion miniplates, as well as full-size plates, that the meat swelling close to the side rails of the plates is significantly diminished. This effect is particularly pronounced in our RERTR miniplate tests where one side of the plates faces the ATR core, resulting in a rather large transverse flux, or fission-rate, gradient in the plates with values peaking at the very edge of the fuel meat that faces the ATR core. Although the effect is obvious, it has been difficult to quantify in dispersion fuel because of its complex microstructure that includes variations in fuel volume fraction and the presence of variable fractions fuel-Al matrix interdiffusion. Monolithic miniplates do not have these drawbacks, and this paper presents the analysis of the edge effect using the metallography on mini plates from tests RERTR-6, 7 and 9. 2. Analysis Figure 1 shows the location of the transverse metallographic section taken from each plate and Fig. 2 the micrograph of one of these sections. The taper in the fuel foil at the edges close to the side rails is very clearly evident. A transverse fission density profile, derived from γ-ray scanning and physics calculations, is shown in Fig. 3. Using these profiles and our fuel swelling correlation, the calculated swelling is plotted in Fig. 4 together with the profile measured on the micrographs from a miniplate from each of the three tests. As expected, the swelling at the tapered end of the fuel foil is substantially less than predicted. In fact, it is much lower than swelling due to solid fission products. This and the evidence that the fission gas porosity does not vary appreciably along several millimeters from the foil edge (see Fig. 5) rule out, at least to the first order, an effect on the fuel swelling per se.
* Work supported by US Department of Energy, Office of Global Threat Reduction, National Nuclear Security Administration (NNSA), under Contract DE-AC-02-06CH11357. The submitted manuscript has been authored by a contractor of the U. S. Government under contract NO.DE-AC-02-06CH11357. Accordingly, the U. S. government retains a nonexclusive royalty-free license to publish or reproduce the published form of this contribution, or allow others to do so, for U.S. Government purposes.
74 of 79
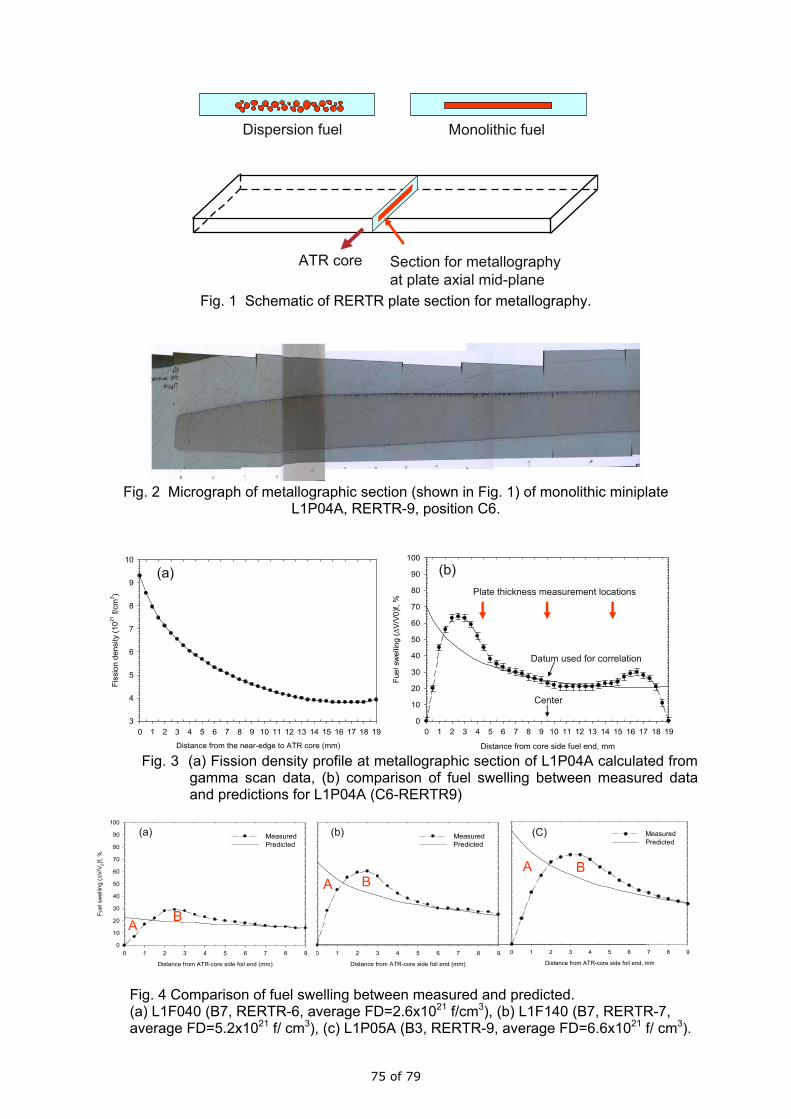
ATR core Section for metallographyat plate axial mid-plane
Dispersion fuel Monolithic fuel
Fig. 1 Schematic of RERTR plate section for metallography.
Fig. 2 Micrograph of metallographic section (shown in Fig. 1) of monolithic miniplate
L1P04A, RERTR-9, position C6.
Distance from core side fuel end, mm
0 1 2 3 4 5 6 7 8 9 10 11 12 13 14 15 16 17 18 19
Fuel
sw
ellin
g (Δ
V/V
0)f,
%
0
10
20
30
40
50
60
70
80
90
100
Center
Datum used for correlation
Plate thickness measurement locations
Distance from core side fuel end, mm
0 1 2 3 4 5 6 7 8 9 10 11 12 13 14 15 16 17 18 19
Fuel
sw
ellin
g (Δ
V/V
0)f,
%
0
10
20
30
40
50
60
70
80
90
100
Center
Datum used for correlation
Plate thickness measurement locations
Distance from the near-edge to ATR core (mm)
0 1 2 3 4 5 6 7 8 9 10 11 12 13 14 15 16 17 18 19
Fiss
ion
dens
ity (1
021 f/
cm3 )
3
4
5
6
7
8
9
10
(a) (b)
Fig. 3 (a) Fission density profile at metallographic section of L1P04A calculated from
gamma scan data, (b) comparison of fuel swelling between measured data and predictions for L1P04A (C6-RERTR9)
Distance from ATR-core side foil end, mm
0 1 2 3 4 5 6 7 8 9
Fuel
sw
ellin
g (Δ
V/V
0)f,
%
0
10
20
30
40
50
60
70
80
90
100
MeasuredPredicted
Distance from ATR-core side foil end (mm)
0 1 2 3 4 5 6 7 8 9
Fuel
sw
ellin
g ( Δ
V/V
0)f,
%
0
10
20
30
40
50
60
70
80
90
100
MeasuredPredicted
Distance from ATR-core side foil end (mm)
0 1 2 3 4 5 6 7 8 9
Fuel
sw
ellin
g (Δ
V/V
0)f,
%
0
10
20
30
40
50
60
70
80
90
100
MeasuredPredicted
(a) (b) (C)
BA
BABA
Fig. 4 Comparison of fuel swelling between measured and predicted. (a) L1F040 (B7, RERTR-6, average FD=2.6x10²¹ f/cm3), (b) L1F140 (B7, RERTR-7, average FD=5.2x10²¹ f/ cm3), (c) L1P05A (B3, RERTR-9, average FD=6.6x10²¹ f/ cm3).
75 of 79

The fuel volume reductions (A in Fig. 4) and the volume enhancement (B in Fig. 4), with respect to the calculated volume, are of the same magnitude. The conclusion is clear that a mass transfer has occurred from A to B. This can only be explained by lateral fission enhanced creep in the fuel as a response to an applied stress.
Fig. 5 Gas bubble morphology of L1P09T-B5.
To estimate this stress, we may picture the cladding as a cantilevered beam anchored in the side rail and loaded by the swelling fuel foil as show in Fig. 6. The appropriate length of the beam is determined for each plate. As shown in Fig. 6, the bending moment M and stress in the cladding increase parabolically to a maximum at the edge of the fuel foil.
h (cladding)σx
maxSide rail P (fuel swelling)
M
0 1 2 3 4 5 mm
Bending Moment,
Px2
M = 2
0 1 2 3 4 5 mm
Mh bh3
σx = , Iz = 2Iz 12
σyAl
σx
x
L1F37T-B4 (RERTR-9)
Fig. 6 Schematic of swelling induced stress at fuel foil edges.
The difficulty in this analysis lies in the determination of the maximum stress σx. For this initial evaluation, we have chosen the yield stress of the cladding. The as-fabricated value for Al 6061 is 140 MPa, but irradiation hardening should increase this to ~280 MPa based on our micro-hardness data. The average fission enhanced creep rate fε& can be determined
76 of 79

because of its Newtonian character; ( ) fAs 1f
&& σ=ε − , where f& is the average fission rate in the fuel. Using the creep strain, 1/3 of the volume change, from Fig. 7, the average stress, and the average fission rate over the affected section of the plates, the average creep rate constant, A, works out to be ~2.5x10⁻²⁵ fission-cm3/MPa for U-10Mo.
Average Fission Density in Affected Region (1021 f/cm3)
0 2 4 6 8 10 12
Fuel
vol
ume
chan
ge (%
)
0
20
40
60
80
100L1F040-R6-B7L2F030-R6-D7L1F140-R7-B7L2F040-R7-D7L1F26C-R9-C1L1F34T-R9-B1L1F32C-R9-C5L1P04A-R9-C6L1P05A-R9-B3L1P08T-R9-D8
tclad=0.45 mm
tclad=0.57 mm6.0
57.0
45.0 =σσ
250-μm foil
500-μm foil
L1F100-R6-D1
L1P04A-R9-C6 (low-flux)
(high-flux)
Fig. 7 Relocated fuel volume (=volumetric strain) versus average fission density in the
affected region. 3. Discussion and conclusions Fission enhanced creep at low homologous temperatures is common in all nuclear fuels and was first identified in α-U in the 1950s by Russian and British workers [1,2], and subsequently in ceramic fuels by various researchers. In all cases the creep rate was found to be athermal, and have a linear dependence on applied stress and fission rate. It is interesting to compare the creep rates of the various uranium fuels. As shown in Table 1, they appear to fall into three groups. Pure uranium stands out with a much higher rate owing to its anisotropic crystal structure which results in high internal stress, during fissioning. Of the remaining four cubic fuels, UC, UN, and U-10Mo have very similar creep rates whereas the rate for UO2 is about a factor of 10 higher. The former three fuels are relatively high-conductivity electron conductors in contrast to UO2.
Table 1 Fission enhanced low temperature creep rate constants in various uranium fuels. ( ) fAs 1
f&& σ=ε − where A is in fission-cm3/MPa.
Fuel A (10-25) ~T/Tm Reference α-U UO2 UC UN
U-10wt%Mo
700 6-10 1-2 2-3 2-3
0.3 0.25 0.3 0.3 0.3
3, 4 5, 6, 7
7 8, 9
Present work
77 of 79
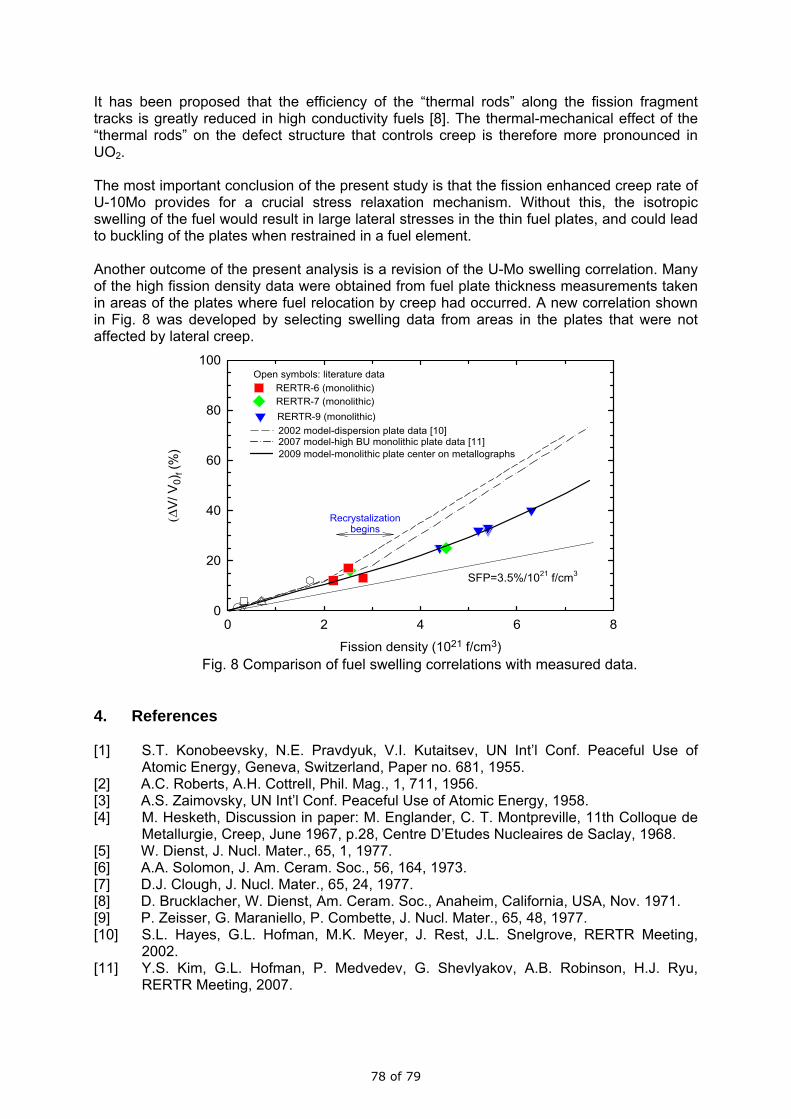
It has been proposed that the efficiency of the “thermal rods” along the fission fragment tracks is greatly reduced in high conductivity fuels [8]. The thermal-mechanical effect of the “thermal rods” on the defect structure that controls creep is therefore more pronounced in UO2. The most important conclusion of the present study is that the fission enhanced creep rate of U-10Mo provides for a crucial stress relaxation mechanism. Without this, the isotropic swelling of the fuel would result in large lateral stresses in the thin fuel plates, and could lead to buckling of the plates when restrained in a fuel element. Another outcome of the present analysis is a revision of the U-Mo swelling correlation. Many of the high fission density data were obtained from fuel plate thickness measurements taken in areas of the plates where fuel relocation by creep had occurred. A new correlation shown in Fig. 8 was developed by selecting swelling data from areas in the plates that were not affected by lateral creep.
Fission density (1021 f/cm3)
0 2 4 6 8
(ΔV
/ V0)
f (%
)
0
20
40
60
80
100
Recrystalizationbegins
Open symbols: literature dataRERTR-6 (monolithic)RERTR-7 (monolithic)
2002 model-dispersion plate data [10]RERTR-9 (monolithic)
2009 model-monolithic plate center on metallographs
SFP=3.5%/1021 f/cm3
2007 model-high BU monolithic plate data [11]
Fig. 8 Comparison of fuel swelling correlations with measured data.
4. References [1] S.T. Konobeevsky, N.E. Pravdyuk, V.I. Kutaitsev, UN Int’l Conf. Peaceful Use of
Atomic Energy, Geneva, Switzerland, Paper no. 681, 1955. [2] A.C. Roberts, A.H. Cottrell, Phil. Mag., 1, 711, 1956. [3] A.S. Zaimovsky, UN Int’l Conf. Peaceful Use of Atomic Energy, 1958. [4] M. Hesketh, Discussion in paper: M. Englander, C. T. Montpreville, 11th Colloque de
Metallurgie, Creep, June 1967, p.28, Centre D’Etudes Nucleaires de Saclay, 1968. [5] W. Dienst, J. Nucl. Mater., 65, 1, 1977. [6] A.A. Solomon, J. Am. Ceram. Soc., 56, 164, 1973. [7] D.J. Clough, J. Nucl. Mater., 65, 24, 1977. [8] D. Brucklacher, W. Dienst, Am. Ceram. Soc., Anaheim, California, USA, Nov. 1971. [9] P. Zeisser, G. Maraniello, P. Combette, J. Nucl. Mater., 65, 48, 1977. [10] S.L. Hayes, G.L. Hofman, M.K. Meyer, J. Rest, J.L. Snelgrove, RERTR Meeting,
2002. [11] Y.S. Kim, G.L. Hofman, P. Medvedev, G. Shevlyakov, A.B. Robinson, H.J. Ryu,
RERTR Meeting, 2007.
78 of 79