Embed Size (px)
Citation preview
Evaluating Estimates of Materials Offshoring from U.S. Manufacturing
Robert C. FeenstraUniversity of California, Davis and NBER
J. Bradford JensenGeorgetown University and NBER
World Bank June 9, 2011
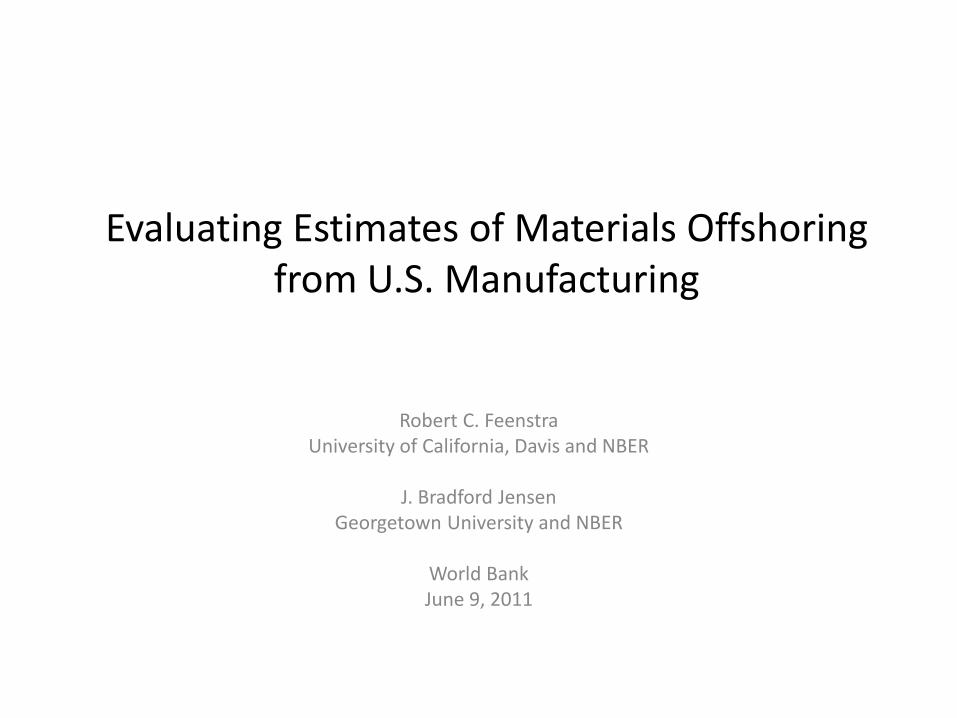
Overview
• “Import Comparability” Assumption
– When materials offshoring is measured by estimating imported intermediate inputs, it is assumed that an industry’s imports of each input, relative to its total demand, is the same as the economy-wide imports relative to total demand
• Examine two alternative approaches:
– Feenstra and Hanson for Intermediates
– Firm-level microdata
3
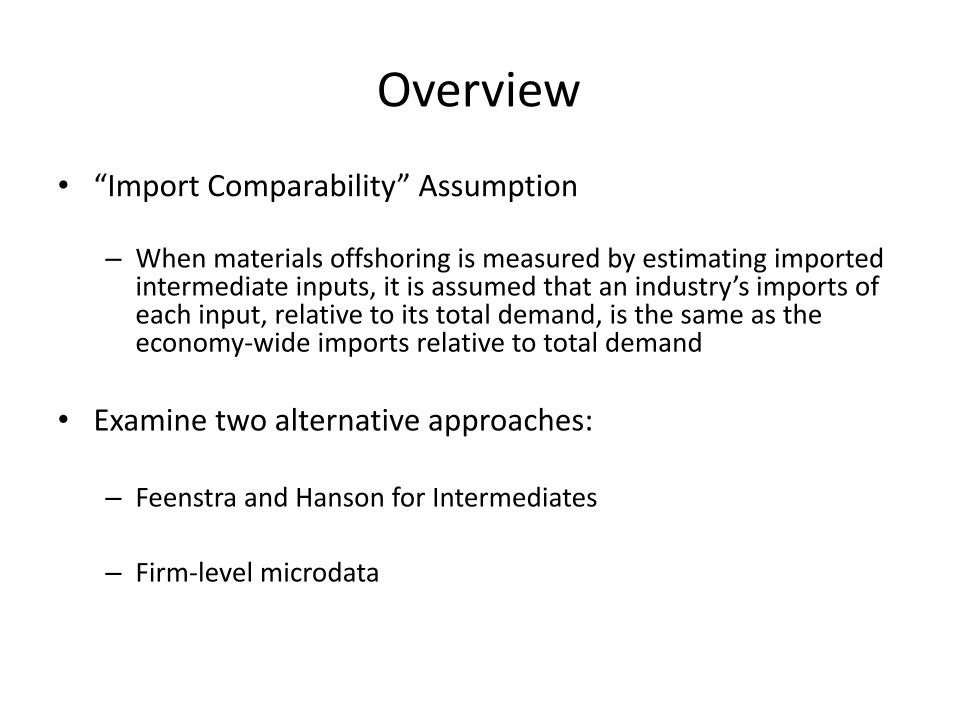
LFTTD
• Linked/Longitudinal Firm Trade Transaction Database
– Transaction-Level Trade Data• Imports and exports• Ten-digit HS product traded• Value, quantity and date of shipment• Destination or source country• “Arm's length” vs “related party” transaction
– Longitudinal Business Database (LBD)• Tax entity and enterprise identity information
– For details, see Bernard, Jensen, and Schott (2009)
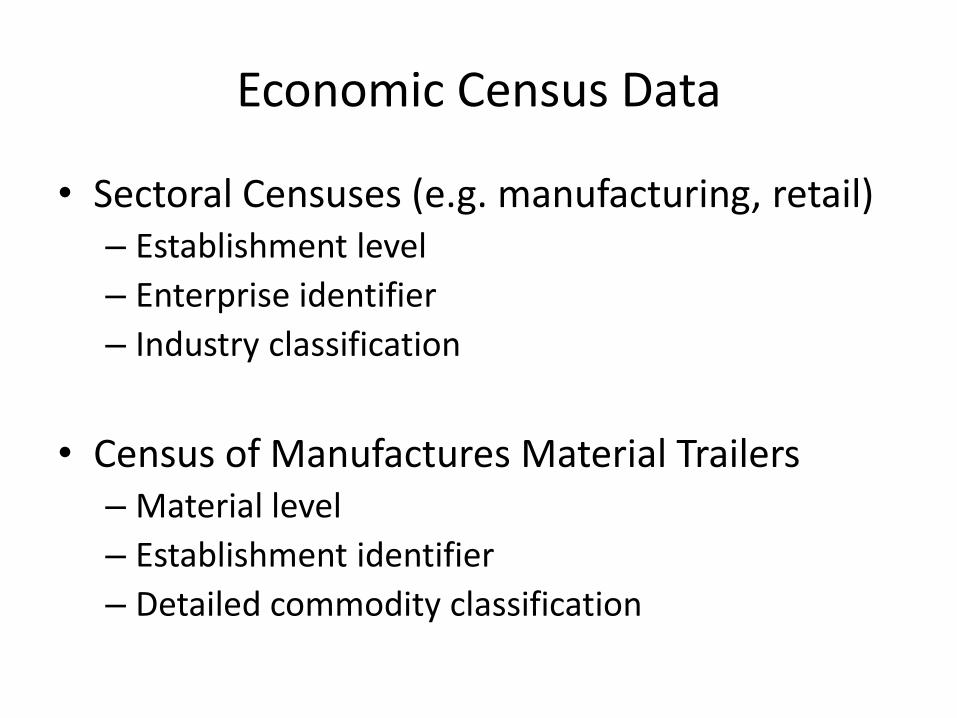
Economic Census Data
• Sectoral Censuses (e.g. manufacturing, retail)– Establishment level
– Enterprise identifier
– Industry classification
• Census of Manufactures Material Trailers– Material level
– Establishment identifier
– Detailed commodity classification
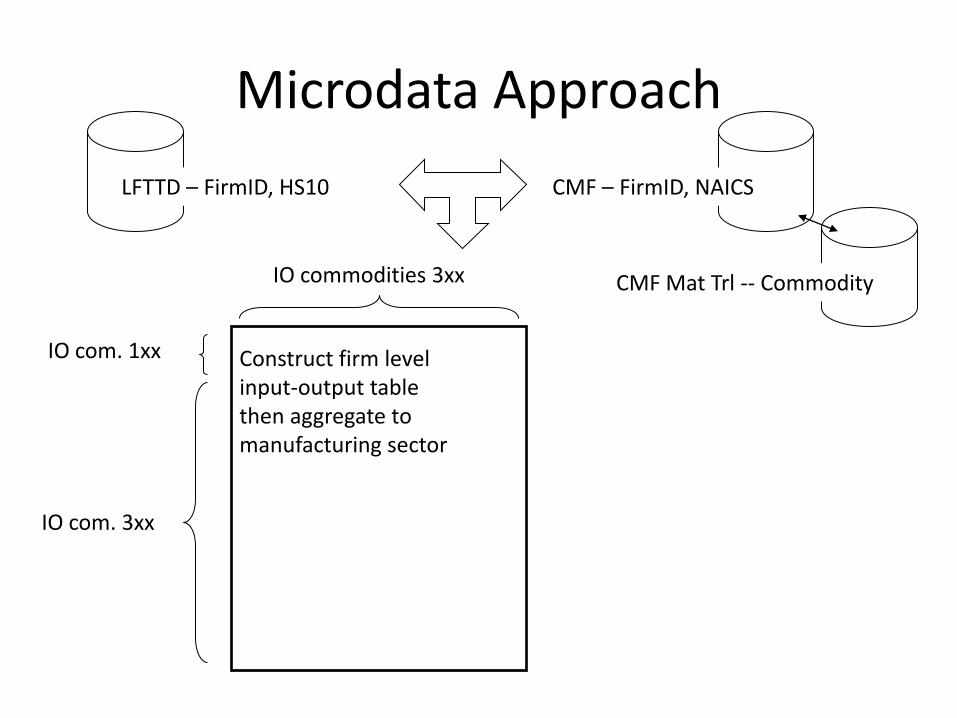
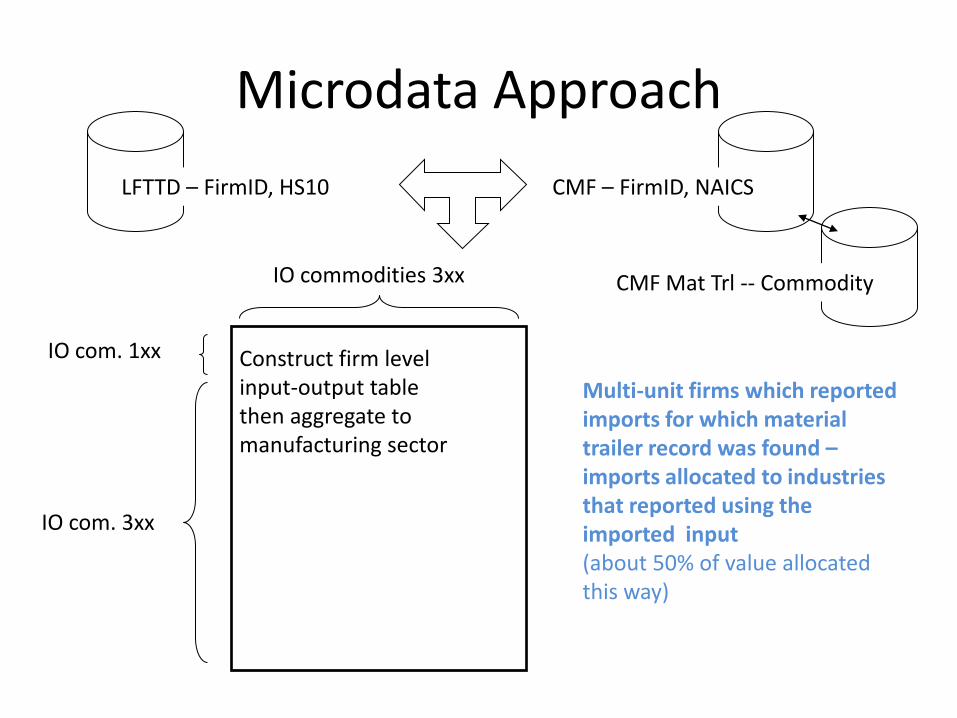
Microdata Approach
LFTTD – FirmID, HS10 CMF – FirmID, NAICS
CMF Mat Trl -- Commodity
Construct firm levelinput-output tablethen aggregate to manufacturing sector
IO commodities 3xx
IO com. 1xx
IO com. 3xx
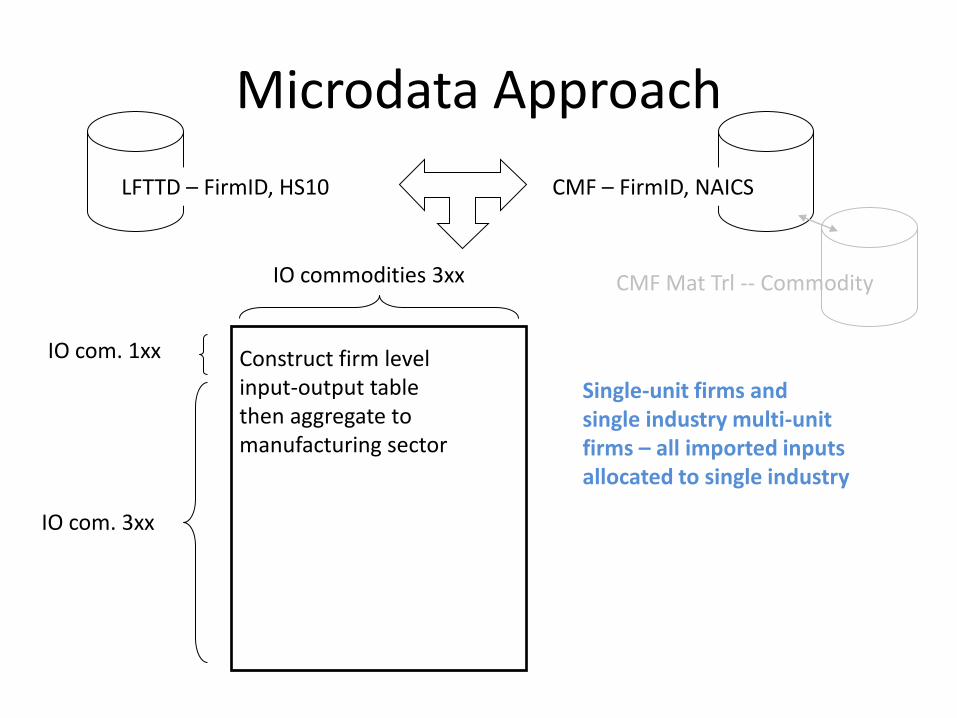
Microdata Approach
LFTTD – FirmID, HS10 CMF – FirmID, NAICS
CMF Mat Trl -- Commodity
Construct firm levelinput-output tablethen aggregate to manufacturing sector
IO commodities 3xx
IO com. 1xx
IO com. 3xx
Single-unit firms andsingle industry multi-unitfirms – all imported inputsallocated to single industry
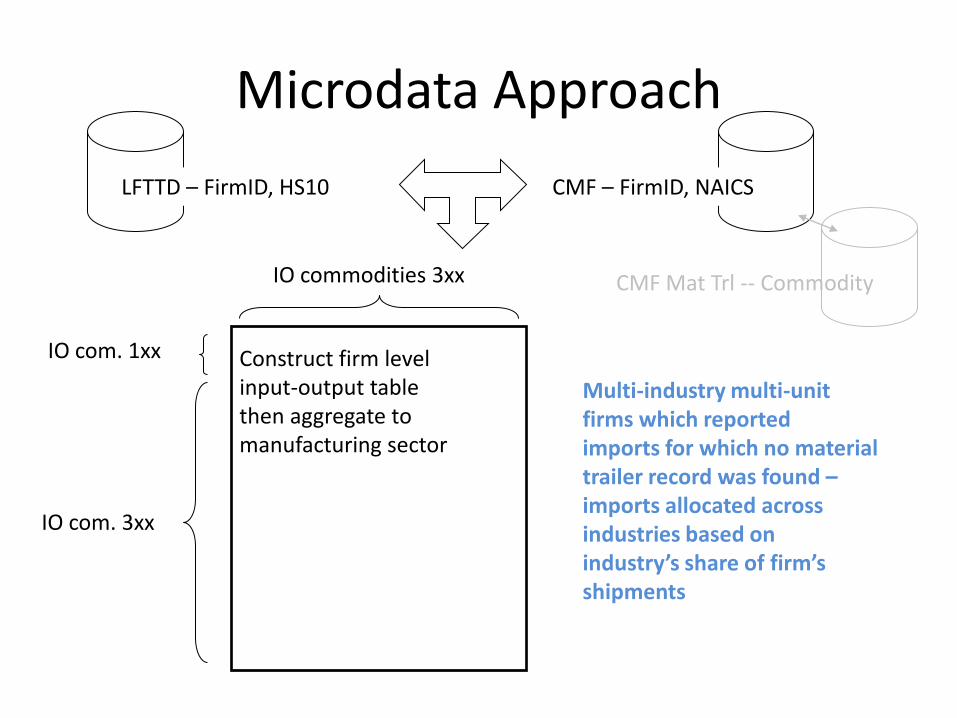
Microdata Approach
LFTTD – FirmID, HS10 CMF – FirmID, NAICS
CMF Mat Trl -- Commodity
Construct firm levelinput-output tablethen aggregate to manufacturing sector
IO commodities 3xx
IO com. 1xx
IO com. 3xx
Multi-industry multi-unit firms which reportedimports for which no material trailer record was found –imports allocated across industries based on industry’s share of firm’s shipments
Microdata Approach
LFTTD – FirmID, HS10 CMF – FirmID, NAICS
CMF Mat Trl -- Commodity
Construct firm levelinput-output tablethen aggregate to manufacturing sector
IO commodities 3xx
IO com. 1xx
IO com. 3xx
Multi-unit firms which reportedimports for which material trailer record was found –imports allocated to industries that reported using the imported input(about 50% of value allocated this way)
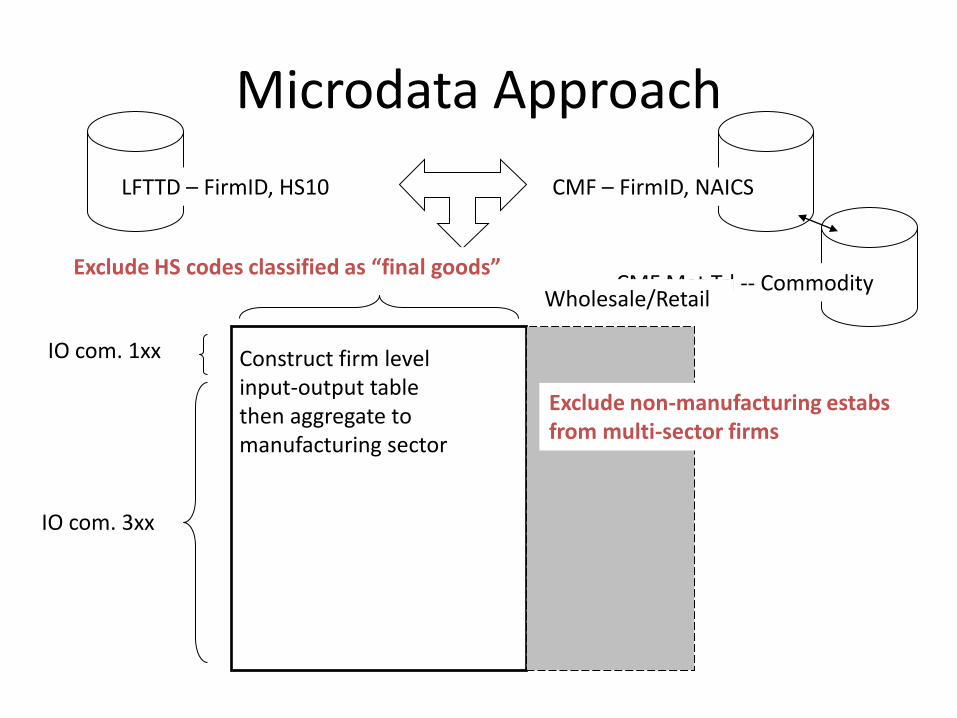
Microdata Approach
LFTTD – FirmID, HS10 CMF – FirmID, NAICS
CMF Mat Trl -- Commodity
Exclude non-manufacturing estabsfrom multi-sector firms
Construct firm levelinput-output tablethen aggregate to manufacturing sector
IO commodities 3xx
IO com. 1xx
IO com. 3xx
Wholesale/Retail
Exclude HS codes classified as “final goods”
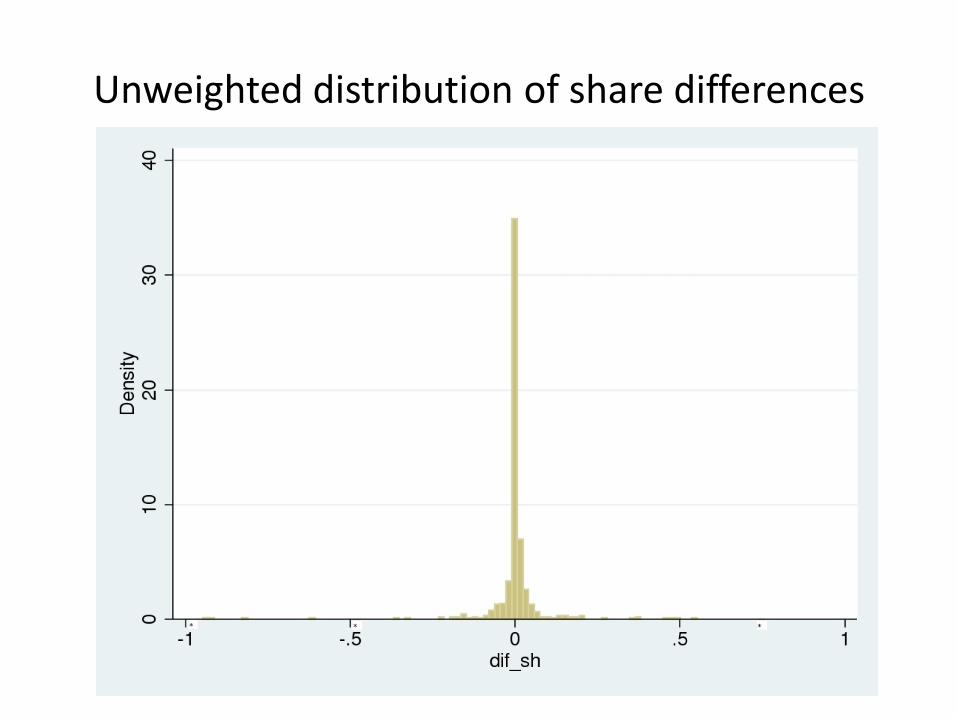
Unweighted distribution of share differences
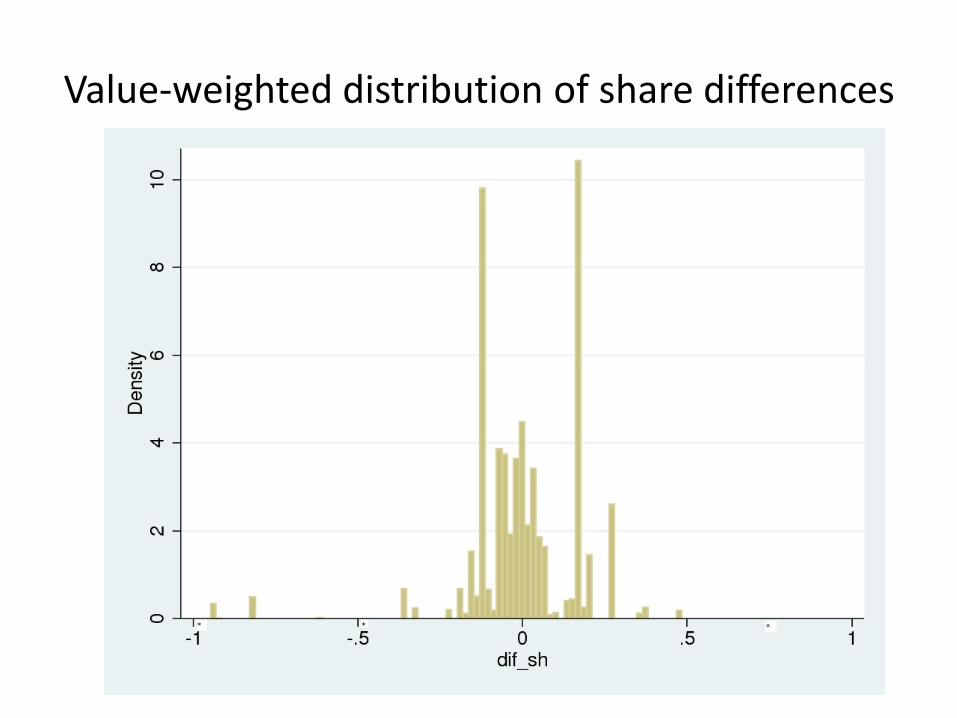
Value-weighted distribution of share differences
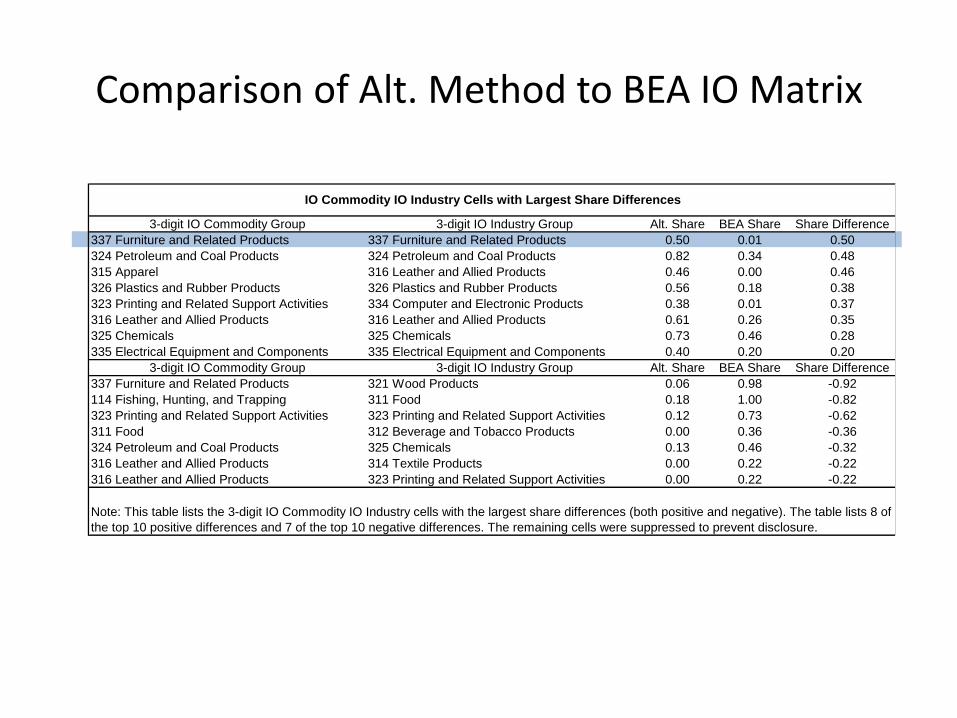
Comparison of Alt. Method to BEA IO Matrix
3-digit IO Commodity Group 3-digit IO Industry Group Alt. Share BEA Share Share Difference
337 Furniture and Related Products 337 Furniture and Related Products 0.50 0.01 0.50
324 Petroleum and Coal Products 324 Petroleum and Coal Products 0.82 0.34 0.48
315 Apparel 316 Leather and Allied Products 0.46 0.00 0.46
326 Plastics and Rubber Products 326 Plastics and Rubber Products 0.56 0.18 0.38
323 Printing and Related Support Activities 334 Computer and Electronic Products 0.38 0.01 0.37
316 Leather and Allied Products 316 Leather and Allied Products 0.61 0.26 0.35
325 Chemicals 325 Chemicals 0.73 0.46 0.28
335 Electrical Equipment and Components 335 Electrical Equipment and Components 0.40 0.20 0.20
3-digit IO Commodity Group 3-digit IO Industry Group Alt. Share BEA Share Share Difference
337 Furniture and Related Products 321 Wood Products 0.06 0.98 -0.92
114 Fishing, Hunting, and Trapping 311 Food 0.18 1.00 -0.82
323 Printing and Related Support Activities 323 Printing and Related Support Activities 0.12 0.73 -0.62
311 Food 312 Beverage and Tobacco Products 0.00 0.36 -0.36
324 Petroleum and Coal Products 325 Chemicals 0.13 0.46 -0.32
316 Leather and Allied Products 314 Textile Products 0.00 0.22 -0.22
316 Leather and Allied Products 323 Printing and Related Support Activities 0.00 0.22 -0.22
Note: This table lists the 3-digit IO Commodity IO Industry cells with the largest share differences (both positive and negative). The table lists 8 of
the top 10 positive differences and 7 of the top 10 negative differences. The remaining cells were suppressed to prevent disclosure.
IO Commodity IO Industry Cells with Largest Share Differences
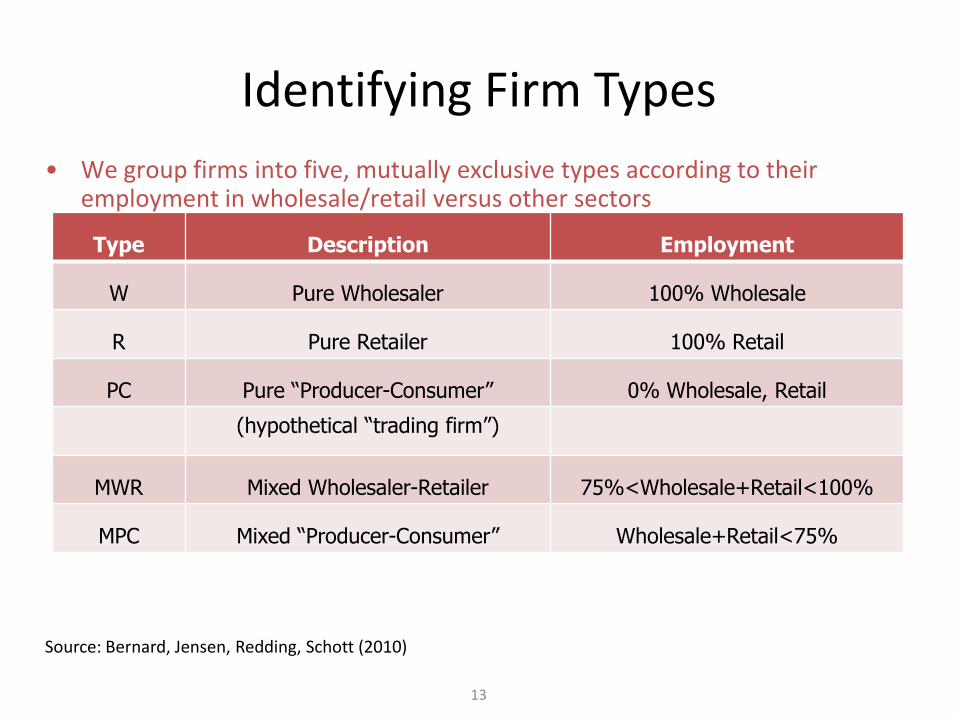
Identifying Firm Types
13
Type Description Employment
W Pure Wholesaler 100% Wholesale
R Pure Retailer 100% Retail
PC Pure “Producer-Consumer” 0% Wholesale, Retail
(hypothetical “trading firm”)
MWR Mixed Wholesaler-Retailer 75%<Wholesale+Retail<100%
MPC Mixed “Producer-Consumer” Wholesale+Retail<75%
• We group firms into five, mutually exclusive types according to their employment in wholesale/retail versus other sectors
Source: Bernard, Jensen, Redding, Schott (2010)
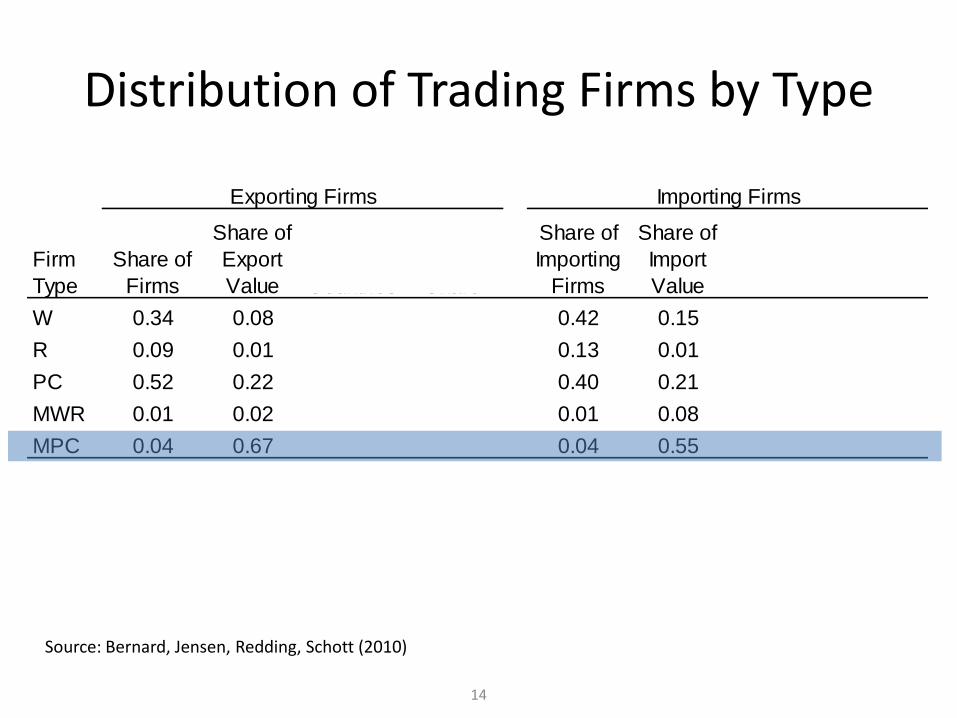
Distribution of Trading Firms by Type
14
Firm
Type
Share of
Firms
Share of
Export
Value
Share of
Product-
Countries
China
Value
Share
Share of
Importing
Firms
Share of
Import
Value
Share of
Product-
Countries
China
Value
Share
W 0.34 0.08 0.45 0.05 0.42 0.15 0.53 0.21
R 0.09 0.01 0.08 0.00 0.13 0.01 0.18 0.35
PC 0.52 0.22 0.58 0.03 0.40 0.21 0.56 0.07
MWR 0.01 0.02 0.11 0.00 0.01 0.08 0.18 0.30
MPC 0.04 0.67 0.60 0.04 0.04 0.55 0.55 0.06
Exporting Firms Importing Firms
Notes: Table reports share of firms, the share of value for which they account, and share of
product-country cells in which they are present, by type of firm (see text). Final column of each
panel reports value exported to or imported from China as a share of total export or import value
for that type of firm, respectively. Data are for 2002.
Source: Bernard, Jensen, Redding, Schott (2010)
Conclusions
• This stuff is hard…
• And confusing….
– How to think about firms with manufacturing operations importing products coded to their industry
• Are these “final goods” or “intermediate inputs”?
– How to think about firms importing products they don’t report using• Are these “final goods” or “intermediate inputs”?
• Need to better understand the role of large, multi-activity firms
– Role of manufacturing and wholesale/retail operations
• Services?

Thank you