Embed Size (px)
Citation preview
Evaluating Risk Adjustment Models
Andy Bindman MD
Department of Medicine, Epidemiology and Biostatistics

Evaluating Model’s Predictive Power
Linear regression (continuous outcomes)
Logistic regression (dichotomous outcomes)
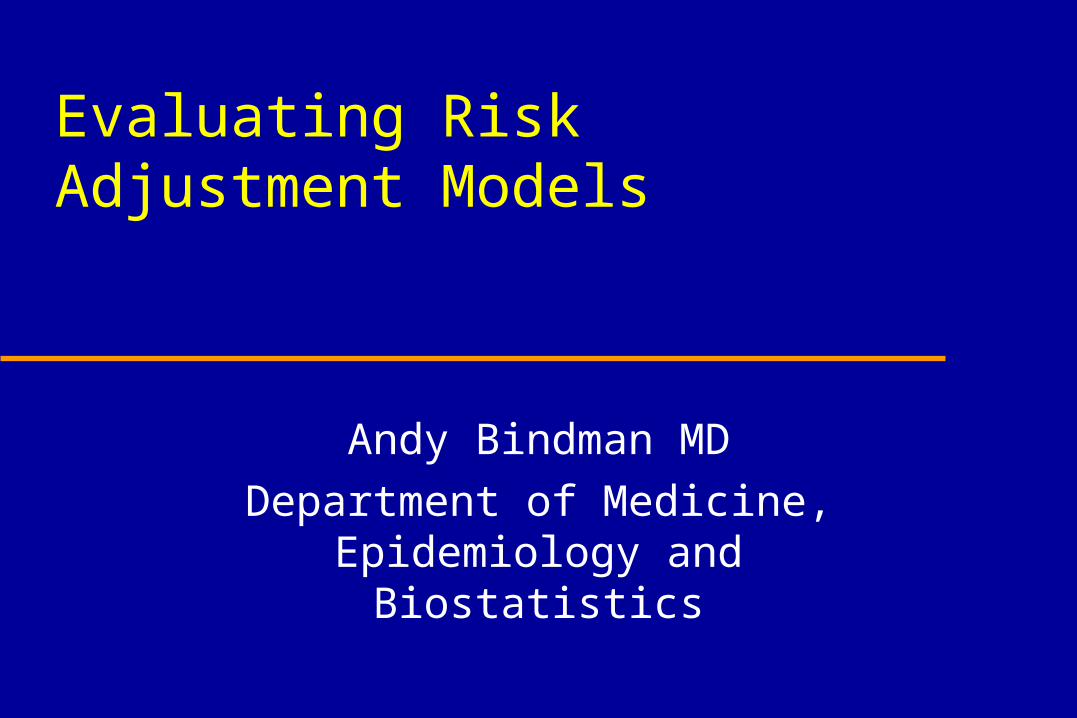
Evaluating Linear Regression Models
R2 is percentage of variation in outcomes explained by the model - best for continuous dependent variables– Length of stay– Health care costs
Ranges from 0-100% Generally more is better

Risk Adjustment Models
Typically explain only 20-25% of variation in health care utilization
Explaining this amount of variation can be important if remaining variation is extremely random
Example: supports equitable allocation of capitation payments from health plans to providers

More to Modeling than Numbers
R2 biased upward by more predictors
Approach to categorizing outliers can affect R2 as predicting less skewed data gives higher R2
Model subject to random tendencies of particular dataset

Evaluating Logistic Models
Discrimination - accuracy of predicting outcomes among all individuals depending on their characteristics
Calibration - how well prediction works across the range of risk

Discrimination
C index - compares all random pairs of individuals in each outcome group (alive vs dead) to see if risk adjustment model predicts a higher likelihood of death for those who died (concordant)
Ranges from 0-1 based on proportion of concordant pairs and half of ties

Adequacy of Risk Adjustment Models
C index of 0.5 no better than random
C index of 1.0 indicates perfect prediction
Typical risk adjustment models 0.7-0.8
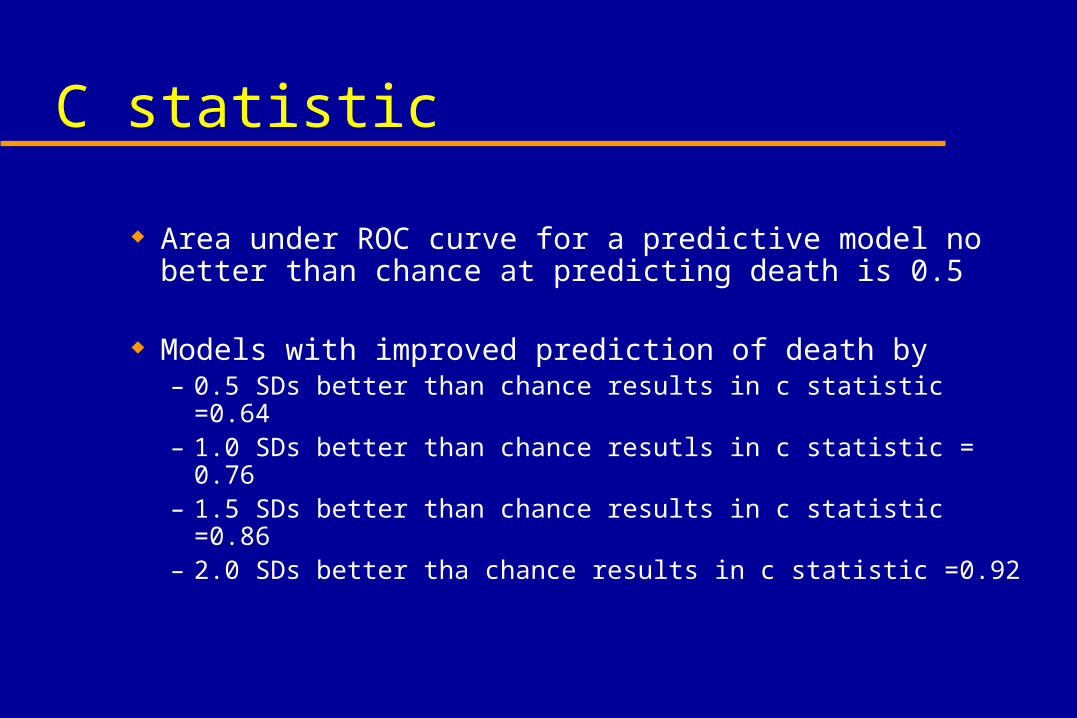
C statistic
Area under ROC curve for a predictive model no better than chance at predicting death is 0.5
Models with improved prediction of death by– 0.5 SDs better than chance results in c statistic =0.64– 1.0 SDs better than chance resutls in c statistic = 0.76– 1.5 SDs better than chance results in c statistic =0.86– 2.0 SDs better tha chance results in c statistic =0.92

Best Model Doesn’t Always Have Biggest C statistic
Adding health conditions that result from complications will raise c statistic of model but not make the model better for predicting quality.
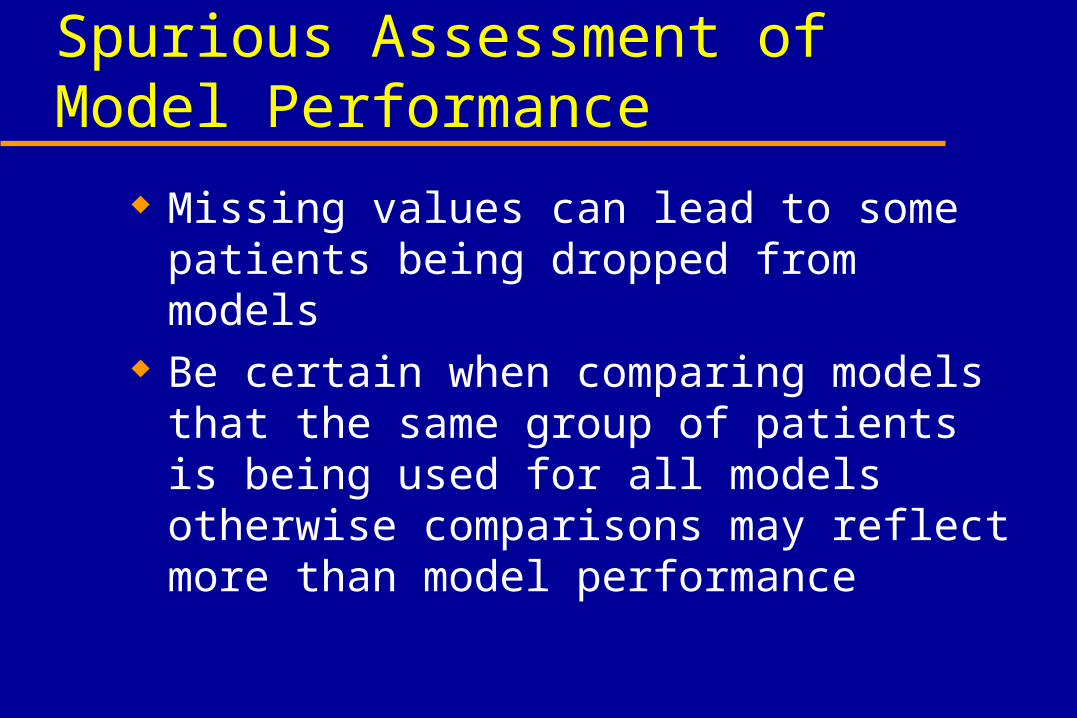
Spurious Assessment of Model Performance
Missing values can lead to some patients being dropped from models
Be certain when comparing models that the same group of patients is being used for all models otherwise comparisons may reflect more than model performance

Calibration - Hosmer-Lemeshow
Size of C index does not indicate how well model performs across range of risk
Stratify individuals into groups (e.g. 10 groups) of equal size according to predicted likelihood of adverse outcome (eg death)
Compare actual vs expected outcomes for each stratum
Want a non significant p value for each stratum and across strata (Hosmer-Lemeshow statistic)

Hosmer-Lemeshow
For k strata the chi squared has k-2 degrees of freedom
Can obtain false negative (non significant p value) by having too few cases in a stratum
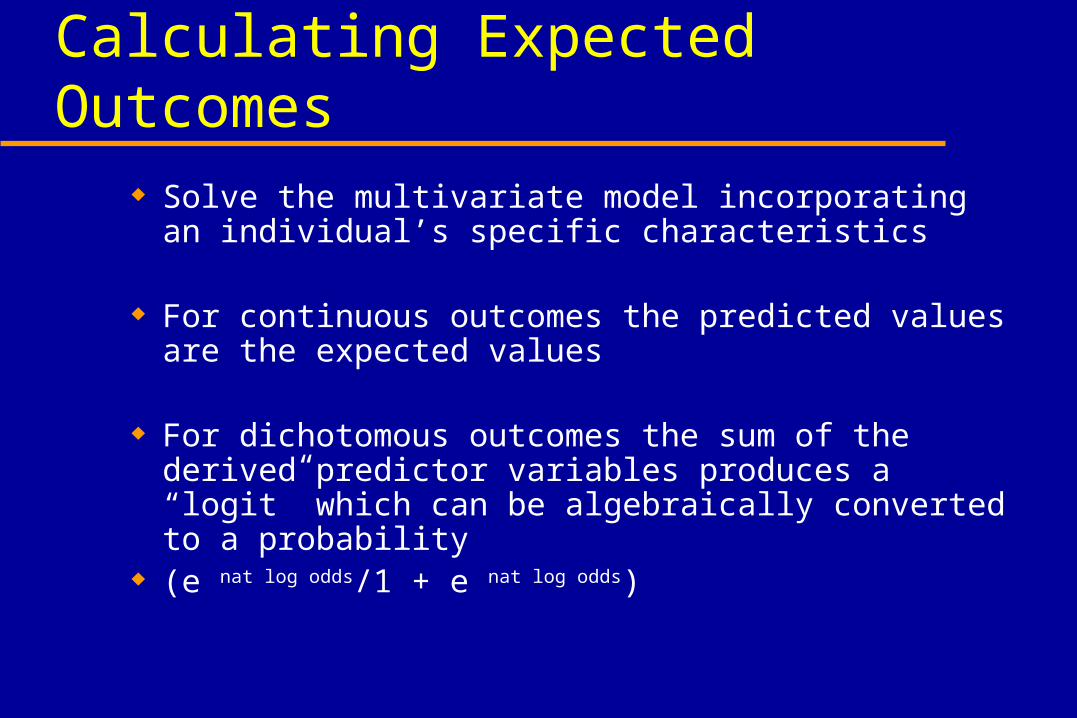
Calculating Expected Outcomes Solve the multivariate model incorporating an individual’s
specific characteristics
For continuous outcomes the predicted values are the expected values
For dichotomous outcomes the sum of the derived predictor variables produces a “logit” which can be algebraically converted to a probability
(e nat log odds/1 + e nat log odds)
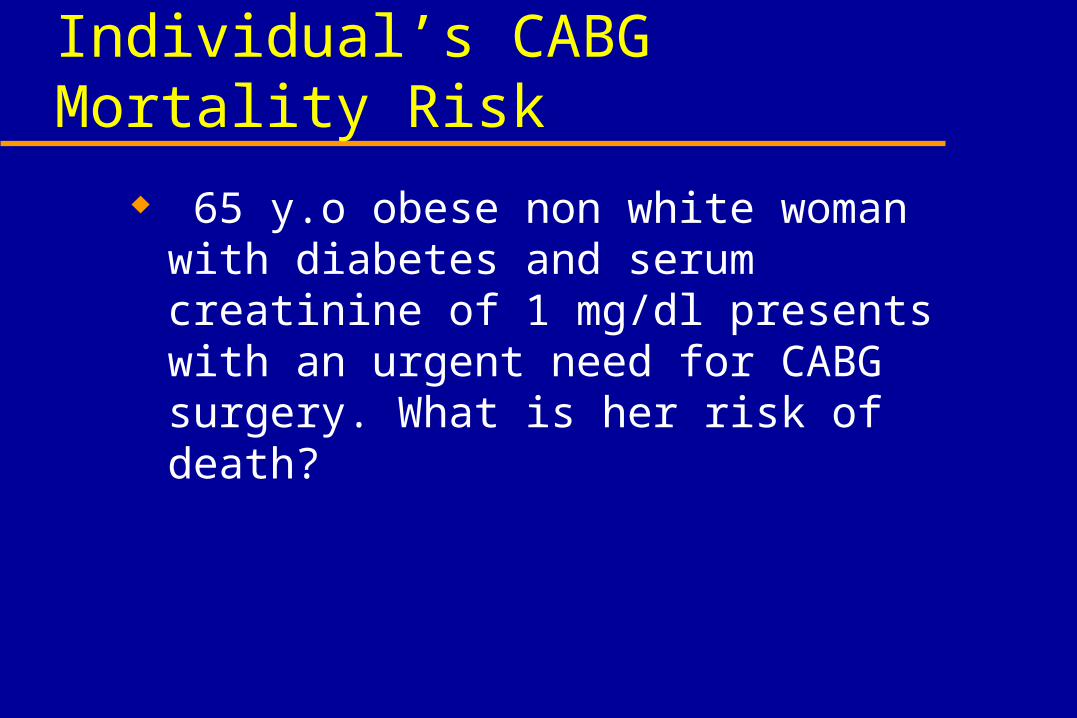
Individual’s CABG Mortality Risk
65 y.o obese non white woman with diabetes and serum creatinine of 1 mg/dl presents with an urgent need for CABG surgery. What is her risk of death?

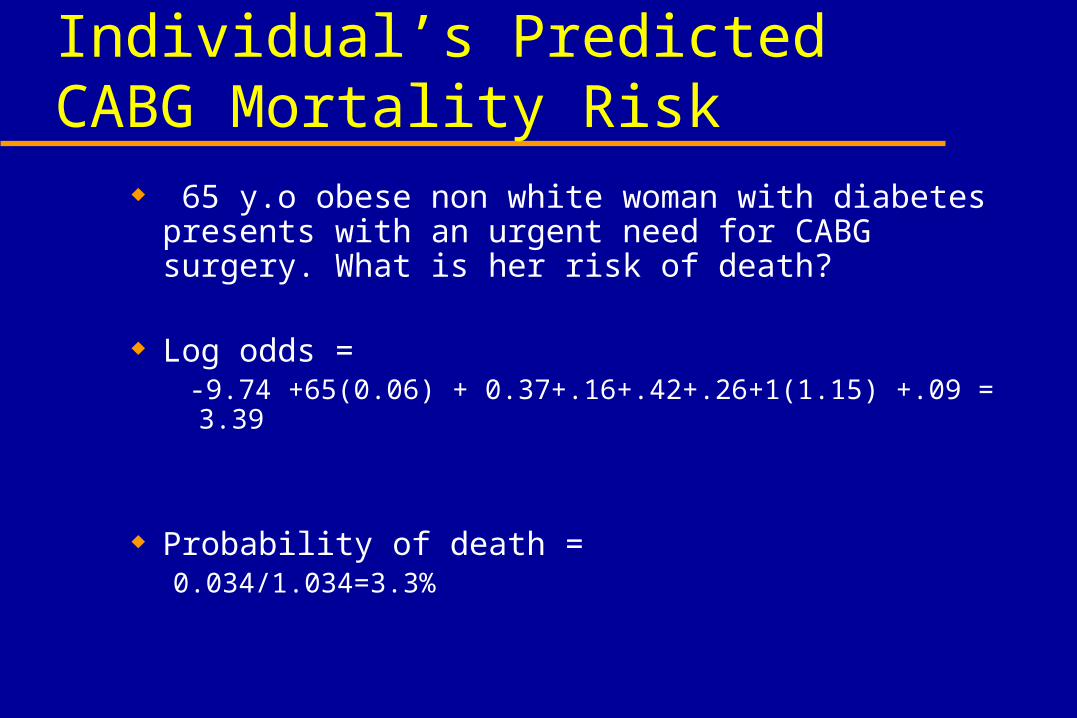
Individual’s Predicted CABG Mortality Risk
65 y.o obese non white woman with diabetes presents with an urgent need for CABG surgery. What is her risk of death?
Log odds = -9.74 +65(0.06) + 0.37+.16+.42+.26+1(1.15) +.09 = 3.39
Probability of death = 0.034/1.034=3.3%

Observed CABG Mortality Risk
Actual outcome of whether individual lived or died
Observed rate for a group is number of deaths per the number of people in that group
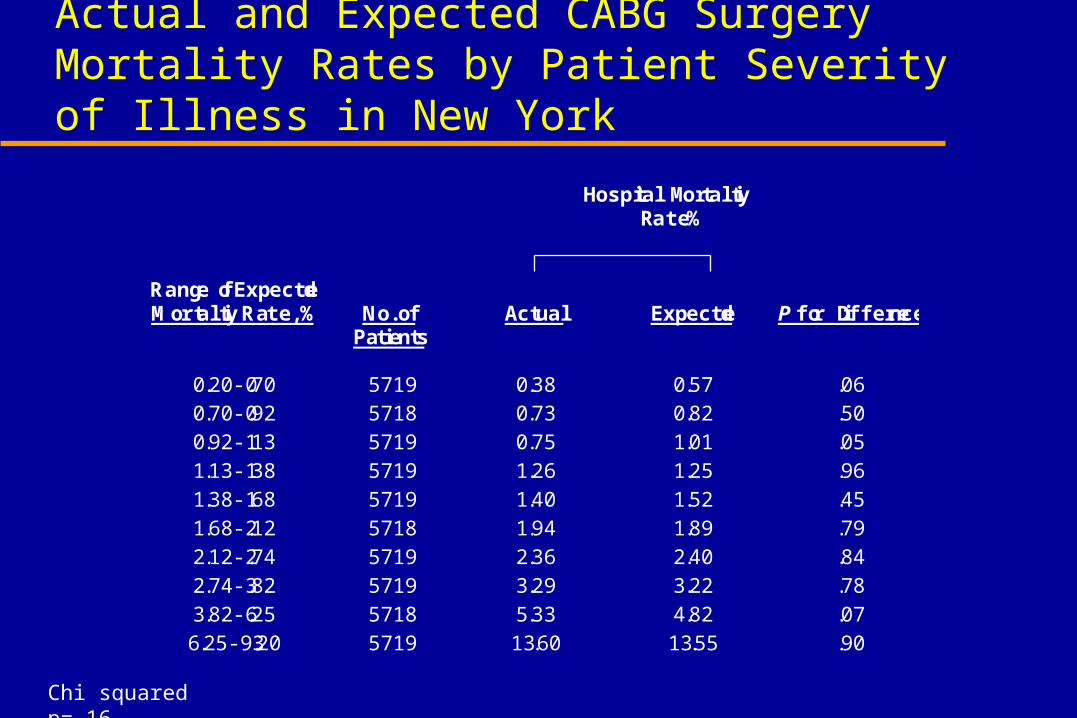
Actual and Expected CABG Surgery Mortality Rates by Patient Severity of Illness in New York
Hospital Mortality Rate %
Range of ExpectedMortality Rate, % No. of
PatientsActual Expected P for Difference
0.20-0.70 5719 0.38 0.57 .06
0.70-0.92 5718 0.73 0.82 .50
0.92-1.13 5719 0.75 1.01 .05
1.13-1.38 5719 1.26 1.25 .96
1.38-1.68 5719 1.40 1.52 .45
1.68-2.12 5718 1.94 1.89 .79
2.12-2.74 5719 2.36 2.40 .84
2.74-3.82 5719 3.29 3.22 .78
3.82-6.25 5718 5.33 4.82 .07
6.25-93.20 5719 13.60 13.55 .90
Chi squared p=.16

Goodness-of-fit tests for AMI mortality models
Model A Model B
Number of cases 5,442 5,415
Number of deaths 1,044 1,039
Death rate, % 19.18 19.19
Model chi square 721.73 1,276.49
df 13 25
p value 0.0001 0.0001
C statistic 0.759 0.830
Hosmer Lemeshowstatistic
14.92 27.24
8 8
0.0607 0.0006

Stratifying by Risk
Hosmer Lemeshow provides a summary statistic of how well model is calibrated
Also useful to look at how well model performs at extremes (high risk and low risk)

Validating Model – Eye Ball Test
Face validity/Content validity
Does empirically derived model correspond to a pre-determined conceptual model?
If not is that because of highly correlated predictors? A dataset limitation? A modeling error?

Validating Model in Other Datasets: Predicting Mortality following CABG
STS NY VA Duke MN
C statistic .759 .768 .722 .789 .752
Jones et al, JACC, 1996

Recalibrating Risk Adjustment Models
Necessary when observed outcome rate different than expected derived from a different population
This could reflect quality of care or differences in coding practices
Assumption is that relative weights of predictors to one another is correct
Recalibration is an adjustment to all predictor coefficients to force average expected outcome rate to equal observed outcome rate
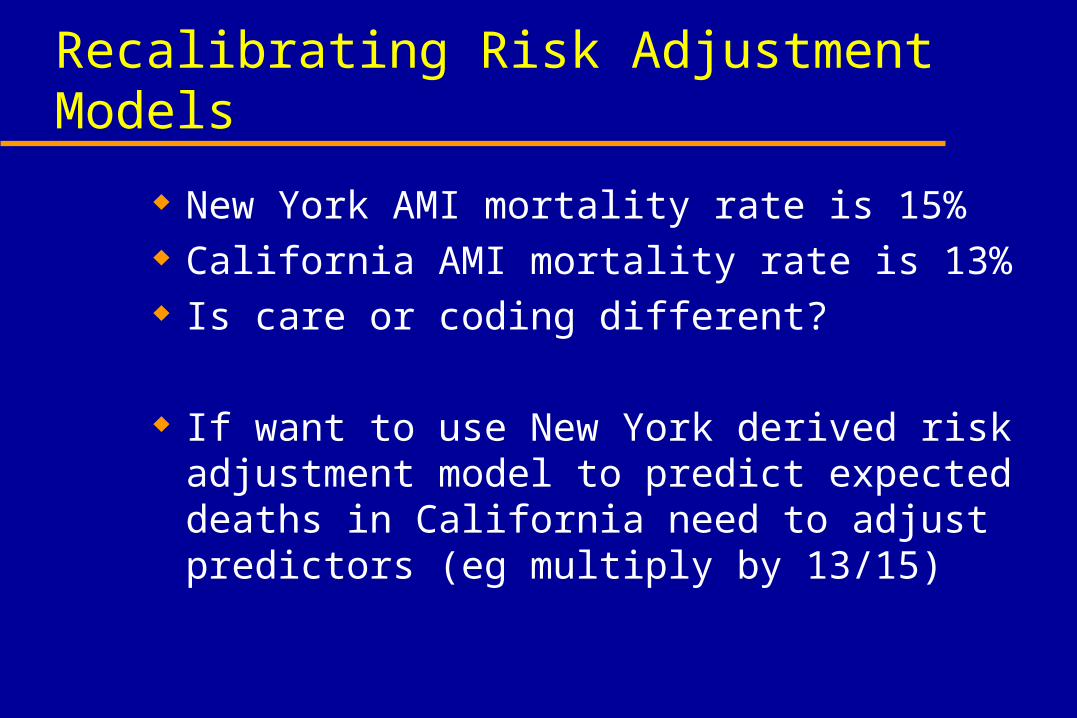
Recalibrating Risk Adjustment Models
New York AMI mortality rate is 15% California AMI mortality rate is 13% Is care or coding different?
If want to use New York derived risk adjustment model to predict expected deaths in California need to adjust predictors (eg multiply by 13/15)

Summary Summary statistics provide a means for evaluating the
predictive power of multivariate models Care should be taken to look beyond summary statistics
to ensure that the model is not overspecified and that it conforms to a conceptual model
Models should be validated with internal and ideally external data
Next time we will review how a risk-adjustment model can be used to identify providers who perform better and worse than expected given their patient mix