Embed Size (px)
Citation preview
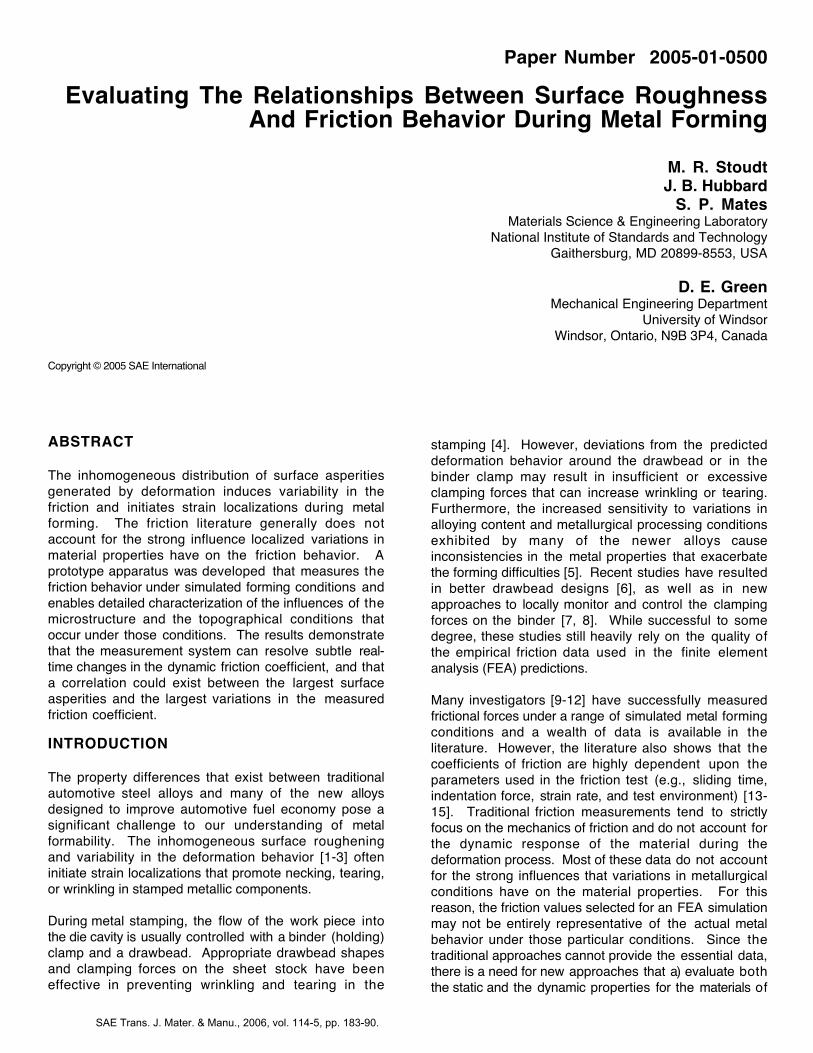
Paper Number 2005-01-0500
Evaluating The Relationships Between Surface RoughnessAnd Friction Behavior During Metal Forming
M. R. StoudtJ. B. Hubbard
S. P. MatesMaterials Science & Engineering Laboratory
National Institute of Standards and TechnologyGaithersburg, MD 20899-8553, USA
D. E. GreenMechanical Engineering Department
University of WindsorWindsor, Ontario, N9B 3P4, Canada
Copyright © 2005 SAE International
ABSTRACT
The inhomogeneous distribution of surface asperitiesgenerated by deformation induces variability in thefriction and initiates strain localizations during metalforming. The friction literature generally does notaccount for the strong influence localized variations inmaterial properties have on the friction behavior. Aprototype apparatus was developed that measures thefriction behavior under simulated forming conditions andenables detailed characterization of the influences of themicrostructure and the topographical conditions thatoccur under those conditions. The results demonstratethat the measurement system can resolve subtle real-time changes in the dynamic friction coefficient, and thata correlation could exist between the largest surfaceasperities and the largest variations in the measuredfriction coefficient.
INTRODUCTION
The property differences that exist between traditionalautomotive steel alloys and many of the new alloysdesigned to improve automotive fuel economy pose asignificant challenge to our understanding of metalformability. The inhomogeneous surface rougheningand variability in the deformation behavior [1-3] ofteninitiate strain localizations that promote necking, tearing,or wrinkling in stamped metallic components.
During metal stamping, the flow of the work piece intothe die cavity is usually controlled with a binder (holding)clamp and a drawbead. Appropriate drawbead shapesand clamping forces on the sheet stock have beeneffective in preventing wrinkling and tearing in the
stamping [4]. However, deviations from the predicteddeformation behavior around the drawbead or in thebinder clamp may result in insufficient or excessiveclamping forces that can increase wrinkling or tearing.Furthermore, the increased sensitivity to variations inalloying content and metallurgical processing conditionsexhibited by many of the newer alloys causeinconsistencies in the metal properties that exacerbatethe forming difficulties [5]. Recent studies have resultedin better drawbead designs [6], as well as in newapproaches to locally monitor and control the clampingforces on the binder [7, 8]. While successful to somedegree, these studies still heavily rely on the quality ofthe empirical friction data used in the finite elementanalysis (FEA) predictions.
Many investigators [9-12] have successfully measuredfrictional forces under a range of simulated metal formingconditions and a wealth of data is available in theliterature. However, the literature also shows that thecoefficients of friction are highly dependent upon theparameters used in the friction test (e.g., sliding time,indentation force, strain rate, and test environment) [13-15]. Traditional friction measurements tend to strictlyfocus on the mechanics of friction and do not account forthe dynamic response of the material during thedeformation process. Most of these data do not accountfor the strong influences that variations in metallurgicalconditions have on the material properties. For thisreason, the friction values selected for an FEA simulationmay not be entirely representative of the actual metalbehavior under those particular conditions. Since thetraditional approaches cannot provide the essential data,there is a need for new approaches that a) evaluate boththe static and the dynamic properties for the materials of
SAE Trans. J. Mater. & Manu., 2006, vol. 114-5, pp. 183-90.
interest, and b) provide a more broad-basedunderstanding of the relationships between the frictionbehavior and the microstructural variations that affect theproperties during metal forming.
A prototype friction testing apparatus is being developedas part of a test protocol that produces friction data undera wide range of loading and strain rate conditions inresponse to this need. The principal advantage of thisprotocol is that it enables direct assessment of therelative influence of metallurgical variables, such ascomposition, grain size and orientation effects,strengthening mechanisms, slip homogeneity, as well aschanges in the microstructures that are produced underconditions closely emulating those encountered inindustrial forming operations. These measurements canthen be used to guide the development of improvedfinite element models that predict the shape of theformed part after each forming operation. This particularstudy focuses on the suitability of the design to produceand measure the friction under different surfaceconditions.
EXPERIMENTAL
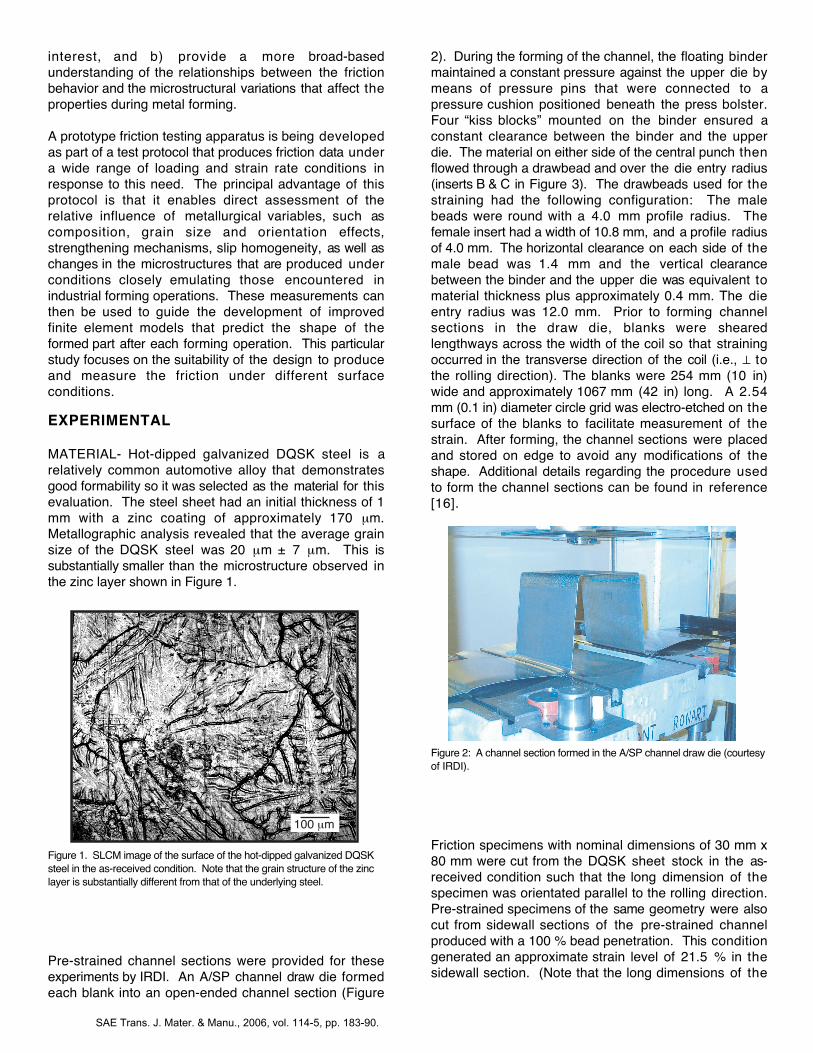
MATERIAL- Hot-dipped galvanized DQSK steel is arelatively common automotive alloy that demonstratesgood formability so it was selected as the material for thisevaluation. The steel sheet had an initial thickness of 1mm with a zinc coating of approximately 170 µm.Metallographic analysis revealed that the average grainsize of the DQSK steel was 20 µm ± 7 µm. This issubstantially smaller than the microstructure observed inthe zinc layer shown in Figure 1.
Figure 1. SLCM image of the surface of the hot-dipped galvanized DQSKsteel in the as-received condition. Note that the grain structure of the zinclayer is substantially different from that of the underlying steel.
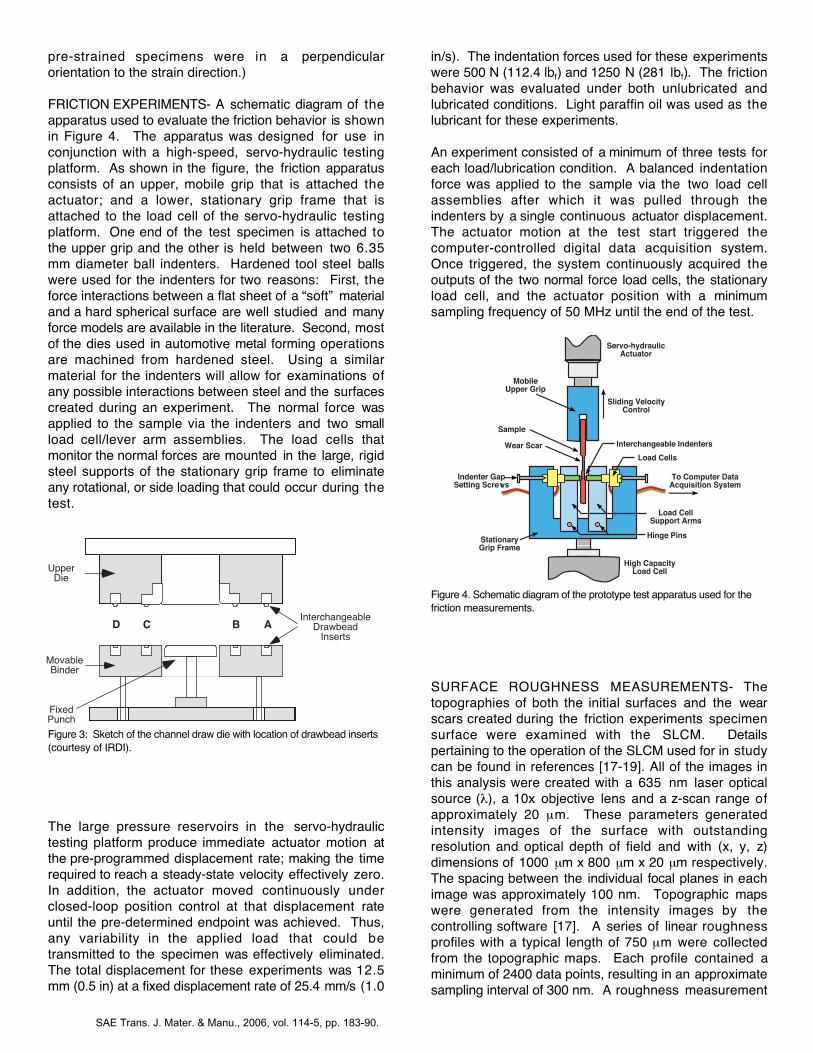
Pre-strained channel sections were provided for theseexperiments by IRDI. An A/SP channel draw die formedeach blank into an open-ended channel section (Figure
2). During the forming of the channel, the floating bindermaintained a constant pressure against the upper die bymeans of pressure pins that were connected to apressure cushion positioned beneath the press bolster.Four “kiss blocks” mounted on the binder ensured aconstant clearance between the binder and the upperdie. The material on either side of the central punch thenflowed through a drawbead and over the die entry radius(inserts B & C in Figure 3). The drawbeads used for thestraining had the following configuration: The malebeads were round with a 4.0 mm profile radius. Thefemale insert had a width of 10.8 mm, and a profile radiusof 4.0 mm. The horizontal clearance on each side of themale bead was 1.4 mm and the vertical clearancebetween the binder and the upper die was equivalent tomaterial thickness plus approximately 0.4 mm. The dieentry radius was 12.0 mm. Prior to forming channelsections in the draw die, blanks were shearedlengthways across the width of the coil so that strainingoccurred in the transverse direction of the coil (i.e., ⊥ tothe rolling direction). The blanks were 254 mm (10 in)wide and approximately 1067 mm (42 in) long. A 2.54mm (0.1 in) diameter circle grid was electro-etched on thesurface of the blanks to facilitate measurement of thestrain. After forming, the channel sections were placedand stored on edge to avoid any modifications of theshape. Additional details regarding the procedure usedto form the channel sections can be found in reference[16].
Figure 2: A channel section formed in the A/SP channel draw die (courtesyof IRDI).
Friction specimens with nominal dimensions of 30 mm x80 mm were cut from the DQSK sheet stock in the as-received condition such that the long dimension of thespecimen was orientated parallel to the rolling direction.Pre-strained specimens of the same geometry were alsocut from sidewall sections of the pre-strained channelproduced with a 100 % bead penetration. This conditiongenerated an approximate strain level of 21.5 % in thesidewall section. (Note that the long dimensions of the
100 µm
SAE Trans. J. Mater. & Manu., 2006, vol. 114-5, pp. 183-90.
pre-strained specimens were in a perpendicularorientation to the strain direction.)
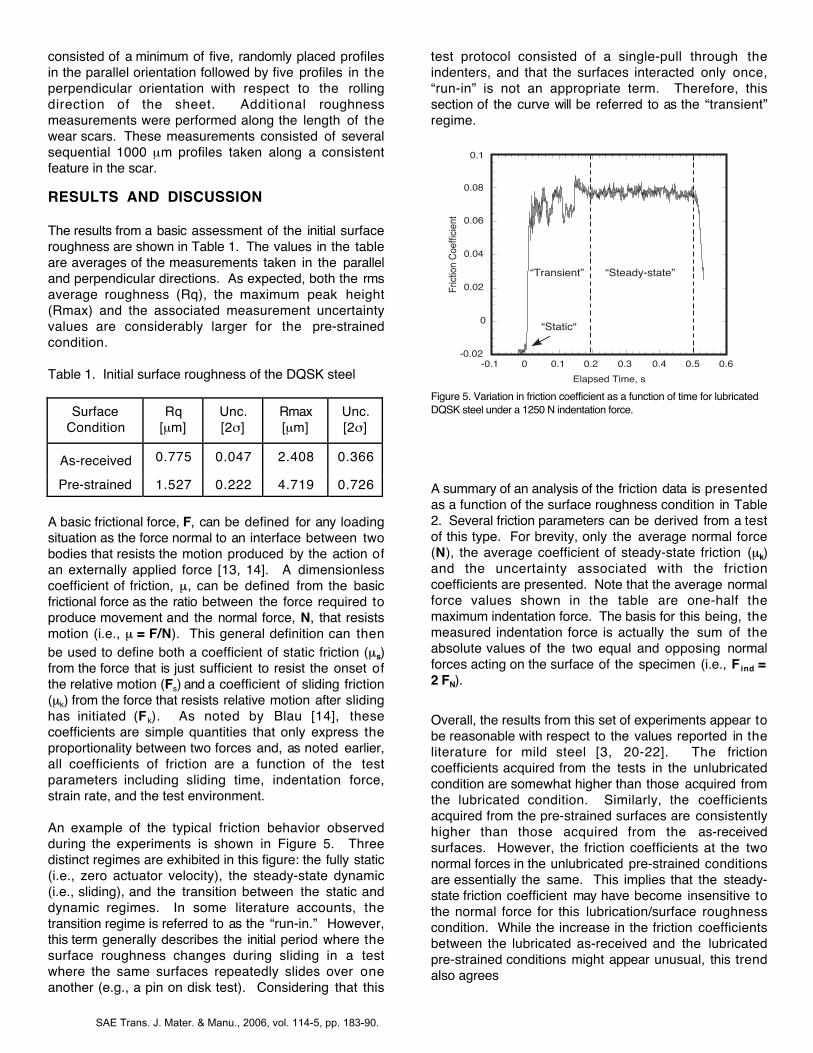
FRICTION EXPERIMENTS- A schematic diagram of theapparatus used to evaluate the friction behavior is shownin Figure 4. The apparatus was designed for use inconjunction with a high-speed, servo-hydraulic testingplatform. As shown in the figure, the friction apparatusconsists of an upper, mobile grip that is attached theactuator; and a lower, stationary grip frame that isattached to the load cell of the servo-hydraulic testingplatform. One end of the test specimen is attached tothe upper grip and the other is held between two 6.35mm diameter ball indenters. Hardened tool steel ballswere used for the indenters for two reasons: First, theforce interactions between a flat sheet of a “soft” materialand a hard spherical surface are well studied and manyforce models are available in the literature. Second, mostof the dies used in automotive metal forming operationsare machined from hardened steel. Using a similarmaterial for the indenters will allow for examinations ofany possible interactions between steel and the surfacescreated during an experiment. The normal force wasapplied to the sample via the indenters and two smallload cell/lever arm assemblies. The load cells thatmonitor the normal forces are mounted in the large, rigidsteel supports of the stationary grip frame to eliminateany rotational, or side loading that could occur during thetest.
Figure 3: Sketch of the channel draw die with location of drawbead inserts(courtesy of IRDI).
The large pressure reservoirs in the servo-hydraulictesting platform produce immediate actuator motion atthe pre-programmed displacement rate; making the timerequired to reach a steady-state velocity effectively zero.In addition, the actuator moved continuously underclosed-loop position control at that displacement rateuntil the pre-determined endpoint was achieved. Thus,any variability in the applied load that could betransmitted to the specimen was effectively eliminated.The total displacement for these experiments was 12.5mm (0.5 in) at a fixed displacement rate of 25.4 mm/s (1.0
in/s). The indentation forces used for these experimentswere 500 N (112.4 lbf) and 1250 N (281 lbf). The frictionbehavior was evaluated under both unlubricated andlubricated conditions. Light paraffin oil was used as thelubricant for these experiments.
An experiment consisted of a minimum of three tests foreach load/lubrication condition. A balanced indentationforce was applied to the sample via the two load cellassemblies after which it was pulled through theindenters by a single continuous actuator displacement.The actuator motion at the test start triggered thecomputer-controlled digital data acquisition system.Once triggered, the system continuously acquired theoutputs of the two normal force load cells, the stationaryload cell, and the actuator position with a minimumsampling frequency of 50 MHz until the end of the test.
Figure 4. Schematic diagram of the prototype test apparatus used for thefriction measurements.
SURFACE ROUGHNESS MEASUREMENTS- Thetopographies of both the initial surfaces and the wearscars created during the friction experiments specimensurface were examined with the SLCM. Detailspertaining to the operation of the SLCM used for in studycan be found in references [17-19]. All of the images inthis analysis were created with a 635 nm laser opticalsource (λ), a 10x objective lens and a z-scan range ofapproximately 20 µm. These parameters generatedintensity images of the surface with outstandingresolution and optical depth of field and with (x, y, z)dimensions of 1000 µm x 800 µm x 20 µm respectively.The spacing between the individual focal planes in eachimage was approximately 100 nm. Topographic mapswere generated from the intensity images by thecontrolling software [17]. A series of linear roughnessprofiles with a typical length of 750 µm were collectedfrom the topographic maps. Each profile contained aminimum of 2400 data points, resulting in an approximatesampling interval of 300 nm. A roughness measurement
FixedPunch
MovableBinder
InterchangeableDrawbead
Inserts
UpperDie
ABCD
High CapacityLoad Cell
Sample
StationaryGrip Frame
Servo-hydraulicActuator
Sliding VelocityControl
Load Cells
Interchangeable Indenters Wear Scar
Load CellSupport Arms
Indenter GapSetting Screws
Hinge Pins
MobileUpper Grip
To Computer DataAcquisition System
SAE Trans. J. Mater. & Manu., 2006, vol. 114-5, pp. 183-90.
consisted of a minimum of five, randomly placed profilesin the parallel orientation followed by five profiles in theperpendicular orientation with respect to the rollingdirection of the sheet. Additional roughnessmeasurements were performed along the length of thewear scars. These measurements consisted of severalsequential 1000 µm profiles taken along a consistentfeature in the scar.
RESULTS AND DISCUSSION
The results from a basic assessment of the initial surfaceroughness are shown in Table 1. The values in the tableare averages of the measurements taken in the paralleland perpendicular directions. As expected, both the rmsaverage roughness (Rq), the maximum peak height(Rmax) and the associated measurement uncertaintyvalues are considerably larger for the pre-strainedcondition.
Table 1. Initial surface roughness of the DQSK steel
SurfaceCondition
Rq[µm]
Unc.[2σ]
Rmax[µm]
Unc.[2σ]
As-received 0.775 0.047 2.408 0.366
Pre-strained 1.527 0.222 4.719 0.726
A basic frictional force, F, can be defined for any loadingsituation as the force normal to an interface between twobodies that resists the motion produced by the action ofan externally applied force [13, 14]. A dimensionlesscoefficient of friction, µ, can be defined from the basicfrictional force as the ratio between the force required toproduce movement and the normal force, N, that resistsmotion (i.e., µ = F/N). This general definition can thenbe used to define both a coefficient of static friction (µs)from the force that is just sufficient to resist the onset ofthe relative motion (Fs) and a coefficient of sliding friction(µk) from the force that resists relative motion after slidinghas initiated (Fk). As noted by Blau [14], thesecoefficients are simple quantities that only express theproportionality between two forces and, as noted earlier,all coefficients of friction are a function of the testparameters including sliding time, indentation force,strain rate, and the test environment.
An example of the typical friction behavior observedduring the experiments is shown in Figure 5. Threedistinct regimes are exhibited in this figure: the fully static(i.e., zero actuator velocity), the steady-state dynamic(i.e., sliding), and the transition between the static anddynamic regimes. In some literature accounts, thetransition regime is referred to as the “run-in.” However,this term generally describes the initial period where thesurface roughness changes during sliding in a testwhere the same surfaces repeatedly slides over oneanother (e.g., a pin on disk test). Considering that this
test protocol consisted of a single-pull through theindenters, and that the surfaces interacted only once,“run-in” is not an appropriate term. Therefore, thissection of the curve will be referred to as the “transient”regime.
Figure 5. Variation in friction coefficient as a function of time for lubricatedDQSK steel under a 1250 N indentation force.
A summary of an analysis of the friction data is presentedas a function of the surface roughness condition in Table2. Several friction parameters can be derived from a testof this type. For brevity, only the average normal force(N), the average coefficient of steady-state friction (µk)and the uncertainty associated with the frictioncoefficients are presented. Note that the average normalforce values shown in the table are one-half themaximum indentation force. The basis for this being, themeasured indentation force is actually the sum of theabsolute values of the two equal and opposing normalforces acting on the surface of the specimen (i.e., Find =2 FN).
Overall, the results from this set of experiments appear tobe reasonable with respect to the values reported in theliterature for mild steel [3, 20-22]. The frictioncoefficients acquired from the tests in the unlubricatedcondition are somewhat higher than those acquired fromthe lubricated condition. Similarly, the coefficientsacquired from the pre-strained surfaces are consistentlyhigher than those acquired from the as-receivedsurfaces. However, the friction coefficients at the twonormal forces in the unlubricated pre-strained conditionsare essentially the same. This implies that the steady-state friction coefficient may have become insensitive tothe normal force for this lubrication/surface roughnesscondition. While the increase in the friction coefficientsbetween the lubricated as-received and the lubricatedpre-strained conditions might appear unusual, this trendalso agrees
-0.02
0
0.02
0.04
0.06
0.08
0.1
-0.1 0 0.1 0.2 0.3 0.4 0.5 0.6
Fric
tion
Coe
ffici
ent
Elapsed Time, s
“Steady-state”“Transient”
“Static“
SAE Trans. J. Mater. & Manu., 2006, vol. 114-5, pp. 183-90.
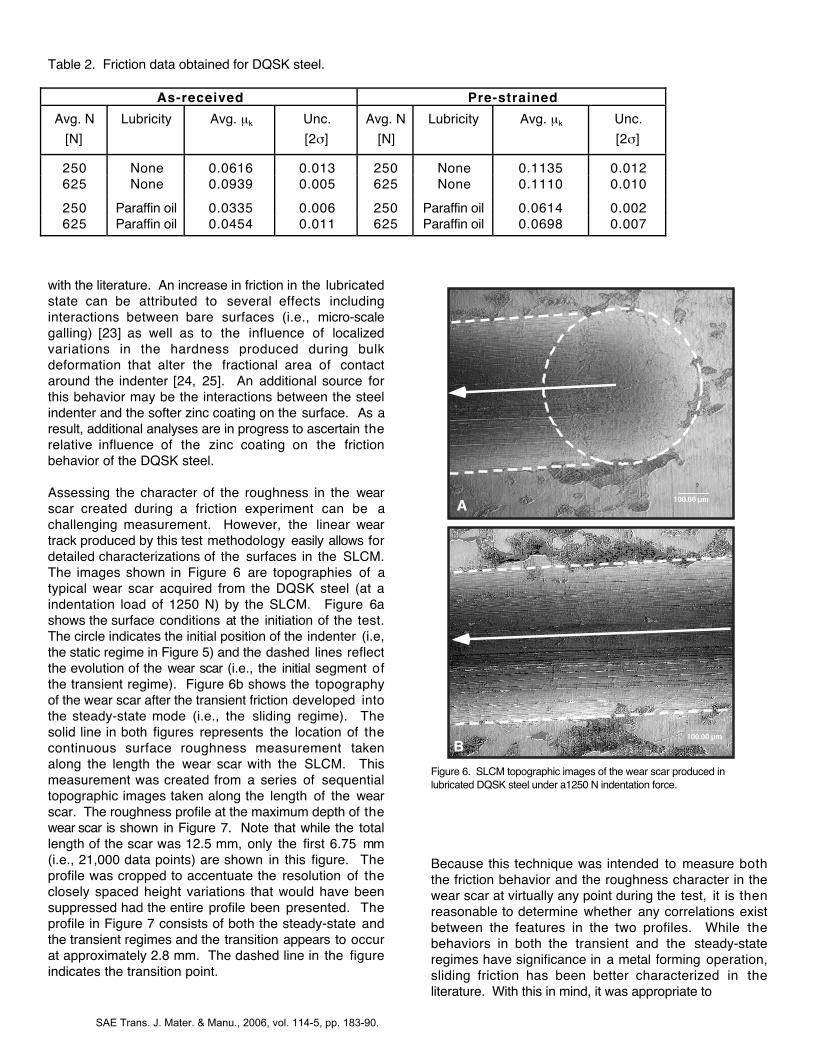
Table 2. Friction data obtained for DQSK steel.
As-received Pre-strained
Avg. N
[N]
Lubricity Avg. µk Unc.
[2σ]
Avg. N
[N]
Lubricity Avg. µk Unc.
[2σ]
250 None 0.0616 0.013 250 None 0.1135 0.012625 None 0.0939 0.005 625 None 0.1110 0.010
250 Paraffin oil 0.0335 0.006 250 Paraffin oil 0.0614 0.002625 Paraffin oil 0.0454 0.011 625 Paraffin oil 0.0698 0.007
with the literature. An increase in friction in the lubricatedstate can be attributed to several effects includinginteractions between bare surfaces (i.e., micro-scalegalling) [23] as well as to the influence of localizedvariations in the hardness produced during bulkdeformation that alter the fractional area of contactaround the indenter [24, 25]. An additional source forthis behavior may be the interactions between the steelindenter and the softer zinc coating on the surface. As aresult, additional analyses are in progress to ascertain therelative influence of the zinc coating on the frictionbehavior of the DQSK steel.
Assessing the character of the roughness in the wearscar created during a friction experiment can be achallenging measurement. However, the linear weartrack produced by this test methodology easily allows fordetailed characterizations of the surfaces in the SLCM. The images shown in Figure 6 are topographies of atypical wear scar acquired from the DQSK steel (at aindentation load of 1250 N) by the SLCM. Figure 6ashows the surface conditions at the initiation of the test.The circle indicates the initial position of the indenter (i.e,the static regime in Figure 5) and the dashed lines reflectthe evolution of the wear scar (i.e., the initial segment ofthe transient regime). Figure 6b shows the topographyof the wear scar after the transient friction developed intothe steady-state mode (i.e., the sliding regime). Thesolid line in both figures represents the location of thecontinuous surface roughness measurement takenalong the length the wear scar with the SLCM. Thismeasurement was created from a series of sequentialtopographic images taken along the length of the wearscar. The roughness profile at the maximum depth of thewear scar is shown in Figure 7. Note that while the totallength of the scar was 12.5 mm, only the first 6.75 mm(i.e., 21,000 data points) are shown in this figure. Theprofile was cropped to accentuate the resolution of theclosely spaced height variations that would have beensuppressed had the entire profile been presented. Theprofile in Figure 7 consists of both the steady-state andthe transient regimes and the transition appears to occurat approximately 2.8 mm. The dashed line in the figureindicates the transition point.
Figure 6. SLCM topographic images of the wear scar produced inlubricated DQSK steel under a1250 N indentation force.
Because this technique was intended to measure boththe friction behavior and the roughness character in thewear scar at virtually any point during the test, it is thenreasonable to determine whether any correlations existbetween the features in the two profiles. While thebehaviors in both the transient and the steady-stateregimes have significance in a metal forming operation,sliding friction has been better characterized in theliterature. With this in mind, it was appropriate to
A
B
SAE Trans. J. Mater. & Manu., 2006, vol. 114-5, pp. 183-90.
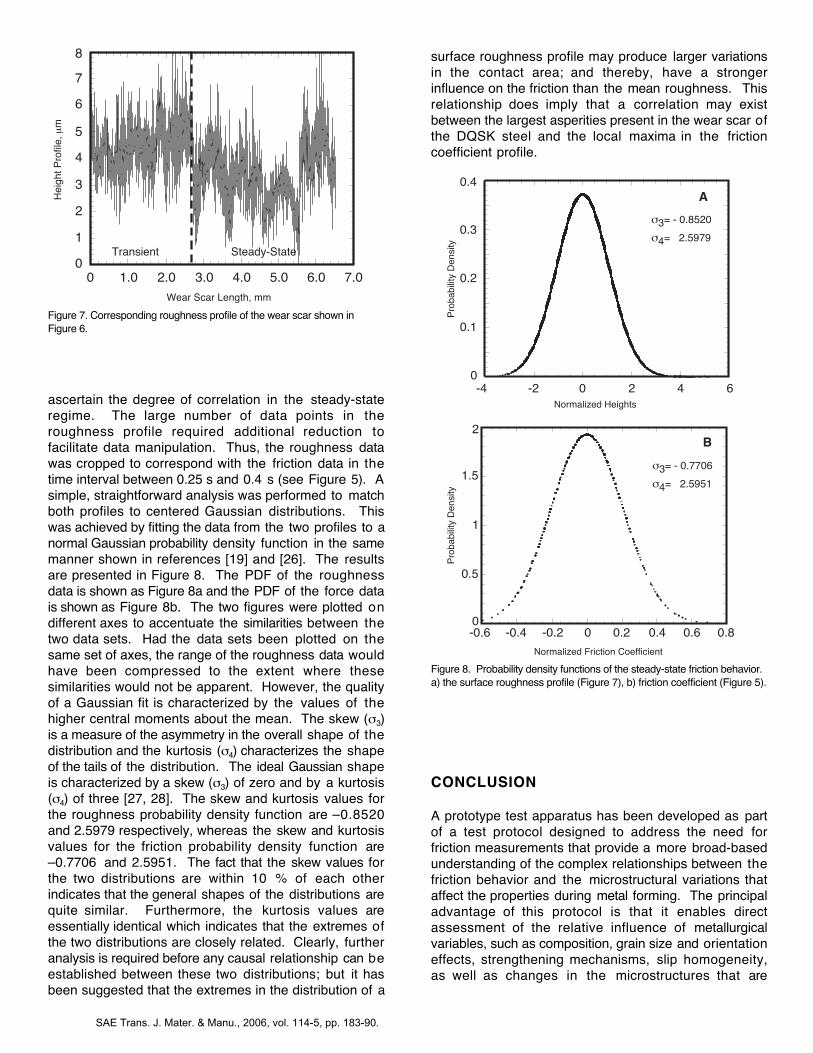
Figure 7. Corresponding roughness profile of the wear scar shown inFigure 6.
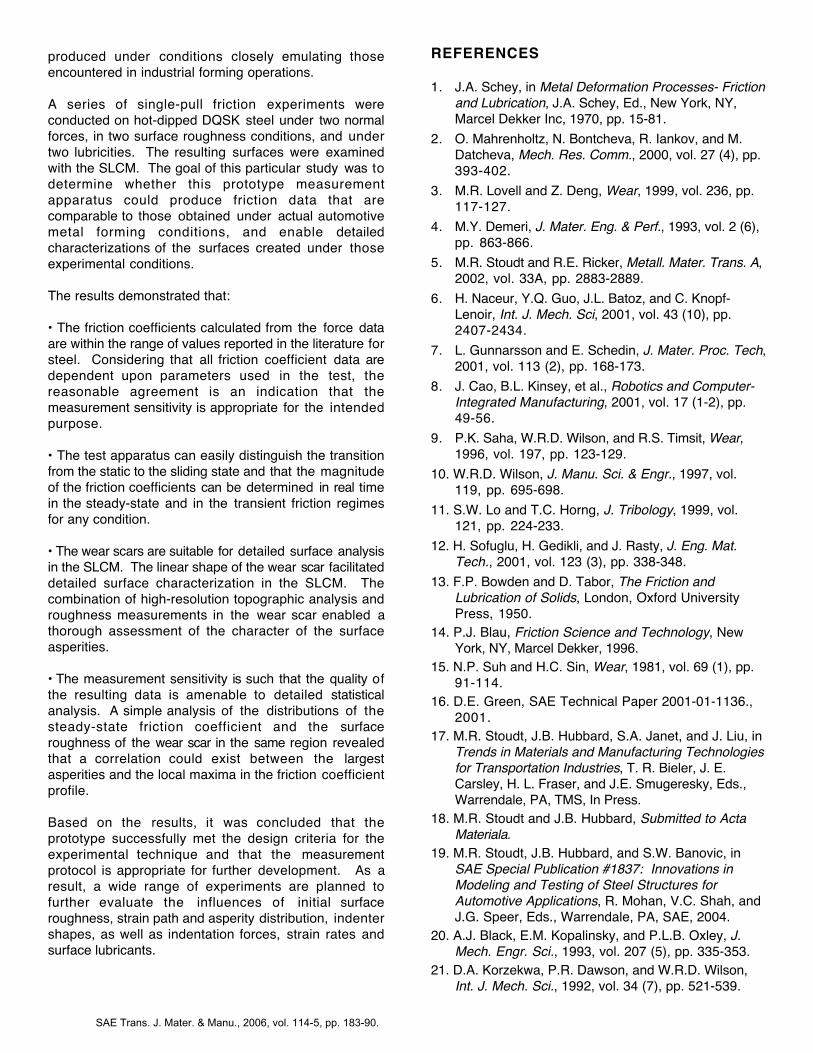
ascertain the degree of correlation in the steady-stateregime. The large number of data points in theroughness profile required additional reduction tofacilitate data manipulation. Thus, the roughness datawas cropped to correspond with the friction data in thetime interval between 0.25 s and 0.4 s (see Figure 5). Asimple, straightforward analysis was performed to matchboth profiles to centered Gaussian distributions. Thiswas achieved by fitting the data from the two profiles to anormal Gaussian probability density function in the samemanner shown in references [19] and [26]. The resultsare presented in Figure 8. The PDF of the roughnessdata is shown as Figure 8a and the PDF of the force datais shown as Figure 8b. The two figures were plotted ondifferent axes to accentuate the similarities between thetwo data sets. Had the data sets been plotted on thesame set of axes, the range of the roughness data wouldhave been compressed to the extent where thesesimilarities would not be apparent. However, the qualityof a Gaussian fit is characterized by the values of thehigher central moments about the mean. The skew (σ3)is a measure of the asymmetry in the overall shape of thedistribution and the kurtosis (σ4) characterizes the shapeof the tails of the distribution. The ideal Gaussian shapeis characterized by a skew (σ3) of zero and by a kurtosis(σ4) of three [27, 28]. The skew and kurtosis values forthe roughness probability density function are –0.8520and 2.5979 respectively, whereas the skew and kurtosisvalues for the friction probability density function are–0.7706 and 2.5951. The fact that the skew values forthe two distributions are within 10 % of each otherindicates that the general shapes of the distributions arequite similar. Furthermore, the kurtosis values areessentially identical which indicates that the extremes ofthe two distributions are closely related. Clearly, furtheranalysis is required before any causal relationship can beestablished between these two distributions; but it hasbeen suggested that the extremes in the distribution of a
surface roughness profile may produce larger variationsin the contact area; and thereby, have a strongerinfluence on the friction than the mean roughness. Thisrelationship does imply that a correlation may existbetween the largest asperities present in the wear scar ofthe DQSK steel and the local maxima in the frictioncoefficient profile.
Figure 8. Probability density functions of the steady-state friction behavior.a) the surface roughness profile (Figure 7), b) friction coefficient (Figure 5).
CONCLUSION
A prototype test apparatus has been developed as partof a test protocol designed to address the need forfriction measurements that provide a more broad-basedunderstanding of the complex relationships between thefriction behavior and the microstructural variations thataffect the properties during metal forming. The principaladvantage of this protocol is that it enables directassessment of the relative influence of metallurgicalvariables, such as composition, grain size and orientationeffects, strengthening mechanisms, slip homogeneity,as well as changes in the microstructures that are
0
1
2
3
4
5
6
7
8
0 1.0 2.0 3.0 4.0 5.0 6.0 7.0
Transient Steady-State
Wear Scar Length, mm
Hei
ght P
rofil
e, µ
m
0
0.1
0.2
0.3
0.4
-4 -2 0 2 4 6Normalized Heights
Pro
babi
lity
Den
sity
A
σ3= - 0.8520
σ4= 2.5979
0
0.5
1
1.5
2
-0.6 -0.4 -0.2 0 0.2 0.4 0.6 0.8
Normalized Friction Coefficient
Pro
babi
lity
Den
sity
B
σ3= - 0.7706
σ4= 2.5951
SAE Trans. J. Mater. & Manu., 2006, vol. 114-5, pp. 183-90.
produced under conditions closely emulating thoseencountered in industrial forming operations.
A series of single-pull friction experiments wereconducted on hot-dipped DQSK steel under two normalforces, in two surface roughness conditions, and undertwo lubricities. The resulting surfaces were examinedwith the SLCM. The goal of this particular study was todetermine whether this prototype measurementapparatus could produce friction data that arecomparable to those obtained under actual automotivemetal forming conditions, and enable detailedcharacterizations of the surfaces created under thoseexperimental conditions.
The results demonstrated that:
• The friction coefficients calculated from the force dataare within the range of values reported in the literature forsteel. Considering that all friction coefficient data aredependent upon parameters used in the test, thereasonable agreement is an indication that themeasurement sensitivity is appropriate for the intendedpurpose.
• The test apparatus can easily distinguish the transitionfrom the static to the sliding state and that the magnitudeof the friction coefficients can be determined in real timein the steady-state and in the transient friction regimesfor any condition.
• The wear scars are suitable for detailed surface analysisin the SLCM. The linear shape of the wear scar facilitateddetailed surface characterization in the SLCM. Thecombination of high-resolution topographic analysis androughness measurements in the wear scar enabled athorough assessment of the character of the surfaceasperities.
• The measurement sensitivity is such that the quality ofthe resulting data is amenable to detailed statisticalanalysis. A simple analysis of the distributions of thesteady-state friction coefficient and the surfaceroughness of the wear scar in the same region revealedthat a correlation could exist between the largestasperities and the local maxima in the friction coefficientprofile.
Based on the results, it was concluded that theprototype successfully met the design criteria for theexperimental technique and that the measurementprotocol is appropriate for further development. As aresult, a wide range of experiments are planned tofurther evaluate the influences of initial surfaceroughness, strain path and asperity distribution, indentershapes, as well as indentation forces, strain rates andsurface lubricants.
REFERENCES
1. J.A. Schey, in Metal Deformation Processes- Frictionand Lubrication, J.A. Schey, Ed., New York, NY,Marcel Dekker Inc, 1970, pp. 15-81.
2. O. Mahrenholtz, N. Bontcheva, R. Iankov, and M.Datcheva, Mech. Res. Comm., 2000, vol. 27 (4), pp.393-402.
3. M.R. Lovell and Z. Deng, Wear, 1999, vol. 236, pp.117-127.
4. M.Y. Demeri, J. Mater. Eng. & Perf., 1993, vol. 2 (6),pp. 863-866.
5. M.R. Stoudt and R.E. Ricker, Metall. Mater. Trans. A,2002, vol. 33A, pp. 2883-2889.
6. H. Naceur, Y.Q. Guo, J.L. Batoz, and C. Knopf-Lenoir, Int. J. Mech. Sci, 2001, vol. 43 (10), pp.2407-2434.
7. L. Gunnarsson and E. Schedin, J. Mater. Proc. Tech,2001, vol. 113 (2), pp. 168-173.
8. J. Cao, B.L. Kinsey, et al., Robotics and Computer-Integrated Manufacturing, 2001, vol. 17 (1-2), pp.49-56.
9. P.K. Saha, W.R.D. Wilson, and R.S. Timsit, Wear,1996, vol. 197, pp. 123-129.
10. W.R.D. Wilson, J. Manu. Sci. & Engr., 1997, vol.119, pp. 695-698.
11. S.W. Lo and T.C. Horng, J. Tribology, 1999, vol.121, pp. 224-233.
12. H. Sofuglu, H. Gedikli, and J. Rasty, J. Eng. Mat.Tech., 2001, vol. 123 (3), pp. 338-348.
13. F.P. Bowden and D. Tabor, The Friction andLubrication of Solids, London, Oxford UniversityPress, 1950.
14. P.J. Blau, Friction Science and Technology, NewYork, NY, Marcel Dekker, 1996.
15. N.P. Suh and H.C. Sin, Wear, 1981, vol. 69 (1), pp.91-114.
16. D.E. Green, SAE Technical Paper 2001-01-1136.,2001.
17. M.R. Stoudt, J.B. Hubbard, S.A. Janet, and J. Liu, inTrends in Materials and Manufacturing Technologiesfor Transportation Industries, T. R. Bieler, J. E.Carsley, H. L. Fraser, and J.E. Smugeresky, Eds.,Warrendale, PA, TMS, In Press.
18. M.R. Stoudt and J.B. Hubbard, Submitted to ActaMateriala.
19. M.R. Stoudt, J.B. Hubbard, and S.W. Banovic, inSAE Special Publication #1837: Innovations inModeling and Testing of Steel Structures forAutomotive Applications, R. Mohan, V.C. Shah, andJ.G. Speer, Eds., Warrendale, PA, SAE, 2004.
20. A.J. Black, E.M. Kopalinsky, and P.L.B. Oxley, J.Mech. Engr. Sci., 1993, vol. 207 (5), pp. 335-353.
21. D.A. Korzekwa, P.R. Dawson, and W.R.D. Wilson,Int. J. Mech. Sci., 1992, vol. 34 (7), pp. 521-539.
SAE Trans. J. Mater. & Manu., 2006, vol. 114-5, pp. 183-90.
22. M.R. Lovell, Z. Deng, and M.M. Khonsari, J.Tribology, 2000, vol. 122 (4), pp. 856-863.
23. J.A. Schey, Tribology in Metalworking, Metals Park,OH, ASM, 1983.
24. W.R.D. Wilson and W. Lee, J. Manu. Sci. & Engr.,2001, vol. 123, pp. 279-283.
25. W.R.D. Wilson and S. Sheu, Int. J. Mech. Sci., 1988,vol. 30 (7), pp. 475-489.
26. M.R. Stoudt, J.B. Hubbard, and S.W. Banovic, SAETrans. J. Mater. Manuf., In Press.
27. W. Mendenhall, Introduction to Probability andStatistics, 4th ed., N. Scltuate, MA, Duxbury Press,1975.
28. W. Feller, An Introduction to Probability Theory andits Applications, vol. 2, 2nd ed., NY, NY, J. Wiley &Sons, 1971.
CONTACT
Mark. R. Stoudt, Steven P. Mates, and Joseph B.Hubbard- Materials Performance Group, MaterialsScience and Engineering Laboratory. Email:[email protected] , [email protected] ,[email protected] .
Daniel E. Green, Assistant Professor, Mechanical,Automotive & Materials Engineering Department,University of Windsor. [email protected] .
DEFINITIONS, ACRONYMS,ABBREVIATIONS
A/SP: Automotive/Steel Partnership
DQSK: Draw Quality, Semi-Killed Steel
FEA: Finite Element Analysis
IRDI: Industrial Research & Development Institute
N: Normal Force equal to the (Indentation Force /2) inNewtons
PDF: Probability Density Function
SLCM: Scanning Laser Confocal Microscope
Rq: Root Mean Squared (rms) Roughness
Rmax: The maximum peak height in a roughnessprofile.
UNC: The statistical uncertainty equal to 2 standarddeviations (σ) of the mean.
λ: Wavelength of the laser source in the SLCM.
µk: Coefficient of Steady-state (Dynamic) Friction(dimensionless)
σ3: (Skew) A measure of the symmetry of the PDF.
σ4: (Kurtosis) A measure of the shape of the tails of thePDF.
SAE Trans. J. Mater. & Manu., 2006, vol. 114-5, pp. 183-90.