Embed Size (px)
Citation preview
http://journals.cambridge.org Downloaded: 08 Oct 2014 IP address: 204.187.23.196
Evaluating the status of the Endangered tigerPanthera tigris and its prey in Panna Tiger Reserve,Madhya Pradesh, India
R a j e s h G o p a l , Q a m a r Q u r e s h i , M a n i s h B h a r d w a j
R . K . J a g a d i s h S i n g h and Y a d v e n d r a d e v V . J h a l a
Abstract We evaluated the status of tigers Panthera tigrisand their prey in Panna Tiger Reserve using occupancysurveys, camera-trap mark-recapture population estimation,and distance sampling along foot transects, in 2006. ForestRange tiger occupancy in the Panna landscape (3,500 km2)estimated by 1,077 surveys of 5 km each was 29% – SE 1.Within occupied Ranges of the Reserve a mean of 68% – SE7 of forest Beats had tiger signs. A total of 800 camera-trapnights yielded 24 captures of seven individual adult tigerswithin an effective trap area of 185.0 – SE 15.8 km-2. Thebest model incorporating individual heterogeneity (Mh)estimated the tiger population to be 9 – SE 2. Tiger densitywas 4.9 – SE 1.5 per 100 km2 and was lower than thatreported in 2002 (6.49 tigers per 100 km2). Both occupancyand density indicated a decline of the tiger population in theReserve. Mean ungulate density was 42.4 – SE 8.4 km-2 andcomparable to other tiger reserves. Since our survey in 2006tiger status in Panna has deteriorated further because ofpoaching. Panna was occupied by dacoits in late 2006 andanti-insurgent activities caused further disturbances. In late2008 there was a single male tiger left in Panna but he hasnot been seen since January 2009. The Madhya PradeshForest department has reintroduced three tigers to Pannafrom neighbouring tiger reserves. Panna, along with SariskaTiger Reserve, exemplifies the vulnerability of small, isolatedtiger populations to local extinctions caused by poaching,even in areas with suitable habitat and sufficient prey.
Keywords India, local extinction, mark-recapture, occu-pancy, Panna Tiger Reserve, Panthera tigris, tiger,ungulates
Introduction
Tiger Panthera tigris numbers and range continue todecline despite national and international efforts to
conserve the species (Chundawat et al., 2008). Habitat loss,
fragmentation, prey depletion and poaching are consideredthe major factors responsible for this decline (Dinersteinet al., 2007). However, it is unclear which of these factors isof primary importance in causing local extirpations oftigers (Kenney et al., 1995; Karanth & Stith, 1999; Sunquistet al., 1999; Karanth et al., 2004b, 2006; Chapron et al.,2008). A major limitation in designing and implementingsite-specific conservation measures is the lack of reliablemethods for assessing and monitoring the status of tigersover landscapes (Karanth et al., 2003; but see Linkie et al.,2006).
Official reports on the status of tigers in India’s tigerreserves lost credibility following the local extinction oftigers in Sariska Tiger Reserve. Census figures continued toreport substantial numbers in the Reserve even when therewere none left (Narain et al., 2005). The Tiger Task Force,appointed by the Prime Minister, recommended usingoccupancy (Mackenzie et al., 2003) and capture-recapturewith camera traps (Karanth & Nichols, 2002), as proposedby Jhala et al. (2005a,b), to evaluate tiger status. There isalso controversy regarding the status of tigers in PannaTiger Reserve (Sinha, 2007; Chundawat & Van Gruisen,2008; Pabla, 2008). Both Sariska and Panna Tiger Reservesshare several characteristics: harbouring small, isolatedtiger populations, with reasonably good prey populationsand habitat but surrounded by non-sympathetic localcommunities.
Here we report the results of a stepwise approach usedto evaluate the status of tigers in Panna Tiger Reserve in2006. We first estimate occupancy (Mackenzie et al., 2003)using sign surveys across the forested landscape of whichPanna Tiger Reserve is a part, and subsequently estimatepopulation size by camera-trap capture-recapture (Pollocket al., 1990; Karanth & Nichols, 2002) in the area containingthe highest density of tiger signs. We also provide anaccount of the possible causes of the extinction of tigers inPanna Tiger Reserve.
Study area
The 542.7 km2 Panna Tiger Reserve in the state of MadhyaPradesh is part of a landscape that consists of an isolatedforest patch of 3,500 km2 in the Vindhya hill range (Fig. 1;Qureshi et al., 2006; Jhala et al., 2008). The Reserve rangesin altitude over 330–540 m and has an average annual
RAJESH GOPAL National Tiger Conservation Authority, Bikaner House, NewDelhi, India
QAMAR QURESHI, MANISH BHARDWAJ, R.K. JAGADISH SINGH andYADVENDRADEV V. JHALA (Corresponding author) Wildlife Institute ofIndia, Post Box #18, Dehradun 248001, Uttarakhand, India. [email protected]
Received 3 March 2009. Revision requested 5 May 2009.Accepted 22 October 2009.
ª 2010 Fauna & Flora International, Oryx, 44(3), 383–389 doi:10.1017/S0030605310000529
http://journals.cambridge.org Downloaded: 08 Oct 2014 IP address: 204.187.23.196
precipitation of 1,100 mm. The forest of the Reserve is drydeciduous (Champion & Seth, 1968); teak Tectona grandisand kardhai Anogeissus pendula are the dominant treespecies. The Reserve is characterized by plateaus and gorges,which rise from the perennial river Ken that flows for c. 55
km through the Reserve. The landscape of Panna is fraughtwith conflict. Traditionally most local and tribal commu-nities depended on hunting as a means of livelihood.Creation of Panna National Park, and its subsequentcoverage under Project Tiger, resulted in an alienation ofthe local communities, the people of which continue topoach wildlife outside, and sometimes inside, the Reserve.Thus, the forest areas outside the Reserve are sinks for bothungulates and carnivores.
Methods
Most forests in India are divided into a hierarchy of admin-istrative units consisting of Divisions, Ranges, Beats andCompartments. The boundaries of Beats and Compartments
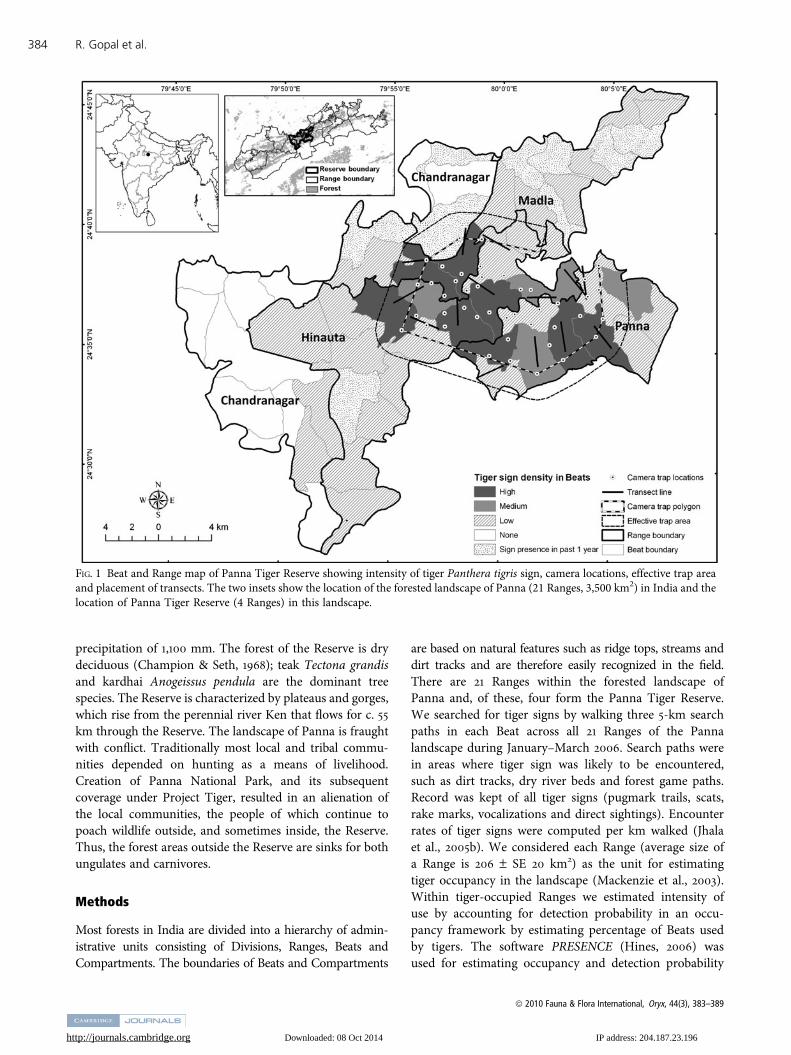
are based on natural features such as ridge tops, streams anddirt tracks and are therefore easily recognized in the field.There are 21 Ranges within the forested landscape ofPanna and, of these, four form the Panna Tiger Reserve.We searched for tiger signs by walking three 5-km searchpaths in each Beat across all 21 Ranges of the Pannalandscape during January–March 2006. Search paths werein areas where tiger sign was likely to be encountered,such as dirt tracks, dry river beds and forest game paths.Record was kept of all tiger signs (pugmark trails, scats,rake marks, vocalizations and direct sightings). Encounterrates of tiger signs were computed per km walked (Jhalaet al., 2005b). We considered each Range (average size ofa Range is 206 – SE 20 km2) as the unit for estimatingtiger occupancy in the landscape (Mackenzie et al., 2003).Within tiger-occupied Ranges we estimated intensity ofuse by accounting for detection probability in an occu-pancy framework by estimating percentage of Beats usedby tigers. The software PRESENCE (Hines, 2006) wasused for estimating occupancy and detection probability
FIG. 1 Beat and Range map of Panna Tiger Reserve showing intensity of tiger Panthera tigris sign, camera locations, effective trap areaand placement of transects. The two insets show the location of the forested landscape of Panna (21 Ranges, 3,500 km2) in India and thelocation of Panna Tiger Reserve (4 Ranges) in this landscape.
R. Gopal et al.384
ª 2010 Fauna & Flora International, Oryx, 44(3), 383–389
http://journals.cambridge.org Downloaded: 08 Oct 2014 IP address: 204.187.23.196
of tiger signs. In Ranges where tiger signs were too fewfor computing detection probabilities we used the averagedetection probability of tiger sign obtained from allsamples for parameter estimation (Mackenzie et al.,2005). Based on tiger signs encountered per km walked,the Beats were stratified as having high, medium, low andno tiger signs, and were mapped using ArcMap v. 9.2(ESRI, Redlands, USA).
A contiguous area of 103 km2 with high tiger occupancy,as indicated by signs, was selected for estimating tigerpopulation and density using camera traps (TrailmasterInc., Lenexa, USA; Karanth & Nichols, 1998) in Panna TigerReserve. A 2 x 2 km grid was superimposed on the studyarea and an intensive ground survey was carried out to findthe best location within each grid to deploy a set of cameratraps so as to maximize the chances of photographinga tiger. Forty cameras were deployed in pairs over March–April 2006 (Fig. 1) to obtain photographs of both flanks ofany tigers. The study area was divided into two blocks andcameras moved between blocks at 5-day intervals. Acapture matrix was constructed following Karanth et al.(2004a). The first day of camera trapping of each block wascombined to constitute the first occasion. Thus, by com-bining subsequent days of camera trapping we had a totalof 20 occasions, with 40 days of sampling, amounting to800 trap nights. Individual tigers were identified from theirunique stripe patterns (Karanth & Nichols, 1998). An Xmatrix (Pollock & Otis, 1983) generated from the capturehistories of the photo-captured tigers was analysed ina closed population mark-recapture framework (Chao &Huggins, 2005). We used software CAPTURE (Rexstad &Burnham, 1991), which uses a series of goodness of fit teststo compare the null (Mo), time effects (Mt), behavioureffects (Mb) and individual heterogeneity models (Mh), andcombinations of these. It then uses discriminant functionanalysis for model selection and scores the best fit modelwith a score close to one. We tested the population closureassumption using software CloseTest (Stanley & Burnham,1999).
For computing tiger density the outermost cameralocations were joined to form a minimum convex polygon
(Fig. 1). The non-tiger habitats of human settlements andmining activity were removed from this polygon. Theeffective trapping area was estimated by adding half ofthe mean maximum distance moved (½MMDM) by recap-tured tigers to the minimum convex polygon (Nichols &Karanth, 2002).
Three replicates of 14 3-km long line transects werewalked between March–April 2006 (Fig. 1) within thecamera trap area. For all animal sightings we recordedspecies, group size, angular distance using a laser rangefinder and bearing using a sighting compass. SoftwareDistance V (Buckland et al., 2001) was used to computedensity of ungulates (chital Axis axis, sambar Cervus uni-color, nilgai Boselaphus tragocamelus, chousingha Tetracerosquadricornis, chinkara Gazella bennettii and wild pig Susscrofa).
Results
A total of 5,385 km were walked in 1,077 surveys covering 359
Beats of 21 Ranges. Six of the Ranges had tiger signs, givinga naı̈ve estimate of 28.6% Range occupancy. After accountingfor detection probability of tiger signs, the biased-correctedRange occupancy obtained using PRESENCE was 29% – SE 1.The mean detection probability of tiger signs was 0.32 – SE0.03. Within the occupied Ranges of the Reserve 36 of 54
Beats had tiger signs, giving a naı̈ve estimate of Beat usage bytigers of 67%. Bias-corrected mean Beat occupancy obtainedwith software PRESENCE was 0.68 – SE 0.07 for the Reserve,with a mean detection probability of 0.74 – SE 0.05 for tigersigns. Beat occupancy was highest in Hinauta and PannaRanges (Table 1).
Camera-trapping was carried out in 44% of the tiger-occupied habitat and the mean effective trapping area of185 – SE 15.8 km2 covered all Beats with high tiger signs(Fig. 1). Fifteen photographs of seven individual tigers (fourmales, two females and one of unidentified gender) wereobtained. Software CAPTURE selected model Mh, incorpo-rating individual heterogeneity in capture probabilities, asthe best fit, closely followed by the null model Mo (score0.96). The average capture probability of tigers was 0.09 for
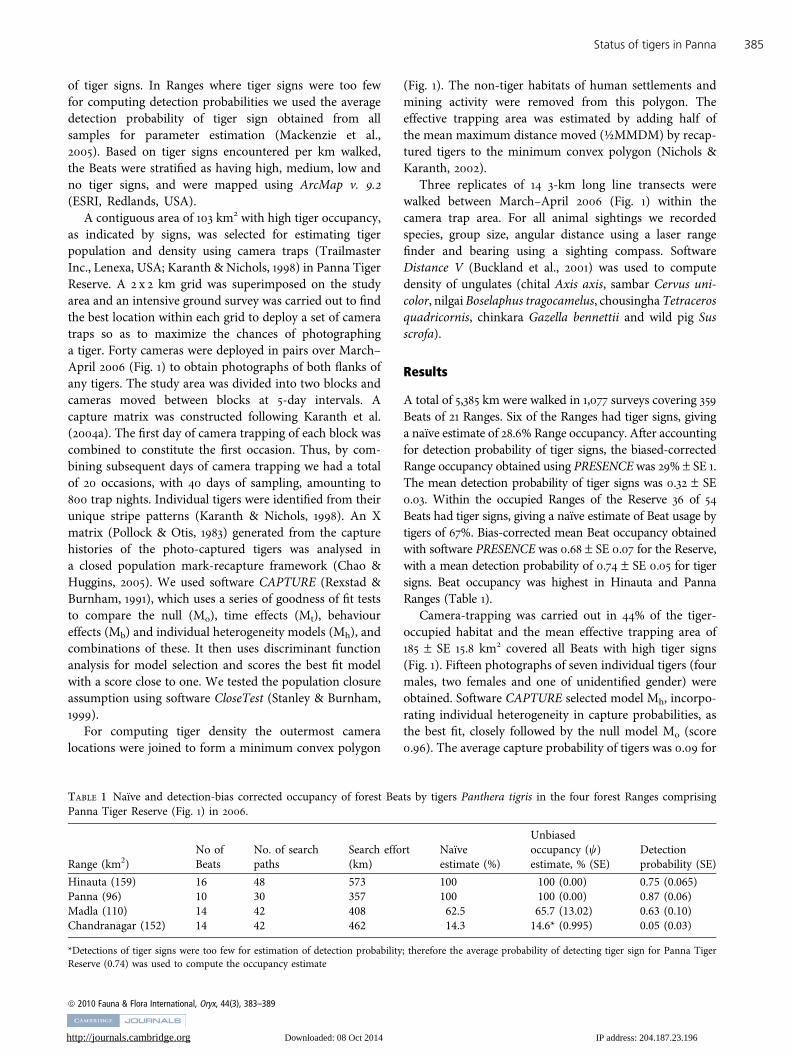
TABLE 1 Naı̈ve and detection-bias corrected occupancy of forest Beats by tigers Panthera tigris in the four forest Ranges comprisingPanna Tiger Reserve (Fig. 1) in 2006.
Range (km2)No ofBeats
No. of searchpaths
Search effort(km)
Naı̈veestimate (%)
Unbiasedoccupancy (w)estimate, % (SE)
Detectionprobability (SE)
Hinauta (159) 16 48 573 100 100 (0.00) 0.75 (0.065)Panna (96) 10 30 357 100 100 (0.00) 0.87 (0.06)Madla (110) 14 42 408 62.5 65.7 (13.02) 0.63 (0.10)Chandranagar (152) 14 42 462 14.3 14.6* (0.995) 0.05 (0.03)
*Detections of tiger signs were too few for estimation of detection probability; therefore the average probability of detecting tiger sign for Panna TigerReserve (0.74) was used to compute the occupancy estimate
Status of tigers in Panna 385
ª 2010 Fauna & Flora International, Oryx, 44(3), 383–389
http://journals.cambridge.org Downloaded: 08 Oct 2014 IP address: 204.187.23.196
model Mh. The overall probability of capturing a tigerwithin the study area (Mt+1
/N) was 77%. Over the trappingduration of 40 days the tiger population was found to beclosed (v2 5 14.18, df 5 13, P 5 0.36).
Using model Mh the interpolated mean jackknife pop-ulation estimate was 9 – SE 2 tigers (Table 2). The meanmaximum distance moved by recaptured tigers was 3.9 – SE0.7 km. The effective trapping area was 185 – SE 15.8 km2
(Fig. 1). Mean tiger density in the study area was thusestimated to be 4.9 – SE 1.5 tigers per 100 km2 (Table 2).
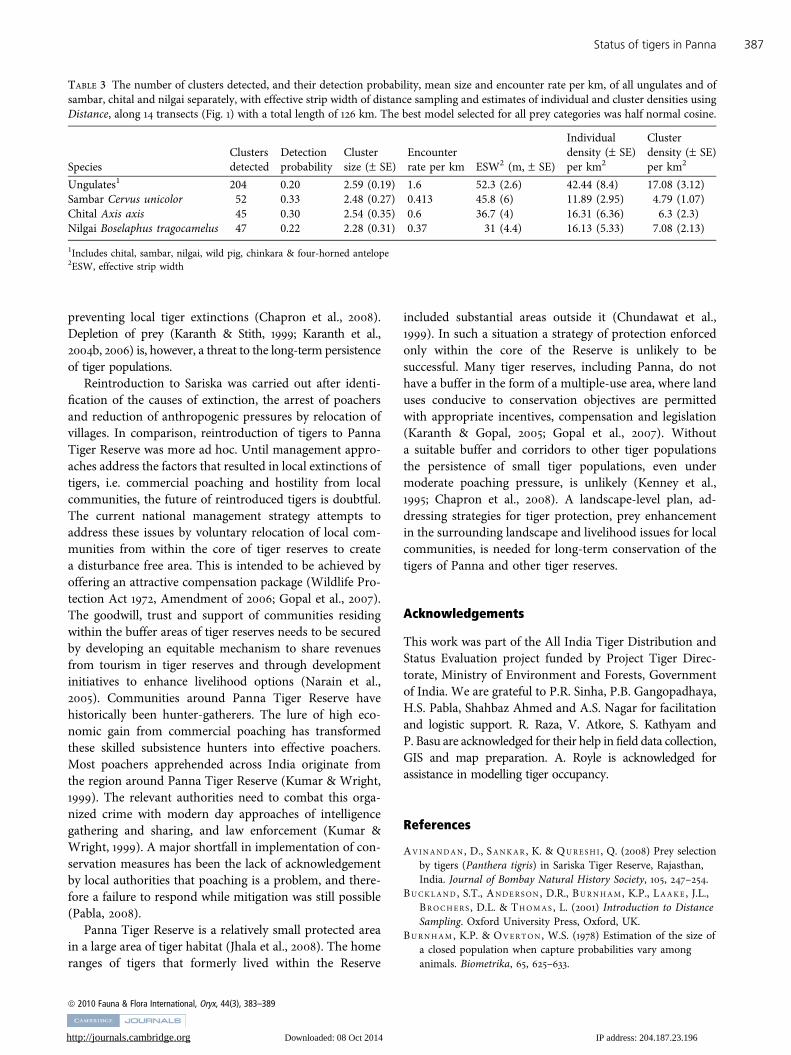
Mean wild ungulate density was estimated to be 42.44 –SE 8.4 individuals km-2 (Table 3). The major prey species oftigers (sambar, chital and nilgai) were sighted in numberssufficient to enable computation of their densities (Table 3)using software DISTANCE.
Discussion
Occupancy estimates incorporating correction for imper-fect detection gave a non-significant increment in area oc-cupied by tigers over the naı̈ve estimate. The bias-correctedestimate of tiger occupancy for Ranges was 0.4% higher andthat for Beats 0.88% higher than the naı̈ve estimate. Of thesix Ranges that had tiger signs, four are within Panna TigerReserve. The two Ranges outside the Reserve with tigersigns were Amanganj and Semaria, in both of which tigersigns were recorded in only 1–2 Beats. Thus, it appears thatPanna Tiger Reserve is the source population and thesurrounding forested landscape a sink. The Beat occupancyestimates along with their standard errors within tigeroccupied Ranges of the Reserve provide a more site-specificparameter for evaluating tiger status as they provide anindex of intensity of use that incorporates corrections forimperfect detection. Because this is the first time anoccupancy analysis has been carried out for the Reservethere are no past data for comparison. However, we did notrecord tiger signs in several of the Beats where tiger signswere seen in 2005 (as recorded in a questionnaire to theBeat guards; Jhala et al., 2005b) even within the Reserve,suggesting a decline in the area occupied by tigers as earlyas 2006 (Fig. 1).
Our camera trap area (185 km2) was a subset of thatsampled in 2002 (418.14 km2) by Karanth et al. (2004a) andcovered all the Beats with high to medium density of tigersigns (Fig. 1). Our estimate of 4.9 – SE 1.5 tigers per 100 km2
is lower than that reported for 2002 (6.94 – SE 3.23 tigersper 100 km2; Karanth et al., 2004a). This suggests a declinein tiger density in the core area of the Reserve, although thedifference between the two estimates was not statisticallysignificant. The sex ratio of the camera-trapped tigers washighly skewed towards adult males (2 males:1 female). Thephoto-captured tiger that could not be sexed was also mostlikely a male based on the size and shape of its pugmarks(Sharma et al., 2003). A similar male-biased sex ratio wasalso reported from Sariska Tiger Reserve prior to localextinction (Q. Qureshi, pers. obs.). Ungulate densities inPanna Tiger Reserve are comparable to those in otherprotected areas of India where large carnivores, includingtigers, survive (Johnsingh, 1983; Varman & Sukumar, 1995;Karanth & Nichols, 1998).
Two of the photo-captured tigers were killed by poison-ing during the latter part of 2006. Subsequently, PannaTiger Reserve was occupied by dacoits in 2006 and anti-insurgency activities by the authorities lasted until 2008. In2006–2007 local farmers on the periphery of the Reserveretaliated against the management for preventing themfrom farming illegally within the Reserve. These conflictsand hostile activities further compromised the protection ofthe Reserve and resulted in a further decline of the tigerpopulation. Only a single male tiger appeared to remain inPanna Tiger Reserve by late December 2008 and he was lastseen in January 2009 by Reserve staff. Subsequent visits byQQ and RG to the Reserve confirmed that after January2009 no authenticated signs of tigers have been reported.
Madhya Pradesh Forest Department, in collaborationwith the National Tiger, Authority and the Wildlife In-stitute of India conservation have reintroduced two femaleand one male tiger to Panna Tiger Reserve from neighbour-ing Bandhavgarh and Kanha Tiger Reserves. Three tigersfrom Ranthambore Tiger Reserve have been reintroducedin Sariska Tiger Reserve. The local extinction of tigers inPanna Tiger Reserve in 2009, along with local extinction oftigers in Sariska Tiger Reserve in 2004 (Check, 2006),exemplifies the vulnerability of tigers in small isolatedreserves to organized commercial poaching, human-causeddeaths, and hostility from disgruntled local communitiesresiding within and around the reserves. Both Sariska(Avinandan et al., 2008) and Panna Tiger Reserves stillhave reasonably high prey densities. According to thepredictive equations of Carbone & Gittleman (2002) andKaranth et al. (2004b), Sariska and Panna have sufficientprey biomass to support 10–17 tigers per 100 km2 in theircore areas. Nevertheless tiger populations went extinct inboth these reserves, supporting the notion that controllinghuman-induced mortality is of paramount importance in
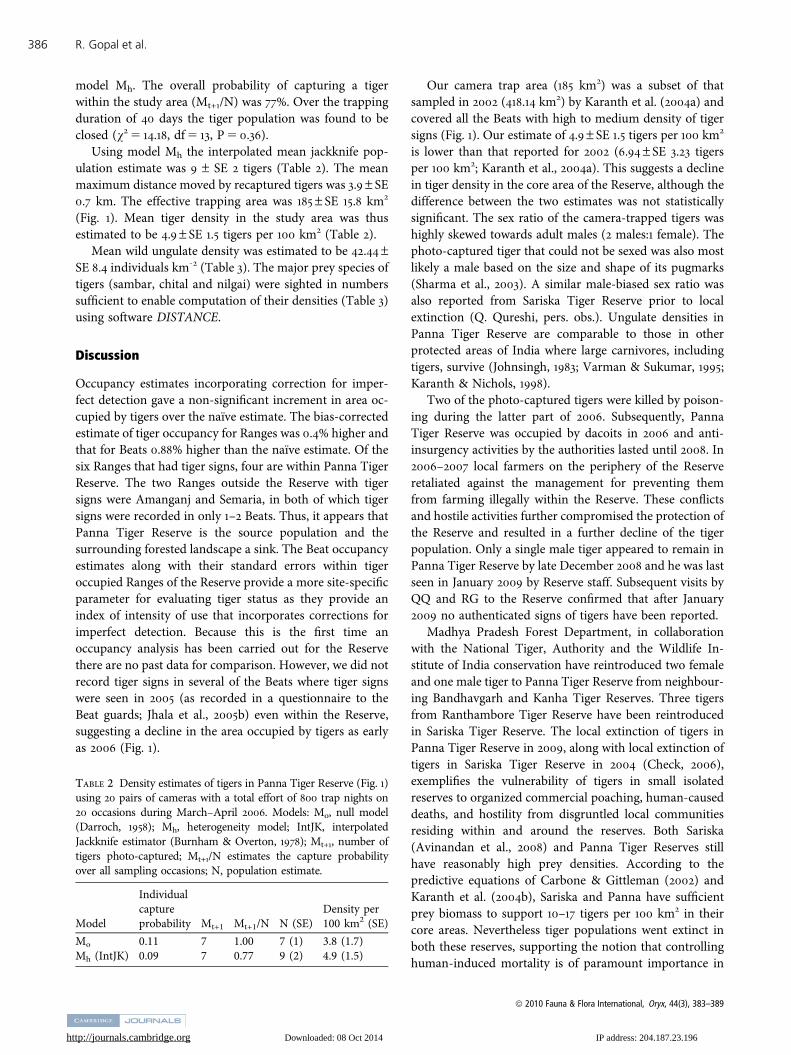
TABLE 2 Density estimates of tigers in Panna Tiger Reserve (Fig. 1)using 20 pairs of cameras with a total effort of 800 trap nights on20 occasions during March–April 2006. Models: Mo, null model(Darroch, 1958); Mh, heterogeneity model; IntJK, interpolatedJackknife estimator (Burnham & Overton, 1978); Mt+1
, number oftigers photo-captured; Mt+1
/N estimates the capture probabilityover all sampling occasions; N, population estimate.
Model
Individualcaptureprobability Mt+1 Mt+1/N N (SE)
Density per100 km2 (SE)
Mo 0.11 7 1.00 7 (1) 3.8 (1.7)Mh (IntJK) 0.09 7 0.77 9 (2) 4.9 (1.5)
R. Gopal et al.386
ª 2010 Fauna & Flora International, Oryx, 44(3), 383–389
http://journals.cambridge.org Downloaded: 08 Oct 2014 IP address: 204.187.23.196
preventing local tiger extinctions (Chapron et al., 2008).Depletion of prey (Karanth & Stith, 1999; Karanth et al.,2004b, 2006) is, however, a threat to the long-term persistenceof tiger populations.
Reintroduction to Sariska was carried out after identi-fication of the causes of extinction, the arrest of poachersand reduction of anthropogenic pressures by relocation ofvillages. In comparison, reintroduction of tigers to PannaTiger Reserve was more ad hoc. Until management appro-aches address the factors that resulted in local extinctions oftigers, i.e. commercial poaching and hostility from localcommunities, the future of reintroduced tigers is doubtful.The current national management strategy attempts toaddress these issues by voluntary relocation of local com-munities from within the core of tiger reserves to createa disturbance free area. This is intended to be achieved byoffering an attractive compensation package (Wildlife Pro-tection Act 1972, Amendment of 2006; Gopal et al., 2007).The goodwill, trust and support of communities residingwithin the buffer areas of tiger reserves needs to be securedby developing an equitable mechanism to share revenuesfrom tourism in tiger reserves and through developmentinitiatives to enhance livelihood options (Narain et al.,2005). Communities around Panna Tiger Reserve havehistorically been hunter-gatherers. The lure of high eco-nomic gain from commercial poaching has transformedthese skilled subsistence hunters into effective poachers.Most poachers apprehended across India originate fromthe region around Panna Tiger Reserve (Kumar & Wright,1999). The relevant authorities need to combat this orga-nized crime with modern day approaches of intelligencegathering and sharing, and law enforcement (Kumar &Wright, 1999). A major shortfall in implementation of con-servation measures has been the lack of acknowledgementby local authorities that poaching is a problem, and there-fore a failure to respond while mitigation was still possible(Pabla, 2008).
Panna Tiger Reserve is a relatively small protected areain a large area of tiger habitat (Jhala et al., 2008). The homeranges of tigers that formerly lived within the Reserve
included substantial areas outside it (Chundawat et al.,1999). In such a situation a strategy of protection enforcedonly within the core of the Reserve is unlikely to besuccessful. Many tiger reserves, including Panna, do nothave a buffer in the form of a multiple-use area, where landuses conducive to conservation objectives are permittedwith appropriate incentives, compensation and legislation(Karanth & Gopal, 2005; Gopal et al., 2007). Withouta suitable buffer and corridors to other tiger populationsthe persistence of small tiger populations, even undermoderate poaching pressure, is unlikely (Kenney et al.,1995; Chapron et al., 2008). A landscape-level plan, ad-dressing strategies for tiger protection, prey enhancementin the surrounding landscape and livelihood issues for localcommunities, is needed for long-term conservation of thetigers of Panna and other tiger reserves.
Acknowledgements
This work was part of the All India Tiger Distribution andStatus Evaluation project funded by Project Tiger Direc-torate, Ministry of Environment and Forests, Governmentof India. We are grateful to P.R. Sinha, P.B. Gangopadhaya,H.S. Pabla, Shahbaz Ahmed and A.S. Nagar for facilitationand logistic support. R. Raza, V. Atkore, S. Kathyam andP. Basu are acknowledged for their help in field data collection,GIS and map preparation. A. Royle is acknowledged forassistance in modelling tiger occupancy.
References
A V I N A N D A N , D., S A N K A R , K. & Q U R E S H I , Q. (2008) Prey selectionby tigers (Panthera tigris) in Sariska Tiger Reserve, Rajasthan,India. Journal of Bombay Natural History Society, 105, 247–254.
B U C K L A N D , S.T., A N D E R S O N , D.R., B U R N H A M , K.P., L A A K E , J.L.,B R O C H E R S , D.L. & T H O M A S , L. (2001) Introduction to DistanceSampling. Oxford University Press, Oxford, UK.
B U R N H A M , K.P. & O V E R T O N , W.S. (1978) Estimation of the size ofa closed population when capture probabilities vary amonganimals. Biometrika, 65, 625–633.
TABLE 3 The number of clusters detected, and their detection probability, mean size and encounter rate per km, of all ungulates and ofsambar, chital and nilgai separately, with effective strip width of distance sampling and estimates of individual and cluster densities usingDistance, along 14 transects (Fig. 1) with a total length of 126 km. The best model selected for all prey categories was half normal cosine.
SpeciesClustersdetected
Detectionprobability
Clustersize (– SE)
Encounterrate per km ESW2 (m, – SE)
Individualdensity (– SE)per km2
Clusterdensity (– SE)per km2
Ungulates1 204 0.20 2.59 (0.19) 1.6 52.3 (2.6) 42.44 (8.4) 17.08 (3.12)Sambar Cervus unicolor 52 0.33 2.48 (0.27) 0.413 45.8 (6) 11.89 (2.95) 4.79 (1.07)Chital Axis axis 45 0.30 2.54 (0.35) 0.6 36.7 (4) 16.31 (6.36) 6.3 (2.3)Nilgai Boselaphus tragocamelus 47 0.22 2.28 (0.31) 0.37 31 (4.4) 16.13 (5.33) 7.08 (2.13)
1Includes chital, sambar, nilgai, wild pig, chinkara & four-horned antelope2ESW, effective strip width
Status of tigers in Panna 387
ª 2010 Fauna & Flora International, Oryx, 44(3), 383–389
http://journals.cambridge.org Downloaded: 08 Oct 2014 IP address: 204.187.23.196
C A R B O N E , C. & G I T T L E M A N , J.L. (2002) A common rule for thescaling of carnivore density. Science, 295, 2273–2276.
C H A O , A. & H U G G I N S , R.M. (2005) Classical closed populationcapture-recapture models. In Handbook of Capture-recaptureAnalysis (eds S.C. Amstrup, T.L. McDonald & B.F.J. Manly),pp. 22–35. Princeton University Press, Princeton, USA.
C H A M P I O N , H.G. & S E T H , S.K. (1968) The Forest Types of India.Government of India Publications, New Delhi, India.
C H A P R O N , G., M I Q U E L L E , D.G., L A M B E R T , A., G O O D R I C H , J.M.,L E G E N D R E , S. & C L O B E R T , J. (2008) The impact on tigers ofpoaching versus prey depletion. Journal of Applied Ecology, 45,1667–1674.
C H E C K , E. (2006) The tiger’s retreat. Nature, 441, 927–930.C H U N D A W A T , R.S., G O G A T E , N. & J O H N S I N G H , A.J.T. (1999) Tigers
in Panna: preliminary results from an Indian tropical dry forest.In Riding the Tiger: Tiger Conservation in Human-DominatedLandscapes (eds J. Seidensticker, S. Christie & P. Jackson),pp. 123–129. Cambridge University Press, Cambridge, UK.
C H U N D A W A T , R.S., H A B I B , B., K A R A N T H , U., K A W A N I S H I , K.,A H M A D K H A N , J., L Y N A M , T. et al. (2008) Panthera tigris. InIUCN Red List of Threatened Species v. 2010.1. Http://www.iucn-redlist.org [accessed 14 April 2010].
C H U N D A W A T , R. & V A N G R U I S E N , J. et al. (2008) Panna’s tigers:have they gone the Sariska way? Nothing is gained by denial.Sanctuary Asia, June 2008, 44–46.
D A R R O C H , J.N. (1958) The multiple-recapture census I. Estimation ofa closed population. Biometrika, 45, 343–359.
D I N E R S T E I N , E., L O U C K S , C., W I K R A M A N A Y A K E , E., G I N S B E R G , J.,S A N D E R S O N , E., S E I D E N S T I C K E R , J. et al. (2007) The fate of wildtigers. Bioscience, 57, 508–514.
G O P A L , R., S I N H A , P.R., M A T H U R , V.B., J H A L A , Y.V. & Q U R E S H I ,Q. (2007) Guidelines for Preparation of Tiger Conservation Plan.The National Tiger Conservation Authority, Ministry of Envi-ronment and Forests, Government of India, New Delhi, India.
H I N E S , J.E. (2006) Presence v. 2.0. Http://www.mbr-pwrc.usgs.gov/software/presence.html [accessed January 2009].
JHALA, Y.V., GOPAL, R. & QURESHI, Q. (eds) (2008) Status of Tigers,Co-predators and Prey in India. National Tiger ConservationAuthority, New Delhi, and Wildlife Institute of India, Dehradun,India.
J H A L A , Y.V., Q U R E S H I , Q. & G O P A L , R. (2005a) Methodology forestimating and monitoring tiger, prey and habitat: technical note.In Joining the Dots: The Report of the Tiger Task Force (eds S.Narain, H.S. Panwar, M. Gadgil, V. Thapar & S. Singh), pp. 193–197. Project Tiger, Ministry of Environment and Forests,New Delhi, India.
J H A L A , Y.V., Q U R E S H I , Q. & G O P A L , R. (2005b) Monitoring Tigers,Co-predators, Prey and their Habitat. A Field Guide. Technicalpublication of Project Tiger Directorate, New Delhi and WildlifeInstitute of India, Dehradun, India.
J O H N S I N G H , A.J.T. (1983) Large mammalian prey-predator inBandipur. Journal of Bombay Natural History Society, 80, 1–57.
K A R A N T H , K.U., C H U N D A W A T , R.S., N I C H O L S , J.D. & K U M A R , N.S.(2004a) Estimation of tiger densities in the tropical dry forests ofPanna, Central India, using photographic capture-recapturesampling. Animal Conservation, 7, 285–290.
K A R A N T H , K.U. & G O P A L , R. (2005) An ecology-based policyframework for human-tiger coexistence in India. In People andWildlife: Conflict or Coexistance? (eds R. Woodroffe, S. Thirgood &A. Robinowitz), pp. 373–387. Cambridge University Press,Cambridge, UK.
K A R A N T H , K.U. & N I C H O L S , J.D. (1998) Estimating tiger densities inIndia from camera trap data using photographic capture andrecaptures. Ecology, 79, 2852–2862.
K A R A N T H , K.U. & N I C H O L S , J.D. (2002) Monitoring Tigers and theirPrey: A Manual for Researchers, Managers and Conservationistsin Tropical Asia. Centre for Wildlife Studies, Bangalore,India.
K A R A N T H , K.U., N I C H O L S , J.D., K U M A R , N. & H I N E S , J.E. (2006)Assessing tiger population dynamics using photographic capture-recapture sampling. Ecology, 8, 2925–2937.
K A R A N T H , K.U., N I C H O L S , J.D., K U M A R , N., L I N K , W.A. & H I N E S ,J.E. (2004b) Tigers and their prey: predicting carnivore densitiesfrom prey abundance. Proceedings of the National Academy ofSciences of the USA, 101, 4854–4858.
K A R A N T H , K.U., N I C H O L S , J.D., S E I D E N S T I C K E R , J., D I N E R S T E I N ,E., S M I T H , J.L.D., M C D O U G A L , C. et al. (2003) Science deficiencyin conservation practice: the monitoring of tiger populations inIndia. Animal Conservation, 6, 141–146.
K A R A N T H , K.U. & S T I T H , B.M. (1999) Prey depletion as a criticaldeterminant of tiger population viability. In Riding the Tiger: TigerConservation in Human-dominated Landscapes (eds J.Seidensticker, S. Christie & P. Jackson), pp. 100–113. CambridgeUniversity Press, Cambridge, UK.
K E N N E Y , J.S., S M I T H , J.L.D., S T A R F I E L D , A.M. & M C D O U G A L , C.W.(1995) The long term effects of tiger poaching on populationviability. Conservation Biology, 9, 1127–1133.
K U M A R , A. & W R I G H T , B. (1999) Combating tiger poaching andillegal wildlife trade in India. In Riding the Tiger: Tiger Conser-vation in Human-dominated Landscapes (eds J. Seidensticker,S. Christie & P. Jackson), pp. 243–251. Cambridge UniversityPress, Cambridge, UK.
L I N K I E , M., C H A P R O N , G., M A R T Y R , D.J., H O L D E N , J. &L E A D E R -W I L L I A M S , N. (2006) Assessing the viability of tigerpopulations in fragmented landscapes. Journal of Applied Ecology,43, 576–586.
M A C K E N Z I E , D.I., N I C H O L S , J.D., H I N E S , J.E., K N U T S O N , M.G. &F R A N K L I N , A.B. (2003) Estimating site occupancy, colonizationand local extinction when a species is detected imperfectly.Ecology, 84, 2200–2207.
M A C K E N Z I E , D.I., N I C H O L S , J.D., S U T T O N , N., K A W A N I S H I , K. &B A I L E Y , L.L. (2005) Improving inferences in population studiesof rare species that are detected imperfectly. Ecology, 86,1101–1113.
N A R A I N , S., P A N W A R , H.S., G A D G I L , M., T H A P A R , V. & S I N G H ,S. (2005) Joining the Dots: The Report of the Tiger Task Force.Project Tiger, Ministry of Environment and Forests, New Delhi,India.
N I C H O L S , J.D. & K A R A N T H , K.U. (2002) Statistical concepts:estimating absolute densities of tigers using capture–recapturesampling. In Monitoring Tigers and their Prey: A Manual forResearchers, Managers and Conservationists in Tropical Asia (edsK.U. Karanth & J.D. Nichols), pp. 121–137. Centre for WildlifeStudies, Bangalore, India.
P A B L A , H.S. (2008) Panna’s tigers: have they gone the Sariska way?Nothing is lost in Panna . . .so far. Sanctuary Asia, June 2008,44–46.
P O L L O C K , K.H., N I C H O L S , J.D., B R O W N I E , C. & H I N E S , J.E. (1990)Statistical inference for capture-recapture experiments. WildlifeMonographs, 107.
P O L L O C K , K.H. & O T I S , M.C. (1983) Robust estimation of populationsize in closed animal populations from capture-recaptureexperiments. Biometrics, 39, 1035–1049.
Q U R E S H I , Q., G O P A L , R., K A T H Y A M , S., B A S U , S., M I T R A , A. &J H A L A , Y.V. (2006) Evaluating Tiger Habitat at the Tehsil Level.Project Tiger Directorate, Government of India, New Delhi, andWildlife Institute of India, Dehradun, India.
R. Gopal et al.388
ª 2010 Fauna & Flora International, Oryx, 44(3), 383–389
http://journals.cambridge.org Downloaded: 08 Oct 2014 IP address: 204.187.23.196
R E X S T A D , E. & B U R N H A M , K.P. (1991) User’s Guide forInteractive Program CAPTURE. Abundance Estimation ofClosed Animal Populations. Colorado State University, FortCollins, USA.
S H A R M A , S., J H A L A , Y. & S A W A R K A R , V.B. (2003) Gender discrim-ination of tigers by using their pugmarks. Wildlife Society Bulletin,31, 258–264.
S I N H A , A. (2007) Panna could be next Sariska, alarm bells ring over notiger sightings. The Indian Express, New Delhi edition, 19
December 2007 [http://www.indianexpress.com/news/panna-could-be-next-sariska-alarm-bells-ring-over-no-tiger-sightings/252378/0, accessed 14 June 2010].
S T A N L E Y , T.R. & B U R N H A M , K.P. (1999) A closure test for timespecific capture-recapture data. Environment & Ecological Statis-tics, 6, 197–209.
S U N Q U I S T , M., K A R A N T H , K.U. & S U N Q U I S T , F. (1999) Ecology,behaviour and resilience of the tiger and its conservation needs. InRiding the Tiger: Tiger Conservation in Human-dominatedLandscapes (eds J. Seidensticker, S. Christie & P. Jackson),pp. 5–18. Cambridge University Press, Cambridge, UK.
V A R M A N , K.S. & S U K U M A R , R. (1995) The line transect method forestimating densities of large mammals in a tropical deciduous
forest: an evaluation of models and field experiment. Journal ofBiosciences, 20, 273–287.
Biographical sketches
R A J E S H G O P A L is an Indian Forest Service officer from MadhyaPradesh with more than 2 decades of experience managing tigerreserves. For the past 7 years he has headed the Project TigerDirectorate at the Government of India. He previously studiedbarasingha Cervus duvaucelii. Q A M A R Q U R E S H I has a particularinterest in GIS applications and landscape modelling for conservationplanning. M A N I S H B H A R D W A J evaluated the status of tigers as partof the India Tiger Monitoring Project and is currently involved ina research project on insects in the Western Himalaya, with a specialinterest on the altitudinal distribution of butterfly communities. R.K.J A G A D I S H S I N G H also evaluated the status of tigers as part of the IndiaTiger Monitoring Project and is currently working as an environmentalimpact assessment consultant. Y A D V E N D R A D E V J H A L A studies theecology of large carnivores and has ongoing research projects on Indianwolves, Asiatic lions, striped hyenas and tigers.
Status of tigers in Panna 389
ª 2010 Fauna & Flora International, Oryx, 44(3), 383–389