Embed Size (px)
Citation preview
1
Event-Based Media Enrichment using an AdaptiveProbabilistic Hypergraph Model
Xueliang Liu, Meng Wang, Bao-Cai Yin, Benoit Huet, Xuelong Li, Fellow, IEEE
Abstract—Nowadays, with the continual development of digitalcapture technologies and social media services, a vast numberof media documents are captured and shared online to helpattendees record their experience during events. In this paper, wepresent a method combining semantic inference and multimodalanalysis for automatically finding media content to illustrateevents using an adaptive probabilistic hypergraph model. Inthis model, media items are taken as vertices in the weightedhypergraph and the task of enriching media to illustrate events isformulated as a ranking problem. In our method, each hyperedgeis constructed using the K-nearest neighbors of a given mediadocument. We also employ a probabilistic representation, whichassigns each vertex to a hyperedge in a probabilistic way, tofurther exploit the correlation among media data. Furthermore,we optimize the hypergraph weights in a regularization frame-work, which is solved as a second-order cone problem. Theapproach is initiated by seed media and then used to rank themedia documents using a transductive inference process. Theresults obtained from validating the approach on an event datasetcollected from EventMedia demonstrate the effectiveness of theproposed approach.
Index Terms—Event enrichment, hypergraph, transductivelearning.
I. INTRODUCTION
In recent years, we have witnessed a growth in the pop-ularity of social media websites, such as Flickr, YouTube,and Facebook. These social media sites provide an interactivesharing platform where vast amounts of unstructured data areuploaded every minute. How we can benefit from such richmedia is still an open and challenging problem.
Events are a natural way of referring to any observableoccurrence grouping persons, places, times, and activities thatcan be described [37]. Events are also observable experiencesthat are more and more frequently documented by peoplethrough different media (e.g., videos and photos). To helpusers grasp events effectively, various event browsing andsearching platforms have been built, which have benefitedgreatly from social media event content, e.g., eventful.com,upcoming.org, last.fm, and Facebook.com/events, to name buta few. These services sometimes have an explicit connection
X. Liu and M. Wang is with School of Computer Science and InformationEngineering, Hefei University of Technology, Hefei 230009, China. E-mail:[email protected].
B.-C. Yin is with the School of Transportation, Beijing University ofTechnology, Beijing 100124, China.
B. Huet is with department of Multimedia, EURECOM, sophia-antipolis,06904, France. E-mail: [email protected].
X. Li is with the Center for OPTical IMagery Analysis and Learning(OPTIMAL), State Key Laboratory of Transient Optics and Photonics, Xi’anInstitute of Optics and Precision Mechanics, Chinese Academy of Sciences,Xi’an 710119, Shanxi, P. R. China. Email: xuelong [email protected].
with media sharing platforms. Often there is overlap in termsof coverage of upcoming events. Moreover, they provide socialnetwork features to support users in sharing and decidingupon attending events. However, in these Web services, lessattention is paid to improving the end-user experience whensearching and browsing content, while the functionality offinding target media content to provide vivid information ongiven events is still missing.
In fact, automatically associating social media content withknown events is a challenging problem owing to the heteroge-neous and noisy nature of the data. In recent years, severalworks have been proposed to investigate searching eventrelated media data. For example, Trad et al. [31] proposed avisual-based method for retrieving events in photo collections,although textual feature, which is very useful in describingmedia content, has not been investigated. Liu et al. [18]developed a framework to associate social media documentswith events in two steps: first, time, location, and textualfeatures are extracted via a query of the media candidateson a given event, and then to improve the performance, avisual filter is created to remove noisy data. Obviously, itis not sufficient to model only the relations among imagesand events. The social media content could be represented bymultimodal features, such as title, description, capture time,location, and so on. Most existing methods explore thesemultimodal features of media data separately or sequentially.Moreover, owing to the lack of comprehensive analysis onmulti-facets of social data, these methods have a marginaleffect on modeling the relation between social multimedia andevents.
In machine learning, employing hypergraph model is anatural way of formulating this kind of complex relation andfully exploiting the multimodal features among social mediadocuments [11], [42]. Hypergraph is a generalization of thegraph model in which an edge can connect a number ofvertices. Each social media document, represented by spatial,temporal, visual, and textual features, is a vertex in a hyper-graph. The hypergraph is then constructed using the K-nearestneighbor method. In other words, for each vertex, its K-nearestneighbors, measured by the similarity of multiple features, areused to generate a hyperedge.
Although the hypergraph is promising and desirable, thereare still many challenges to overcome. First, the traditionalhypergraph model assigns a vertex to a hyperedge by binarydecision, thereby ignoring the diverse information of thedifferent media content. Second, it is hard to find the optimized“K” when constructing the hypergraph model, which plays akey role in building a robust model. Finally, it should be noted
2
that the different modalities have different effects on modelingthe relation between media data and events. In addition, aninvestigation of the weights of different modalities couldfurther improve the performance of the proposed solution.
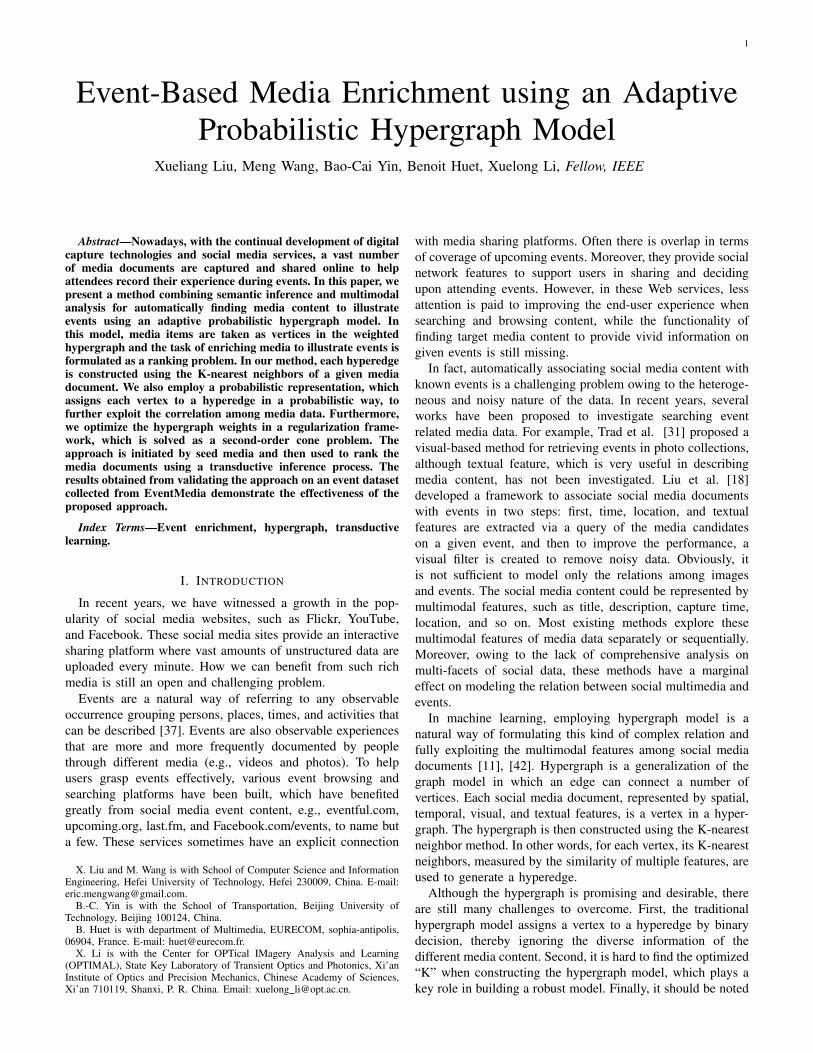
To solve these problems, we propose an adaptive probabilis-tic hypergraph learning method to find media content relevantto a given event. In the proposed method, for each modality,hyperedges are generated by the nearest neighbor method andrepresented in a probabilistic way; then, all the hyperedgesare aggregated as a unified hypergraph model. In addition, wealso optimize the hypergraph weights using a regularizationframework, which further exploits the correlation among me-dia data. An overview of our proposed approach is illustratedin Figure 1. The contribution of this paper is twofold:• We study the event-based media enrichment task as a
ranking problem, and solve it using hypergraph modeling.• To find as much media content as possible for a given
event, we propose an adaptive probabilistic hypergraphmethod to rank the content. In this method, a probabilisticincidence matrix is employed to construct the hyper-graph, while an alternative optimization method is usedto optimize the ranking scores and hypergraph weightssimultaneously.
The remainder of this paper is structured as follows. First,we review some related work in Section II. We then explainour approach for associating media with events in Section IIIand discuss our results in Section V. Finally, our conclusionsare presented in Section VI.
II. RELATED WORK
In this section, we briefly introduce related work on socialevent illustration/detection and hypergraph modeling.
A. Social Event Analysis
In recent years, research on how to better support theend-user experience when searching and browsing multimediacontent has drawn much attention [16] [19]. It is well knownthat vivid photos attract human attention more than textualdescriptions. The authors in [7] aimed to improve users’attention when reading news articles by illustrating the storyand proposed a system to realize this. The application providesmechanisms to select the best illustration for each sceneautomatically and a set of illustrations to improve the storysequence. In [13], an unsupervised approach was proposedto describe stories with automatically collected pictures. Inthis approach, semantic keywords are extracted from the storyand used to search an annotated image database. Then, anovel image-ranking scheme automatically chooses the mostappropriate images. A text-to-picture system that synthesizes apicture from natural language text without limitations, is pre-sented in [43]. The system first identified “picturable” textualunits through natural language processing, then searched forthe most likely image parts based on the text, and finally opti-mized the picture layout based on both the textual and imageparts. Besides the works that illustrate text with photos, somestudies have also been carried out to generate video represen-tation from textual content. For example, the system presented
in [25] creates a visual representation of a given short text. Inthis system, the authors used a variety of techniques to queryimages using a given text string with the novelty being thatthe final images are selected in a user-assisted process and au-tomatically used to create a storyboard animation. All of theseapproaches and systems studied ways of demonstrating textualcontent using multimedia data. In [40], the authors investigatedthe density-based clustering algorithm and proposed a scalabledistance-based clustering technique for Web opinion clusteringto discover ongoing topics of interest and understand howtopics evolve together with the underlying social interactionbetween participants. The authors in [3] proposed a system todetect emerging topics from social streams and illustrate thetopics with corresponding information in multiple modalities.The authors in [4] followed a very similar approach, exploitingthe rich “context” associated with social media content andapplied clustering algorithms to identify social events. In [10],the authors studied the problem of browsing and organiza-tion of picture collections in a natural way, by events, andproposed a method to classify Flickr images into differentevent categories. A demonstration of categorizing photos byevents/subevents through visual content analysis is presentedin [21]. In [9], Twitter messages corresponding to large scalemedia events were investigated to improve event reasoning,visualization, and analytics, while other research has beencarried out to find events directly from Twitter posts [36], [24].In [36], the authors studied how to employ a wavelet-basedtechniques to detect events from Twitter streams. A similarmethod was reported in [6] to detect events from Flickr timeseries data. In [24], the authors investigated how to filter tweetsto detect seismic activity as it occurs. A new scheme wasproposed in [41] to discover and track spatiotemporal patternsin noisy sequences, while in [31], a method was introduced toretrieve event-related photos in collections.
Previous work suggests that fusing multimodal featurescould improve system performance [14], [27], [30], [26]. Thescheme presented in this work attempts to enrich a set ofimages/videos to illustrate social events by matching concertevents with photos based on different modalities, such as text(tags), time, and geo-location, to produce an enriched photoset that better illustrates events. A similar work, presentedin [9], proposed a strategy for extracting valuable informationfrom the overwhelming amount of social media content ona variety of broadcast news. However, this work focusedon filtering noisy information and producing a summary,whereas illustrating events with different media addresses theproblem of how to leverage vivid multimodal content to shareexperiences.
B. Hypergraph ModelingIn machine learning, the graph is a fundamental tool for
modeling pairwise relationships among objects and solvingmany tasks like classification [29], [35], ranking [1], [34], [28],and clustering [14], [23]. For example, in a social network, therelations of different people can be formulated using a graphmodel, where the vertices and edges represent people and theirrelations, respectively. However, graph-based models do nothandle heterogeneous data well.
3
Feature Exaction
Time location
Bag of Word Text
Hypergraph
e1 e2
e3
Ranking
0.876
0.765
0.689
0.432
0.626
Fig. 1: Overview of the proposed method.
As a natural extension of the graph-based model, the hy-pergraph has been employed as a useful tool for modelingmultimodal and high-order data and analyzing the structure ofa system [15], [33].
In [11], a probabilistic hypergraph learning framework forimage retrieval is presented. In this approach, images are takenas vertices in a weighted hypergraph and the task of searchingfor images is formulated as a hypergraph ranking problem.In [38], Wong et al. proposed a hypergraph-based 3D objectdescription method, in which the vertices denote the surfacepatches of an object in a computer-aided design system and thehyperedges represent connections between pairs of boundarysegments. A class-specific hypergraph was proposed in [39] toexplore both scale-invariant-feature-transform (SIFT) featuresand global geometric constraints for object recognition, inwhich the vertices of the constructed hypergraph representimages belonging to an object category.
These works have demonstrated the effectiveness of thehypergraph model in formulating higher-order relationships.Inspired by the probabilistic hypergraph [11], we proposethe adaptive probabilistic hypergraph to model multimodalfeatures among social images and events. In our work, we im-prove the model in [11] by simultaneously learning the rankingscores of image samples and the weights of hyperedges, so thatthe relations among social images can be deeply exploited.
III. HYPERGRAPH LEARNING
A. Problem Formulation
In machine learning, graphs are a fundamental tool formodeling pairwise relationships among objects, where thevertices denote the objects and the relationships between twoobjects are measured by edges. A learning algorithm can beperformed on such a graph to classify unlabeled samples. Forexample, in a social network, the relations of different peoplecould be formulated as a graph model, with the vertices andedges representing people and their relationships, respectively.However, a graph model does not handle heterogeneous datawell. For example, in our problem, an image could be de-scribed by multimodal features, such as title, tags, capturetime, and location, which are difficult to represent as a single
node in a graph model. A natural way of formulating complexrelational objects is the hypergraph model, where an edgecan connect more than two vertices. For convenience, someimportant notations used in this paper are listed in Table I.
Mathematically, let V denote a finite set of objects, and Ebe the family of subsets e of V such that
⋃e∈E = V . Then, we
call G = (V, E ,w) a hypergraph with vertex set V , hyperedgeset E , and hyperedge weight vector w. A |V| × |E| incidencematrix H represents G with the following elements:
H(v, e) =
1, if v ∈ e0, otherwise.
(1)
Equation (1) defines the traditional hypergraph structure,which assigns vertex v to hyperedge e by means of a binarydecision; that is, whether a vertex belongs to an edge. In thismodel, all vertices on a hyperedge are treated equally, but someinformation is lost, which may be harmful to hypergraph-basedapplications.
Similar to [11], in this paper we employ a probabilistichypergraph model to overcome this limitation. The incidencematrix H of a probabilistic hypergraph is defined as
H(v, e) =
Sim(v, e), if v ∈ e0, otherwise.
(2)
Here, Sim(v, e) is defined as the similarity of v and the“centroid” vertex of e, i.e., the vertex that generates hyperedgee. The similarity estimation method is detailed in Section IV.
According to this formulation, vertex v is “softly” assignedto edge e based on the similarity Sim(i, j) between v and e. Inthis way, not only the local grouping information but also theprobability that a vertex belongs to a hyperedge are consideredwhen the graph is constructed, so that the correlation amongvertices is more accurately described.
Based on Equation (2), the vertex degree of each vertexv ∈ V is defined as
d(v) =∑e∈E
w(e)H(v, e), (3)
while the edge degree of hyperedge e ∈ E is given by
δ(e) =∑v∈V
H(v, e). (4)
4
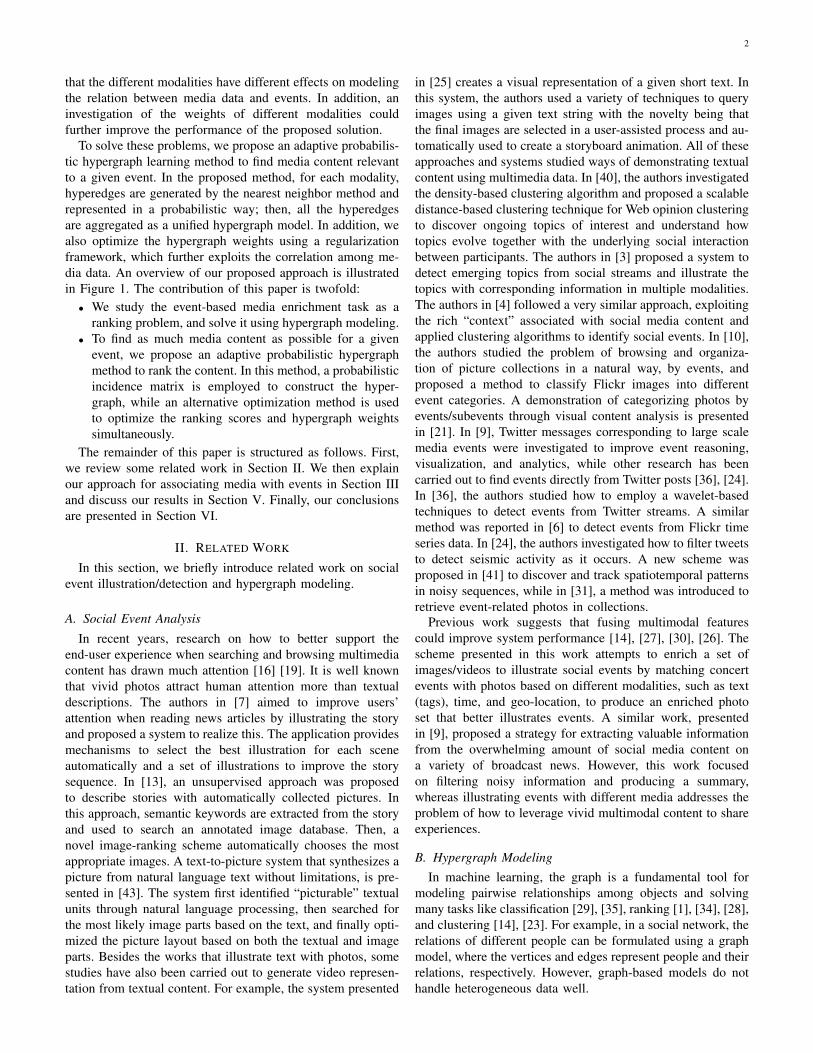
TABLE I: Notations and definitions.
Notation DefinitionX = (x1, x2, . . . , xn) X denotes the media dataset, where xi is the i-th document.
G = (V, E,w)G denotes a hypergraph, where V , E , and w are the set of vertices,set of edges, and weights of the hyperedges, respectively.
n Number of vertices, that is, the size of V .W The diagonal matrix of w .Dv The diagonal matrix of the vertex degree.De The diagonal matrix of the edge degree.H The incidence matrix of the hypergraph.
yThe labels of media samples, in which relevant elements are set to oneand irrelevant elements are set to zero.
L The Laplacian matrix of the hypergraph.f The ranking scores obtained by the proposed method.
We use Dv , De, and W to denote, respectively, the diagonalmatrices of the vertex and hyperedge degrees, and the weights.
In the constructed hypergraph structure, each image isdenoted by a vertex while its K-nearest neighbors are linkedvia a hyperedge. In this setting, the media enrichment problemcan be solved as a ranking problem; that is, ranking themedia candidates according to their relevance to an event.Huang [11] proposed an image ranking framework, but theweights of different edges are directly computed from theweights of the incidence matrix and are not well investigatedin the work. In fact, hyperedges have different effects andperforming a weighting of the hyperedges is useful to exploitthe relevance between the media items and event. In this paper,instead of directly computing the weights from the incidencematrix, we integrate the learning of hyperedge weights intothe formulation, with the hypergraph model formulated as aregularization framework.
arg minf ,w
F = arg minf ,wΩ(f) + λRemp(f) + µΦ(w) (5)
where f is the ranking score to be learned. Ω(f) is theempirical loss defined as
Ω(f) =1
2
∑e∈E
∑u,v∈V
w(e)H(u, e)H(v, e)
δ(e)
×
(f(u)√d(u)
− f(v)√d(v)
)2
. (6)
Letting Θ = D− 1
2v HWD−1e HTD
− 12
v and ∆ = I − Θ, thenormalized cost function can be rewritten as
Ω(f) = fT∆f , (7)
where ∆ is a positive semi-definite matrix, known as theLaplacian of the hypergraph. Remp(f) is the loss functiondefined as
Remp(f) = ‖f − y‖2 =∑v∈V
(f(v)− y(v))2, (8)
where y is the initial label vector, which is computed basedon pseudo-relevant samples in the hypergraph learning algo-rithm. The selection of pseudo-relevant samples is detailed inSection IV.
The last part in model, Φ(w), is a regularizer designed toavoid over-fitting. As we already know, in hypergraph models,
all the hyperedges are initialized with a weight. Obviously,different hyperedges have different effects on modeling therelations in different media. As shown in previous work [8],an optimized weighting is helpful to improve system perfor-mance. In machine learning, a natural approach for optimizingthe weights, w, is regularization, which can be formulated as
Φ(w) = ‖w‖q, (9)
where q = 2 denotes L2 regularization. L2 regularization,which is widely used in machine learning algorithms, de-creases the model’s non-linearity and makes the model robustby penalizing certain parameter configurations. This is theregularization method used in our proposed approach.
With L2 regularization, the optimization function is formu-lated as
arg minf ,w
F = arg minf ,w
fT ∆f + λ‖f − y‖2 + µ
Ne∑i=1
‖wi‖2
s.t.
Ne∑i=1
wi = 1. (10)
The two parameters λ > 0 and µ in Equation (5) are trade-off parameters that balance empirical loss and regularizationterm.
B. Solution
The objective function (10) is not jointly convex withrespect to f and w. However, it is convex with respect to f ifw is fixed, and vice versa. Thus, an alternative optimizationmethod can be used to approximate the optimal parameters.
First, if we fix w, the learning task is to minimize the sumof the two terms [11]:
arg minf ,w
F = arg minf ,w
fT ∆f + λ‖f − y‖2
. (11)
From∂F
∂f= 0
we have that
f(I−Θ) + λ(f − y) = 0
=⇒ f =λ
1 + λ
(I− Θ
1 + λ
)−1y, (12)
where Θ = D−1/2v HWD−1e HTD
−1/2v , as defined previously.
5
Then, with a fixed f , we can optimize parameter w. Nowthe optimization becomes
arg minw
F = arg minw
Ω(f) + µ
Ne∑i=1
‖wi‖2
s.t.
Ne∑i=1
wi = 1. (13)
Letting
γ(e) =1
2
∑u,v∈V
H(u, e)H(v, e)
δ(e)
×
(f(u)√d(u)
− f(v)√d(v)
)2
, (14)
Equation (13) can be rewritten as
arg minw
F = arg minw
wT γ + µ
Ne∑i=1
‖wi‖2
s.t.
Ne∑i=1
wi = 1, (15)
which could be cast as the following second-order coneproblem and solved by the inner-point method [5]:
arg minw,t
wT γ + µt
s.t.
Ne∑i=1
wi = 1, ‖wi‖2 <= ti. (16)
It is worth noting that the computation of γ requires thevalue of d, which is related to w. However, the minimizationof the cost function in Equation (13) is iteratively solved inthe global alternative optimization, and w converges in theiteration.
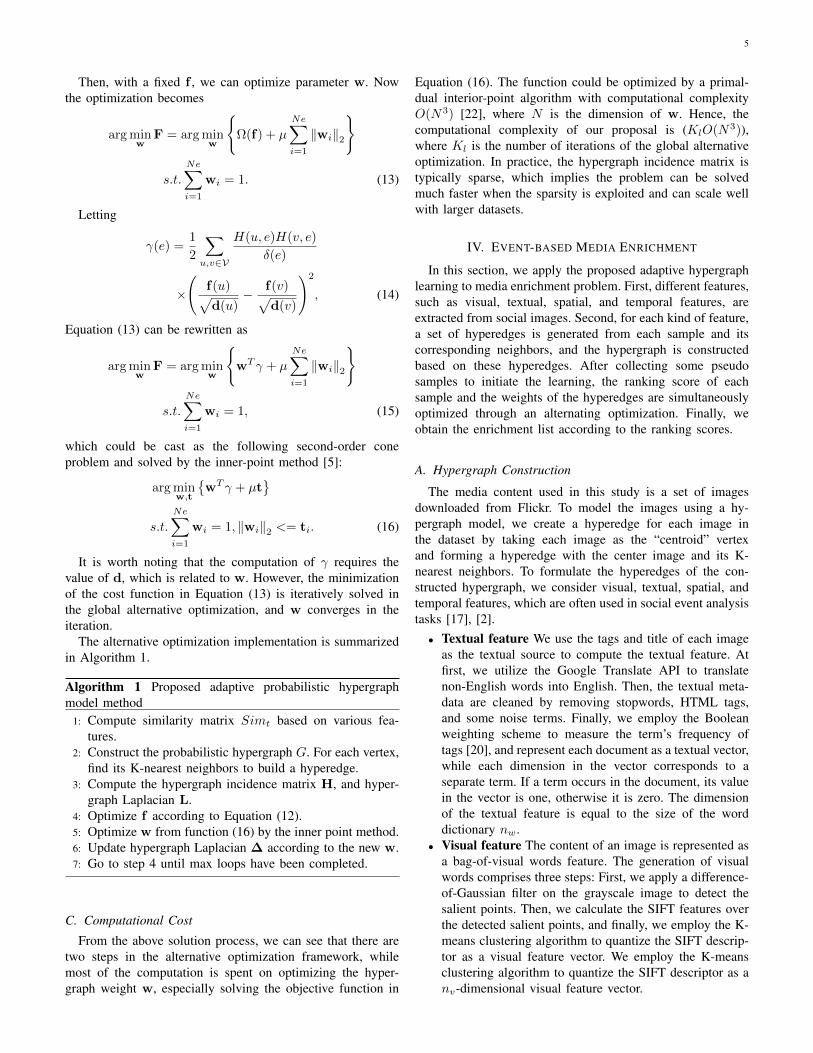
The alternative optimization implementation is summarizedin Algorithm 1.
Algorithm 1 Proposed adaptive probabilistic hypergraphmodel method
1: Compute similarity matrix Simt based on various fea-tures.
2: Construct the probabilistic hypergraph G. For each vertex,find its K-nearest neighbors to build a hyperedge.
3: Compute the hypergraph incidence matrix H, and hyper-graph Laplacian L.
4: Optimize f according to Equation (12).5: Optimize w from function (16) by the inner point method.6: Update hypergraph Laplacian ∆ according to the new w.7: Go to step 4 until max loops have been completed.
C. Computational Cost
From the above solution process, we can see that there aretwo steps in the alternative optimization framework, whilemost of the computation is spent on optimizing the hyper-graph weight w, especially solving the objective function in
Equation (16). The function could be optimized by a primal-dual interior-point algorithm with computational complexityO(N3) [22], where N is the dimension of w. Hence, thecomputational complexity of our proposal is (KlO(N3)),where Kl is the number of iterations of the global alternativeoptimization. In practice, the hypergraph incidence matrix istypically sparse, which implies the problem can be solvedmuch faster when the sparsity is exploited and can scale wellwith larger datasets.
IV. EVENT-BASED MEDIA ENRICHMENT
In this section, we apply the proposed adaptive hypergraphlearning to media enrichment problem. First, different features,such as visual, textual, spatial, and temporal features, areextracted from social images. Second, for each kind of feature,a set of hyperedges is generated from each sample and itscorresponding neighbors, and the hypergraph is constructedbased on these hyperedges. After collecting some pseudosamples to initiate the learning, the ranking score of eachsample and the weights of the hyperedges are simultaneouslyoptimized through an alternating optimization. Finally, weobtain the enrichment list according to the ranking scores.
A. Hypergraph Construction
The media content used in this study is a set of imagesdownloaded from Flickr. To model the images using a hy-pergraph model, we create a hyperedge for each image inthe dataset by taking each image as the “centroid” vertexand forming a hyperedge with the center image and its K-nearest neighbors. To formulate the hyperedges of the con-structed hypergraph, we consider visual, textual, spatial, andtemporal features, which are often used in social event analysistasks [17], [2].• Textual feature We use the tags and title of each image
as the textual source to compute the textual feature. Atfirst, we utilize the Google Translate API to translatenon-English words into English. Then, the textual meta-data are cleaned by removing stopwords, HTML tags,and some noise terms. Finally, we employ the Booleanweighting scheme to measure the term’s frequency oftags [20], and represent each document as a textual vector,while each dimension in the vector corresponds to aseparate term. If a term occurs in the document, its valuein the vector is one, otherwise it is zero. The dimensionof the textual feature is equal to the size of the worddictionary nw.
• Visual feature The content of an image is represented asa bag-of-visual words feature. The generation of visualwords comprises three steps: First, we apply a difference-of-Gaussian filter on the grayscale image to detect thesalient points. Then, we calculate the SIFT features overthe detected salient points, and finally, we employ the K-means clustering algorithm to quantize the SIFT descrip-tor as a visual feature vector. We employ the K-meansclustering algorithm to quantize the SIFT descriptor as anv-dimensional visual feature vector.
6
• Temporal feature Time is one of the key components ofan event. The temporal source used in this paper is thephoto capture time. In our work, we segment the timespan of the images in the dataset every nt days, and eachimage xi is represented by an nt feature vector t, whereti = 1 indicates that xi falls within the i-th interval.
• Location feature To create the location feature, we firstextract the GPS metadata, that is, the latitude and lon-gitude coordinates. Then we use the K-means clusteringalgorithm to cluster the data into nl clusters, the GPSdata for each image is projected onto the cluster, and eachimage pi is represented by an nl feature vector l, whereli = 1 indicates that pi is closed within the i-th clusteringcenter. GPS information is not required in photo metadataand for this reason, the feature vector is filled with zerosif a value is missing.
For each of the above four features, we use Euclideandistance to calculate the distances Distt(i, j), and then wecompute the similarity matrix between two images as
Simt(i, j) = exp(−Distt(i, j)Dt
), (17)
where Dt is the mean value of distances calculated by the t-thfeature.
The hyperedges are constructed based on similarity matrixSimt: we take each media document as the “centroid” vertexand form a hyperedge with the center image and its K-nearest neighbors. That is, for each vertex, its K-nearestneighbors measured by similarity in the feature space generatea hyperedge. All the hyperedges generated based on differentfeatures are aggregated and the final hypergraph is constructedaccordingly.
B. Seed Sample CollectionNote that we use a set of pseudo-relevant samples for
hypergraph learning. In this section, we introduce the pseudo-relevant sample selection method. As is known, title, time, andlocation are three key factors identifying an event. The corre-sponding photo metadata are the textual description, capturetime, and place. Since the three factors are independent, wecan measure the relevance of a given photo P to event E by
R(P,E) = R(P.text, E.title)R(P.time,E.time)R(P.geo, E.geo),(18)
where the first item measures the similarity of the photo textualdescription and event title. As they are short and sparse, themost straightforward way to measure them is
R(Text1, T ext2) =|Text1 ∩ Text2||Text2|
, (19)
where function | · | is the total number of words in a textualvector.
The second item in Equation (18) measures the span be-tween the photo capture time and the event time as
R(Time1, T ime2) = e−|date(Time2−Time1)
Nt|, (20)
where function date(·) calculates the day of the given timespan.
The last item in Equation (18) measures the distance be-tween the photo geotag and the event location. Because of themany photos without geotags, as well as the limited accuracyof GPS data in the Flickr dataset, we only use the city/venuedescription to measure the location feature. The method is thesame as that defined in Equation (19).
All the media documents are ranked by their similarity toa given event and the top Ns samples are selected as seedsamples.
V. EXPERIMENTS
To demonstrate the effectiveness of the proposed approach,we conducted experiments on a dataset collected from Event-Media [32], and used the method proposed in [18] to findmedia candidates illustrating events. We compared the per-formance of the proposed adaptive probabilistic hypergraphlearning approach with the latest ranking approaches, in-cluding K-nearest neighbor-based ranking, graph ranking [1],probabilistic hypergraph ranking, and SVMrank [12].
A. Dataset
To evaluate the proposed approach, we collected an eventdataset originating from EventMedia, which was created byTroncy et al. [32] using linking data techniques. There areabout 100,000 events in this corpus, illustrated by 1.7Mphotos. Since we need sufficient examples for training andtesting, we randomly selected 60 events with at least 50relevant photos each. In total, there are 4560 images withmachine tags in the dataset.
In the dataset, the explicit relationships between theseevents and photos hosted on Flickr can be looked up usingspecial machine tags such as lastfm:event=XXX or upcom-ing:event=XXX. These tags are usually manually generatedby photo uploaders. Hence, media items labeled with relevantmachine tags can be used as positive samples of events.
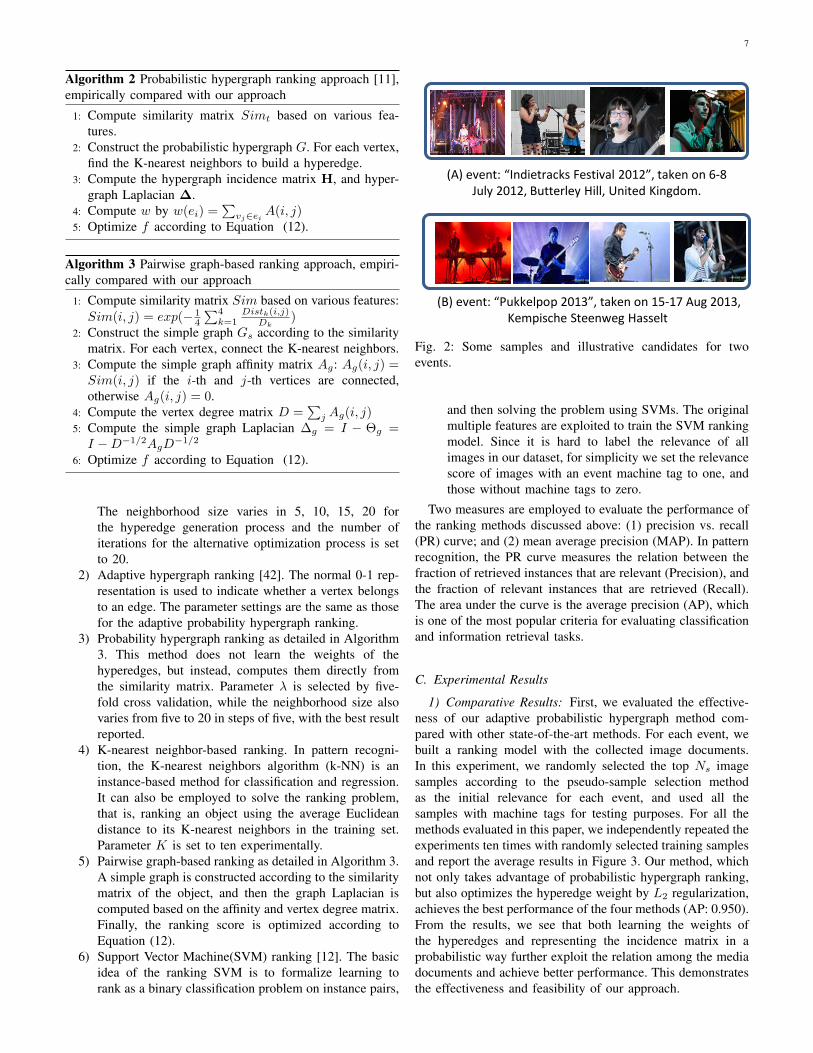
Besides the media items with machine tags, we also col-lected a set of illustrative candidates potentially taken at anevent, according to the method proposed in [18]. In thismethod, the event metadata, such as title and capture place andtime are completely extracted from the event dataset, while anonline query with geographical, temporal, and textual param-eters is performed to collect the social media data potentiallytaken at the event. In total, for the 60 events, 13510, and 5218images were collected by querying Flickr based on “title” and“location”, respectively, with time constraints. Therefore, ourdataset contains 28,288 images in total. Then, for each event,the seed sample collection method was performed to collectpseudo-relevant samples. Some photo samples are illustratedin Figure 2.
B. Experimental configuration
For our event-illustrating task, we compared the proposedadaptive probability hypergraph ranking method with the fol-lowing methods.
1) Proposed adaptive probabilistic hypergraph ranking. Pa-rameters λ and µ are selected by 5-fold cross validation.
7
Algorithm 2 Probabilistic hypergraph ranking approach [11],empirically compared with our approach
1: Compute similarity matrix Simt based on various fea-tures.
2: Construct the probabilistic hypergraph G. For each vertex,find the K-nearest neighbors to build a hyperedge.
3: Compute the hypergraph incidence matrix H, and hyper-graph Laplacian ∆.
4: Compute w by w(ei) =∑
vj∈ei A(i, j)5: Optimize f according to Equation (12).
Algorithm 3 Pairwise graph-based ranking approach, empiri-cally compared with our approach
1: Compute similarity matrix Sim based on various features:Sim(i, j) = exp(− 1
4
∑4k=1
Distk(i,j)Dk
)2: Construct the simple graph Gs according to the similarity
matrix. For each vertex, connect the K-nearest neighbors.3: Compute the simple graph affinity matrix Ag: Ag(i, j) =Sim(i, j) if the i-th and j-th vertices are connected,otherwise Ag(i, j) = 0.
4: Compute the vertex degree matrix D =∑
j Ag(i, j)5: Compute the simple graph Laplacian ∆g = I − Θg =I −D−1/2AgD
−1/2
6: Optimize f according to Equation (12).
The neighborhood size varies in 5, 10, 15, 20 forthe hyperedge generation process and the number ofiterations for the alternative optimization process is setto 20.
2) Adaptive hypergraph ranking [42]. The normal 0-1 rep-resentation is used to indicate whether a vertex belongsto an edge. The parameter settings are the same as thosefor the adaptive probability hypergraph ranking.
3) Probability hypergraph ranking as detailed in Algorithm3. This method does not learn the weights of thehyperedges, but instead, computes them directly fromthe similarity matrix. Parameter λ is selected by five-fold cross validation, while the neighborhood size alsovaries from five to 20 in steps of five, with the best resultreported.
4) K-nearest neighbor-based ranking. In pattern recogni-tion, the K-nearest neighbors algorithm (k-NN) is aninstance-based method for classification and regression.It can also be employed to solve the ranking problem,that is, ranking an object using the average Euclideandistance to its K-nearest neighbors in the training set.Parameter K is set to ten experimentally.
5) Pairwise graph-based ranking as detailed in Algorithm 3.A simple graph is constructed according to the similaritymatrix of the object, and then the graph Laplacian iscomputed based on the affinity and vertex degree matrix.Finally, the ranking score is optimized according toEquation (12).
6) Support Vector Machine(SVM) ranking [12]. The basicidea of the ranking SVM is to formalize learning torank as a binary classification problem on instance pairs,
(A) event: “Indietracks Festival 2012”, taken on 6-8 July 2012, Butterley Hill, United Kingdom.
(B) event: “Pukkelpop 2013”, taken on 15-17 Aug 2013, Kempische Steenweg Hasselt
Fig. 2: Some samples and illustrative candidates for twoevents.
and then solving the problem using SVMs. The originalmultiple features are exploited to train the SVM rankingmodel. Since it is hard to label the relevance of allimages in our dataset, for simplicity we set the relevancescore of images with an event machine tag to one, andthose without machine tags to zero.
Two measures are employed to evaluate the performance ofthe ranking methods discussed above: (1) precision vs. recall(PR) curve; and (2) mean average precision (MAP). In patternrecognition, the PR curve measures the relation between thefraction of retrieved instances that are relevant (Precision), andthe fraction of relevant instances that are retrieved (Recall).The area under the curve is the average precision (AP), whichis one of the most popular criteria for evaluating classificationand information retrieval tasks.
C. Experimental Results
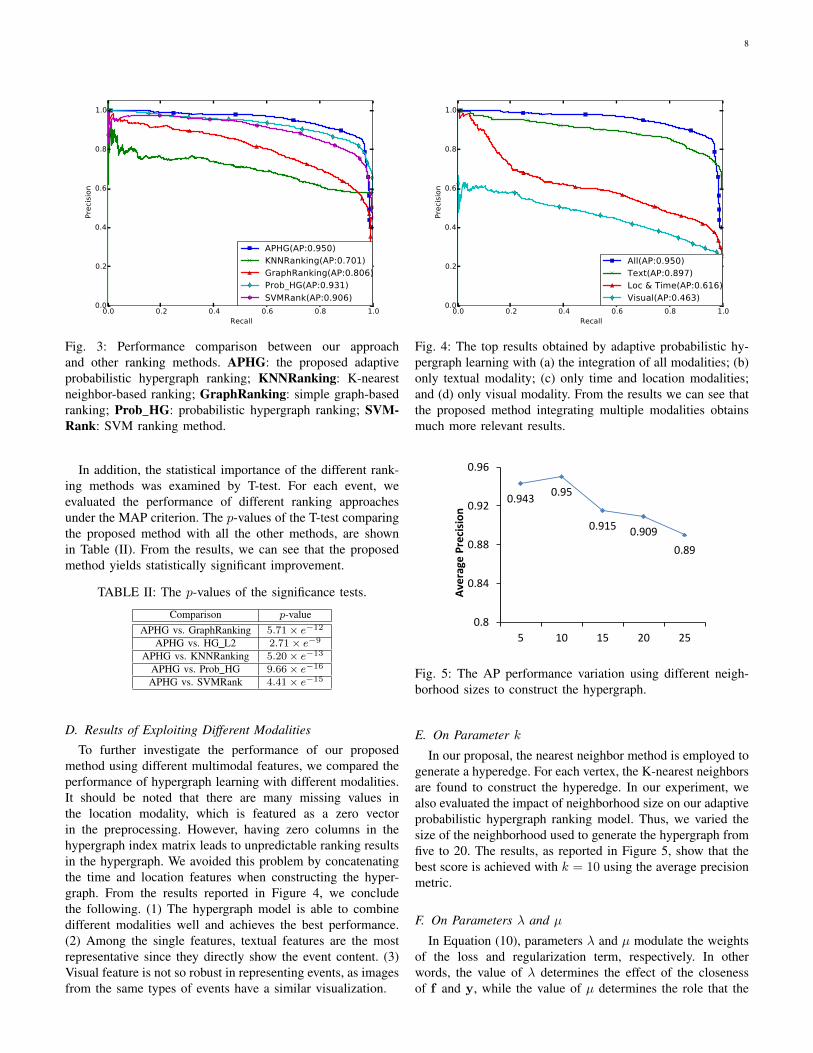
1) Comparative Results: First, we evaluated the effective-ness of our adaptive probabilistic hypergraph method com-pared with other state-of-the-art methods. For each event, webuilt a ranking model with the collected image documents.In this experiment, we randomly selected the top Ns imagesamples according to the pseudo-sample selection methodas the initial relevance for each event, and used all thesamples with machine tags for testing purposes. For all themethods evaluated in this paper, we independently repeated theexperiments ten times with randomly selected training samplesand report the average results in Figure 3. Our method, whichnot only takes advantage of probabilistic hypergraph ranking,but also optimizes the hyperedge weight by L2 regularization,achieves the best performance of the four methods (AP: 0.950).From the results, we see that both learning the weights ofthe hyperedges and representing the incidence matrix in aprobabilistic way further exploit the relation among the mediadocuments and achieve better performance. This demonstratesthe effectiveness and feasibility of our approach.
8
0.0 0.2 0.4 0.6 0.8 1.0Recall
0.0
0.2
0.4
0.6
0.8
1.0
Precision
APHG(AP:0.950)KNNRanking(AP:0.701)GraphRanking(AP:0.806)Prob_HG(AP:0.931)
SVMRank(AP:0.906)
Fig. 3: Performance comparison between our approachand other ranking methods. APHG: the proposed adaptiveprobabilistic hypergraph ranking; KNNRanking: K-nearestneighbor-based ranking; GraphRanking: simple graph-basedranking; Prob HG: probabilistic hypergraph ranking; SVM-Rank: SVM ranking method.
In addition, the statistical importance of the different rank-ing methods was examined by T-test. For each event, weevaluated the performance of different ranking approachesunder the MAP criterion. The p-values of the T-test comparingthe proposed method with all the other methods, are shownin Table (II). From the results, we can see that the proposedmethod yields statistically significant improvement.
TABLE II: The p-values of the significance tests.
Comparison p-valueAPHG vs. GraphRanking 5.71× e−12
APHG vs. HG L2 2.71× e−9
APHG vs. KNNRanking 5.20× e−13
APHG vs. Prob HG 9.66× e−16
APHG vs. SVMRank 4.41× e−15
D. Results of Exploiting Different Modalities
To further investigate the performance of our proposedmethod using different multimodal features, we compared theperformance of hypergraph learning with different modalities.It should be noted that there are many missing values inthe location modality, which is featured as a zero vectorin the preprocessing. However, having zero columns in thehypergraph index matrix leads to unpredictable ranking resultsin the hypergraph. We avoided this problem by concatenatingthe time and location features when constructing the hyper-graph. From the results reported in Figure 4, we concludethe following. (1) The hypergraph model is able to combinedifferent modalities well and achieves the best performance.(2) Among the single features, textual features are the mostrepresentative since they directly show the event content. (3)Visual feature is not so robust in representing events, as imagesfrom the same types of events have a similar visualization.
0.0 0.2 0.4 0.6 0.8 1.0Recall
0.0
0.2
0.4
0.6
0.8
1.0
Pre
cisi
on
All(AP:0.950)Text(AP:0.897)Loc & Time(AP:0.616)Visual(AP:0.463)
Fig. 4: The top results obtained by adaptive probabilistic hy-pergraph learning with (a) the integration of all modalities; (b)only textual modality; (c) only time and location modalities;and (d) only visual modality. From the results we can see thatthe proposed method integrating multiple modalities obtainsmuch more relevant results.
0.943 0.95
0.915 0.909
0.89
0.8
0.84
0.88
0.92
0.96
5 10 15 20 25
Ave
rage
Pre
cisi
on
Fig. 5: The AP performance variation using different neigh-borhood sizes to construct the hypergraph.
E. On Parameter k
In our proposal, the nearest neighbor method is employed togenerate a hyperedge. For each vertex, the K-nearest neighborsare found to construct the hyperedge. In our experiment, wealso evaluated the impact of neighborhood size on our adaptiveprobabilistic hypergraph ranking model. Thus, we varied thesize of the neighborhood used to generate the hypergraph fromfive to 20. The results, as reported in Figure 5, show that thebest score is achieved with k = 10 using the average precisionmetric.
F. On Parameters λ and µ
In Equation (10), parameters λ and µ modulate the weightsof the loss and regularization term, respectively. In otherwords, the value of λ determines the effect of the closenessof f and y, while the value of µ determines the role that the
9
0.9
45
0.9
47
0.9
48
0.9
50
0.9
50
0.9
46
0.9
48
0.9
49
0.9
50
0.9
50
0.9
0.92
0.94
0.96
200 400 600 800 1000
TextBoVW
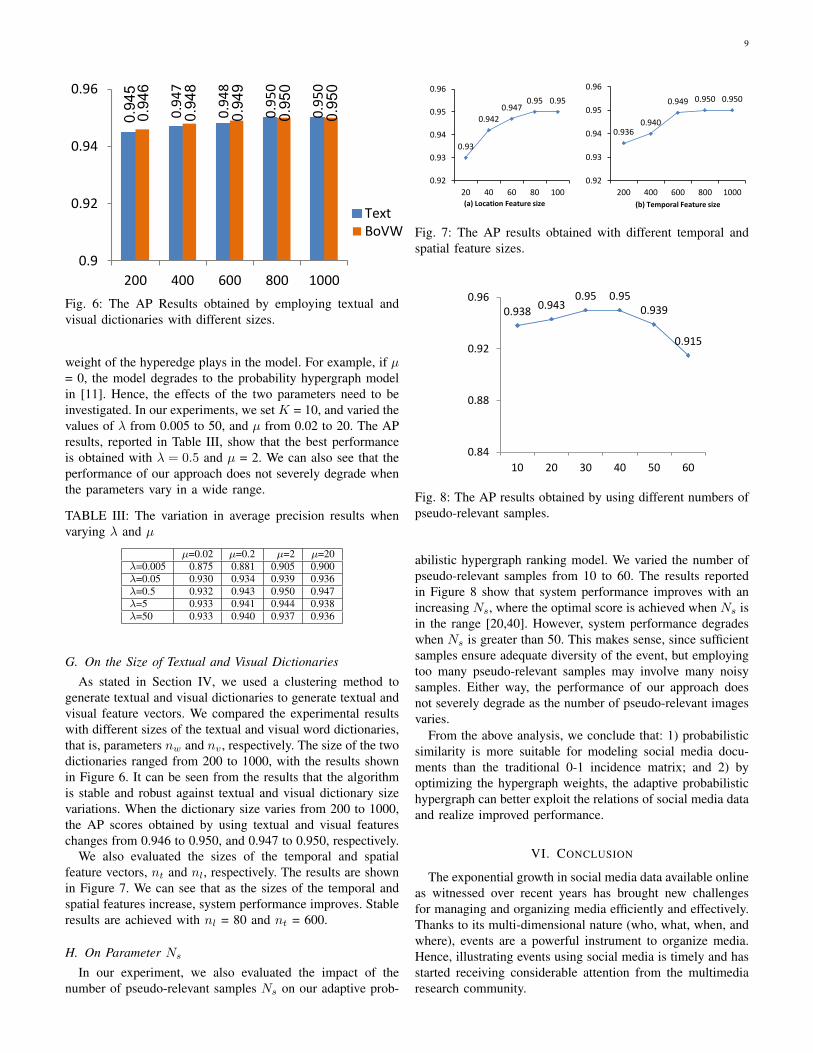
Fig. 6: The AP Results obtained by employing textual andvisual dictionaries with different sizes.
weight of the hyperedge plays in the model. For example, if µ= 0, the model degrades to the probability hypergraph modelin [11]. Hence, the effects of the two parameters need to beinvestigated. In our experiments, we set K = 10, and varied thevalues of λ from 0.005 to 50, and µ from 0.02 to 20. The APresults, reported in Table III, show that the best performanceis obtained with λ = 0.5 and µ = 2. We can also see that theperformance of our approach does not severely degrade whenthe parameters vary in a wide range.
TABLE III: The variation in average precision results whenvarying λ and µ
µ=0.02 µ=0.2 µ=2 µ=20λ=0.005 0.875 0.881 0.905 0.900λ=0.05 0.930 0.934 0.939 0.936λ=0.5 0.932 0.943 0.950 0.947λ=5 0.933 0.941 0.944 0.938λ=50 0.933 0.940 0.937 0.936
G. On the Size of Textual and Visual Dictionaries
As stated in Section IV, we used a clustering method togenerate textual and visual dictionaries to generate textual andvisual feature vectors. We compared the experimental resultswith different sizes of the textual and visual word dictionaries,that is, parameters nw and nv , respectively. The size of the twodictionaries ranged from 200 to 1000, with the results shownin Figure 6. It can be seen from the results that the algorithmis stable and robust against textual and visual dictionary sizevariations. When the dictionary size varies from 200 to 1000,the AP scores obtained by using textual and visual featureschanges from 0.946 to 0.950, and 0.947 to 0.950, respectively.
We also evaluated the sizes of the temporal and spatialfeature vectors, nt and nl, respectively. The results are shownin Figure 7. We can see that as the sizes of the temporal andspatial features increase, system performance improves. Stableresults are achieved with nl = 80 and nt = 600.
H. On Parameter Ns
In our experiment, we also evaluated the impact of thenumber of pseudo-relevant samples Ns on our adaptive prob-
0.93
0.942
0.947 0.95 0.95
0.92
0.93
0.94
0.95
0.96
20 40 60 80 100(a) Location Feature size
0.936 0.940
0.949 0.950 0.950
0.92
0.93
0.94
0.95
0.96
200 400 600 800 1000
(b) Temporal Feature size
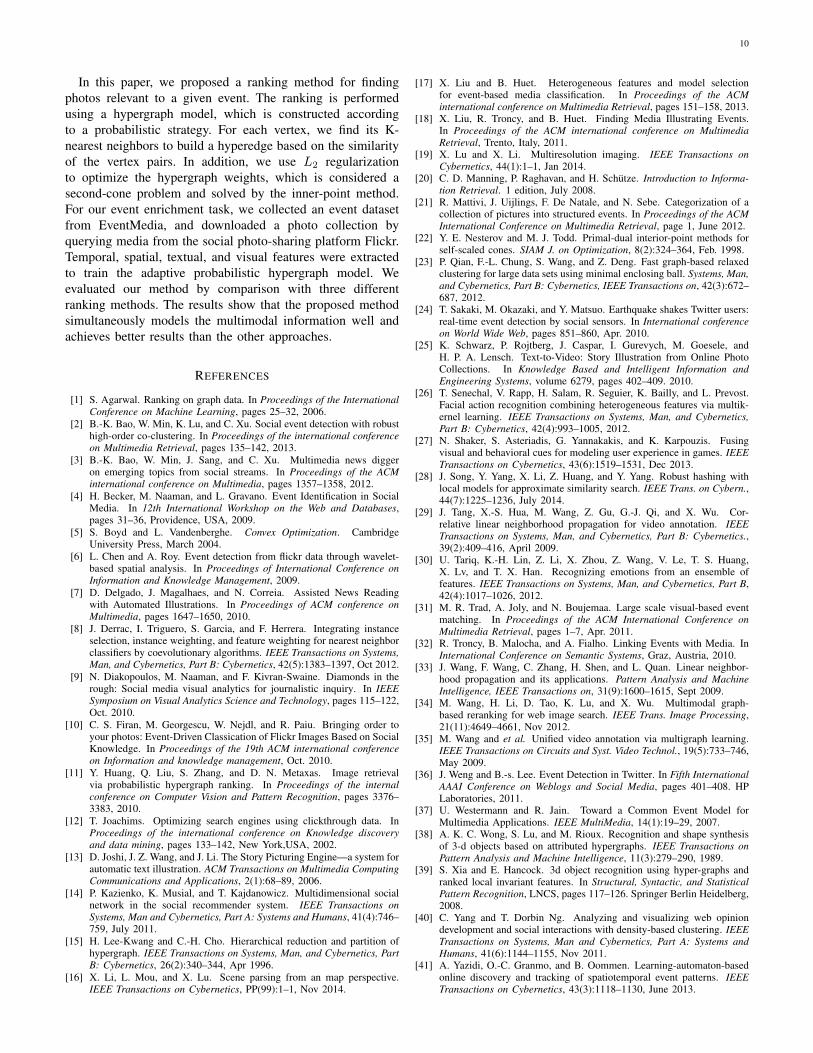
Fig. 7: The AP results obtained with different temporal andspatial feature sizes.
0.938 0.943
0.95 0.95 0.939
0.915
0.84
0.88
0.92
0.96
10 20 30 40 50 60
Fig. 8: The AP results obtained by using different numbers ofpseudo-relevant samples.
abilistic hypergraph ranking model. We varied the number ofpseudo-relevant samples from 10 to 60. The results reportedin Figure 8 show that system performance improves with anincreasing Ns, where the optimal score is achieved when Ns isin the range [20,40]. However, system performance degradeswhen Ns is greater than 50. This makes sense, since sufficientsamples ensure adequate diversity of the event, but employingtoo many pseudo-relevant samples may involve many noisysamples. Either way, the performance of our approach doesnot severely degrade as the number of pseudo-relevant imagesvaries.
From the above analysis, we conclude that: 1) probabilisticsimilarity is more suitable for modeling social media docu-ments than the traditional 0-1 incidence matrix; and 2) byoptimizing the hypergraph weights, the adaptive probabilistichypergraph can better exploit the relations of social media dataand realize improved performance.
VI. CONCLUSION
The exponential growth in social media data available onlineas witnessed over recent years has brought new challengesfor managing and organizing media efficiently and effectively.Thanks to its multi-dimensional nature (who, what, when, andwhere), events are a powerful instrument to organize media.Hence, illustrating events using social media is timely and hasstarted receiving considerable attention from the multimediaresearch community.
10
In this paper, we proposed a ranking method for findingphotos relevant to a given event. The ranking is performedusing a hypergraph model, which is constructed accordingto a probabilistic strategy. For each vertex, we find its K-nearest neighbors to build a hyperedge based on the similarityof the vertex pairs. In addition, we use L2 regularizationto optimize the hypergraph weights, which is considered asecond-cone problem and solved by the inner-point method.For our event enrichment task, we collected an event datasetfrom EventMedia, and downloaded a photo collection byquerying media from the social photo-sharing platform Flickr.Temporal, spatial, textual, and visual features were extractedto train the adaptive probabilistic hypergraph model. Weevaluated our method by comparison with three differentranking methods. The results show that the proposed methodsimultaneously models the multimodal information well andachieves better results than the other approaches.
REFERENCES
[1] S. Agarwal. Ranking on graph data. In Proceedings of the InternationalConference on Machine Learning, pages 25–32, 2006.
[2] B.-K. Bao, W. Min, K. Lu, and C. Xu. Social event detection with robusthigh-order co-clustering. In Proceedings of the international conferenceon Multimedia Retrieval, pages 135–142, 2013.
[3] B.-K. Bao, W. Min, J. Sang, and C. Xu. Multimedia news diggeron emerging topics from social streams. In Proceedings of the ACMinternational conference on Multimedia, pages 1357–1358, 2012.
[4] H. Becker, M. Naaman, and L. Gravano. Event Identification in SocialMedia. In 12th International Workshop on the Web and Databases,pages 31–36, Providence, USA, 2009.
[5] S. Boyd and L. Vandenberghe. Convex Optimization. CambridgeUniversity Press, March 2004.
[6] L. Chen and A. Roy. Event detection from flickr data through wavelet-based spatial analysis. In Proceedings of International Conference onInformation and Knowledge Management, 2009.
[7] D. Delgado, J. Magalhaes, and N. Correia. Assisted News Readingwith Automated Illustrations. In Proceedings of ACM conference onMultimedia, pages 1647–1650, 2010.
[8] J. Derrac, I. Triguero, S. Garcia, and F. Herrera. Integrating instanceselection, instance weighting, and feature weighting for nearest neighborclassifiers by coevolutionary algorithms. IEEE Transactions on Systems,Man, and Cybernetics, Part B: Cybernetics, 42(5):1383–1397, Oct 2012.
[9] N. Diakopoulos, M. Naaman, and F. Kivran-Swaine. Diamonds in therough: Social media visual analytics for journalistic inquiry. In IEEESymposium on Visual Analytics Science and Technology, pages 115–122,Oct. 2010.
[10] C. S. Firan, M. Georgescu, W. Nejdl, and R. Paiu. Bringing order toyour photos: Event-Driven Classication of Flickr Images Based on SocialKnowledge. In Proceedings of the 19th ACM international conferenceon Information and knowledge management, Oct. 2010.
[11] Y. Huang, Q. Liu, S. Zhang, and D. N. Metaxas. Image retrievalvia probabilistic hypergraph ranking. In Proceedings of the internalconference on Computer Vision and Pattern Recognition, pages 3376–3383, 2010.
[12] T. Joachims. Optimizing search engines using clickthrough data. InProceedings of the international conference on Knowledge discoveryand data mining, pages 133–142, New York,USA, 2002.
[13] D. Joshi, J. Z. Wang, and J. Li. The Story Picturing Engine—a system forautomatic text illustration. ACM Transactions on Multimedia ComputingCommunications and Applications, 2(1):68–89, 2006.
[14] P. Kazienko, K. Musial, and T. Kajdanowicz. Multidimensional socialnetwork in the social recommender system. IEEE Transactions onSystems, Man and Cybernetics, Part A: Systems and Humans, 41(4):746–759, July 2011.
[15] H. Lee-Kwang and C.-H. Cho. Hierarchical reduction and partition ofhypergraph. IEEE Transactions on Systems, Man, and Cybernetics, PartB: Cybernetics, 26(2):340–344, Apr 1996.
[16] X. Li, L. Mou, and X. Lu. Scene parsing from an map perspective.IEEE Transactions on Cybernetics, PP(99):1–1, Nov 2014.
[17] X. Liu and B. Huet. Heterogeneous features and model selectionfor event-based media classification. In Proceedings of the ACMinternational conference on Multimedia Retrieval, pages 151–158, 2013.
[18] X. Liu, R. Troncy, and B. Huet. Finding Media Illustrating Events.In Proceedings of the ACM international conference on MultimediaRetrieval, Trento, Italy, 2011.
[19] X. Lu and X. Li. Multiresolution imaging. IEEE Transactions onCybernetics, 44(1):1–1, Jan 2014.
[20] C. D. Manning, P. Raghavan, and H. Schutze. Introduction to Informa-tion Retrieval. 1 edition, July 2008.
[21] R. Mattivi, J. Uijlings, F. De Natale, and N. Sebe. Categorization of acollection of pictures into structured events. In Proceedings of the ACMInternational Conference on Multimedia Retrieval, page 1, June 2012.
[22] Y. E. Nesterov and M. J. Todd. Primal-dual interior-point methods forself-scaled cones. SIAM J. on Optimization, 8(2):324–364, Feb. 1998.
[23] P. Qian, F.-L. Chung, S. Wang, and Z. Deng. Fast graph-based relaxedclustering for large data sets using minimal enclosing ball. Systems, Man,and Cybernetics, Part B: Cybernetics, IEEE Transactions on, 42(3):672–687, 2012.
[24] T. Sakaki, M. Okazaki, and Y. Matsuo. Earthquake shakes Twitter users:real-time event detection by social sensors. In International conferenceon World Wide Web, pages 851–860, Apr. 2010.
[25] K. Schwarz, P. Rojtberg, J. Caspar, I. Gurevych, M. Goesele, andH. P. A. Lensch. Text-to-Video: Story Illustration from Online PhotoCollections. In Knowledge Based and Intelligent Information andEngineering Systems, volume 6279, pages 402–409. 2010.
[26] T. Senechal, V. Rapp, H. Salam, R. Seguier, K. Bailly, and L. Prevost.Facial action recognition combining heterogeneous features via multik-ernel learning. IEEE Transactions on Systems, Man, and Cybernetics,Part B: Cybernetics, 42(4):993–1005, 2012.
[27] N. Shaker, S. Asteriadis, G. Yannakakis, and K. Karpouzis. Fusingvisual and behavioral cues for modeling user experience in games. IEEETransactions on Cybernetics, 43(6):1519–1531, Dec 2013.
[28] J. Song, Y. Yang, X. Li, Z. Huang, and Y. Yang. Robust hashing withlocal models for approximate similarity search. IEEE Trans. on Cybern.,44(7):1225–1236, July 2014.
[29] J. Tang, X.-S. Hua, M. Wang, Z. Gu, G.-J. Qi, and X. Wu. Cor-relative linear neighborhood propagation for video annotation. IEEETransactions on Systems, Man, and Cybernetics, Part B: Cybernetics.,39(2):409–416, April 2009.
[30] U. Tariq, K.-H. Lin, Z. Li, X. Zhou, Z. Wang, V. Le, T. S. Huang,X. Lv, and T. X. Han. Recognizing emotions from an ensemble offeatures. IEEE Transactions on Systems, Man, and Cybernetics, Part B,42(4):1017–1026, 2012.
[31] M. R. Trad, A. Joly, and N. Boujemaa. Large scale visual-based eventmatching. In Proceedings of the ACM International Conference onMultimedia Retrieval, pages 1–7, Apr. 2011.
[32] R. Troncy, B. Malocha, and A. Fialho. Linking Events with Media. InInternational Conference on Semantic Systems, Graz, Austria, 2010.
[33] J. Wang, F. Wang, C. Zhang, H. Shen, and L. Quan. Linear neighbor-hood propagation and its applications. Pattern Analysis and MachineIntelligence, IEEE Transactions on, 31(9):1600–1615, Sept 2009.
[34] M. Wang, H. Li, D. Tao, K. Lu, and X. Wu. Multimodal graph-based reranking for web image search. IEEE Trans. Image Processing,21(11):4649–4661, Nov 2012.
[35] M. Wang and et al. Unified video annotation via multigraph learning.IEEE Transactions on Circuits and Syst. Video Technol., 19(5):733–746,May 2009.
[36] J. Weng and B.-s. Lee. Event Detection in Twitter. In Fifth InternationalAAAI Conference on Weblogs and Social Media, pages 401–408. HPLaboratories, 2011.
[37] U. Westermann and R. Jain. Toward a Common Event Model forMultimedia Applications. IEEE MultiMedia, 14(1):19–29, 2007.
[38] A. K. C. Wong, S. Lu, and M. Rioux. Recognition and shape synthesisof 3-d objects based on attributed hypergraphs. IEEE Transactions onPattern Analysis and Machine Intelligence, 11(3):279–290, 1989.
[39] S. Xia and E. Hancock. 3d object recognition using hyper-graphs andranked local invariant features. In Structural, Syntactic, and StatisticalPattern Recognition, LNCS, pages 117–126. Springer Berlin Heidelberg,2008.
[40] C. Yang and T. Dorbin Ng. Analyzing and visualizing web opiniondevelopment and social interactions with density-based clustering. IEEETransactions on Systems, Man and Cybernetics, Part A: Systems andHumans, 41(6):1144–1155, Nov 2011.
[41] A. Yazidi, O.-C. Granmo, and B. Oommen. Learning-automaton-basedonline discovery and tracking of spatiotemporal event patterns. IEEETransactions on Cybernetics, 43(3):1118–1130, June 2013.

11
[42] J. Yu, D. Tao, and M. Wang. Adaptive hypergraph learning andits application in image classification. IEEE Transactions on ImageProcessing, 21(7):3262–3272, 2012.
[43] X. Zhu, A. B. Goldberg, M. Eldawy, C. R. Dyer, and B. Strock. AText-to-Picture Synthesis System for Augmenting Communication. InProceedings of the international conference on Artificial intelligence,number 2, pages 1590–1595, 2007.