Embed Size (px)
Citation preview
www.giga-hamburg.de/workingpapers
GIG
A Working Papers serve to dissem
inate the research results of work in progress prior to publicaton to encourage the exchange of ideas and academ
ic debate. Inclusion of a paper in the W
orking Papers series does not constitute publication and should not limit publication in any other venue. C
opyright remains w
ith the authors.
GIGA Research Programme: Violence and Security___________________________
The Effects of Regime Cooptation on the Geographical Distribution of Violence:
Evidence from the Syrian Civil War
Alexander De Juan and André Bank
No 222 May 2013
GIGA Working Papers 222/2013
GIGA Working Papers 222/2013
Edited by the GIGA German Institute of Global and Area Studies Leibniz‐Institut für Globale und Regionale Studien
The GIGA Working Papers series serves to disseminate the research results of work in progress prior to publication in order to encourage the exchange of ideas and academic debate. An objective of the series is to get the findings out quickly, even if the presenta‐tions are less than fully polished. Inclusion of a paper in the GIGA Working Papers series does not constitute publication and should not limit publication in any other venue. Copy‐right remains with the authors. When working papers are eventually accepted by or pub‐lished in a journal or book, the correct citation reference and, if possible, the corresponding link will then be included on the GIGA Working Papers website at
<www.giga‐hamburg.de/workingpapers>.
GIGA Research Programme “Violence and Security” Copyright for this issue: © Alexander De Juan and André Bank
WP Coordination and English‐language Copy Editing: Errol Bailey Editorial Assistance and Production: Silvia Bücke
All GIGA Working Papers are available online and free of charge on the website <www.giga‐hamburg.de/workingpapers>.
For any requests please contact:
E‐mail: <workingpapers@giga‐hamburg.de>
The GIGA German Institute of Global and Area Studies cannot be held responsible for errors or any consequences arising from the use of information contained in this Working Paper; the views and opinions expressed are solely those of the author or authors and do not necessarily reflect those of the Institute.
GIGA German Institute of Global and Area Studies
Leibniz‐Institut für Globale und Regionale Studien
Neuer Jungfernstieg 21
20354 Hamburg
Germany E‐mail: <info@giga‐hamburg.de>
Website: <www.giga‐hamburg.de>
222/2013 GIGA Working Papers
The Effects of Regime Cooptation on the
Geographical Distribution of Violence:
Evidence from the Syrian Civil War
Abstract
Is violent opposition less likely to occur in subnational regions that have been treated preferentially by the respective country’s ruling elite? Many authoritarian regimes try to secure political support by providing critical segments of the population with privileged access to economic or political rents. This study is interested in the effects of this strategy. Our empirical analysis is based on crowdsourcing data on the number and geospatial dis‐tribution of fatalities in the Syrian civil war. We also use satellite images of the earth at night to measure spatial variations in access to electricity across Syrian subdistricts; these data are complemented with information from the last Syrian population census. Estima‐tions of fixed‐effects logit models confirm the hypothesis that the risk of violence has been lower in subdistricts that had been favored by the ruling regime in terms of preferential access to electricity in times of power shortages.
Keywords: Regime cooptation, geographical distribution of violence, Syria, civil war, crowdsourcing data, nightlights
Dr. Alexander De Juan
is a political scientist and research fellow at the GIGA Institute of Middle East Studies. Contact: <alexander.dejuan@giga‐hamburg.de> Website: <http://staff.en.giga‐hamburg.de/dejuan> André Bank, M.A.
is a political scientist and research fellow at the GIGA Institute of Middle East Studies. Contact: <andre.bank@giga‐hamburg.de> Website: <http://staff.en.giga‐hamburg.de/bank>
GIGA Working Papers WP 222/2013
The Effects of Regime Cooptation on the
Geographical Distribution of Violence:
Evidence from the Syrian Civil War
Alexander De Juan and André Bank
Article Outline
1 Introduction
2 The Role of Cooptation in Political Stability
3 Conceptualizing and Measuring Cooptation
4 The Case of Syria
5 Design, Data and Results
6 Conclusions
Bibliography
1 Introduction1
Ruling elites cannot maintain their grip on power through violence and repression alone. Re‐cent events of the Arab Spring in the Middle East demonstrate that even the strongest security apparatuses cannot ensure political stability if elites do not have a minimum degree of legit‐imacy among the population. In this sense, the selective provision of public goods2 has been
1 We thank Fritz Rickert for his very good research assistance. We are also grateful to Ariel Ahram, Viola Lucas,
Jan Pierskalla and Stephan Rosiny for their helpful comments on previous versions of this paper. A previous ver‐sion of this paper has been presented at the International Studies Association (ISA) Annual Convention 2013.
2 In line with Bueno de Mesquita et al. (Bueno de Mesquita, Smith, and Morrow 2003) we define “public goods” as goods available to all members of a society, whereas “private goods” are available to selected members only.
Alexander De Juan and André Bank: Cooptation and the Geographical Distribution of Violence 5
WP 222/2013 GIGA Working Papers
emphasized as an essential instrument for generating societal support or at least acquies‐cence. This sees ruling elites provide political or material rents to critical segments of the population in order to either buy‐off opposition or reward loyal supporters.3 If done effec‐tively, such redistribution encourages compliance and reduces the risk of violent resistance. This paper aims to investigate this claim empirically.
A number of studies have found general evidence of the effectiveness of cooptation in this regard (e.g. Bethke and Bussmann 2011; Fjelde and Soysa 2009; Taydas and Peksen 2012). We argue, however, that these studies share an essential shortcoming: their aggregated char‐acter prevents them from adequately capturing what they claim to investigate. More specifi‐cally, their cross‐country focus does not allow for the consideration of a crucial element of cooptation: the very selective and targeted nature of the redistribution of resources. More often than not, the provision of material goods is not used as an instrument to instill support among the masses per se, but rather to win or sustain the backing of specific segments of the population that are deemed particularly relevant for upholding political stability.
We seek to contribute to this debate by investigating the role of material redistribution in the subnational variations in political violence in Syria, scene of the most intense civil war in the context of the Arab Spring. Rather than investigating overall levels of spending or of the provision of public goods, we analyze the effects of actual preferential treatment of specific subnational regions. In other words, we want to ascertain whether Syrian subdistricts are less at risk of experiencing violence in the current civil war if they have been favored by the state in the distribution of scarce material resources in the recent past.
Authoritarian regimes in the Middle East and elsewhere have been particularly reluctant to provide meaningful socioeconomic information. Therefore, we mainly built our analysis on data that is out of the reach of the state. First, we made use of so‐called crowdsourcing data on the number of fatalities in the Syrian civil war; these data stem from decentralized reports filed by Syrians through a publicly accessible online platform. Second, we used digitized high‐resolution satellite images of the earth at night to measure spatial variations in the ac‐cess to electricity across Syrian subdistricts. We complemented these data with information from the last Syrian population census undertaken in 2004 to build a new dataset of Syria’s 274 subdistricts. We performed cross‐sectional logit estimations, including fixed effects on the level of the country’s 14 governorates. Our findings confirm the hypothesis that the risk of violence has been lower in subdistricts that had previously been favored by the ruling re‐gime in terms of access to electricity in times of severe power shortages.
Our results contribute to ongoing discussions in various ways: To the best of our knowledge, we are the first to undertake a systematic study on the role of redistribution in
3 We use “cooptation” as a general term referring to the preferential treatment of groups or regions by the rul‐
ing elite, with the aim of garnering or upholding political support. The term is usually associated with prefer‐ential treatment of potential opposition only. However, for the sake of simplicity, we also subsume preferen‐tial treatment of the elites’ support base under the term.
6 Alexander De Juan and André Bank: Cooptation and the Geographical Distribution of Violence
GIGA Working Papers WP 222/2013
political violence on the subnational level. Focusing on the allocation of material resources in times of scarcity, we propose an innovative approach for the conceptualization of cooptation. Complementing comparable cross‐country studies, we lend robust support to the hypothesis that cooptation can be an effective tool for encouraging compliance and reducing the risk of violent opposition.
Our paper proceeds as follows: In the second and third sections, we sketch previous the‐oretical and empirical studies on the role of cooptation in political violence. Based on this re‐view, we define our research interest, develop our main theoretical argument and present the conceptualization of our variables. The fourth section introduces the case of Syria, de‐scribing the background of the ongoing civil war, the corner stones of the regime’s strategy of cooptation and essential characteristics of the country’s energy sector. The fifth section de‐scribes the design, data and results of our empirical analyses. The final section summarizes our main arguments and findings.
2 The Role of Cooptation in Political Stability
Ruling elites need to secure support from among the population in order to reduce the risk of violent opposition. Certainly, repression plays a major, and possibly more important, role in securing compliance for many regimes. However, no government is likely to survive in the long run without a minimum degree of popular legitimacy. As Levi (2006: 7) argues, “quasi‐voluntary compliance” – that is, people’s willingness to cooperate – is essential for political stability. This kind of compliance can only be generated if the population receives something in return (Levi 2006). Most research on the role of such regime cooptation has emphasized the importance of political rents. However, ruling elites may also try to win and uphold sup‐port by providing material incentives, such as sharing economic benefits or implementing specific tax rates (Acemoglu, Verdier, and Robinson 2004; Gandhi and Przeworski 2007). Thus it has been argued that a state’s ability to provide such goods reduces the risk that it will experience violent conflict. Notably, Bueno de Mesquita et al. (2003) argue that public spending can be used to “buy” allegiance and thus reduce the risk that the people will sup‐port challengers to the ruling elite.
Various empirical studies have investigated the role of the provision of public goods in political violence. The findings, however, are mixed. For instance, Taydas and Peksen (2012) find a significant negative connection between welfare spending and civil conflict onset, whereas Fjelde (2009) presents evidence revealing that regime cooptation in oil‐rich states reduces the risk of violent opposition often associated with resource‐rich economies (see also Fjelde 2010; Fjelde and de Soysa 2009). Performing analyses along the same line, Bussmann (2009) and Bethke and Bussmann (2011) do not find any significant association of state ex‐penditure on health and education with the onset of violent conflict.
Alexander De Juan and André Bank: Cooptation and the Geographical Distribution of Violence 7
WP 222/2013 GIGA Working Papers
Although we acknowledge that these studies have greatly contributed to our under‐standing of the role of public spending and the provision of public goods, we argue that they neglect a defining feature of cooptation: the very selective and targeted nature of goods pro‐vision. In principle, leaders may try to provide benefits to the population at large. However, the higher the number of beneficiaries, the lower the absolute value of rents for each benefi‐ciary, including the members of the ruling regime themselves. Distributing rents to more people reduces the value of the rent per person (North, Wallis, and Weingast 2006). For that reason, instead of distributing resources evenly and broadly, regimes tend to selectively dis‐tribute them to a limited number of people, therefore basing their power on support among specific segments of the population (e.g. Acemoglu, Verdier, and Robinson 2004; Azam 2001; Wintrobe 2000).
There is a lively debate in the field of political economy about the determinants of such allocations. Here, rulers can focus on rewarding the backbone of their support (Burgess et al. 2010; Kramon and Posner 2012; Weinstein 2011) or they invest their resources to win support from regions and segments of the population that either are not strongly affiliated to one specific political party (swing voters) or are strategically important (e.g. Arulampalam et al. 2009; Sheng 2009). Whereas these studies differ in what they assume to be rulers’ central strategies of redistribution, they all share a common argument: the subnational redistribu‐tion of economic and political rents by incumbent governments is carried out with the strate‐gic aim of maximizing political support from crucial segments of the population. This redis‐tribution strategy is mirrored in variations of goods provision across subnational regions and administrative units.
Our analysis connects these insights from the studies on the nexus of regime cooptation and political violence with political economy research on the determinants of allocations of political and economic rents. Mirroring the inconclusive results of the latter, we assume that if a district is favored, it may be a consequence of various determinants – namely, because they are dominated by the ruling elite’s ethnic or religious groups, because they have a history of resistance against the regime or because of specific population constellations that consti‐tute a potential risk (see Schady 2000). Thus, the common characteristic that defines what makes specific groups and/or regions beneficiaries of private goods is that they are perceived by the ruling regime as being specifically important for its hold on power. Therefore, rather than analyzing the determinants of strategic redistribution treatment, we focus on its effects. Specifically, we attempt to establish whether the preferential treatment of specific subnational regions by ruling elites reduces the risk that these regions experience political violence.
Our main hypothesis can be summarized as follows: The better off a subnational region has been in terms of the public redistribution of material goods, the lower the likelihood that the region has experienced violence in intrastate conflicts. In keeping with the arguments on the effects of cooptation outlined above, we assume that people will be less likely to engage in protest and violence against the ruling regime in regions that have profited from its policy
8 Alexander De Juan and André Bank: Cooptation and the Geographical Distribution of Violence
GIGA Working Papers WP 222/2013
in absolute and relative terms. People have an interest in upholding the status quo in order to retain their privileged position and may fear reprisals due to their proregime stance in the event the regime is toppled. The lower the support base of the opposition within a subna‐tional region, the lower the risk that the region will be the locus of sustained antistate action (e.g. Wickham‐Crowley 1987) and the lower the risk that it will be targeted by the regime’s repressive measures.4
3 Conceptualizing and Measuring Cooptation
A variety of measures have been used to capture subnational variations in the redistribution of material goods – welfare spending and allocations are two prominent proxies (Bethke and Bussmann 2011; Taydas and Peksen 2012; Weinstein 2011). Such indicators, however, do not capture whether spending results in any actual benefit to the targeted population. Corrup‐tion and inefficiency may prevent actual delivery and thus undermine cooptation attempts. Another type of indicator that has been used is state‐sponsored infrastructure, such as roads and schools (e.g. Burgess et al. 2010; Vaishnav and Sircar 2009). However, the effective provi‐sion of services entails two tasks: providing access to services (i.e., through infrastructure) and sustaining the delivery of these services. Defunct services may actually generate griev‐ances rather than instill support. Violent demonstrations against power cuts in Pakistan and Iraq (Arraf 2010; Lahore and Islamabad 2012) demonstrate how important it is to consider the latter dimension.
Other studies have investigated redistribution based on indicators such as enrollment, literacy or child mortality rates. Provision of education or health care is, however, often shaped by the interventions of international actors such as NGOs or development coopera‐tion agencies (Kramon and Posner 2010). Moreover, such outcome indicators are likely influ‐enced by a variety of factors not directly related to the state and its policies. Consequently, it is hard to trace variations on such indicators back to specific policies of the state.
We use geographical variations in electricity flows in times of national power shortages to construct our indicators for cooptation. We believe that this conceptualization offers several potential advantages in comparison to other indicators presented above. First, using infor‐mation on flows of power allows us to capture actual output of service provision. Second, contrary to other goods, electricity is in most cases more directly related to government ac‐tion given that the ruling elites in many developing countries monopolize – or are at least
4 We assume that these associations will be particularly relevant in shaping geographical patterns of violence in
early phases of intrastate conflict: the longer the conflict endures, the more military strategy will shape the spatial distribution of violence. Moreover, as the probability of an actual regime change increases, incentive structures of coopted regions will likely change. For swing regions in particular, it may become more promis‐ing to side with the opposition in order to improve their postwar prospects. To account for such dynamics, we concentrate our analyses on the early phase of the Syrian uprising and the ensuing civil war.
Alexander De Juan and André Bank: Cooptation and the Geographical Distribution of Violence 9
WP 222/2013 GIGA Working Papers
heavily involved in – the electricity sector. Third, we believe that focusing on variations in the provision of this scarce good will allow us to capture selective redistribution more per‐suasively. As argued above, in times of resource abundance, ruling elites may be inclined to carry out a mass cooptation strategy. However, the scarcer the resources to be distributed, the more important it will be to make decisions on who receives what. Thus, the allocation of goods in times of limited availability (e.g., the provision of electricity in times of national electricity shortfalls) should provide a clearer picture of the priorities of the ruling elite in terms of preferential treatment.
We argue that this conceptualization will allow us to capture subnational variations in regime cooptation. As has rightly been argued, it may be problematic to focus on one public good alone as patterns of redistribution may differ across various goods (Kramon and Pos‐ner 2010). However, in the case of Syria, we posit that our indicator (i.e., the provision of electricity) not only captures one essential public good, but also offers an effective proxy for other forms of cooptation that are distributed according to the same logic. (We provide some anecdotal evidence for this claim when discussing the operationalization of our independent variable in the fifth section.) Thus, we investigate geospatial associations between variations in electricity flows in a time of power scarcity (2007–2009) and the likelihood of the occur‐rence of violence during the Syrian civil war after 2011.
4 The Case of Syria
Before we describe the data and our empirical strategy, it is important that we introduce the case of Syria. First, we provide a short overview of the events that led to the civil war and shaped its course. Second, we illustrate the system of cooptation of the Baʹathist regime. Third, we briefly sketch some essential features of the Syrian electricity sector.
4.1 Syria in the Arab Spring: From Uprising to Civil War
The initial protests in Syria were triggered in the southern city of Daraʹa in mid‐March 2011, when a group of teenagers were arrested and allegedly tortured for writing the motto of the Arab Spring (“al‐shaʹb yurid isqat al‐nizam” – “the people want the downfall of the regime”) on house walls. The teenagers’ families and tribal leaders demanded their release, but the lo‐cal security forces denied this request. As a reaction, the families took their protest to the streets. In response, security forces shot at the demonstrators, costing numerous people their lives; this, in turn, caused further protests that resulted in the destruction of public facilities and private property. The regime attempted to quash the growing protests with massive re‐pression but only succeeded in spreading the protests to the surrounding villages and cities in the southern governorate (Arabic: muhafaza, pl. muhafazat) of Hawran (International Crisis Group 2011a; International Crisis Group 2011b, 12–13).
10 Alexander De Juan and André Bank: Cooptation and the Geographical Distribution of Violence
GIGA Working Papers WP 222/2013
Since March 2011, the protests have gradually spread to almost all governorates in Syria. Initially and up until the foundation of the Free Syrian Army (FSA) in July 2011, the regime’s repression was the central driving mechanism behind the protests’ geographical and social spread. As the months went by, however, a clear militarization of the civil and peaceful an‐tiregime protests could be observed (International Crisis Group 2012b; International Crisis Group 2012a). As a result, the narrative of an exclusively nonviolent protest, which had been propagated until the end of 2011, became obsolete. By early 2012, the violent political stand‐off that had already begun to develop in the summer of 2011 had escalated into a massive civil war. Regime forces continued their assaults on the rebels’ positions with the primary aim of consolidating their strongholds in the center of Damascus and in the Alawi‐dominated Northwest. They did, however, recapture the coastal city of Latakia early on and reconquer some districts in Homs and Idlib. The rebels, on the other hand, dominate the Syr‐ian territories along the Turkish border, the areas around the central Syrian cities of Hama and Homs, the agglomeration of Damascus (especially its southern suburbs), the area around the southern city of Dara’a and the northeastern city of Raqqa. The armed opposition has been, however, unable to overthrow the regime by military means. The uprising’s increasing militarization – accompanied by its “confessionalization” along Sunni‐versus‐Alawi lines – has been countered by the regime’s sustained use of repressive measures, which have, since the summer of 2012, included the bombardment of residential neighborhoods in “liberated” (i.e., opposition‐held) areas. During the period of March 2011 to early 2013, Syria’s unrest transformed from a semiurban, primarily peaceful civil uprising to a professionalized, vio‐lent opposition that has led to a fragile, but highly violent stalemate.
4.2 Cooptation in Baʹathist Syria
In order to illustrate the role of selective distribution of economic and political rents in politi‐cal control in Syria, we provide a short overview on how the regime has made used of this instrument in the past. The Baʹathist “revolution from above” (Hinnebusch 2001) in the 1960s signified a drastic shift in urban‐rural relations and in particular the “rise” of the rural pe‐riphery. The transformation of the Syrian countryside was, however, an uneven process. For instance, the Baʹathist regime invested heavily in job creation, electricity, schooling and health services in those regions where it had a strong foothold – often via primordial ties – and which it considered crucial for political stability, while leaving the Kurdish‐dominated northeast region and the Bedouin‐dominated, east‐central desert region in a state of under‐development. One notable example of a region that profited strongly from these measures is the governorate of Latakia, from which approximately 75 percent of the Alawi hail (Van Dam 2011: 9). Similarly, the southern region of Hawran (including the provincial town of Daraʹa), the northwestern rural regions around Aleppo and the northeastern area of Deir az‐Zour
Alexander De Juan and André Bank: Cooptation and the Geographical Distribution of Violence 11
WP 222/2013 GIGA Working Papers
have all profited from the Baʹathist regime’s cooptation strategy to shore up its support bases in different rural parts of the country (Perthes 1997: 183; for detailed figures Van Dam 2011).
Together with repression and legitimation, cooptation was a core technique of political control in Syria under Hafiz al‐Asad, who – after coming to power in November 1970 – con‐tinued to reward those regions that constituted the traditional backbone of the regime (Perthes 1997: 181–185). Representing the more pragmatic and Syria‐oriented wing of the Baʹath Party, President al‐Asad developed good ties with the Sunni bourgeoisie in Damascus right from the beginning of his rule, which consisted of leaving the Damascene business community’s privileges largely untouched and even granting new ones via the so‐called in‐fitah (the 1970s policy of economic liberalization). This, however, alienated the more radical elements of the Baʹath Party from the regime. Nevertheless, the cooptation strategy worked, as the conservative Damascene bourgeoisie remained largely silent – and thus loyal – in the context of the Sunni‐Islamist antiregime uprising from 1979 to 1982. At the same time, how‐ever, a number of religious‐conservatives representing the souk (traditional market) in the northern city of Aleppo supported and, in some cases, even joined the rebellion; this can ar‐guably be attributed, in part, to the fact that they had not been coopted in the same way as their Damascene peers.
In July 2000, Bashar al‐Asad succeeded his father to the Syrian presidency as well as to the leadership of the armed forces and the Baʹath party. Not only did he have to position himself in the inherited authoritarian system (Bank 2004; Hinnebusch 2011; Perthes 2004), Bashar al‐Asad also had to tackle a number of new socioeconomic and demographic chal‐lenges. Throughout the first decade of the twenty‐first century, the Baʹathist regime under Bashar al‐Asad pursued wide‐ranging neoliberal economic reforms, including the privatiza‐tion of state companies, a job halt in the state administration and the cutting of subsidies. These measures produced harshly negative effects for large parts of the population (Abboud 2013; Haddad 2012; Hinnebusch 2012). However, the Baʹathist economic policies during this period did not only produce losers (Hinnebusch 2012, 99); savvy crony capitalists were pre‐sented with business opportunities by virtue of their connections to Bashar al‐Asad and his entourage. These economic oligarchs extracted considerable wealth from their virtual mo‐nopolies on newly opened business opportunities (Lyme 2012). The emergence of this newly coopted business elite in Syria in the early 2000s (Haddad 2012; Hinnebusch 2012) has coin‐cided with a spatial shift between different geographical entities: the overall gap between the richest and poorest parts of the country widened drastically. Under Bashar al‐Asad, it was the inner cities of Damascus and Aleppo that really prospered.
Whereas liberalization clearly changed the face of cooptation, some relevant patterns re‐mained intact. Many of those who benefitted from direct state support under Hafiz al‐Asad have also profited from the selective liberalization under the rule of his son. Thus in many areas, traditional relations of cooptation have been renewed by different means (e.g. Donati 2013: 38, 39). Moreover, in the years prior to the Arab Spring, the regime increasingly felt the
12 Alexander De Juan and André Bank: Cooptation and the Geographical Distribution of Violence
GIGA Working Papers WP 222/2013
need to give clear signs that it was engaged in mitigating the negative consequences of liber‐alization for the broader population. For that reason, President Bashar al‐Asad drew on the cooptation strategy of his predecessor by investing in development initiatives in rural re‐gions in order to garner support. As the regime lacked the necessary resources for broad co‐optation, it concentrated its efforts on regions deemed particularly relevant (ICG 2011: 6).5 Since 2011, such initiatives have been stepped up due to rising tensions and have seen the regime establish a social security fund for cash handouts, reduce taxes on basic goods and increase subsidies on heating fuel (Donati 2013).
Overall, the changes that have occurred since Bashar al‐Asad became president underline the end of mass‐oriented cooptation strategies by the Baʹathist regime but the continued im‐portance of targeted cooptation as a technique for political control. The beneficiaries com‐prise members of a new urban elite, traditional supporters of the regime and selected rural populations deemed crucial to political stability.6 As argued above, we are not concerned with investigating why specific regions have profited from preferential treatment by the re‐gime; rather, by using information on the variation in the access to electricity, we are at‐tempting to identify these regions and study how their special‐status role influenced their risk of experiencing violence in the early phase of the Syrian civil war.
4.3 Electricity Provision in Syria
The electricity sector in Syria is firmly in the hands of the state. Although announcements have been made regarding stepwise restructuring and privatization, the regime’s Ministry of Electricity and its subordinate agencies are currently the only relevant actors in the sector (World Bank 2009). The energy sector is not only controlled by the state, it has also tradition‐ally played a pivotal role in the regime’s policy of cooptation. When the Baʹath party seized power in the early 1960s, it launched a massive campaign of service provision in order to drum up broad public support (Goulden 2011). As a consequence, the rate of electrification increased from 2 percent in 1963 to today’s impressive 99 percent (Goulden 2011: 193; World Bank 2009). Moreover, electricity has been heavily subsidized in order to make it affordable for the poorer segments of the population (World Bank 2009).
When electricity became a scarce resource during the years 2007–2009, the regime had to take decisions on allocation. According to information from the US Energy Information Ad‐ministration, Syrian energy net consumption had been increasing rather steadily until it ex‐
5 The Fund for Rural Development in Syria (FIRDOS) is a case in point; it has been argued that the scheme,
which had been implemented in 60 selected villages across six governorates, has been used to renew clientelist arrangements in rural areas (Donati 2013: 45).
6 It could be argued that in Syria – under Bashar al‐Asad – sectarian and, in particular, Alawi identity constitute a key mechanism that connects the new urban elite, traditional regime supporters and selected rural areas. There is, however, a dearth of elite analyses corroborating or falsifying this assertion, especially when com‐pared with the seminal studies on the presidency of Hafiz al‐Asad (Perthes 1997; Van Dam 2011).
Alexander De Juan and André Bank: Cooptation and the Geographical Distribution of Violence 13
WP 222/2013 GIGA Working Papers
perienced a substantial drop toward the end of the first decade of the twenty‐first century (EIA 2011). Qualitative accounts from this period confirm the electricity crisis and the sub‐stantial power cuts that struck the country as a result of this scarcity (Economic Intelligence Unit 2008; Economic Intelligence Unit 2009a; Economic Intelligence Unit 2009b).7 Rather than attempting to ease the overall energy shortfall nationwide, the regime geographically identi‐fied those regions that would receive electricity and those that would not. Power cuts were deliberately allocated, often previously announced through local newspapers (Oxford Busi‐ness Group 2010). Furthermore, the Ministry of Electricity launched a tender for generators to account for reduced capacities of public networks in selected areas in 2009 (Economic In‐telligence Unit 2009a; Economic Intelligence Unit 2009b). Given that the deliberate allocation of power cuts has also been reported since the beginning of the uprising in 2011,8 it comes as no surprise that the Ministry of Electricity has been added to the EU sanctions list due to its alleged use of power cuts as a means of repression (European Union 2012).
Due to the state’s control over electricity distribution, the regime’s history of using the electricity sector for cooptation and the alleged selective allocation of electricity flows, we ar‐gue that redistributive decisions made by the ruling regime during the period of severe power shortages (2007–2009) should indicate which subdistricts have been particularly favored by the ruling elite.
5 Design, Data and Results
Our analysis is based on a newly generated dataset of Syrian subdistricts (Arabic: nawahi, sg. nahiya). From the total of 274 subdistricts, we excluded the 9 Golan Heights subdistricts due to the specific political status of the region and our assumption that the conflict dynamics in this area may be influenced by aspects specific to the area and different from other regions in the country. Moreover, we discarded a further 4 subdistricts due to their geographic specific‐ities: the island of Arwad and the 3 subdistricts of Haritana, Jerablus and Tall Daww, which each consist of two geographically separated areas. This left us with a total of 261 subdistricts out of 274, located in 13 of the country’s 14 governorates.
5.1 The Dependent Variable: Occurrence of Violence
Our dependent variable is the occurrence of violence during the first 18 months of the Syrian civil war from March 2011 to November 2012. To measure it, we made use of a data source
7 The background of the crisis is manifold. It is likely that while demand increased constantly, Syria’s own
generation capacity has experienced decreases. Moreover, the electricity sector has traditionally suffered from major technical and nontechnical transmission and distribution losses (World Bank 2009).
8 In 2012 The Syria Report describes how the Ministry of Electricity increased and decreased power outages in various regions of the country (Syria Report, 9 July 2012, cited after Lyme 2012).
14 Alexander De Juan and André Bank: Cooptation and the Geographical Distribution of Violence
GIGA Working Papers WP 222/2013
that has seldom been used for analyses of political violence: crowdsourcing data. The basic idea of crowdsourcing is to gather information in a decentralized way, relying on infor‐mation provided by people “on the ground.” People input their observations by email or di‐rectly through various online platforms. Such systems have been used in a variety of cases, notably for the observation of violence or electoral processes.9
We used the data from an open, online platform called Syria Tracker, which is part of the larger Humanitarian Tracker project – a nonpolitical, nonpartisan organization. According to the information provided on the website, the platform is predominantly administered by Arab American volunteers based in the United States. Reports on fatalities can be filed in Arabic or English and include information on the exact location (either by description of the location or pinpointing on a digital map). The Syria Tracker team claims to make all possible efforts to clean the data of duplications by comparing the information provided in the reports. More‐over, information from various online sources is used to complement the events that have been reported via the Syria Tracker online platform.
There are various challenges associated with using such crowdsourcing data: The first is‐sue relates to the nature of the organizations that report the data; all of them are biased to‐wards the rebel opposition, which may influence the way killings are observed and reported. The second issue is related to the way information is gathered. Because reports are to be filed by witnesses, particularly intense fighting may lead to the underreporting of deaths simply because there may be no surviving witnesses to document fatalities. Underreporting may also be an issue in rural, less developed areas where a lack of access to electronic media may cause fatalities to be reported less frequently. A third issue relates to bias across time; this is caused by the population’s increased awareness of the crowdsourcing online platforms, which results in an increase in the number of reports filed (Price, Klinger, and Ball 2013).
Despite these shortcomings and the potential risks associated with them, we have identi‐fied three key reasons that legitimize the use of crowdsourcing data for our purposes. First, the crowdsourcing data on Syria provide a wealth of information on a complex and devastat‐ing civil war about which very little systematic information exists. Second, to account for the potential selection bias associated with this specific source, we analyzed correlations across space and time between the crowdsourcing data and another data source that relies on local networks of informants – that is, the Violations Documentation Centre. The high correlations we found strengthened our confidence in the crowdsourcing data.10 Third, we are confident 9 For example, to monitor elections in Liberia (online: <www.liberia2011.ushahidi.com/>, 21 February 2013), vi‐
olence in Sudan (online: <https://jan30sudan.crowdmap.com/>, 21 February 2013) or postelection violence in Kenya (online: <http://legacy.ushahidi.com/>, 21 February 2013).
10 We have calculated the correlation between the number of fatalities recorded by Syria Tracker and Violations Documentation Centre per month per governorate for the period from March 2011 to November 2012. The correlation coefficient (Pearson) is extremely high (0.90). Both sources vary in the sum of recorded fatalities. In some governorate/months one source reported a higher number, in other governorate/months it was the other source. This mirrors results from Price et al. (2013).
Alexander De Juan and André Bank: Cooptation and the Geographical Distribution of Violence 15
WP 222/2013 GIGA Working Papers
that our specific approach of analysis reduced the risks associated with some specific types of selection bias. Notably, we mitigated the potential risks associated with temporal bias by performing cross‐sectional analyses only. Furthermore, we reduced the potential problems emanating from inaccuracies with regard to the exact numbers of reported deaths. We did not consider differences in intensity levels but relied on a binary variable of violence occur‐rence. Additionally, as regards potential geographical selection bias, we included a series of control variables into our analyses (see below).
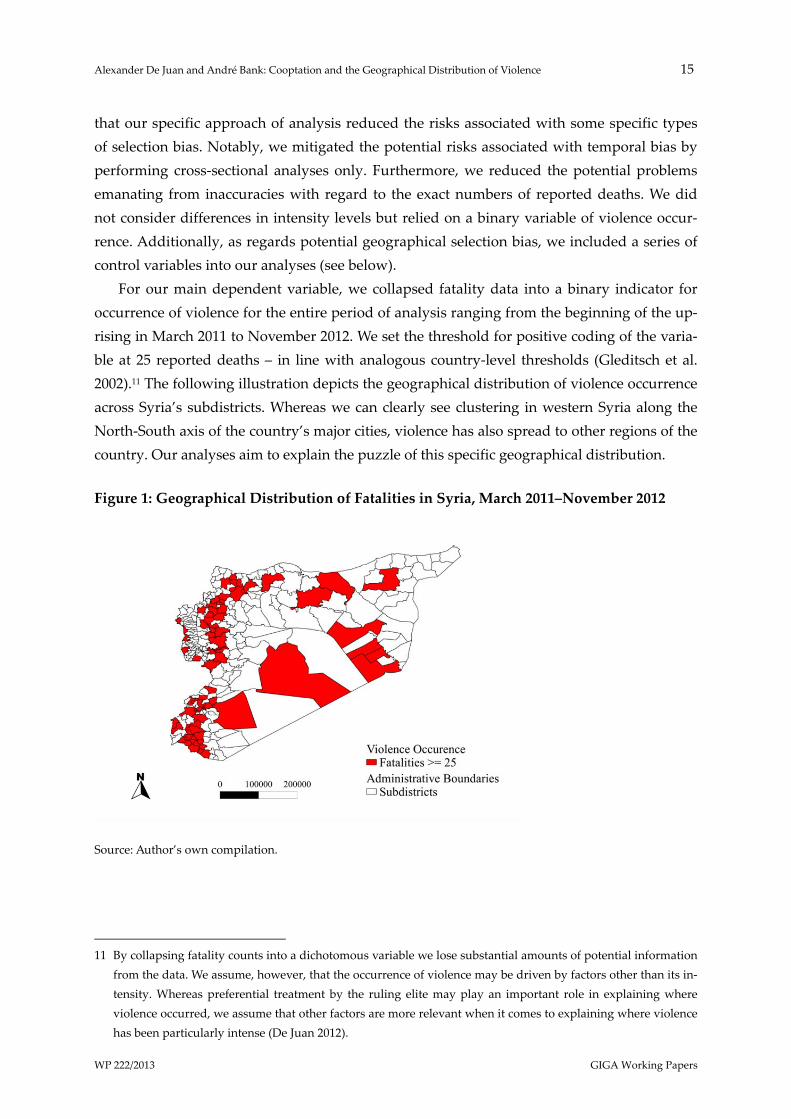
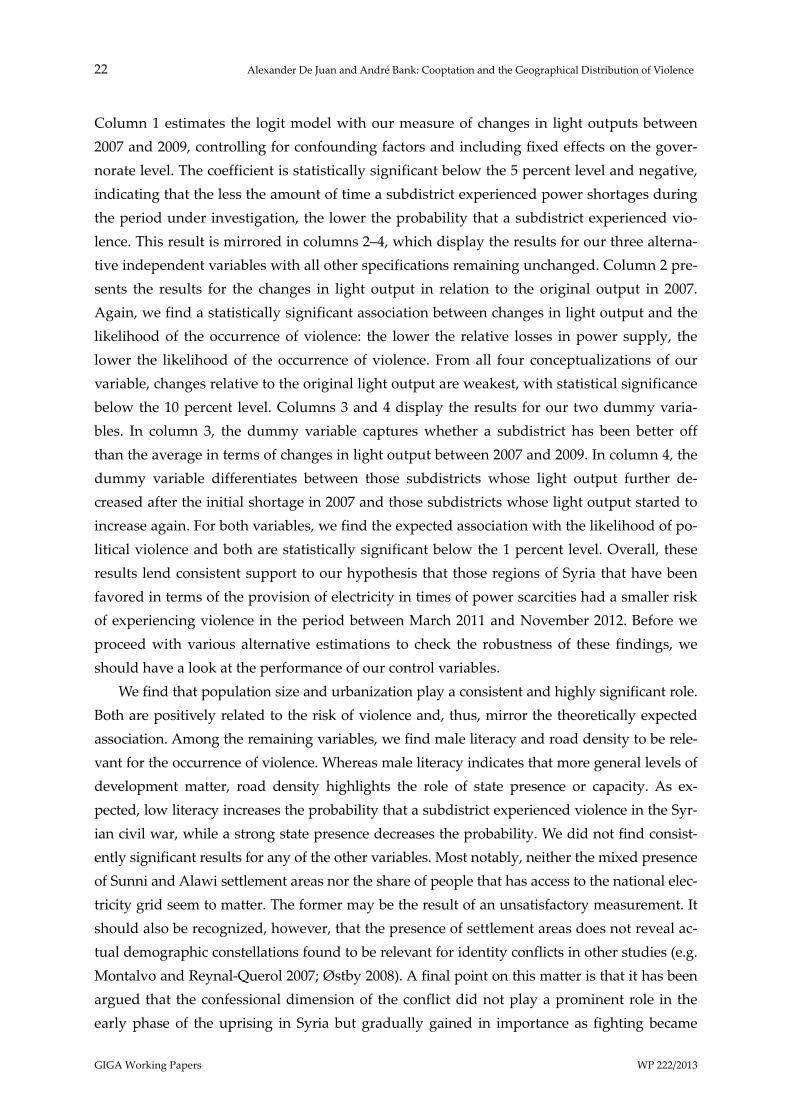
For our main dependent variable, we collapsed fatality data into a binary indicator for occurrence of violence for the entire period of analysis ranging from the beginning of the up‐rising in March 2011 to November 2012. We set the threshold for positive coding of the varia‐ble at 25 reported deaths – in line with analogous country‐level thresholds (Gleditsch et al. 2002).11 The following illustration depicts the geographical distribution of violence occurrence across Syria’s subdistricts. Whereas we can clearly see clustering in western Syria along the North‐South axis of the country’s major cities, violence has also spread to other regions of the country. Our analyses aim to explain the puzzle of this specific geographical distribution.
Figure 1: Geographical Distribution of Fatalities in Syria, March 2011‒November 2012
Source: Author’s own compilation.
11 By collapsing fatality counts into a dichotomous variable we lose substantial amounts of potential information
from the data. We assume, however, that the occurrence of violence may be driven by factors other than its in‐tensity. Whereas preferential treatment by the ruling elite may play an important role in explaining where violence occurred, we assume that other factors are more relevant when it comes to explaining where violence has been particularly intense (De Juan 2012).
16 Alexander De Juan and André Bank: Cooptation and the Geographical Distribution of Violence
GIGA Working Papers WP 222/2013
5.2 The Independent Variables: Access to Electricity
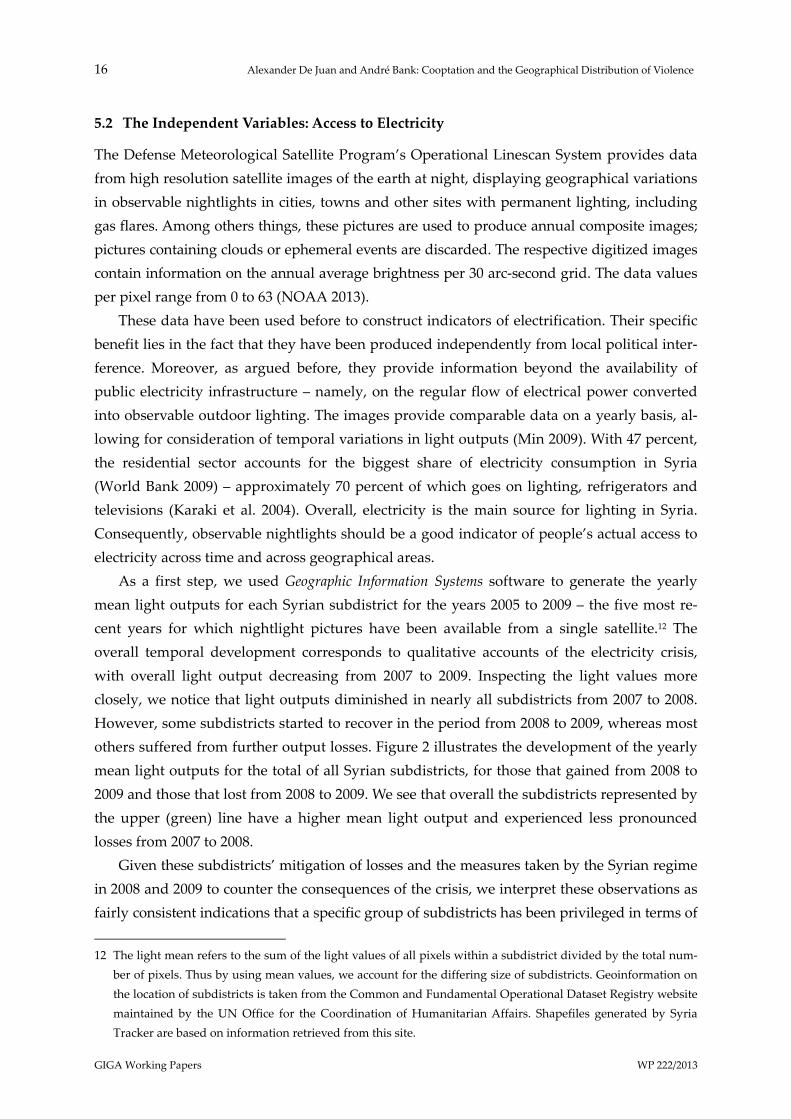
The Defense Meteorological Satellite Program’s Operational Linescan System provides data from high resolution satellite images of the earth at night, displaying geographical variations in observable nightlights in cities, towns and other sites with permanent lighting, including gas flares. Among others things, these pictures are used to produce annual composite images; pictures containing clouds or ephemeral events are discarded. The respective digitized images contain information on the annual average brightness per 30 arc‐second grid. The data values per pixel range from 0 to 63 (NOAA 2013).
These data have been used before to construct indicators of electrification. Their specific benefit lies in the fact that they have been produced independently from local political inter‐ference. Moreover, as argued before, they provide information beyond the availability of public electricity infrastructure – namely, on the regular flow of electrical power converted into observable outdoor lighting. The images provide comparable data on a yearly basis, al‐lowing for consideration of temporal variations in light outputs (Min 2009). With 47 percent, the residential sector accounts for the biggest share of electricity consumption in Syria (World Bank 2009) – approximately 70 percent of which goes on lighting, refrigerators and televisions (Karaki et al. 2004). Overall, electricity is the main source for lighting in Syria. Consequently, observable nightlights should be a good indicator of people’s actual access to electricity across time and across geographical areas.
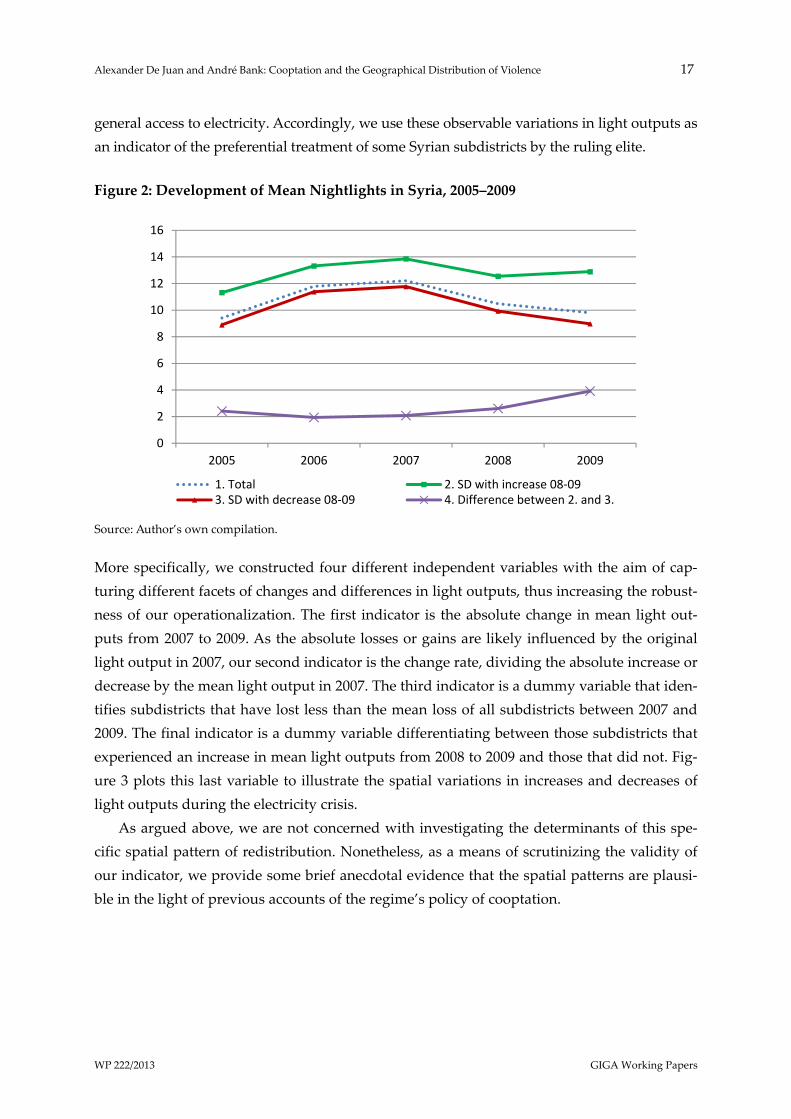
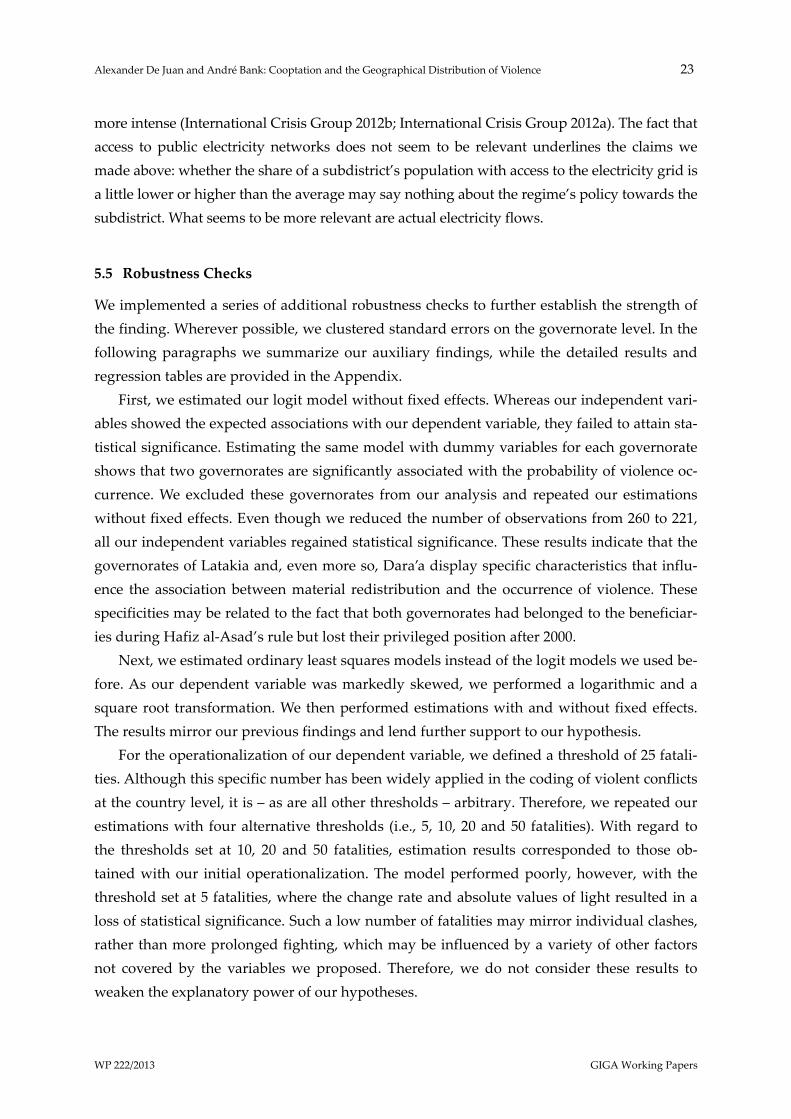
As a first step, we used Geographic Information Systems software to generate the yearly mean light outputs for each Syrian subdistrict for the years 2005 to 2009 – the five most re‐cent years for which nightlight pictures have been available from a single satellite.12 The overall temporal development corresponds to qualitative accounts of the electricity crisis, with overall light output decreasing from 2007 to 2009. Inspecting the light values more closely, we notice that light outputs diminished in nearly all subdistricts from 2007 to 2008. However, some subdistricts started to recover in the period from 2008 to 2009, whereas most others suffered from further output losses. Figure 2 illustrates the development of the yearly mean light outputs for the total of all Syrian subdistricts, for those that gained from 2008 to 2009 and those that lost from 2008 to 2009. We see that overall the subdistricts represented by the upper (green) line have a higher mean light output and experienced less pronounced losses from 2007 to 2008.
Given these subdistricts’ mitigation of losses and the measures taken by the Syrian regime in 2008 and 2009 to counter the consequences of the crisis, we interpret these observations as fairly consistent indications that a specific group of subdistricts has been privileged in terms of
12 The light mean refers to the sum of the light values of all pixels within a subdistrict divided by the total num‐
ber of pixels. Thus by using mean values, we account for the differing size of subdistricts. Geoinformation on the location of subdistricts is taken from the Common and Fundamental Operational Dataset Registry website maintained by the UN Office for the Coordination of Humanitarian Affairs. Shapefiles generated by Syria Tracker are based on information retrieved from this site.
Alexander De Juan and André Bank: Cooptation and the Geographical Distribution of Violence 17
WP 222/2013 GIGA Working Papers
general access to electricity. Accordingly, we use these observable variations in light outputs as an indicator of the preferential treatment of some Syrian subdistricts by the ruling elite.
Figure 2: Development of Mean Nightlights in Syria, 2005‒2009
Source: Author’s own compilation.
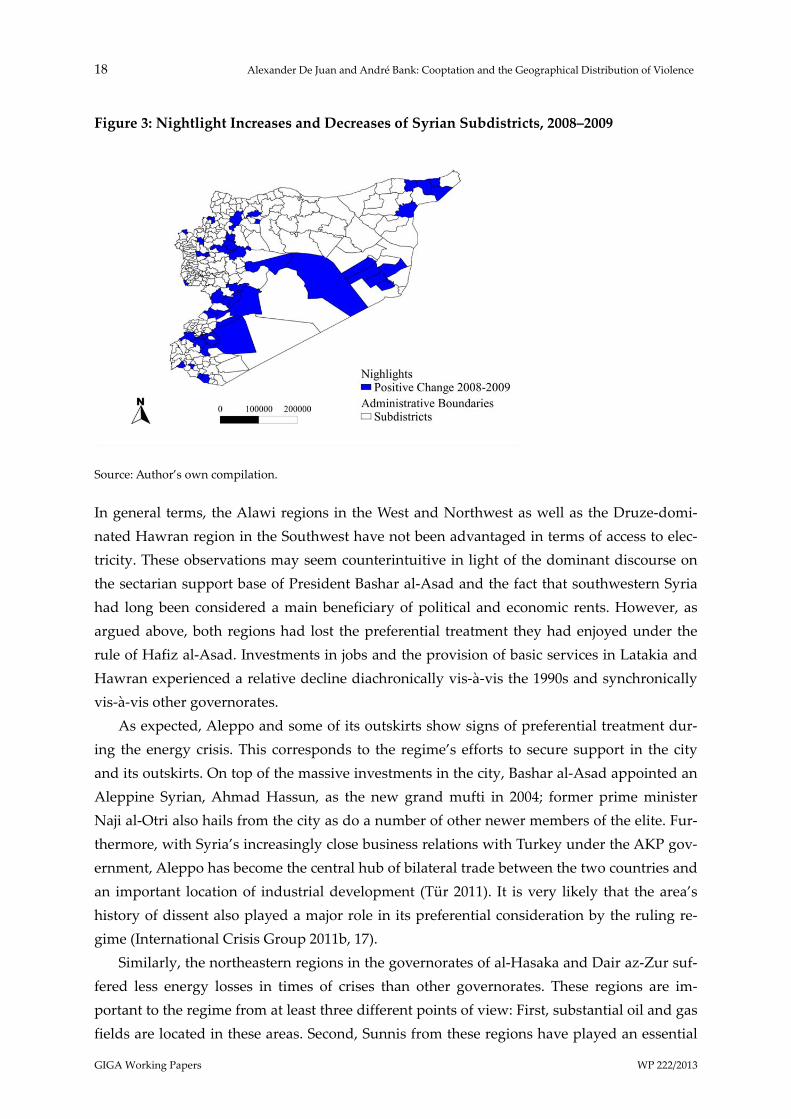
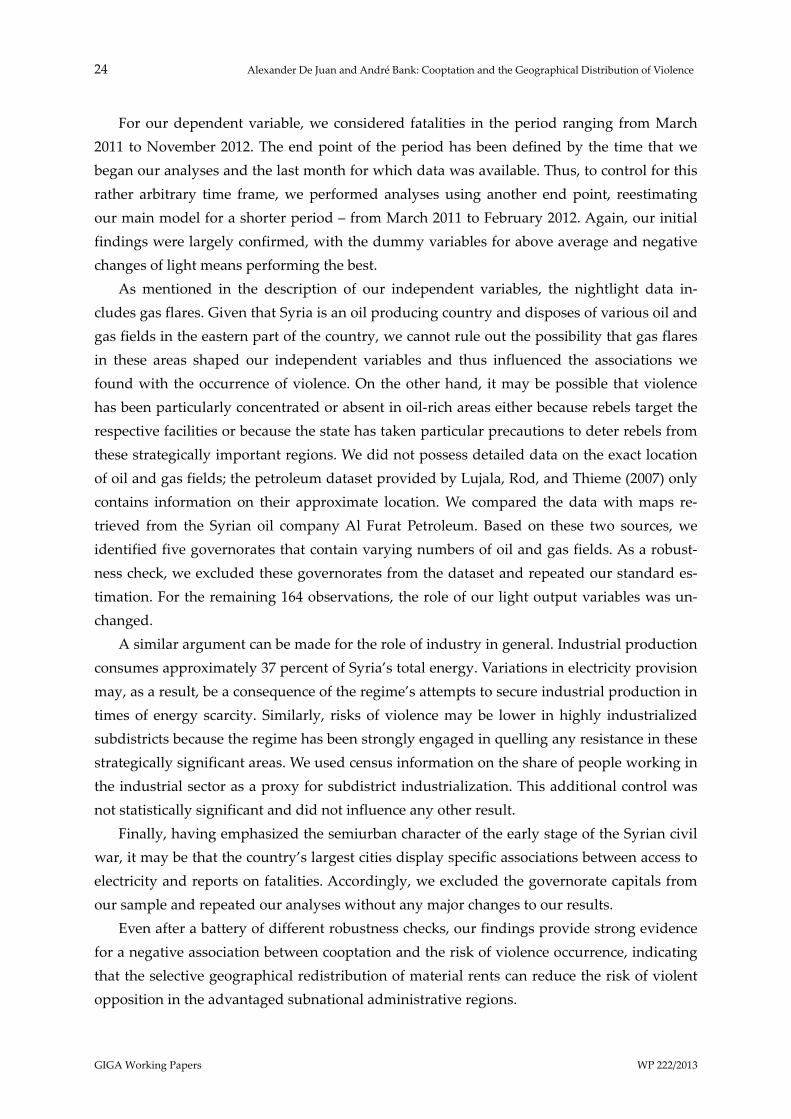
More specifically, we constructed four different independent variables with the aim of cap‐turing different facets of changes and differences in light outputs, thus increasing the robust‐ness of our operationalization. The first indicator is the absolute change in mean light out‐puts from 2007 to 2009. As the absolute losses or gains are likely influenced by the original light output in 2007, our second indicator is the change rate, dividing the absolute increase or decrease by the mean light output in 2007. The third indicator is a dummy variable that iden‐tifies subdistricts that have lost less than the mean loss of all subdistricts between 2007 and 2009. The final indicator is a dummy variable differentiating between those subdistricts that experienced an increase in mean light outputs from 2008 to 2009 and those that did not. Fig‐ure 3 plots this last variable to illustrate the spatial variations in increases and decreases of light outputs during the electricity crisis.
As argued above, we are not concerned with investigating the determinants of this spe‐cific spatial pattern of redistribution. Nonetheless, as a means of scrutinizing the validity of our indicator, we provide some brief anecdotal evidence that the spatial patterns are plausi‐ble in the light of previous accounts of the regime’s policy of cooptation.
0
2
4
6
8
10
12
14
16
2005 2006 2007 2008 2009
1. Total 2. SD with increase 08‐093. SD with decrease 08‐09 4. Difference between 2. and 3.
18 Alexander De Juan and André Bank: Cooptation and the Geographical Distribution of Violence
GIGA Working Papers WP 222/2013
Figure 3: Nightlight Increases and Decreases of Syrian Subdistricts, 2008‒2009
Source: Author’s own compilation.
In general terms, the Alawi regions in the West and Northwest as well as the Druze‐domi‐nated Hawran region in the Southwest have not been advantaged in terms of access to elec‐tricity. These observations may seem counterintuitive in light of the dominant discourse on the sectarian support base of President Bashar al‐Asad and the fact that southwestern Syria had long been considered a main beneficiary of political and economic rents. However, as argued above, both regions had lost the preferential treatment they had enjoyed under the rule of Hafiz al‐Asad. Investments in jobs and the provision of basic services in Latakia and Hawran experienced a relative decline diachronically vis‐à‐vis the 1990s and synchronically vis‐à‐vis other governorates.
As expected, Aleppo and some of its outskirts show signs of preferential treatment dur‐ing the energy crisis. This corresponds to the regime’s efforts to secure support in the city and its outskirts. On top of the massive investments in the city, Bashar al‐Asad appointed an Aleppine Syrian, Ahmad Hassun, as the new grand mufti in 2004; former prime minister Naji al‐Otri also hails from the city as do a number of other newer members of the elite. Fur‐thermore, with Syria’s increasingly close business relations with Turkey under the AKP gov‐ernment, Aleppo has become the central hub of bilateral trade between the two countries and an important location of industrial development (Tür 2011). It is very likely that the area’s history of dissent also played a major role in its preferential consideration by the ruling re‐gime (International Crisis Group 2011b, 17).
Similarly, the northeastern regions in the governorates of al‐Hasaka and Dair az‐Zur suf‐fered less energy losses in times of crises than other governorates. These regions are im‐portant to the regime from at least three different points of view: First, substantial oil and gas fields are located in these areas. Second, Sunnis from these regions have played an essential
Alexander De Juan and André Bank: Cooptation and the Geographical Distribution of Violence 19
WP 222/2013 GIGA Working Papers
role as the backbone of the Syrian military, which creates strong incentives for the regime to secure at least a minimum support in their home governorates (Donati 2013). Third, al‐Hasaka is a predominantly Kurdish region (in)famous for its restiveness, as evidenced by lo‐cal riots in March 2004 and May 2005. When tensions rose in the region prior to the actual Syr‐ian uprising, the regime reacted – in addition to increasing security services personnel – by implementing local cash‐payment schemes in the region (International Crisis Group 2011a: 6).
Further to the south, we observe that the governorates of Damascus and Homs have been particularly well‐off during the energy crisis. As argued above, the central neighborhoods of Damascus have been among the main profiteers of the regime’s policy. Under Bashar al‐Asad, the city consolidated its position as the political and economic center of Syria (Interna‐tional Crisis Group 2011a: 17). Similarly, Homs has enjoyed a rather privileged status. Several pilot projects have been launched in the region with the aim of turning the city into a national administrative center and the central hub on the crucial North‐South transportation axis. Fur‐thermore, the regime holds close personal ties to the city with both the president and his brother, Maher, marrying into families from Homs (International Crisis Group 2011a: 18).
This anecdotal evidence supports our claim that variations in access to electricity during Syria’s energy crisis mirrors geographical variations in the regime’s strategic redistribution of economic rents.
5.3 Alternative Explanations and Control Variables
The indicators we used for our control variables mainly stem from the country’s last popula‐tion census undertaken in 2004. Although social, economic and political features of the sub‐districts may have changed in the seven‐year period between the census and the beginning of the uprising in 2011, we assume that this time span was too short for any fundamental changes in differences across subdistricts to have occurred. As our analyses only exploit such geographical variations, we are confident that the census data provide effective proxies for certain essential variables. If not explicitly stated otherwise, the information for our control variables come from the census.
The first control variable we included is population size. Countries and subnational ad‐ministrative units display a higher risk of experiencing political violence the more people live within their boundaries; numerous studies have underlined this correlation (Collier and Hoeffler 2004; Raleigh and Hegre 2009). We included log‐transformed population size into our analyses in order to account for excessive variations in population size across Syrian subdistricts.
Our analyses focus on a specific type of violence. The Syrian civil war evolved out of mass protests that began in the country’s semiurban areas and eventually spread to the ur‐ban centers of Homs, Hama, parts of Damascus and, finally, Aleppo. We therefore included information on subdistricts’ degrees of urbanization into our analyses. Following the thresh‐
20 Alexander De Juan and André Bank: Cooptation and the Geographical Distribution of Violence
GIGA Working Papers WP 222/2013
olds used by the United Nations, our urbanization variable represents the share of the popu‐lation living in cities with more than twenty thousand inhabitants.
The theoretical and empirical literature on political violence has emphasized the role of grievances stemming from low socioeconomic development (e.g. Do and Iyer 2010; Gurr 1993). We consider male literacy rates per subdistrict as a proxy for development levels. We decided to focus on male literacy rather than overall literacy rates in order to avoid potential distortions resulting from religio‐cultural variations in enrolment and literacy rates.
Our main independent variables can only mirror variations in the public provision of electricity if people primarily use power from public networks, rather than from private gen‐erators. We thus included the share of people with access to the state’s electricity network as a control variable.
Studies that focus on opportunities for rebellion emphasize the role of factors that facili‐tate recruitment into armed groups (e.g. Bohara et al. 2006; Collier and Hoeffler 2004). Un‐employment is essential in this respect. People will more likely engage in violent action if their current and future economic perspectives are low. Therefore, we include information on male (see above) unemployment rates per subdistrict into our analyses.
Previous quantitative analyses on the subnational level demonstrate that violence is less likely in areas where the state maintains an effective presence (e.g. Buhaug 2010; Buhaug and Gates 2002). The Syrian census includes information on the share of people working for the state. We leverage this information to control for variations in state presence across subdis‐tricts. Moreover, we use information on the Syrian road network provided by the UNDP. Us‐ing GIS software, we calculated the number of road kilometers per subdistrict and divided it by the size of the respective subdistrict areas.
In many areas, violent clashes have displayed a strong sectarian dimension, pitting the Sunni majority against the Alawi minority. To the best of our knowledge, no reliable data ex‐ists on the size of the various communities. As part of a larger mapping project (Gulf 2000), Michael Izady has generated a map displaying settlement areas of all religious communities (Izady 2012). We exploit the map to construct a dummy variable that takes on the value “1” for subdistricts that enclose Sunni and Alawi settlement areas.
Although the census provides a series of relevant socioeconomic data, we did not have access to reliable data for other potentially relevant factors – for example, variations in the quality of the electricity grid, political affiliations of the executives of the regional power suppliers or the composition of the administration across the country’s 14 governorates. To account for these and other confounding social, economic or political variations, we included governorate‐level fixed effects into our model. More information on our empirical strategy is provided in the next section.13
13 We have investigated two other spatial variables: First, in order to consider spatial clustering of violence, we
have calculated a variable that sums the number of fatalities in all neighboring subdistricts. Second, in the case of Syria, it has been emphasized that local smuggling networks in the southern and northern border districts
Alexander De Juan and André Bank: Cooptation and the Geographical Distribution of Violence 21
WP 222/2013 GIGA Working Papers
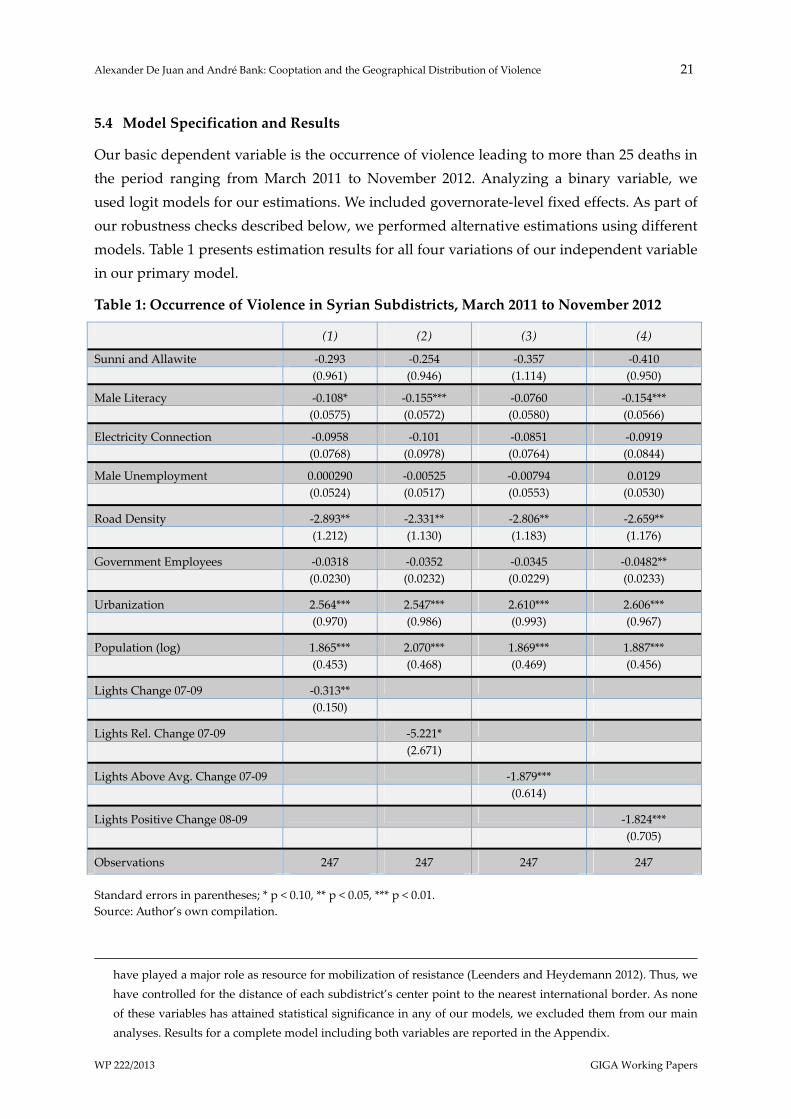
5.4 Model Specification and Results
Our basic dependent variable is the occurrence of violence leading to more than 25 deaths in the period ranging from March 2011 to November 2012. Analyzing a binary variable, we used logit models for our estimations. We included governorate‐level fixed effects. As part of our robustness checks described below, we performed alternative estimations using different models. Table 1 presents estimation results for all four variations of our independent variable in our primary model.
Table 1: Occurrence of Violence in Syrian Subdistricts, March 2011 to November 2012
(1) (2) (3) (4)
Sunni and Allawite ‐0.293 ‐0.254 ‐0.357 ‐0.410 (0.961) (0.946) (1.114) (0.950)
Male Literacy ‐0.108* ‐0.155*** ‐0.0760 ‐0.154*** (0.0575) (0.0572) (0.0580) (0.0566)
Electricity Connection ‐0.0958 ‐0.101 ‐0.0851 ‐0.0919 (0.0768) (0.0978) (0.0764) (0.0844)
Male Unemployment 0.000290 ‐0.00525 ‐0.00794 0.0129
(0.0524) (0.0517) (0.0553) (0.0530)
Road Density ‐2.893** ‐2.331** ‐2.806** ‐2.659**
(1.212) (1.130) (1.183) (1.176)
Government Employees ‐0.0318 ‐0.0352 ‐0.0345 ‐0.0482**
(0.0230) (0.0232) (0.0229) (0.0233)
Urbanization 2.564*** 2.547*** 2.610*** 2.606***
(0.970) (0.986) (0.993) (0.967)
Population (log) 1.865*** 2.070*** 1.869*** 1.887***
(0.453) (0.468) (0.469) (0.456)
Lights Change 07‐09 ‐0.313**
(0.150)
Lights Rel. Change 07‐09 ‐5.221*
(2.671)
Lights Above Avg. Change 07‐09 ‐1.879***
(0.614)
Lights Positive Change 08‐09 ‐1.824***
(0.705)
Observations 247 247 247 247
Standard errors in parentheses; * p < 0.10, ** p < 0.05, *** p < 0.01. Source: Author’s own compilation.
have played a major role as resource for mobilization of resistance (Leenders and Heydemann 2012). Thus, we have controlled for the distance of each subdistrict’s center point to the nearest international border. As none of these variables has attained statistical significance in any of our models, we excluded them from our main analyses. Results for a complete model including both variables are reported in the Appendix.
22 Alexander De Juan and André Bank: Cooptation and the Geographical Distribution of Violence
GIGA Working Papers WP 222/2013
Column 1 estimates the logit model with our measure of changes in light outputs between 2007 and 2009, controlling for confounding factors and including fixed effects on the gover‐norate level. The coefficient is statistically significant below the 5 percent level and negative, indicating that the less the amount of time a subdistrict experienced power shortages during the period under investigation, the lower the probability that a subdistrict experienced vio‐lence. This result is mirrored in columns 2–4, which display the results for our three alterna‐tive independent variables with all other specifications remaining unchanged. Column 2 pre‐sents the results for the changes in light output in relation to the original output in 2007. Again, we find a statistically significant association between changes in light output and the likelihood of the occurrence of violence: the lower the relative losses in power supply, the lower the likelihood of the occurrence of violence. From all four conceptualizations of our variable, changes relative to the original light output are weakest, with statistical significance below the 10 percent level. Columns 3 and 4 display the results for our two dummy varia‐bles. In column 3, the dummy variable captures whether a subdistrict has been better off than the average in terms of changes in light output between 2007 and 2009. In column 4, the dummy variable differentiates between those subdistricts whose light output further de‐creased after the initial shortage in 2007 and those subdistricts whose light output started to increase again. For both variables, we find the expected association with the likelihood of po‐litical violence and both are statistically significant below the 1 percent level. Overall, these results lend consistent support to our hypothesis that those regions of Syria that have been favored in terms of the provision of electricity in times of power scarcities had a smaller risk of experiencing violence in the period between March 2011 and November 2012. Before we proceed with various alternative estimations to check the robustness of these findings, we should have a look at the performance of our control variables.
We find that population size and urbanization play a consistent and highly significant role. Both are positively related to the risk of violence and, thus, mirror the theoretically expected association. Among the remaining variables, we find male literacy and road density to be rele‐vant for the occurrence of violence. Whereas male literacy indicates that more general levels of development matter, road density highlights the role of state presence or capacity. As ex‐pected, low literacy increases the probability that a subdistrict experienced violence in the Syr‐ian civil war, while a strong state presence decreases the probability. We did not find consist‐ently significant results for any of the other variables. Most notably, neither the mixed presence of Sunni and Alawi settlement areas nor the share of people that has access to the national elec‐tricity grid seem to matter. The former may be the result of an unsatisfactory measurement. It should also be recognized, however, that the presence of settlement areas does not reveal ac‐tual demographic constellations found to be relevant for identity conflicts in other studies (e.g. Montalvo and Reynal‐Querol 2007; Østby 2008). A final point on this matter is that it has been argued that the confessional dimension of the conflict did not play a prominent role in the early phase of the uprising in Syria but gradually gained in importance as fighting became
Alexander De Juan and André Bank: Cooptation and the Geographical Distribution of Violence 23
WP 222/2013 GIGA Working Papers
more intense (International Crisis Group 2012b; International Crisis Group 2012a). The fact that access to public electricity networks does not seem to be relevant underlines the claims we made above: whether the share of a subdistrict’s population with access to the electricity grid is a little lower or higher than the average may say nothing about the regime’s policy towards the subdistrict. What seems to be more relevant are actual electricity flows.
5.5 Robustness Checks
We implemented a series of additional robustness checks to further establish the strength of the finding. Wherever possible, we clustered standard errors on the governorate level. In the following paragraphs we summarize our auxiliary findings, while the detailed results and regression tables are provided in the Appendix.
First, we estimated our logit model without fixed effects. Whereas our independent vari‐ables showed the expected associations with our dependent variable, they failed to attain sta‐tistical significance. Estimating the same model with dummy variables for each governorate shows that two governorates are significantly associated with the probability of violence oc‐currence. We excluded these governorates from our analysis and repeated our estimations without fixed effects. Even though we reduced the number of observations from 260 to 221, all our independent variables regained statistical significance. These results indicate that the governorates of Latakia and, even more so, Dara’a display specific characteristics that influ‐ence the association between material redistribution and the occurrence of violence. These specificities may be related to the fact that both governorates had belonged to the beneficiar‐ies during Hafiz al‐Asad’s rule but lost their privileged position after 2000.
Next, we estimated ordinary least squares models instead of the logit models we used be‐fore. As our dependent variable was markedly skewed, we performed a logarithmic and a square root transformation. We then performed estimations with and without fixed effects. The results mirror our previous findings and lend further support to our hypothesis.
For the operationalization of our dependent variable, we defined a threshold of 25 fatali‐ties. Although this specific number has been widely applied in the coding of violent conflicts at the country level, it is – as are all other thresholds – arbitrary. Therefore, we repeated our estimations with four alternative thresholds (i.e., 5, 10, 20 and 50 fatalities). With regard to the thresholds set at 10, 20 and 50 fatalities, estimation results corresponded to those ob‐tained with our initial operationalization. The model performed poorly, however, with the threshold set at 5 fatalities, where the change rate and absolute values of light resulted in a loss of statistical significance. Such a low number of fatalities may mirror individual clashes, rather than more prolonged fighting, which may be influenced by a variety of other factors not covered by the variables we proposed. Therefore, we do not consider these results to weaken the explanatory power of our hypotheses.
24 Alexander De Juan and André Bank: Cooptation and the Geographical Distribution of Violence
GIGA Working Papers WP 222/2013
For our dependent variable, we considered fatalities in the period ranging from March 2011 to November 2012. The end point of the period has been defined by the time that we began our analyses and the last month for which data was available. Thus, to control for this rather arbitrary time frame, we performed analyses using another end point, reestimating our main model for a shorter period – from March 2011 to February 2012. Again, our initial findings were largely confirmed, with the dummy variables for above average and negative changes of light means performing the best.
As mentioned in the description of our independent variables, the nightlight data in‐cludes gas flares. Given that Syria is an oil producing country and disposes of various oil and gas fields in the eastern part of the country, we cannot rule out the possibility that gas flares in these areas shaped our independent variables and thus influenced the associations we found with the occurrence of violence. On the other hand, it may be possible that violence has been particularly concentrated or absent in oil‐rich areas either because rebels target the respective facilities or because the state has taken particular precautions to deter rebels from these strategically important regions. We did not possess detailed data on the exact location of oil and gas fields; the petroleum dataset provided by Lujala, Rod, and Thieme (2007) only contains information on their approximate location. We compared the data with maps re‐trieved from the Syrian oil company Al Furat Petroleum. Based on these two sources, we identified five governorates that contain varying numbers of oil and gas fields. As a robust‐ness check, we excluded these governorates from the dataset and repeated our standard es‐timation. For the remaining 164 observations, the role of our light output variables was un‐changed.
A similar argument can be made for the role of industry in general. Industrial production consumes approximately 37 percent of Syria’s total energy. Variations in electricity provision may, as a result, be a consequence of the regime’s attempts to secure industrial production in times of energy scarcity. Similarly, risks of violence may be lower in highly industrialized subdistricts because the regime has been strongly engaged in quelling any resistance in these strategically significant areas. We used census information on the share of people working in the industrial sector as a proxy for subdistrict industrialization. This additional control was not statistically significant and did not influence any other result.
Finally, having emphasized the semiurban character of the early stage of the Syrian civil war, it may be that the country’s largest cities display specific associations between access to electricity and reports on fatalities. Accordingly, we excluded the governorate capitals from our sample and repeated our analyses without any major changes to our results.
Even after a battery of different robustness checks, our findings provide strong evidence for a negative association between cooptation and the risk of violence occurrence, indicating that the selective geographical redistribution of material rents can reduce the risk of violent opposition in the advantaged subnational administrative regions.
Alexander De Juan and André Bank: Cooptation and the Geographical Distribution of Violence 25
WP 222/2013 GIGA Working Papers
6 Conclusions
Our analysis confirms earlier findings of cross‐country analyses on the role of cooptation in the risk of violence – namely, that the provision of public goods can reduce the risk of violent opposition. Certainly, this does not mean that cooptation has causally determined the occur‐rence of political violence in Syria. Homs is a case in point. Given its preferential treatment by the regime, the city should have been an unlikely candidate to experience a high level of violence in the ensuing civil war; it developed, however, into a conflict hotspot. Any poten‐tial appeasing effects may have been lost due to the intensity of the regime’s repression, the proximity to the border with Lebanon and, especially, the cross‐border Sunni‐Islamist net‐works and the mixed ethnoreligious makeup of the city. Even though some subdistricts con‐tradict our theoretical argument, our empirical analyses provide consistent and robust evi‐dence that cooptation has played a role in reducing the likelihood of certain subdistricts ex‐periencing violence during the early phase of the civil war. We are thus able to provide ro‐bust support for the hypothesis that selective redistribution can actually contribute to reduc‐ing the risks of violent opposition in beneficiary regions.
Empirically, we provide support to the growing number of analyses that make use of new, rather unconventional data sources – such as nightlights and crowdsourcing. Although we are aware of the potential shortcomings and risks of using such data, we have shown how they can contribute to analyses in settings marked by the limited availability of reliable data – for example, in authoritarian states or situations of open warfare. In terms of the more specific operationalization of material redistribution, our analyses demonstrate the need to consider the actual provision of respective services and not general access alone. In our case, it was not access to the national electricity grid, but rather the variation in the provision of electricity. Finally, we provide an example for how temporal developments (e.g., previous changes in nightlights) may be exploited in order to measure dynamics of redistribution that can hardly be grasped by static data alone.
Building on these insights, future research on the nexus of regime cooptation and politi‐cal violence could proceed along four avenues. First, complementing our focus on the effects of regime cooptation, future studies should more thoroughly investigate the determinants of regime redistribution as they may have an influence on the success of the attempted coopta‐tion strategy. Such an approach would entail the difficult task of disentangling the broad cat‐egory of cooptation to account for differences of whether the targeted region constitutes a re‐gime base, a stronghold of the opposition or a swing region. Second, future research should study more than one public good. We cannot rule out the possibility that some regions in Syria may have had good access to electricity but not to other basic services or even political rents (Kramon and Posner 2010). The selective distribution of other goods or of “packages” of goods should offer new insights in this regard. Third, our analysis focuses on one country alone. Consequently, even though we find consistent evidence in support of our hypothesis in the case of the Syrian civil war, these dynamics might be different in other country con‐

26 Alexander De Juan and André Bank: Cooptation and the Geographical Distribution of Violence
GIGA Working Papers WP 222/2013
texts. Cross‐country, subnational analyses could scrutinize our findings. The global availabil‐ity of nightlight data as well as the growing number of geographically disaggregated event datasets may allow for such analyses in a selected number of cases. Fourth, we have exam‐ined the effects of cooptation in the context of a highly authoritarian regime in a society di‐vided along multiple lines. Future studies may wish to focus on democratic countries and/or countries with other ethnopolitical features.
Alexander De Juan and André Bank: Cooptation and the Geographical Distribution of Violence 27
WP 222/2013 GIGA Working Papers
Bibliography
Abboud, Samer (2013), Economic Transformation and Diffusion of Authoritarian Power in Syria, in: Larbi Sadiki, Heiko Wimmen, and Layla al‐Zubaidi (eds), Democratic Transition in the Middle East. Unpacking Power, 159–177, London: Routledge.
Acemoglu, Daron, Thierry Verdier, and James A. Robinson (2004), Kleptocracy and Divide‐and‐Rule: A Model of Personal Rule, in: Journal of the European Economic Association, 2, 2‒3, 162–192.
Arraf, Jane, (2010), A Bigger Threat to Iraq Than Al Qaeda? Power Cuts, in: Christian Science Monitor, online: <www.csmonitor.com/World/Middle‐East/2010/0622/A‐bigger‐threat‐to‐Iraq‐than‐Al‐Qaeda‐Power‐cuts> (13 February 2013).
Arulampalam, Wiji, Sugato Dasgupta, Amrita Dhillon, and Bhaskar Dutta, (2009), Electoral Goals and Center‐state Transfers: A Theoretical Model and Empirical Evidence from In‐dia, in: Journal of Development Economics, 88, 1, 103–119.
Azam, Jean‐Paul (2001), The Redistributive State and Conflicts in Africa, in: Journal of Peace Re‐search 38, 4, 429–444.
Bank, André (2004), Rents, Cooptation, and Economized Discourse: Three Dimensions of Polit‐ical Rule in Jordan, Morocco and Syria, in: Journal of Mediterranean Studies, 14, 1/2, 155–179.
Bethke, Felix, and Margit Bussmann (2011), Domestic Mass Unrest and State Capacity, online: <http://wordpress.uni‐greifswald.de/ib/wp‐content/uploads/2011/08/BethkeBussmann_10 June2011.pdf> (16 December 2012).
Bohara, Alok K., Neil J. Mitchell, and Mani Nepal (2006), Opportunity, Democracy, and the Exchange of Political Violence A Subnational Analysis of Conflict in Nepal, in: Journal of Conflict Resolution, 50, 1, 108–128.
Bueno de Mesquita, Bruce, Alastair Smith, Randolph M. Siverson, and James D. Morrow (2003), The Logic of Political Survival, Cambridge, MA: MIT Press.
Buhaug, H (2010), Dude, Where’s My Conflict?: LSG, Relative Strength, and the Location of Civil War, in: Conflict Management and Peace Science, 27, 2, 107–128.
Buhaug, Halvard, and Scott Gates (2002), The Geography of Civil War, in: Journal of Peace Re‐search, 39, 4, 417–433.
Burgess, Robin, Rémi Jedwab, Edward Miguel, and Ameet Morjaria (2010), Our Turn To Eat: The Political Economy of Roads in Kenya, unpublished paper.
Bussmann, Margit (2009), Staatskapazität und Bürgerkriege: Peitsche oder Zuckerbrot?, in: Margit Bussmann, Andreas Hasenclever, and Gerald Schneider (eds), Identität, Institutio‐nen und Ökonomie: Ursachen Innenpolitischer Gewalt, Wiesbaden: VS Verlag für Sozialwis‐senschaften, 258–282.
Collier, Paul, and Anke Hoeffler (2004), Greed and Grievance in Civil War, Oxford Economic Pa‐pers, 56, 4, 563–595.
28 Alexander De Juan and André Bank: Cooptation and the Geographical Distribution of Violence
GIGA Working Papers WP 222/2013
Van Dam, Nikolaos (2011), The Struggle for Power in Syria: Politics and Society Under Asad and the Ba’th Party, 4th ed., London: I.B. Tauris.
Do, Quy‐Toan, and Lakshmi Iyer (2010), Geography, Poverty and Conflict in Nepal, in: Journal of Peace Research, 47, 6, 735–748.
Donati, Caroline (2013), The Economics of Authoritarian Upgrading in Syria. Liberalization and the Reconfiguration of Economic Networks, in: Steven Heydemann and Reinoud Leenders (eds), Middle East Authoritarianisms: Governance, Contestation, and Regime Resili‐ence in Syria and Iran, 35–60, Standford, California: Stanford University Press.
Economic Intelligence Unit (2008), Country Report Syria ‐ August, London: EIU.
Economic Intelligence Unit (2009a), Country Report Syria ‐ June, London: EIU.
Economic Intelligence Unit (2009b), Country Report Syria ‐ July, London: EIU.
Energy Information Administration (2011), Country Analysis Brief ‐ Syria.
European Union (2012), Council Implementing Regulation, Official Journal of the European Un‐ion, 266.
Fjelde, Hanne (2009) Buying Peace? Oil Wealth, Corruption and Civil War, 1985‒99, in: Journal of Peace Research, 46, 2, 199–218.
Fjelde, Hanne (2010), Generals, Dictators, and Kings Authoritarian Regimes and Civil Conflict, 1973‒2004, in: Conflict Management and Peace Science, 27, 3, 195–218.
Fjelde, Hanne, and Indra De Soysa (2009), Coercion, Co‐optation, or Cooperation? State Ca‐pacity and the Risk of Civil War, 1961—2004, in: Conflict Management and Peace Science, 26, 1, 5–25.
Gandhi, Jennifer, and Adam Przeworski (2007), Authoritarian Institutions and the Survival of Autocrats, in: Comparative Political Studies, 40, 11, 1279–1301.
Gleditsch, Nils Petter, Peter Wallensteen, Mikael Eriksson, Margareta Sollenberg, and Håvard Strand (2002), Armed Conflict 1946‐2001: A New Dataset, in: Journal of Peace Research, 39, 5, 615–637.
Goulden, Robert (2011), Housing, Inequality, and Economic Change in Syria, in: British Journal of Middle Eastern Studies, 38, 2, 187–202.
Gurr, Ted Robert (1993), Why Minorities Rebel: a Global Analysis of Communal Mobilization and Conflict Since 1945, in: International Political Science Review, 14, 2, 161–201.
Haddad, Bassam (2012), Syria’s State Bourgeoisie: An Organic Backbone of the Regime, in: Middle East Critique, 21, 3, 231–257.
Hinnebusch, Raymond (2001), Syria: Revolution from Above, London: Routledge.
Hinnebusch, Raymond (2011), The Baʹth Party in Post‐Baʹthist Syria: President, Party and the Struggle for “Reform”, in: Middle East Critique, 20, 2, 109–125.
Hinnebusch, Raymond (2012), Syria: From Authoritarian Upgrading to Revolution, in: Interna‐tional Affairs, 88, 1, 95–113.
Alexander De Juan and André Bank: Cooptation and the Geographical Distribution of Violence 29
WP 222/2013 GIGA Working Papers
International Crisis Group (2011a), Popular Protest in North Africa and the Middle East (VI): The Syrian People’s Slow Motion Revolution, Middle East/North Africa Report, 108, Brussels: ICG.
International Crisis Group (2011b), Popular Protest in North Africa and the Middle East (VI): The Syrian Regime’s Slow Motion Suicide, Middle East/North Africa Report, 109, Brussels: ICG.
International Crisis Group (2012a), Syria’s Phase of Radicalisation, Middle East Briefing, 33.
International Crisis Group (2012b), Syria’s Mutating Conflict, Middle East/North Africa Report, 128, ICG.
Karaki, Sami, Farid Chaaban, Riad Chedid, Toufic Mezher, Ali Hamzeh, Ahmad Harb, and Fayez Abdulla (2004), Electric Energy Access in Jordan, Lebanon and Syria, Draft Paper Pre‐pared for Energy Access II, Working Group of the Global Network on Energy for Sustainable Development.
Kramon, Eric, and Daniel N. Posner (2010), Who Is Favored? How the Outcomes One Studies Af‐fect the Answers One Gets, Research note prepared for the 30 April‒1 May 2010 meeting of the Working Group in African Political Economy.
Kramon, Eric, and Daniel N. Posner (2012), Ethnic Favoritism in Primary Education in Kenya, unpublished paper.
Jacob, Rahul, and Farhan Bokhari (2012), Pakistan Power Cuts Prompt Violent Protests, Financial Times, July 30, online: <www.ft.com/intl/cms/s/0/4c92fadc‐da22‐11e1‐b03b‐00144feab49a. html#axzz2M1EdTtxw> (13 February 2013).
Leenders, Reinoud, and Steven Heydemann (2012), Popular Mobilization in Syria: Opportunity and Threat, and the Social Networks of the Early Risers, in: Mediterranean Politics, 17, 2, 139–159.
Levi, Margaret (2006), Why We Need a New Theory of Government, in: Perspectives on Politics, 4, 1, 5–19.
Lujala, Päivi, Jan Ketil Rod, and Nadja Thieme (2007), Fighting over Oil: Introducing a New Dataset, in: Conflict Management and Peace Science, 24, 3, 239–256.
Lyme, Rune Friberg (2012), Sanctioning Assad’s Syria ‐ Mapping the Economic, Sociaeconomic and Political Repercussions of the International Sanctions Imposed on Syria Since March 2011, DIIS Report, 13, Copenhagen: Danish Institute for International Studies.
Min, Brian (2009), Distributing Power: Public Service Provision to the Poor in India, Paper presented at the American Political Science Association Meeting in Toronto, Ontario.
Montalvo, Jose G., and Marta Reynal‐Querol (2007), Ethnic Polarization and the Duration of Civil Wars, Post‐Conflict Transitions Working Paper, 6, Washington D.C.: World Bank.
NOAA (2013), Earth Observation Group ‒ Defense Meteorological Satellite Progam, Boulder Ngdc.noaa.gov, online: <www.ngdc.noaa.gov/dmsp/downloadV4composites.html> (16 December 2012).
30 Alexander De Juan and André Bank: Cooptation and the Geographical Distribution of Violence
GIGA Working Papers WP 222/2013
North, Douglas C., John Joseph Wallis, and Barry R. Weingast (2006), A Conceptual Framework for Interpreting Recorded Human History, Working Paper, 75, Mercaturs Center, George Mason University.
Østby, Gudrun (2008), Polarization, Horizontal Inequalities and Violent Civil Conflict, in: Journal of Peace Research, 45, 2, 143–162.
Oxford Business Group (2010), The Report: Syria 2010, Oxford Business Group.
Perthes, Volker (1997), The Political Economy of Syria Under Asad, London: I.B. Tauris.
Perthes, Volker (2004), Syria Under Bashar al‐Asad: Modernisation and the Limits of Change, Adelphi Paper, 366, London: International Institute of Strategic Studies.
Price, Megan, Jeff Klinger, and Patrick Ball (2013), Preliminary Statistical Analysis of Documenta‐tion of Killings in the Syrian Arab Republic, Benetech Human Rights Program.
Raleigh, Clionadh, and Håvard Hegre (2009), Population Size, Concentration, and Civil War. A Geographically Disaggregated Analysis, in: Political Geography, 28, 4,224–238.
Schady, Norbert R (2000), The Political Economy of Expenditures by the Peruvian Social Fund (FONCODES), 1991‒95, in: The American Political Science Review, 94, 2, 289.
Sheng, Yumin (2009), Authoritarian Co‐optation, the Territorial Dimension: Provincial Politi‐cal Representation in Post‐Mao China, in: Studies in Comparative International Development, 44, 1, 71–93.
Taydas, Zeynep, and Dursun Peksen (2012), Can States Buy Peace? Social Welfare Spending and Civil Conflicts, in: Journal of Peace Research, 49, 2, 273–287.
Tür, Özlem (2011), Economic Relations with the Middle East Under the AKP: Trade, Business Community and Reintegration with Neighboring Zones, in: Turkish Studies, 12, 4, 589–612.
Vaishnav, Milan, and Neelanjan Sircar (2009), The Geography of Patronage: Building Schools in India, Paper presented at the Annual Meeting of the Midwest Political Science Associa‐tion, Chicago: IL.
Weinstein, Laura (2011), The Politics of Government Expenditures in Tanzania, 1999–2007, in: African Studies Review, 54, 1, 33–57.
Wickham‐Crowley, Timothy P. (1987), The Rise (and Sometimes Fall) of Guerrilla Govern‐ments in Latin America, in: Sociological Forum, 2, 3, 473–499.
Wintrobe, Ronald (2000), The Political Economy of Dictatorship, Cambridge: Cambridge Univer‐sity Press.
World Bank (2009), Syrian Arab Republic Electricity Sector Strategy Note, Washington, D.C.: World Bank.
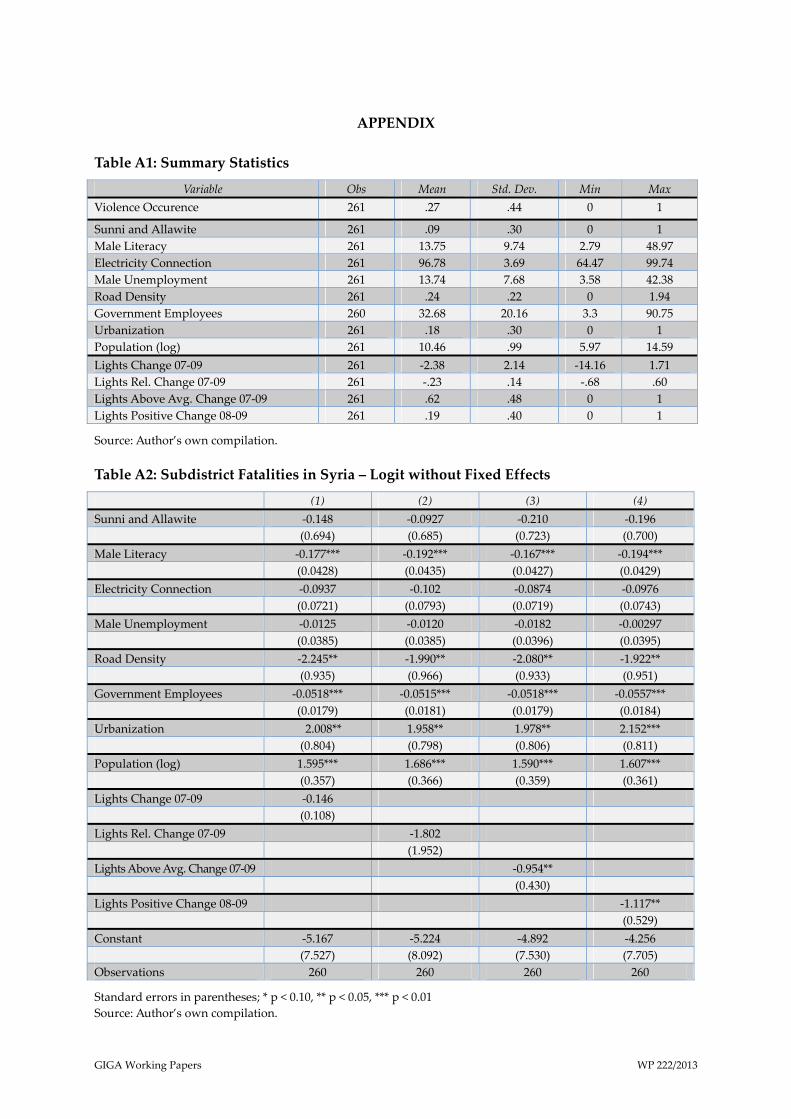
GIGA Working Papers WP 222/2013
APPENDIX
Table A1: Summary Statistics
Variable Obs Mean Std. Dev. Min Max
Violence Occurence 261 .27 .44 0 1
Sunni and Allawite 261 .09 .30 0 1 Male Literacy 261 13.75 9.74 2.79 48.97 Electricity Connection 261 96.78 3.69 64.47 99.74 Male Unemployment 261 13.74 7.68 3.58 42.38 Road Density 261 .24 .22 0 1.94 Government Employees 260 32.68 20.16 3.3 90.75 Urbanization 261 .18 .30 0 1 Population (log) 261 10.46 .99 5.97 14.59 Lights Change 07‐09 261 ‐2.38 2.14 ‐14.16 1.71 Lights Rel. Change 07‐09 261 ‐.23 .14 ‐.68 .60 Lights Above Avg. Change 07‐09 261 .62 .48 0 1 Lights Positive Change 08‐09 261 .19 .40 0 1
Source: Author’s own compilation.
Table A2: Subdistrict Fatalities in Syria ‒ Logit without Fixed Effects
(1) (2) (3) (4)
Sunni and Allawite ‐0.148 ‐0.0927 ‐0.210 ‐0.196 (0.694) (0.685) (0.723) (0.700) Male Literacy ‐0.177*** ‐0.192*** ‐0.167*** ‐0.194*** (0.0428) (0.0435) (0.0427) (0.0429) Electricity Connection ‐0.0937 ‐0.102 ‐0.0874 ‐0.0976 (0.0721) (0.0793) (0.0719) (0.0743) Male Unemployment ‐0.0125 ‐0.0120 ‐0.0182 ‐0.00297 (0.0385) (0.0385) (0.0396) (0.0395) Road Density ‐2.245** ‐1.990** ‐2.080** ‐1.922** (0.935) (0.966) (0.933) (0.951) Government Employees ‐0.0518*** ‐0.0515*** ‐0.0518*** ‐0.0557*** (0.0179) (0.0181) (0.0179) (0.0184) Urbanization 2.008** 1.958** 1.978** 2.152*** (0.804) (0.798) (0.806) (0.811) Population (log) 1.595*** 1.686*** 1.590*** 1.607*** (0.357) (0.366) (0.359) (0.361) Lights Change 07‐09 ‐0.146 (0.108) Lights Rel. Change 07‐09 ‐1.802 (1.952) Lights Above Avg. Change 07‐09 ‐0.954** (0.430) Lights Positive Change 08‐09 ‐1.117** (0.529) Constant ‐5.167 ‐5.224 ‐4.892 ‐4.256 (7.527) (8.092) (7.530) (7.705) Observations 260 260 260 260
Standard errors in parentheses; * p < 0.10, ** p < 0.05, *** p < 0.01 Source: Author’s own compilation.
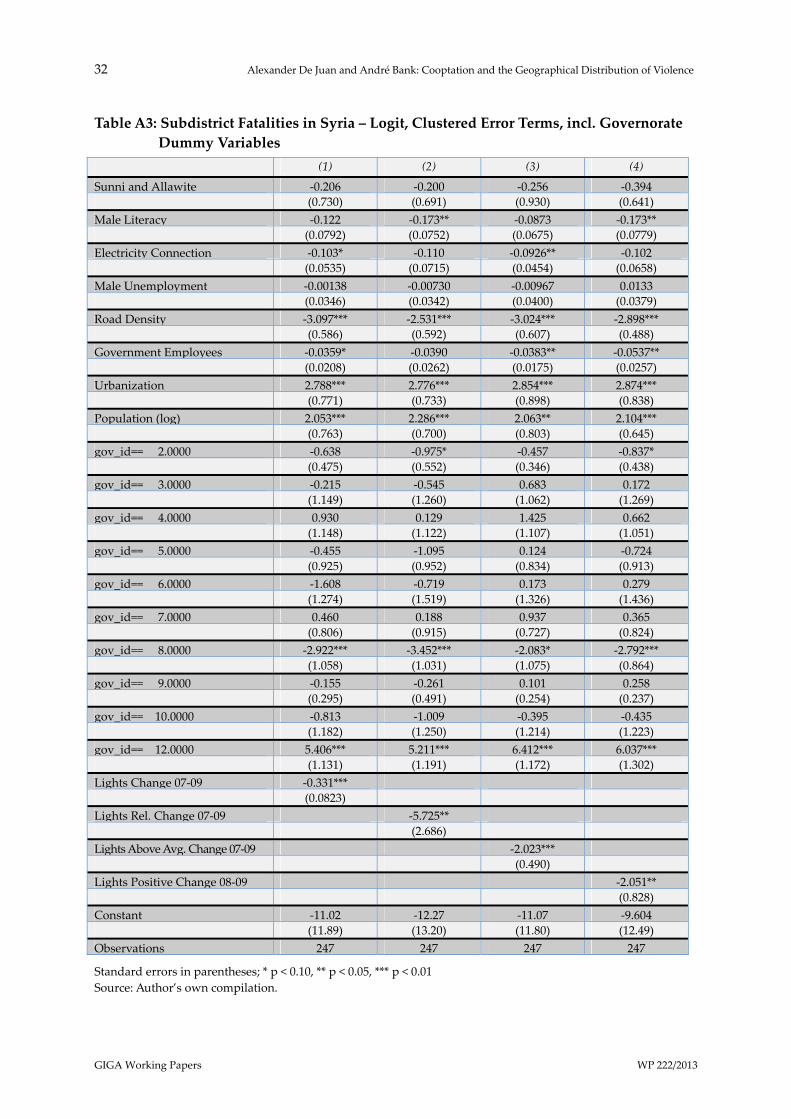
32 Alexander De Juan and André Bank: Cooptation and the Geographical Distribution of Violence
GIGA Working Papers WP 222/2013
Table A3: Subdistrict Fatalities in Syria ‒ Logit, Clustered Error Terms, incl. Governorate
Dummy Variables
(1) (2) (3) (4)
Sunni and Allawite ‐0.206 ‐0.200 ‐0.256 ‐0.394 (0.730) (0.691) (0.930) (0.641)
Male Literacy ‐0.122 ‐0.173** ‐0.0873 ‐0.173** (0.0792) (0.0752) (0.0675) (0.0779)
Electricity Connection ‐0.103* ‐0.110 ‐0.0926** ‐0.102 (0.0535) (0.0715) (0.0454) (0.0658)
Male Unemployment ‐0.00138 ‐0.00730 ‐0.00967 0.0133 (0.0346) (0.0342) (0.0400) (0.0379)
Road Density ‐3.097*** ‐2.531*** ‐3.024*** ‐2.898*** (0.586) (0.592) (0.607) (0.488)
Government Employees ‐0.0359* ‐0.0390 ‐0.0383** ‐0.0537** (0.0208) (0.0262) (0.0175) (0.0257)
Urbanization 2.788*** 2.776*** 2.854*** 2.874*** (0.771) (0.733) (0.898) (0.838)
Population (log) 2.053*** 2.286*** 2.063** 2.104***
(0.763) (0.700) (0.803) (0.645)
gov_id== 2.0000 ‐0.638 ‐0.975* ‐0.457 ‐0.837* (0.475) (0.552) (0.346) (0.438)
gov_id== 3.0000 ‐0.215 ‐0.545 0.683 0.172 (1.149) (1.260) (1.062) (1.269)
gov_id== 4.0000 0.930 0.129 1.425 0.662 (1.148) (1.122) (1.107) (1.051)
gov_id== 5.0000 ‐0.455 ‐1.095 0.124 ‐0.724 (0.925) (0.952) (0.834) (0.913)
gov_id== 6.0000 ‐1.608 ‐0.719 0.173 0.279 (1.274) (1.519) (1.326) (1.436)
gov_id== 7.0000 0.460 0.188 0.937 0.365 (0.806) (0.915) (0.727) (0.824)
gov_id== 8.0000 ‐2.922*** ‐3.452*** ‐2.083* ‐2.792*** (1.058) (1.031) (1.075) (0.864)
gov_id== 9.0000 ‐0.155 ‐0.261 0.101 0.258 (0.295) (0.491) (0.254) (0.237)
gov_id== 10.0000 ‐0.813 ‐1.009 ‐0.395 ‐0.435 (1.182) (1.250) (1.214) (1.223)
gov_id== 12.0000 5.406*** 5.211*** 6.412*** 6.037***
(1.131) (1.191) (1.172) (1.302)
Lights Change 07‐09 ‐0.331*** (0.0823) Lights Rel. Change 07‐09 ‐5.725** (2.686) Lights Above Avg. Change 07‐09 ‐2.023*** (0.490) Lights Positive Change 08‐09 ‐2.051** (0.828)
Constant ‐11.02 ‐12.27 ‐11.07 ‐9.604 (11.89) (13.20) (11.80) (12.49)
Observations 247 247 247 247
Standard errors in parentheses; * p < 0.10, ** p < 0.05, *** p < 0.01 Source: Author’s own compilation.
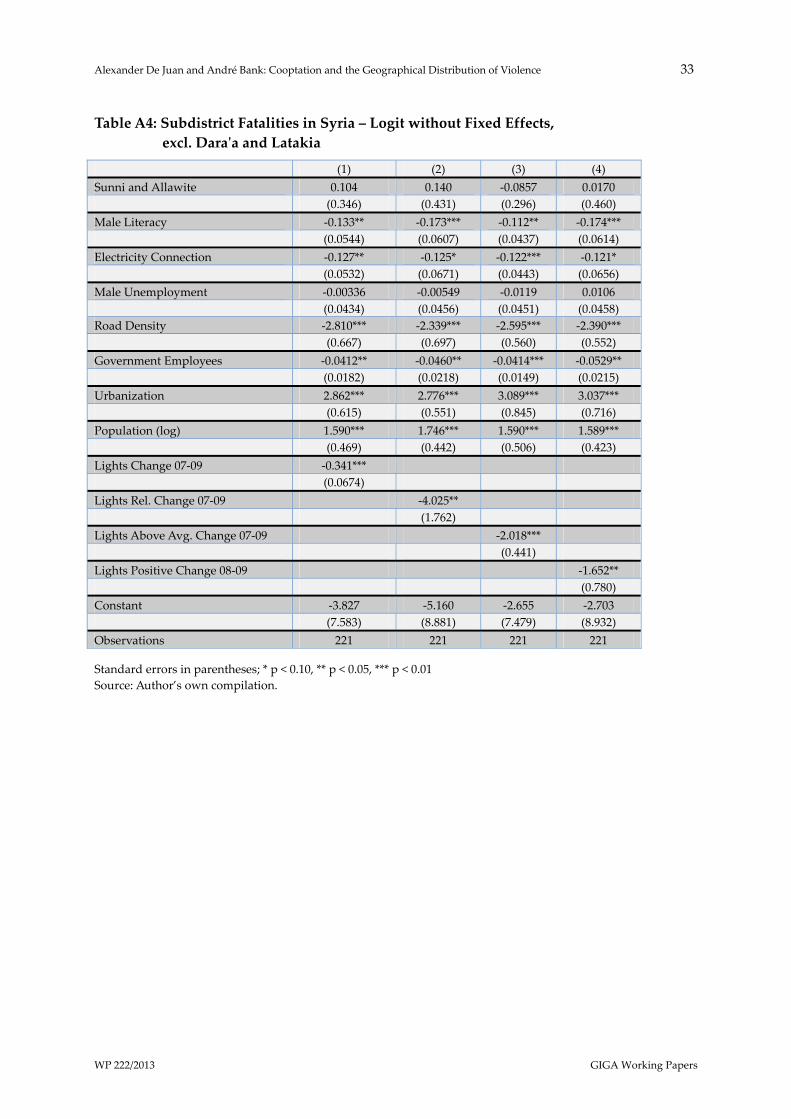
Alexander De Juan and André Bank: Cooptation and the Geographical Distribution of Violence 33
WP 222/2013 GIGA Working Papers
Table A4: Subdistrict Fatalities in Syria ‒ Logit without Fixed Effects,
excl. Daraʹa and Latakia
(1) (2) (3) (4) Sunni and Allawite 0.104 0.140 ‐0.0857 0.0170 (0.346) (0.431) (0.296) (0.460) Male Literacy ‐0.133** ‐0.173*** ‐0.112** ‐0.174*** (0.0544) (0.0607) (0.0437) (0.0614) Electricity Connection ‐0.127** ‐0.125* ‐0.122*** ‐0.121* (0.0532) (0.0671) (0.0443) (0.0656) Male Unemployment ‐0.00336 ‐0.00549 ‐0.0119 0.0106 (0.0434) (0.0456) (0.0451) (0.0458) Road Density ‐2.810*** ‐2.339*** ‐2.595*** ‐2.390*** (0.667) (0.697) (0.560) (0.552) Government Employees ‐0.0412** ‐0.0460** ‐0.0414*** ‐0.0529** (0.0182) (0.0218) (0.0149) (0.0215) Urbanization 2.862*** 2.776*** 3.089*** 3.037*** (0.615) (0.551) (0.845) (0.716) Population (log) 1.590*** 1.746*** 1.590*** 1.589*** (0.469) (0.442) (0.506) (0.423) Lights Change 07‐09 ‐0.341*** (0.0674) Lights Rel. Change 07‐09 ‐4.025** (1.762) Lights Above Avg. Change 07‐09 ‐2.018*** (0.441) Lights Positive Change 08‐09 ‐1.652** (0.780) Constant ‐3.827 ‐5.160 ‐2.655 ‐2.703 (7.583) (8.881) (7.479) (8.932) Observations 221 221 221 221
Standard errors in parentheses; * p < 0.10, ** p < 0.05, *** p < 0.01 Source: Author’s own compilation.
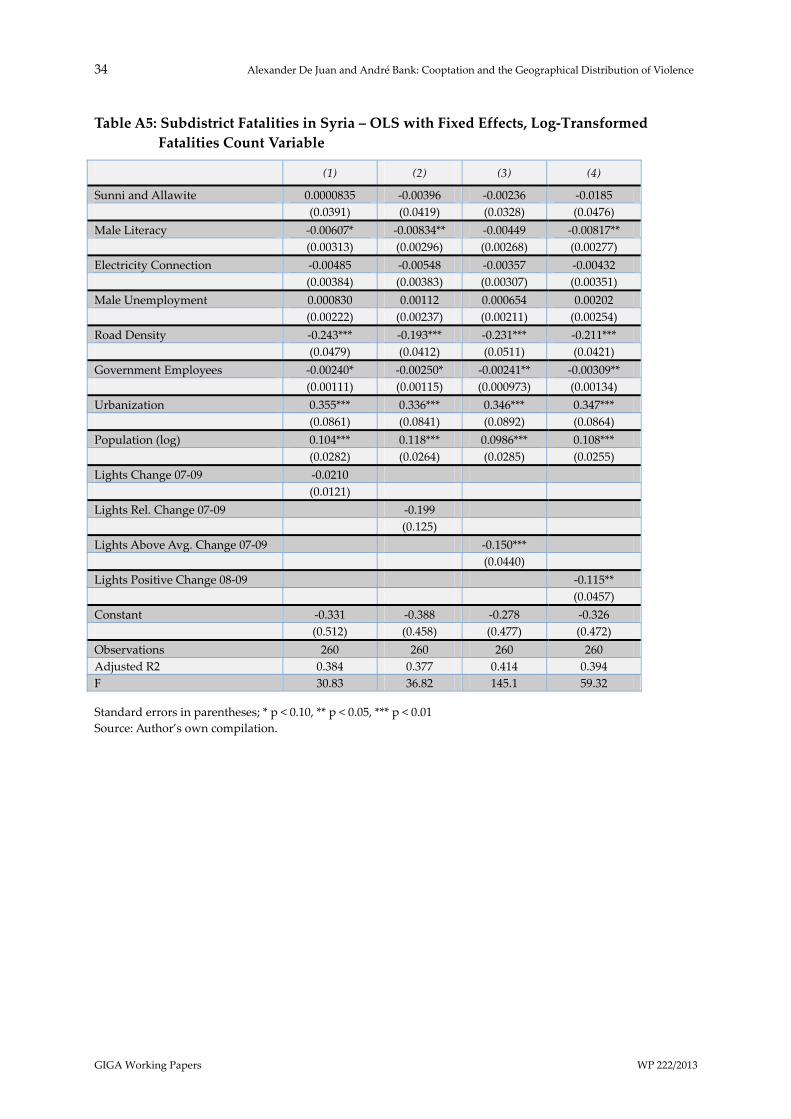
34 Alexander De Juan and André Bank: Cooptation and the Geographical Distribution of Violence
GIGA Working Papers WP 222/2013
Table A5: Subdistrict Fatalities in Syria ‒ OLS with Fixed Effects, Log‐Transformed
Fatalities Count Variable
(1) (2) (3) (4)
Sunni and Allawite 0.0000835 ‐0.00396 ‐0.00236 ‐0.0185 (0.0391) (0.0419) (0.0328) (0.0476) Male Literacy ‐0.00607* ‐0.00834** ‐0.00449 ‐0.00817** (0.00313) (0.00296) (0.00268) (0.00277) Electricity Connection ‐0.00485 ‐0.00548 ‐0.00357 ‐0.00432 (0.00384) (0.00383) (0.00307) (0.00351) Male Unemployment 0.000830 0.00112 0.000654 0.00202 (0.00222) (0.00237) (0.00211) (0.00254) Road Density ‐0.243*** ‐0.193*** ‐0.231*** ‐0.211*** (0.0479) (0.0412) (0.0511) (0.0421) Government Employees ‐0.00240* ‐0.00250* ‐0.00241** ‐0.00309** (0.00111) (0.00115) (0.000973) (0.00134) Urbanization 0.355*** 0.336*** 0.346*** 0.347*** (0.0861) (0.0841) (0.0892) (0.0864) Population (log) 0.104*** 0.118*** 0.0986*** 0.108*** (0.0282) (0.0264) (0.0285) (0.0255) Lights Change 07‐09 ‐0.0210 (0.0121) Lights Rel. Change 07‐09 ‐0.199 (0.125) Lights Above Avg. Change 07‐09 ‐0.150*** (0.0440) Lights Positive Change 08‐09 ‐0.115** (0.0457) Constant ‐0.331 ‐0.388 ‐0.278 ‐0.326 (0.512) (0.458) (0.477) (0.472) Observations 260 260 260 260 Adjusted R2 0.384 0.377 0.414 0.394 F 30.83 36.82 145.1 59.32
Standard errors in parentheses; * p < 0.10, ** p < 0.05, *** p < 0.01 Source: Author’s own compilation.
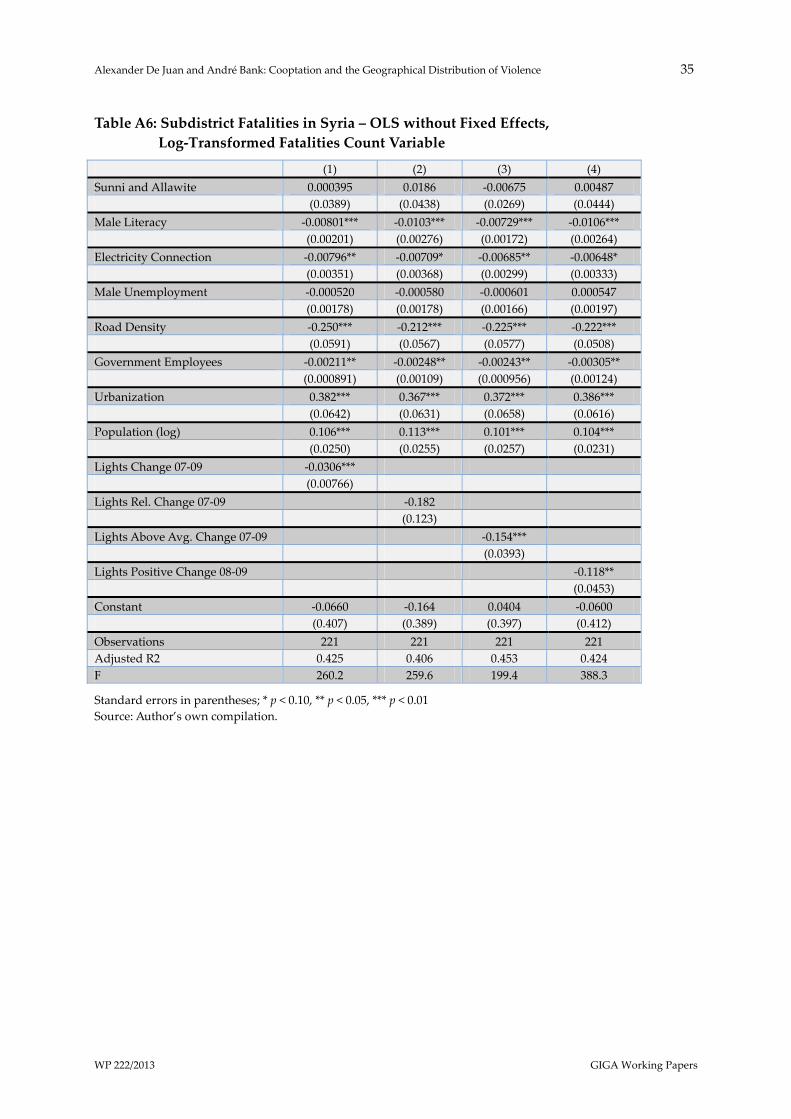
Alexander De Juan and André Bank: Cooptation and the Geographical Distribution of Violence 35
WP 222/2013 GIGA Working Papers
Table A6: Subdistrict Fatalities in Syria ‒ OLS without Fixed Effects,
Log‐Transformed Fatalities Count Variable
(1) (2) (3) (4) Sunni and Allawite 0.000395 0.0186 ‐0.00675 0.00487 (0.0389) (0.0438) (0.0269) (0.0444) Male Literacy ‐0.00801*** ‐0.0103*** ‐0.00729*** ‐0.0106*** (0.00201) (0.00276) (0.00172) (0.00264) Electricity Connection ‐0.00796** ‐0.00709* ‐0.00685** ‐0.00648* (0.00351) (0.00368) (0.00299) (0.00333) Male Unemployment ‐0.000520 ‐0.000580 ‐0.000601 0.000547 (0.00178) (0.00178) (0.00166) (0.00197) Road Density ‐0.250*** ‐0.212*** ‐0.225*** ‐0.222*** (0.0591) (0.0567) (0.0577) (0.0508) Government Employees ‐0.00211** ‐0.00248** ‐0.00243** ‐0.00305** (0.000891) (0.00109) (0.000956) (0.00124) Urbanization 0.382*** 0.367*** 0.372*** 0.386*** (0.0642) (0.0631) (0.0658) (0.0616) Population (log) 0.106*** 0.113*** 0.101*** 0.104*** (0.0250) (0.0255) (0.0257) (0.0231) Lights Change 07‐09 ‐0.0306*** (0.00766) Lights Rel. Change 07‐09 ‐0.182 (0.123) Lights Above Avg. Change 07‐09 ‐0.154*** (0.0393) Lights Positive Change 08‐09 ‐0.118** (0.0453) Constant ‐0.0660 ‐0.164 0.0404 ‐0.0600 (0.407) (0.389) (0.397) (0.412) Observations 221 221 221 221 Adjusted R2 0.425 0.406 0.453 0.424 F 260.2 259.6 199.4 388.3
Standard errors in parentheses; * p < 0.10, ** p < 0.05, *** p < 0.01 Source: Author’s own compilation.
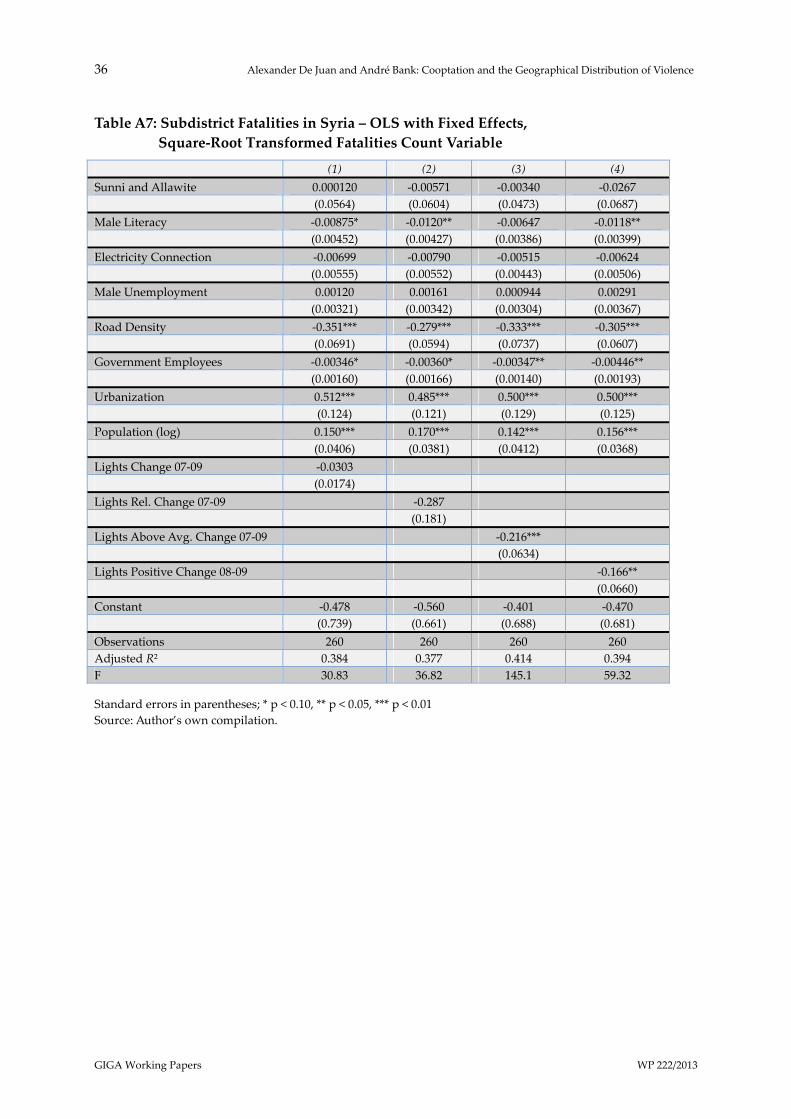
36 Alexander De Juan and André Bank: Cooptation and the Geographical Distribution of Violence
GIGA Working Papers WP 222/2013
Table A7: Subdistrict Fatalities in Syria ‒ OLS with Fixed Effects,
Square‐Root Transformed Fatalities Count Variable
(1) (2) (3) (4)
Sunni and Allawite 0.000120 ‐0.00571 ‐0.00340 ‐0.0267 (0.0564) (0.0604) (0.0473) (0.0687) Male Literacy ‐0.00875* ‐0.0120** ‐0.00647 ‐0.0118** (0.00452) (0.00427) (0.00386) (0.00399) Electricity Connection ‐0.00699 ‐0.00790 ‐0.00515 ‐0.00624 (0.00555) (0.00552) (0.00443) (0.00506) Male Unemployment 0.00120 0.00161 0.000944 0.00291 (0.00321) (0.00342) (0.00304) (0.00367) Road Density ‐0.351*** ‐0.279*** ‐0.333*** ‐0.305*** (0.0691) (0.0594) (0.0737) (0.0607) Government Employees ‐0.00346* ‐0.00360* ‐0.00347** ‐0.00446** (0.00160) (0.00166) (0.00140) (0.00193) Urbanization 0.512*** 0.485*** 0.500*** 0.500*** (0.124) (0.121) (0.129) (0.125) Population (log) 0.150*** 0.170*** 0.142*** 0.156*** (0.0406) (0.0381) (0.0412) (0.0368) Lights Change 07‐09 ‐0.0303 (0.0174) Lights Rel. Change 07‐09 ‐0.287 (0.181) Lights Above Avg. Change 07‐09 ‐0.216*** (0.0634) Lights Positive Change 08‐09 ‐0.166** (0.0660) Constant ‐0.478 ‐0.560 ‐0.401 ‐0.470 (0.739) (0.661) (0.688) (0.681) Observations 260 260 260 260 Adjusted R2 0.384 0.377 0.414 0.394 F 30.83 36.82 145.1 59.32
Standard errors in parentheses; * p < 0.10, ** p < 0.05, *** p < 0.01 Source: Author’s own compilation.
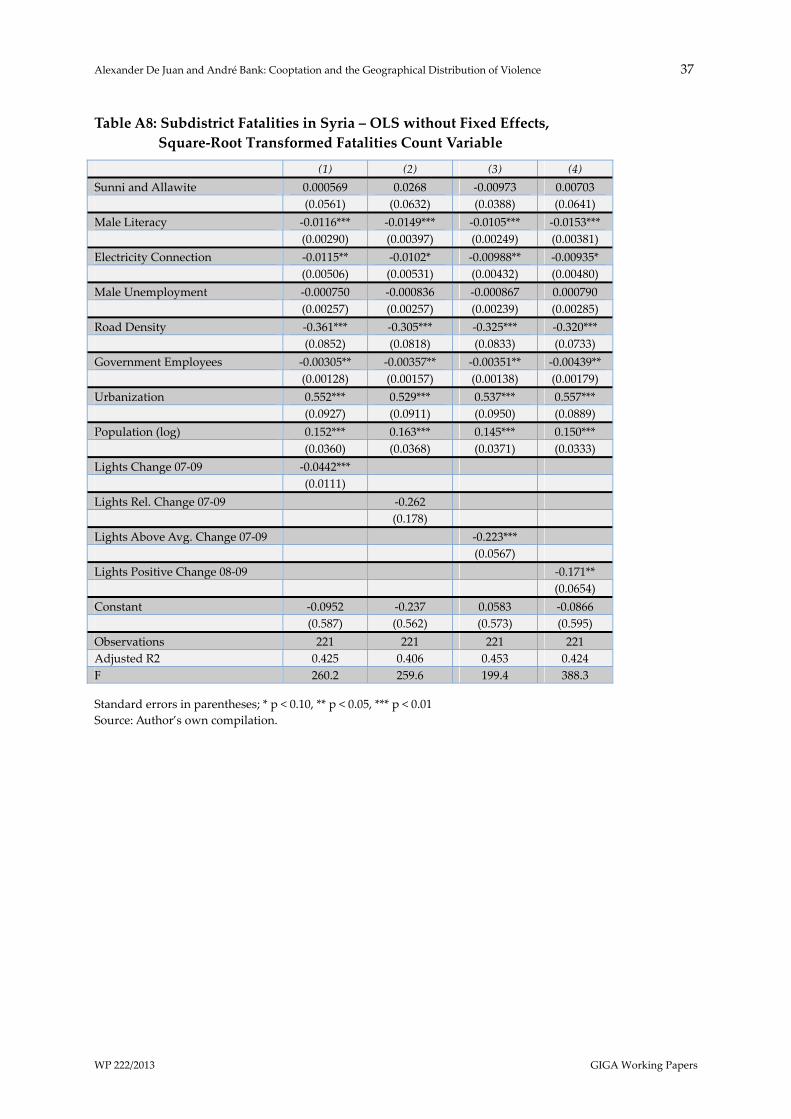
Alexander De Juan and André Bank: Cooptation and the Geographical Distribution of Violence 37
WP 222/2013 GIGA Working Papers
Table A8: Subdistrict Fatalities in Syria ‒ OLS without Fixed Effects,
Square‐Root Transformed Fatalities Count Variable
(1) (2) (3) (4)
Sunni and Allawite 0.000569 0.0268 ‐0.00973 0.00703 (0.0561) (0.0632) (0.0388) (0.0641) Male Literacy ‐0.0116*** ‐0.0149*** ‐0.0105*** ‐0.0153*** (0.00290) (0.00397) (0.00249) (0.00381) Electricity Connection ‐0.0115** ‐0.0102* ‐0.00988** ‐0.00935* (0.00506) (0.00531) (0.00432) (0.00480) Male Unemployment ‐0.000750 ‐0.000836 ‐0.000867 0.000790 (0.00257) (0.00257) (0.00239) (0.00285) Road Density ‐0.361*** ‐0.305*** ‐0.325*** ‐0.320*** (0.0852) (0.0818) (0.0833) (0.0733) Government Employees ‐0.00305** ‐0.00357** ‐0.00351** ‐0.00439** (0.00128) (0.00157) (0.00138) (0.00179) Urbanization 0.552*** 0.529*** 0.537*** 0.557*** (0.0927) (0.0911) (0.0950) (0.0889) Population (log) 0.152*** 0.163*** 0.145*** 0.150*** (0.0360) (0.0368) (0.0371) (0.0333) Lights Change 07‐09 ‐0.0442*** (0.0111) Lights Rel. Change 07‐09 ‐0.262 (0.178) Lights Above Avg. Change 07‐09 ‐0.223*** (0.0567) Lights Positive Change 08‐09 ‐0.171** (0.0654) Constant ‐0.0952 ‐0.237 0.0583 ‐0.0866 (0.587) (0.562) (0.573) (0.595) Observations 221 221 221 221 Adjusted R2 0.425 0.406 0.453 0.424 F 260.2 259.6 199.4 388.3
Standard errors in parentheses; * p < 0.10, ** p < 0.05, *** p < 0.01 Source: Author’s own compilation.
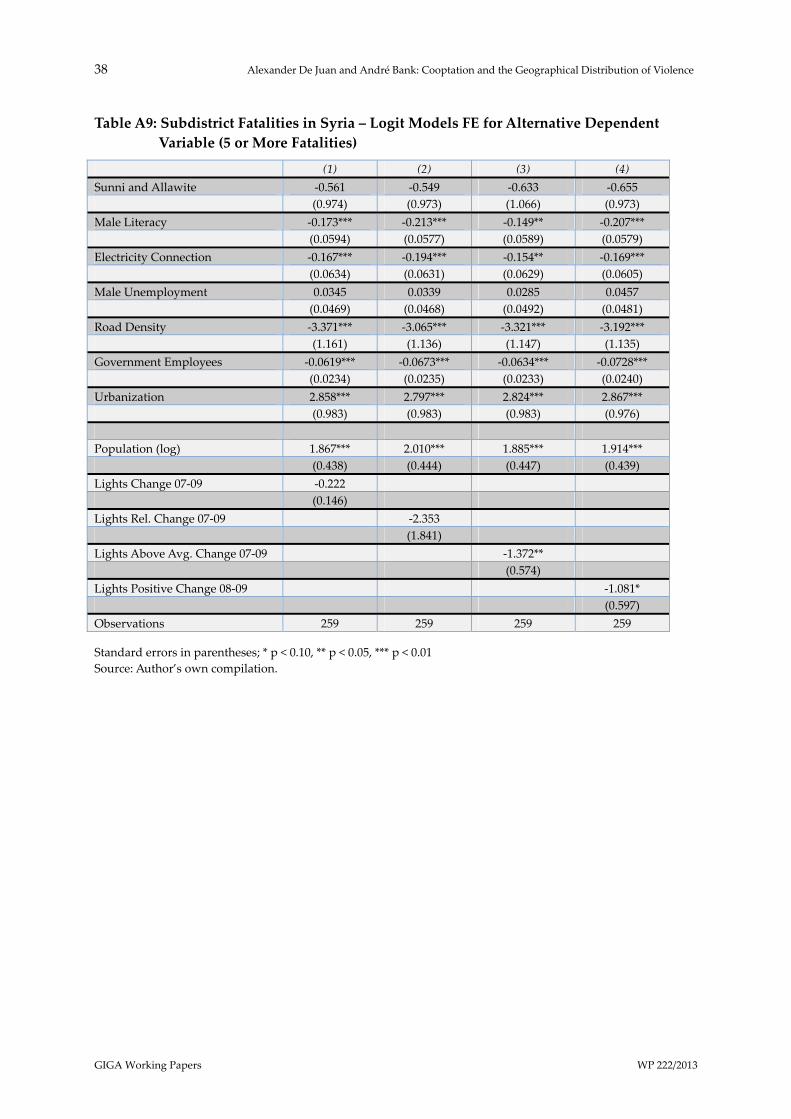
38 Alexander De Juan and André Bank: Cooptation and the Geographical Distribution of Violence
GIGA Working Papers WP 222/2013
Table A9: Subdistrict Fatalities in Syria ‒ Logit Models FE for Alternative Dependent
Variable (5 or More Fatalities)
(1) (2) (3) (4)
Sunni and Allawite ‐0.561 ‐0.549 ‐0.633 ‐0.655 (0.974) (0.973) (1.066) (0.973) Male Literacy ‐0.173*** ‐0.213*** ‐0.149** ‐0.207*** (0.0594) (0.0577) (0.0589) (0.0579) Electricity Connection ‐0.167*** ‐0.194*** ‐0.154** ‐0.169*** (0.0634) (0.0631) (0.0629) (0.0605) Male Unemployment 0.0345 0.0339 0.0285 0.0457 (0.0469) (0.0468) (0.0492) (0.0481) Road Density ‐3.371*** ‐3.065*** ‐3.321*** ‐3.192*** (1.161) (1.136) (1.147) (1.135) Government Employees ‐0.0619*** ‐0.0673*** ‐0.0634*** ‐0.0728*** (0.0234) (0.0235) (0.0233) (0.0240) Urbanization 2.858*** 2.797*** 2.824*** 2.867*** (0.983) (0.983) (0.983) (0.976) Population (log) 1.867*** 2.010*** 1.885*** 1.914*** (0.438) (0.444) (0.447) (0.439) Lights Change 07‐09 ‐0.222 (0.146) Lights Rel. Change 07‐09 ‐2.353 (1.841) Lights Above Avg. Change 07‐09 ‐1.372** (0.574) Lights Positive Change 08‐09 ‐1.081* (0.597) Observations 259 259 259 259
Standard errors in parentheses; * p < 0.10, ** p < 0.05, *** p < 0.01 Source: Author’s own compilation.
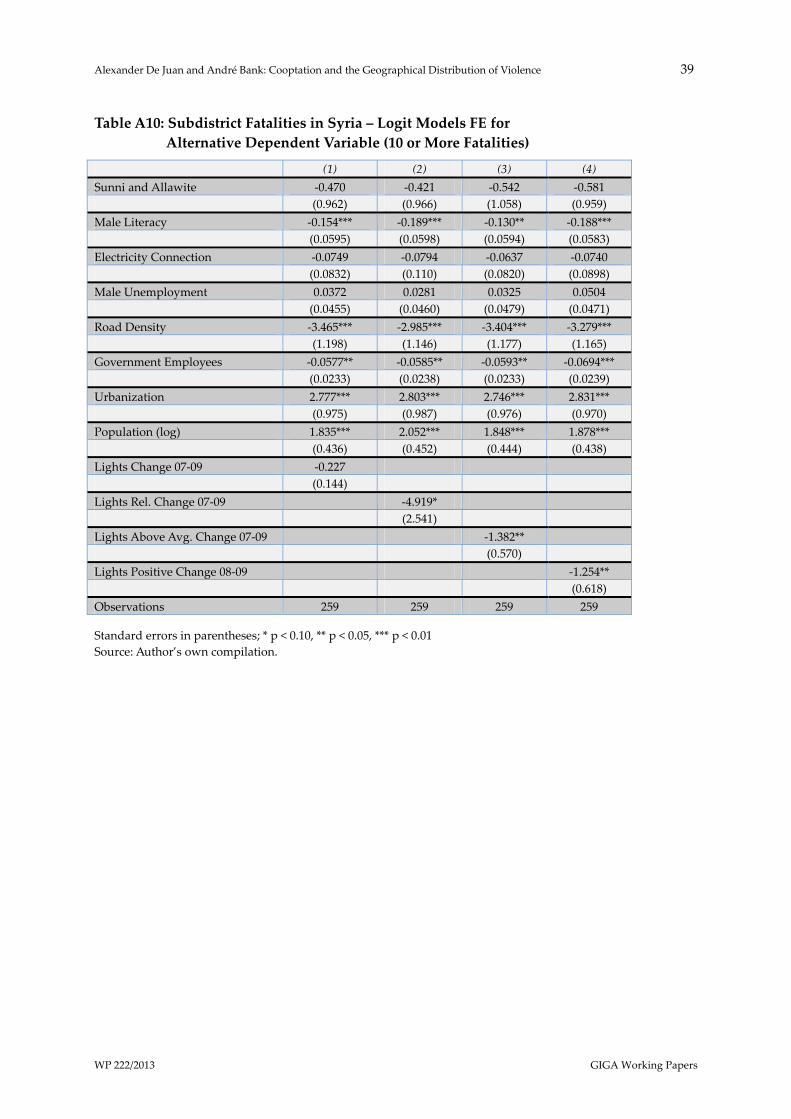
Alexander De Juan and André Bank: Cooptation and the Geographical Distribution of Violence 39
WP 222/2013 GIGA Working Papers
Table A10: Subdistrict Fatalities in Syria ‒ Logit Models FE for
Alternative Dependent Variable (10 or More Fatalities)
(1) (2) (3) (4)
Sunni and Allawite ‐0.470 ‐0.421 ‐0.542 ‐0.581 (0.962) (0.966) (1.058) (0.959) Male Literacy ‐0.154*** ‐0.189*** ‐0.130** ‐0.188*** (0.0595) (0.0598) (0.0594) (0.0583) Electricity Connection ‐0.0749 ‐0.0794 ‐0.0637 ‐0.0740 (0.0832) (0.110) (0.0820) (0.0898) Male Unemployment 0.0372 0.0281 0.0325 0.0504 (0.0455) (0.0460) (0.0479) (0.0471) Road Density ‐3.465*** ‐2.985*** ‐3.404*** ‐3.279*** (1.198) (1.146) (1.177) (1.165) Government Employees ‐0.0577** ‐0.0585** ‐0.0593** ‐0.0694*** (0.0233) (0.0238) (0.0233) (0.0239) Urbanization 2.777*** 2.803*** 2.746*** 2.831*** (0.975) (0.987) (0.976) (0.970) Population (log) 1.835*** 2.052*** 1.848*** 1.878*** (0.436) (0.452) (0.444) (0.438) Lights Change 07‐09 ‐0.227 (0.144) Lights Rel. Change 07‐09 ‐4.919* (2.541) Lights Above Avg. Change 07‐09 ‐1.382** (0.570) Lights Positive Change 08‐09 ‐1.254** (0.618) Observations 259 259 259 259
Standard errors in parentheses; * p < 0.10, ** p < 0.05, *** p < 0.01 Source: Author’s own compilation.
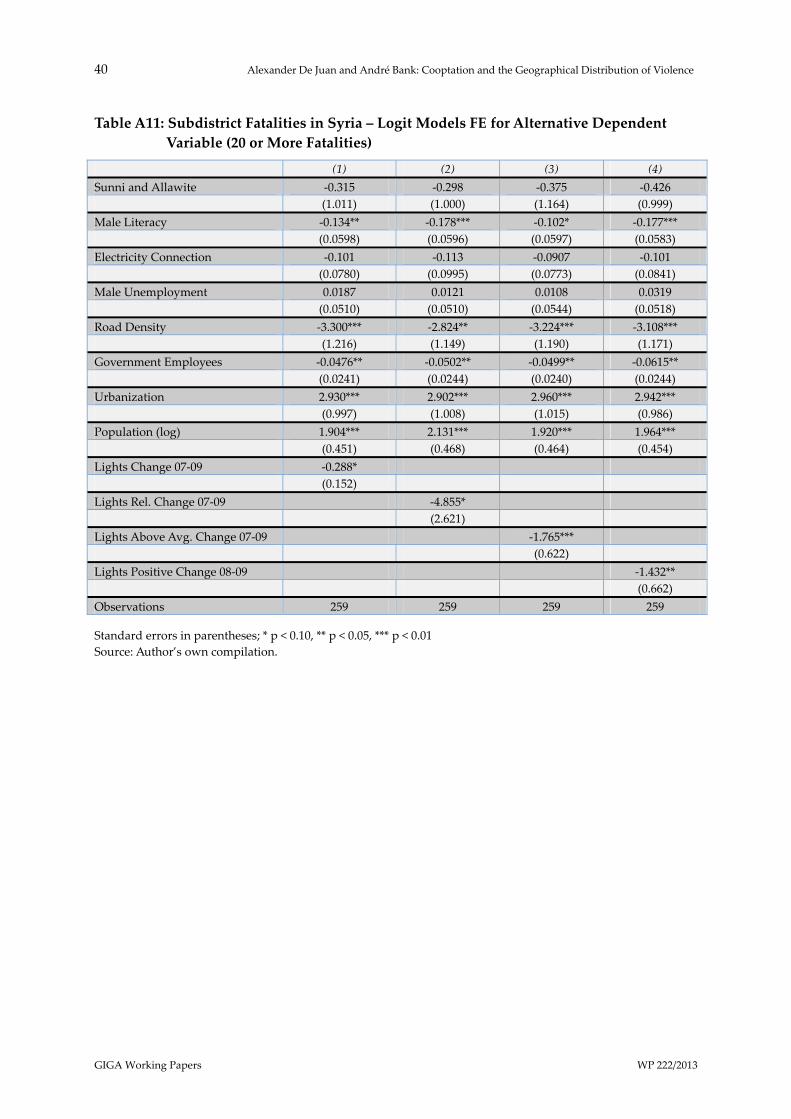
40 Alexander De Juan and André Bank: Cooptation and the Geographical Distribution of Violence
GIGA Working Papers WP 222/2013
Table A11: Subdistrict Fatalities in Syria ‒ Logit Models FE for Alternative Dependent
Variable (20 or More Fatalities)
(1) (2) (3) (4)
Sunni and Allawite ‐0.315 ‐0.298 ‐0.375 ‐0.426 (1.011) (1.000) (1.164) (0.999) Male Literacy ‐0.134** ‐0.178*** ‐0.102* ‐0.177*** (0.0598) (0.0596) (0.0597) (0.0583) Electricity Connection ‐0.101 ‐0.113 ‐0.0907 ‐0.101 (0.0780) (0.0995) (0.0773) (0.0841) Male Unemployment 0.0187 0.0121 0.0108 0.0319 (0.0510) (0.0510) (0.0544) (0.0518) Road Density ‐3.300*** ‐2.824** ‐3.224*** ‐3.108*** (1.216) (1.149) (1.190) (1.171) Government Employees ‐0.0476** ‐0.0502** ‐0.0499** ‐0.0615** (0.0241) (0.0244) (0.0240) (0.0244) Urbanization 2.930*** 2.902*** 2.960*** 2.942*** (0.997) (1.008) (1.015) (0.986) Population (log) 1.904*** 2.131*** 1.920*** 1.964*** (0.451) (0.468) (0.464) (0.454) Lights Change 07‐09 ‐0.288* (0.152) Lights Rel. Change 07‐09 ‐4.855* (2.621) Lights Above Avg. Change 07‐09 ‐1.765*** (0.622) Lights Positive Change 08‐09 ‐1.432** (0.662) Observations 259 259 259 259
Standard errors in parentheses; * p < 0.10, ** p < 0.05, *** p < 0.01 Source: Author’s own compilation.
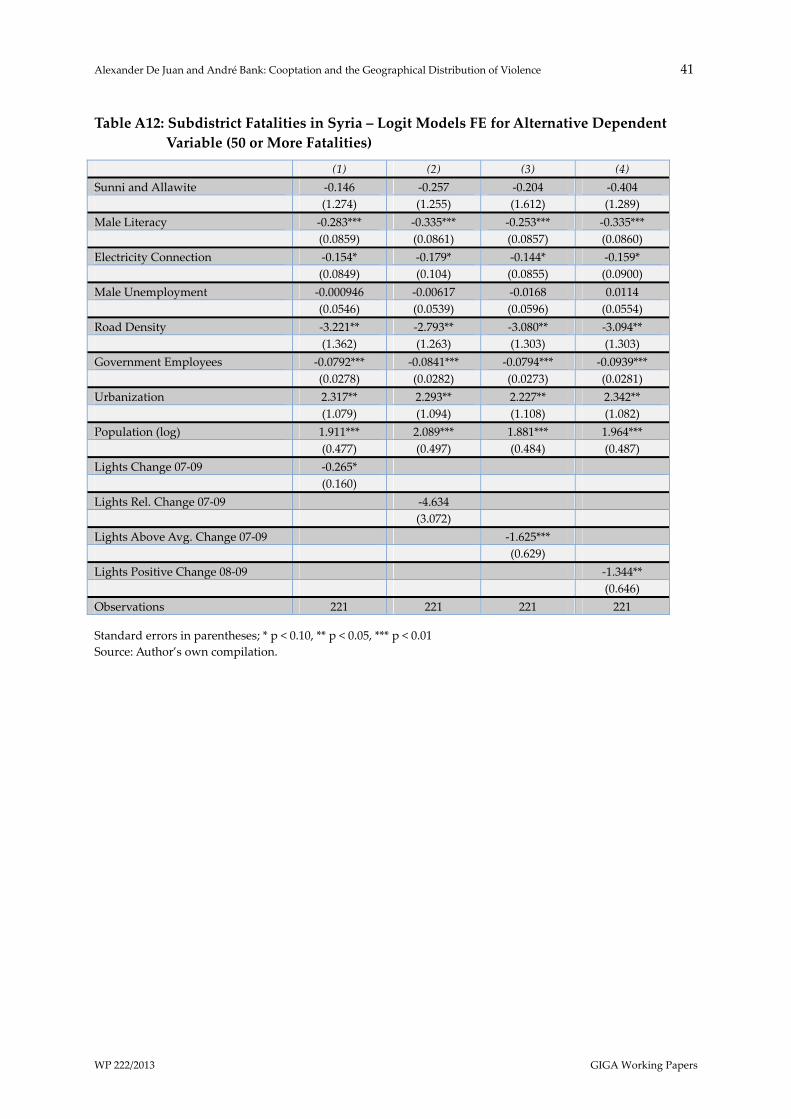
Alexander De Juan and André Bank: Cooptation and the Geographical Distribution of Violence 41
WP 222/2013 GIGA Working Papers
Table A12: Subdistrict Fatalities in Syria ‒ Logit Models FE for Alternative Dependent
Variable (50 or More Fatalities)
(1) (2) (3) (4)
Sunni and Allawite ‐0.146 ‐0.257 ‐0.204 ‐0.404 (1.274) (1.255) (1.612) (1.289) Male Literacy ‐0.283*** ‐0.335*** ‐0.253*** ‐0.335*** (0.0859) (0.0861) (0.0857) (0.0860) Electricity Connection ‐0.154* ‐0.179* ‐0.144* ‐0.159* (0.0849) (0.104) (0.0855) (0.0900) Male Unemployment ‐0.000946 ‐0.00617 ‐0.0168 0.0114 (0.0546) (0.0539) (0.0596) (0.0554) Road Density ‐3.221** ‐2.793** ‐3.080** ‐3.094** (1.362) (1.263) (1.303) (1.303) Government Employees ‐0.0792*** ‐0.0841*** ‐0.0794*** ‐0.0939*** (0.0278) (0.0282) (0.0273) (0.0281) Urbanization 2.317** 2.293** 2.227** 2.342** (1.079) (1.094) (1.108) (1.082) Population (log) 1.911*** 2.089*** 1.881*** 1.964*** (0.477) (0.497) (0.484) (0.487) Lights Change 07‐09 ‐0.265* (0.160) Lights Rel. Change 07‐09 ‐4.634 (3.072) Lights Above Avg. Change 07‐09 ‐1.625*** (0.629) Lights Positive Change 08‐09 ‐1.344** (0.646) Observations 221 221 221 221
Standard errors in parentheses; * p < 0.10, ** p < 0.05, *** p < 0.01 Source: Author’s own compilation.
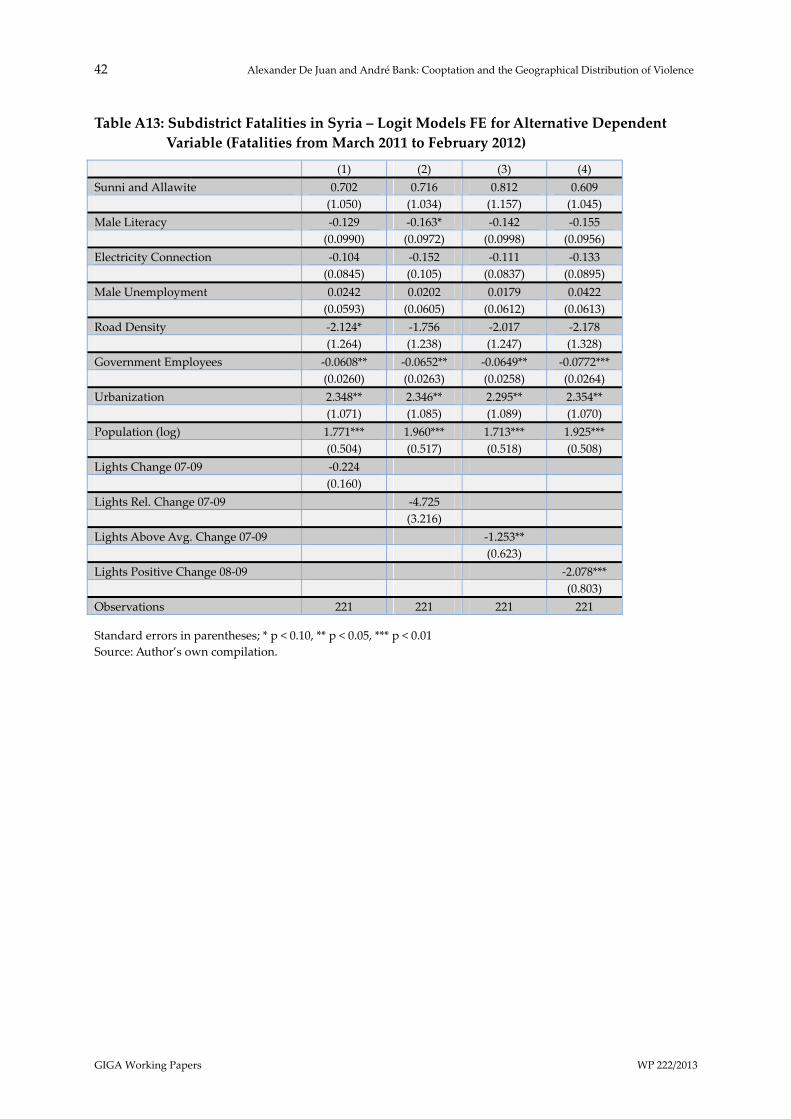
42 Alexander De Juan and André Bank: Cooptation and the Geographical Distribution of Violence
GIGA Working Papers WP 222/2013
Table A13: Subdistrict Fatalities in Syria ‒ Logit Models FE for Alternative Dependent
Variable (Fatalities from March 2011 to February 2012)
(1) (2) (3) (4) Sunni and Allawite 0.702 0.716 0.812 0.609 (1.050) (1.034) (1.157) (1.045) Male Literacy ‐0.129 ‐0.163* ‐0.142 ‐0.155 (0.0990) (0.0972) (0.0998) (0.0956) Electricity Connection ‐0.104 ‐0.152 ‐0.111 ‐0.133 (0.0845) (0.105) (0.0837) (0.0895) Male Unemployment 0.0242 0.0202 0.0179 0.0422 (0.0593) (0.0605) (0.0612) (0.0613) Road Density ‐2.124* ‐1.756 ‐2.017 ‐2.178 (1.264) (1.238) (1.247) (1.328) Government Employees ‐0.0608** ‐0.0652** ‐0.0649** ‐0.0772*** (0.0260) (0.0263) (0.0258) (0.0264) Urbanization 2.348** 2.346** 2.295** 2.354** (1.071) (1.085) (1.089) (1.070) Population (log) 1.771*** 1.960*** 1.713*** 1.925*** (0.504) (0.517) (0.518) (0.508) Lights Change 07‐09 ‐0.224 (0.160) Lights Rel. Change 07‐09 ‐4.725 (3.216) Lights Above Avg. Change 07‐09 ‐1.253** (0.623) Lights Positive Change 08‐09 ‐2.078*** (0.803) Observations 221 221 221 221
Standard errors in parentheses; * p < 0.10, ** p < 0.05, *** p < 0.01 Source: Author’s own compilation.
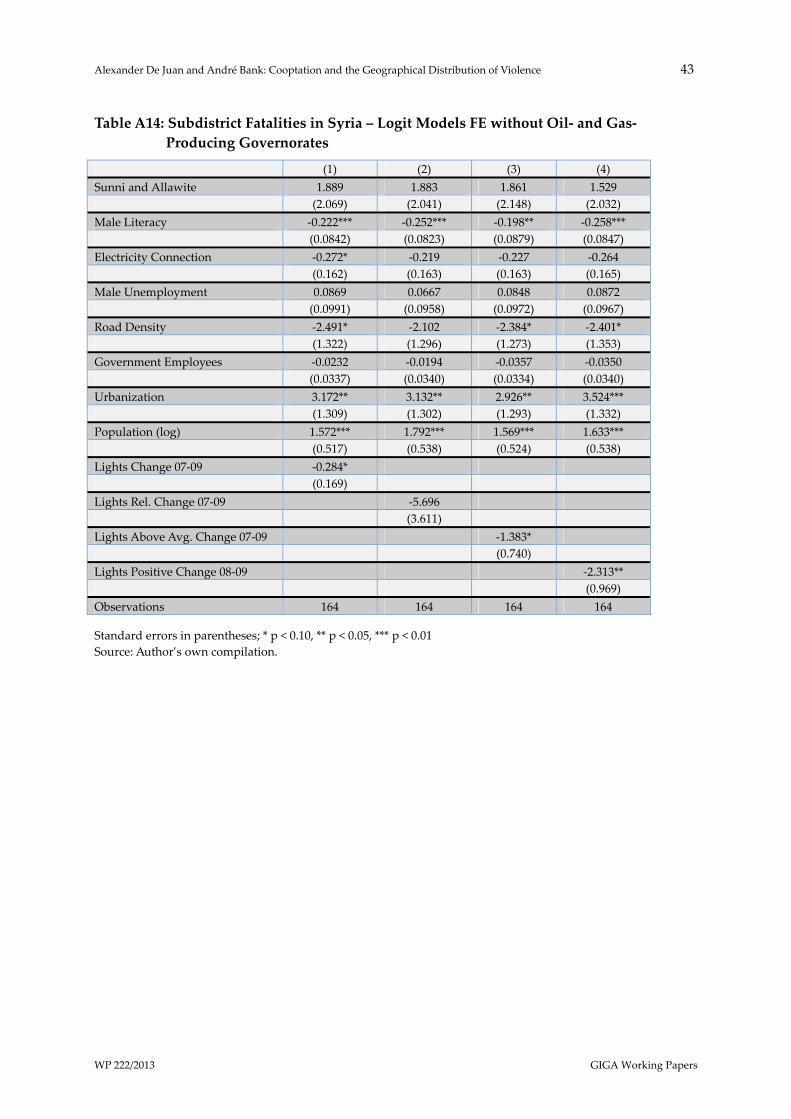
Alexander De Juan and André Bank: Cooptation and the Geographical Distribution of Violence 43
WP 222/2013 GIGA Working Papers
Table A14: Subdistrict Fatalities in Syria ‒ Logit Models FE without Oil‐ and Gas‐
Producing Governorates
(1) (2) (3) (4) Sunni and Allawite 1.889 1.883 1.861 1.529 (2.069) (2.041) (2.148) (2.032) Male Literacy ‐0.222*** ‐0.252*** ‐0.198** ‐0.258*** (0.0842) (0.0823) (0.0879) (0.0847) Electricity Connection ‐0.272* ‐0.219 ‐0.227 ‐0.264 (0.162) (0.163) (0.163) (0.165) Male Unemployment 0.0869 0.0667 0.0848 0.0872 (0.0991) (0.0958) (0.0972) (0.0967) Road Density ‐2.491* ‐2.102 ‐2.384* ‐2.401* (1.322) (1.296) (1.273) (1.353) Government Employees ‐0.0232 ‐0.0194 ‐0.0357 ‐0.0350 (0.0337) (0.0340) (0.0334) (0.0340) Urbanization 3.172** 3.132** 2.926** 3.524*** (1.309) (1.302) (1.293) (1.332) Population (log) 1.572*** 1.792*** 1.569*** 1.633*** (0.517) (0.538) (0.524) (0.538) Lights Change 07‐09 ‐0.284* (0.169) Lights Rel. Change 07‐09 ‐5.696 (3.611) Lights Above Avg. Change 07‐09 ‐1.383* (0.740) Lights Positive Change 08‐09 ‐2.313** (0.969) Observations 164 164 164 164
Standard errors in parentheses; * p < 0.10, ** p < 0.05, *** p < 0.01 Source: Author’s own compilation.
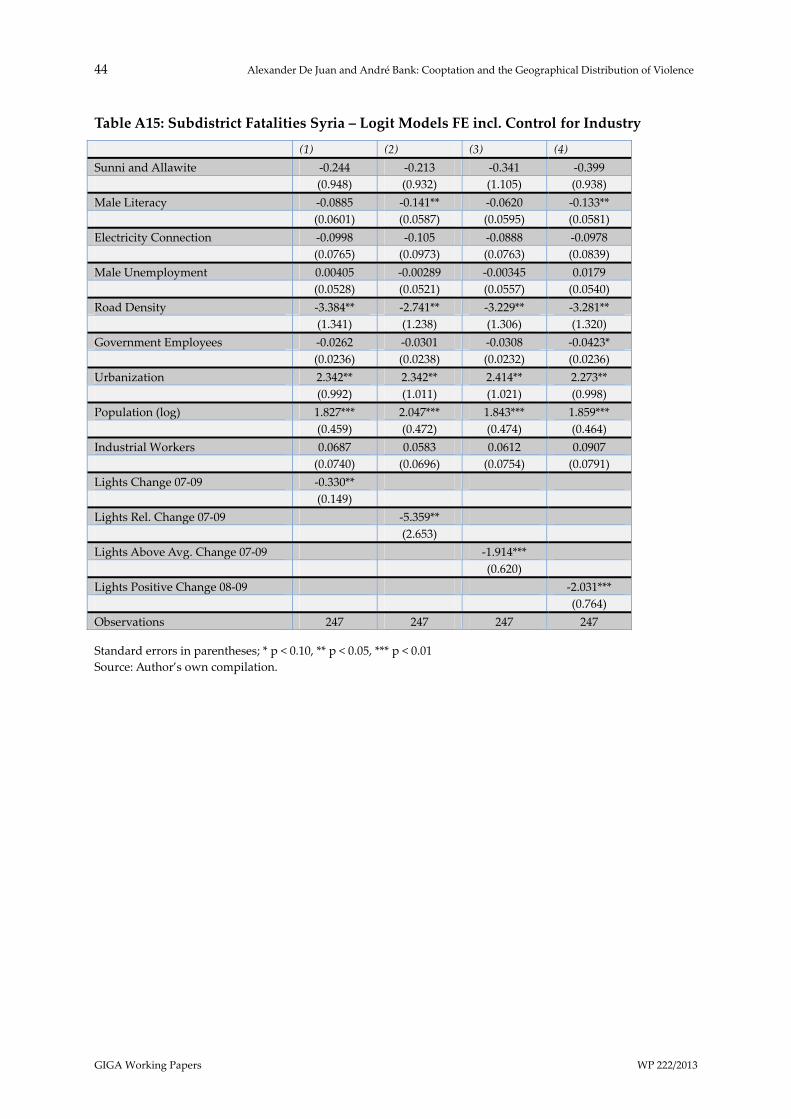
44 Alexander De Juan and André Bank: Cooptation and the Geographical Distribution of Violence
GIGA Working Papers WP 222/2013
Table A15: Subdistrict Fatalities Syria ‒ Logit Models FE incl. Control for Industry
(1) (2) (3) (4)
Sunni and Allawite ‐0.244 ‐0.213 ‐0.341 ‐0.399 (0.948) (0.932) (1.105) (0.938) Male Literacy ‐0.0885 ‐0.141** ‐0.0620 ‐0.133** (0.0601) (0.0587) (0.0595) (0.0581) Electricity Connection ‐0.0998 ‐0.105 ‐0.0888 ‐0.0978 (0.0765) (0.0973) (0.0763) (0.0839) Male Unemployment 0.00405 ‐0.00289 ‐0.00345 0.0179 (0.0528) (0.0521) (0.0557) (0.0540) Road Density ‐3.384** ‐2.741** ‐3.229** ‐3.281** (1.341) (1.238) (1.306) (1.320) Government Employees ‐0.0262 ‐0.0301 ‐0.0308 ‐0.0423* (0.0236) (0.0238) (0.0232) (0.0236) Urbanization 2.342** 2.342** 2.414** 2.273** (0.992) (1.011) (1.021) (0.998) Population (log) 1.827*** 2.047*** 1.843*** 1.859*** (0.459) (0.472) (0.474) (0.464) Industrial Workers 0.0687 0.0583 0.0612 0.0907 (0.0740) (0.0696) (0.0754) (0.0791) Lights Change 07‐09 ‐0.330** (0.149) Lights Rel. Change 07‐09 ‐5.359** (2.653) Lights Above Avg. Change 07‐09 ‐1.914*** (0.620) Lights Positive Change 08‐09 ‐2.031*** (0.764) Observations 247 247 247 247
Standard errors in parentheses; * p < 0.10, ** p < 0.05, *** p < 0.01 Source: Author’s own compilation.
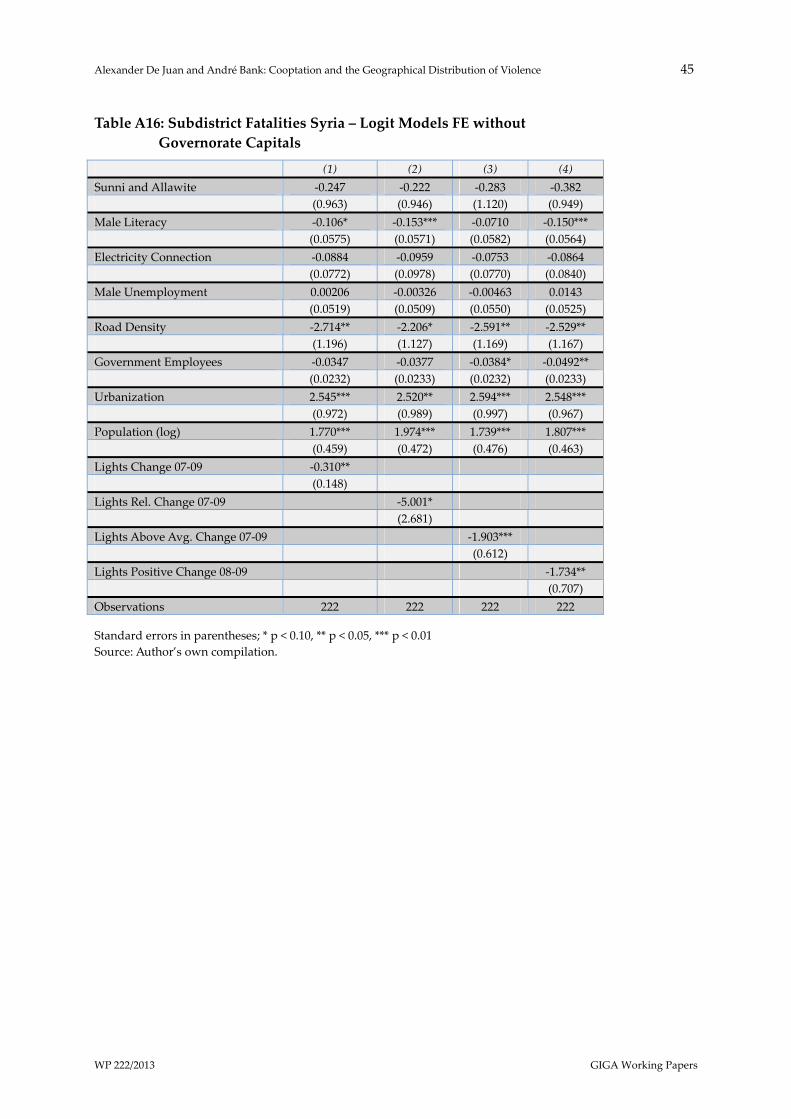
Alexander De Juan and André Bank: Cooptation and the Geographical Distribution of Violence 45
WP 222/2013 GIGA Working Papers
Table A16: Subdistrict Fatalities Syria ‒ Logit Models FE without
Governorate Capitals
(1) (2) (3) (4)
Sunni and Allawite ‐0.247 ‐0.222 ‐0.283 ‐0.382 (0.963) (0.946) (1.120) (0.949) Male Literacy ‐0.106* ‐0.153*** ‐0.0710 ‐0.150*** (0.0575) (0.0571) (0.0582) (0.0564) Electricity Connection ‐0.0884 ‐0.0959 ‐0.0753 ‐0.0864 (0.0772) (0.0978) (0.0770) (0.0840) Male Unemployment 0.00206 ‐0.00326 ‐0.00463 0.0143 (0.0519) (0.0509) (0.0550) (0.0525) Road Density ‐2.714** ‐2.206* ‐2.591** ‐2.529** (1.196) (1.127) (1.169) (1.167) Government Employees ‐0.0347 ‐0.0377 ‐0.0384* ‐0.0492** (0.0232) (0.0233) (0.0232) (0.0233) Urbanization 2.545*** 2.520** 2.594*** 2.548*** (0.972) (0.989) (0.997) (0.967) Population (log) 1.770*** 1.974*** 1.739*** 1.807*** (0.459) (0.472) (0.476) (0.463) Lights Change 07‐09 ‐0.310** (0.148) Lights Rel. Change 07‐09 ‐5.001* (2.681) Lights Above Avg. Change 07‐09 ‐1.903*** (0.612) Lights Positive Change 08‐09 ‐1.734** (0.707) Observations 222 222 222 222
Standard errors in parentheses; * p < 0.10, ** p < 0.05, *** p < 0.01 Source: Author’s own compilation.
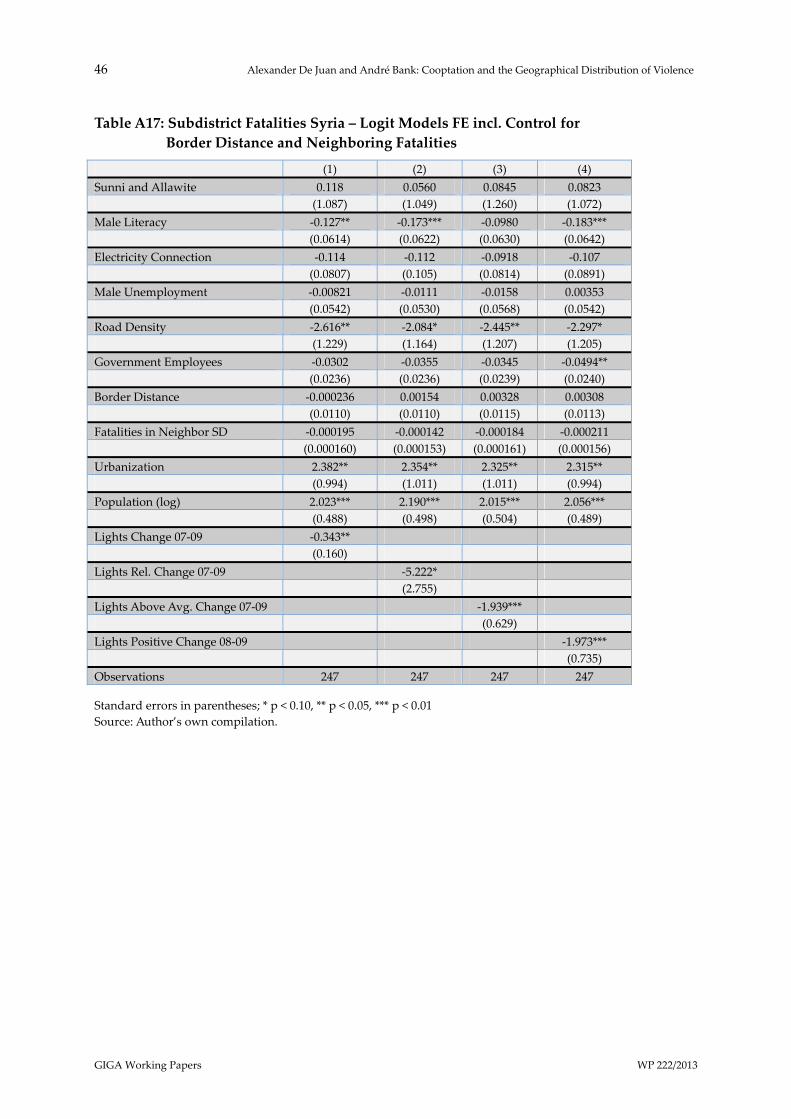
46 Alexander De Juan and André Bank: Cooptation and the Geographical Distribution of Violence
GIGA Working Papers WP 222/2013
Table A17: Subdistrict Fatalities Syria ‒ Logit Models FE incl. Control for
Border Distance and Neighboring Fatalities
(1) (2) (3) (4) Sunni and Allawite 0.118 0.0560 0.0845 0.0823 (1.087) (1.049) (1.260) (1.072) Male Literacy ‐0.127** ‐0.173*** ‐0.0980 ‐0.183*** (0.0614) (0.0622) (0.0630) (0.0642) Electricity Connection ‐0.114 ‐0.112 ‐0.0918 ‐0.107 (0.0807) (0.105) (0.0814) (0.0891) Male Unemployment ‐0.00821 ‐0.0111 ‐0.0158 0.00353 (0.0542) (0.0530) (0.0568) (0.0542) Road Density ‐2.616** ‐2.084* ‐2.445** ‐2.297* (1.229) (1.164) (1.207) (1.205) Government Employees ‐0.0302 ‐0.0355 ‐0.0345 ‐0.0494** (0.0236) (0.0236) (0.0239) (0.0240) Border Distance ‐0.000236 0.00154 0.00328 0.00308 (0.0110) (0.0110) (0.0115) (0.0113) Fatalities in Neighbor SD ‐0.000195 ‐0.000142 ‐0.000184 ‐0.000211 (0.000160) (0.000153) (0.000161) (0.000156) Urbanization 2.382** 2.354** 2.325** 2.315** (0.994) (1.011) (1.011) (0.994) Population (log) 2.023*** 2.190*** 2.015*** 2.056*** (0.488) (0.498) (0.504) (0.489) Lights Change 07‐09 ‐0.343** (0.160) Lights Rel. Change 07‐09 ‐5.222* (2.755) Lights Above Avg. Change 07‐09 ‐1.939*** (0.629) Lights Positive Change 08‐09 ‐1.973*** (0.735) Observations 247 247 247 247
Standard errors in parentheses; * p < 0.10, ** p < 0.05, *** p < 0.01 Source: Author’s own compilation.
GIGA German Institute of Global and Area Studies / Leibniz-Institut für Globale und Regionale StudienNeuer Jungfernstieg 21 • 20354 Hamburg • Germany
E-mail: <[email protected]> • Website: <www.giga-hamburg.de>
All GIGA Working Papers are available free of charge at <www.giga-hamburg.de/workingpapers>. For any requests please contact: <[email protected]>.WP Coordinator: Errol Bailey
Recent Issues
No 221 Kerstin Nolte: Large-Scale Agricultural Investments under Poor Land Governance Systems: Actors and Institutions in the Case of Zambia, April 2013
No 220 Almut Schilling-Vacaflor and Riccarda Flemmer: Why is Prior Consultation Not Yet an Effective Tool for Conflict Resolution? The Case of Peru, April 2013
No 219 Hanspeter Mattes: Politische Transformation und Gewalt in Tunesien, Ägypten und Libyen seit 2011: Ein Forschungsaufriss, April 2013
No 218 Claire Wright and Ana Soliz Landivar: From Military Instruments of Dictatorship to Political Instruments of Democracy: Regimes of Exception in Bolivia 2000‒2010, March 2013
No 217 Birte Pohl and Peter Mulder: Explaining the Diffusion of Renewable Energy Technology in Developing Countries, March 2013
No 216 Joachim Betz: The Reform of China’s Energy Policies, February 2013
No 215 André Bank, Thomas Richter and Anna Sunik: Long-Term Monarchical Survival in the Middle East: A Configurational Comparison, 1945–2012, February 2013
No 214 Nele Noesselt: Microblogs in China: Bringing the State Back In, February 2013
No 213 Pascal Abb: China’s Foreign Policy Think Tanks: Changing Roles and Structural Conditions, January 2013
No 212 Christian von Soest and Michael Wahman: Sanctions and Democratization in the Post-Cold War Era, January 2013
No 211 Alexander De Juan: Mapping Political Violence – The Approaches and Conceptual Challenges of Subnational Geospatial Analyses of Intrastate Conflict, December 2012
No 210 Lena Giesbert: Subjective Risk and Participation in Micro Life Insurance in Ghana, December 2012
No 209 Georg Strüver: What Friends Are Made Of: Bilateral Linkages and Domestic Drivers of Foreign Policy Alignment with China, November 2012
No 208 Jörg Balsiger, Miriam Prys and Niko Steinhoff: The Nature and Role of Regional Agreements in International Environmental Politics: Mapping Agreements, Outlining Future Research, October 2012
No 207 Daniel Flemes and Leslie Wehner: Drivers of Strategic Contestation in South America, October 2012