Embed Size (px)
Citation preview
The impact of forest management on
saproxylic beetles and other arthropods in
a semi-deciduous forest in Southern Benin
INAUGURALDISSERTATION
zur Erlangung der Würde eines Doktors der Philosophie
vorgelegt der
Philosophisch-Naturwissenschaftlichen Fakultät
der Universität Basel
von
Thibault Lachat
aus Develier, Jura
Basel, 2004

Genehmigt von der Philosophisch-Naturwissenschaftlichen Fakultät auf Antrag von
Prof. Dr. Peter Nagel, PD Dr. Ralf Peveling und Prof. Dr. Peter Duelli
Basel, den 21. September 2004
Prof. Dr. Hans-Jakob Wirz
Dekan

Table of contents
GENERAL INTRODUCTION – IMPACT OF TROPICAL FOREST MANAGEMENT ON ARTHROPODS
1
CHAPTER 1 – ARTHROPOD DIVERSITY
Arthropod diversity in Lama forest reserve (South Benin), a mosaic of natural, degraded and plantation forests
Biodiversity and Conservation, in press
9
CHAPTER 2 – PRIMARY ATTRACTION OF BEETLES TO FRESHLY CUT WOOD
Primary attraction of beetles to native and exotic tree species in natural and plantation forests in Lama forest reserve
Manuscript
31
CHAPTER 3 – DEAD WOOD AND SAPROXYLIC BEETLES
Dead wood and saproxylic beetle assemblages in a semi-deciduous forest in Southern Benin
Manuscript submitted to Forest Ecology and Management
47
CHAPTER 4 – SAPROXYLIC BEETLES ON SNAGS
Saproxylic beetle assemblages on native and exotic snags in a West African tropical forest
Manuscript
71
SUMMARY AND CONCLUSIONS – IMPACT OF TROPICAL FOREST MANAGEMENT ON ARTHROPODS
91
ACKNOWLEDGEMENTS 94
CURRICULUM VITAE 95

GENERAL INTRODUCTION
Biodiversity threats in tropical forests
At the World Summit on Sustainable Development held in Johannesburg in 2002, the international community committed itself to protect and restore the integrity of our planet’s ecological systems. Reaffirming the goals and objectives already laid down in the Rio Declaration on Environment and Development and the Agenda 21, including the Convention on Biological Diversity, the community considered measures to reduce the rate of biodiversity loss at national and global levels as a high priority. However, despite the actions foreseen in the Rio Declaration in 1992 and reaffirmed in the Johannesburg Declaration, poverty kept deepening and environmental degradation worsening over the last decade. Human populations in tropical countries are growing at a rate of 2–3% annually. Hence, the pressure on tropical forests due to an increasing demand for cropland, timber, fuelwood and other forest resources is unbroken (Ravindranath and Hall 1996). Furthermore, weak government institutions and poor policies, increasing trade liberalization, and industrial logging are considered as key drivers of forest destruction in many tropical countries (Laurance 1999).
The destruction, fragmentation and degradation of forests are major threats to the protection of biodiversity in tropical regions (Myers 1984). Tropical forests are the most ancient, diverse and ecologically complex terrestrial ecosystems (Myers 1984). While occupying only 7% of the land surface, they probably sustain over half of the planet’s life forms (Wilson 1988). Thus, the loss of biodiversity resulting from tropical forest destruction signifies an ecological crisis of global importance (Wilson 1988).
To counter these adverse consequences, it is necessary to develop new strategies for the sustainable management and use of tropical forests, which in turn requires the strengthening of research into functional and structural characteristics of tropical biodiversity.
State of African forests
With ≈ 650 million ha of forest (21.8% of the land area), Africa accounts for one sixth of the global forest cover (FAO 2003a). The Congo basin is home to the second largest contiguous block of tropical rain forest in the world (FAO 2003b). Unfortunately, these forests disappear at alarming rates. Between 1990 to 2000, the annual net change in forest cover was -0.8%. This rate is based on losses or gains in the cover of both natural and plantation forests. At the continental level, the rate is the highest in the world, and about twice as high as the second highest rate in South America (-0.4%).
1
GENERAL INTRODUCTION
Considering forest plantations, Africa accounts for only 4.4% of the global area. For every hectare reforested, the area deforested reaches 41 hectares. In view of this, there is growing consensus about the need to reduce deforestation, to use forests sustainably, and to establish forest plantations in order to meet the increasing demand for woody biomass (Ravindranath and Hall 1996). Commercial plantation forests are designed to produce maximum yields of timber or fuelwood. This seems to preclude any environmental benefit in terms of biodiversity conservation. However, recent analyses have shown that forest plantations can be managed to harbour an important proportion of the former biodiversity without compromising economic benefits (Lamb 1998). Different measures have been proposed to this end, including the creation of plantation species mosaics, embedding monocultures in a matrix of intact or restored vegetation, using indigenous species rather than exotic species, or preserving micro-habitats such as dead wood that are known to be particularly species-rich.
Forest (FAO 2001)
Land with a canopy cover (or equivalent stocking level) of more than 10
percent and an area of more than 0.5 hectares. The trees should be able to
reach a minimum height of 5 meters at maturity in situ.
Forest plantations (FAO 2001)
Forest stands established by planting or/and seeding in the process of
afforestation or reforestation. They are composed of introduced species
(planted stands), or intensively managed stands of indigenous species,
meeting all of the following criteria: one or two species at planting, even
age class, regular spacing.
Afforestation is defined as the establishment of forest on land that was not
forested within living memory or the past 10 years, and reforestation as the
establishment of forest on land that had been forested in the recent past.
Despite the potential of tropical forest plantations for biodiversity conservation, only few studies have been completed to date (e.g., Davis et al. 2001; Lawton et al. 1998; Watt et al. 1997). These studies have shown that plantations are not necessarily biodiversity deserts (Speight and Wylie 2001) but that they can support a rich and varied fauna. The importance of tropical forest plantations for the conservation of wildlife and as nuclei for natural forest regeneration has been demonstrated in
2
IMPACT OF TROPICAL FOREST MANAGEMENT ON ARTHROPODS
Madagascar (Goodman et al. 1996), Sri Lanka (Ashton et al. 1993), Thailand (Elliott et al. 1998) and Australia (Tucker and Murphy 1997).
Nevertheless, assuming that the current scenario persists, the predictions for the next two decades are very pessimistic (FAO 2003 b). The scenario assumes that deforestation will continue more or less at current rates, forest plantations expand only in few countries, and that fuelwood remains the main source of energy. As a consequence, the loss of biodiversity is expected to continue. With only 10% of the original forest remaining and at an annual decline in forest cover of -1.26%, west African forests are particularly vulnerable to human disturbance. In view of this and considering the exceptional concentration of endemic species, West African forests have been designated as biodiversity hotspots (Myers et al. 2000).
The Lama forest reserve in Southern Benin ─ one of the last remnants of natural forest in the Dahomey Gap (Sinsin et al. 2003) ─ appears to be an exception to the regional deforestation trend and might serve as a model for future conservation programs. Since 1988, a central part (Noyau central) covering 4,800 ha lies under strict protection, and the population living therein has been resettled. The forest is composed of a small-scale mosaic of remnants of natural or degraded semi-deciduous forest of variable size and successional stage (Specht 2002). It is surrounded by teak (Tectona grandis) and fuelwood (mainly Senna siamea and Acacia auriculiformis) plantations, covering 7,000 ha and 2,400 ha, respectively. These plantations provide timber and fuelwood for the local, national as well as international market.
Arthropods in biodiversity studies
Forget about pandas, elephants and tigers. If we want to understand how to sustain biodiversity, then we should be concerned about arthropods. Whether measured by species, individuals or biomass, arthropods dominate terrestrial ecosystems (Kremen et al. 1993). They have been referred to as the little things that run the world (Wilson 1988) because they occupy the widest possible diversity of ecosystems and microhabitats, and because they play many key ecological roles (Collins and Thomas 1991). Studies on the impact of forest disturbance on arthropods, particularly on tropical insects, have increased substantially over the last decades (e.g. Eggleton et al. 2002; Grove 2000, 2001, 2002; Holloway et al. 1992; Nummelin and Hanski 1989; Vasconcelos et al. 2000). These studies have been inspired by concerns about the rapid modifications of tropical habitats and by findings that invertebrates are highly sensitive to such modifications (Basset 1998). This vulnerability makes them potential early warning indicators of environmental change (Kremen et al. 1993). Furthermore, they are often more representative of overall biodiversity than plant and vertebrate surveys (Oliver et al. 1998). Finally, they are often more amenable to statistical analyses than vertebrates (Basset 1998).
3
GENERAL INTRODUCTION
Even though, African forest arthropods have been very little studied, and studies of arthropods associated with dead wood (saproxylics) are basically absent. In Lama forest, with the exception of preliminary insect inventories (Boppré 1994; Emrich et al. 1999; Fermon et al. 2001; Tchibozo 1995), arthropod assemblages were not studied at all, let alone their distribution in different types and successional stages of forest in the reserve.
Dead wood and saproxylic invertebrates
Over the last decades, dead wood has become an important research focus in the Northern hemisphere. Dead wood provides habitat for a sizable proportion ─ perhaps the majority ─ of forest organisms, from fungi through invertebrates to vertebrates (Elton 1966; Speight 1989; Grove 2001). Furthermore, it is a main store of nutrients. These are gradually released through decomposition, thereby improving soil fertility (Laiho and Prescott 1999). While dead wood has been recognised as an ecologically important component of temperate and boreal forests, there has been little consideration of its role in tropical forests, nor of the effects that management might have on it (Harmon 2002). In African developing countries, where 91% of the wood is used as fuelwood (FAO 2003b), dead wood is not a waste. Rather, it is systematically collected as fuelwood. Consequently, where firewood is scarce, the amount of dead wood in natural forests or plantations is low, especially the amount of pieces of larger size or advanced stage of decay.
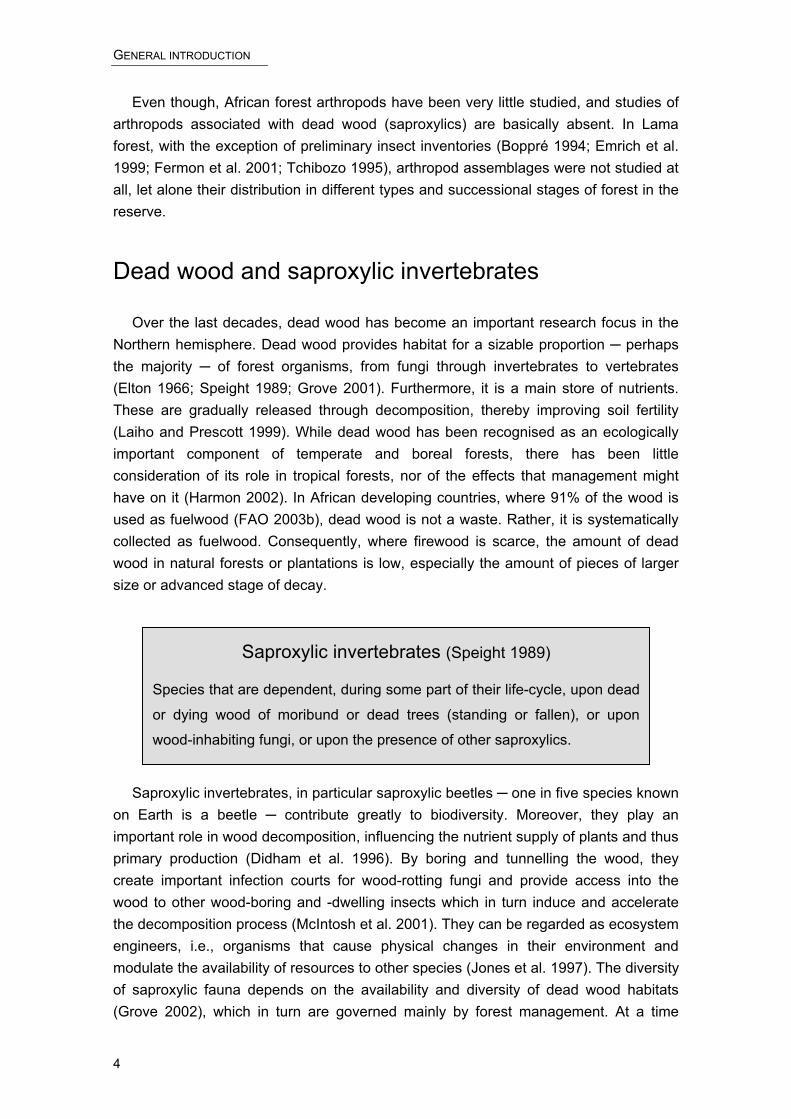
Saproxylic invertebrates (Speight 1989)
Species that are dependent, during some part of their life-cycle, upon dead
or dying wood of moribund or dead trees (standing or fallen), or upon
wood-inhabiting fungi, or upon the presence of other saproxylics.
Saproxylic invertebrates, in particular saproxylic beetles ─ one in five species known on Earth is a beetle ─ contribute greatly to biodiversity. Moreover, they play an important role in wood decomposition, influencing the nutrient supply of plants and thus primary production (Didham et al. 1996). By boring and tunnelling the wood, they create important infection courts for wood-rotting fungi and provide access into the wood to other wood-boring and -dwelling insects which in turn induce and accelerate the decomposition process (McIntosh et al. 2001). They can be regarded as ecosystem engineers, i.e., organisms that cause physical changes in their environment and modulate the availability of resources to other species (Jones et al. 1997). The diversity of saproxylic fauna depends on the availability and diversity of dead wood habitats (Grove 2002), which in turn are governed mainly by forest management. At a time
4
IMPACT OF TROPICAL FOREST MANAGEMENT ON ARTHROPODS
when more and more forests are logged and cleared worldwide, studies of dead wood and the associated fauna can reveal a great deal about the ecological impact of forest destruction and degradation, and provide baseline data for dead wood management, the so-called morticulture (Harmon 2002).
Objectives
The overall goal of this thesis is to enhance the scientific understanding of the Lama forest arthropod fauna, with particular emphasis on saproxylic beetles, as a basis for an improved, conservation-oriented forest management. Specifically, we aim (i) to elucidate the role of different forest habitats (natural, degraded and plantation forests) for biodiversity conservation and (ii) to recommend management measures for the conservation of arthropod diversity.
In Chapter I, we focus on arthropods that are involved in the decomposition of litter and dead wood, comparing the diversity and composition of arthropod assemblages in nine different forest types, including natural, degraded and plantation forest as well as forest patches outside of the reserve. Based on arthropod data and measured habitat attributes, we evaluate the value of forest plantations for biodiversity conservation, and identify indicator taxa for specific forest habitats.
Chapter II reports on a study of dead wood colonizer beetles. We investigated, in two baiting experiments in the field, the primary attraction of native and exotic, freshly cut wood to these beetles. For these experiments, we used a newly designed dead wood bait trap, the so-called twin-Malaise trap. Apart from providing evidence of primary attraction and host tree selection of West African colonizer beetles, we also give an account of ecological traits of one potential pest species of logs.
Chapter III summarises results from a dead wood inventory and a saproxylic beetle diversity assessment. This is the first study of the relationship between dead wood and saproxylic beetle assemblages in a tropical African forest. The influence of forest management on dead wood quantity and quality, and on saproxylic beetle species richness, was assessed in natural as well as plantation forests. The study examines dead wood habitat attributes such as the type (tree species) or stage of decay of dead wood that determine the diversity and composition of saproxylic beetle assemblages.
In Chapter IV, we followed up on our previous findings and evaluate the importance of standing dead trees (snags) for the conservation of saproxylic beetle assemblages. We compare assemblages from native snag tree species in remnants of natural forest and in degraded forest with those from exotic snag tree species in monospecific plantations.
5
GENERAL INTRODUCTION
References
Ashton P.M.S., Gunatilleke C.V.S. and Gunatilleke I.A.U.N. 1993. A shelterwood method of regeneration for sustained timber production in Mesua-Shorea forest of Southwest Sri Lanka. In: Erdelen W., Preu C., Ishwaran C.M. and Bandara M. (eds), Ecology and Landscape Management in Sri Lanka, pp. 255-274. Margraf Verlag, Weikersheim.
Basset, Y. 1998. Invertebrates in the canopy of tropical rain forests: How much do we really know? Plant Ecology: special issue: Tropical forest canopies: Ecology and Management, 153, 87-107.
Boppré, M. 1994. Insektenfauna des Lama-Waldes, Rép. Bénin. In 2. Vorl. Zwischenbericht. Forstzoologisches Institut der Albert-Ludwigs-Universität, Freiburg i. Br.
Collins, N.M. and Thomas, J.A. 1991. The conservation of insects in their habitats. Academic Press, London.
Davis, A.J., Holloway, J.D., Huijbregts, H., Krikken, J., Kirk-Spriggs, A.H. and Sutton, S.L. 2001. Dung beetles as indicators of change in the forests of northern Borneo. Journal of Applied Ecology, 38, 593-616.
Didham, R.K., Ghazoul, J., Stork, N.E. and Davis, A.J. 1996. Insects in fragmented forests: a functional approach. Tree, 11, 255-260.
Eggleton, P., Bignell, D.E., Hauser, S., Dibog, L., Norgrove, L. and Madong, B. 2002. Termite diversity across an anthropogenic disturbance gradient in the humid forest zone of West Africa. Agriculture, Ecosystem and Environment, 90, 189-202.
Elliott, S., Blakesley, D. and Anusaransunthron, V. 1998. Forests for the future - Growing and planting native trees for restoring forest ecosystems. Forest Restoration Research Unit, Chiang Mai University, Chiang Mai.
Elton, C.S. 1966. Dead and dying wood: the pattern of animal communities. John Wiley and Sons Inc., New York.
Emrich, A., Mühlenberg, M., Steinhauer-Burkhart, B. and Sturm, H.J. 1999. Evaluation écologique intégrée de la forêt naturelle de la Lama en République du Bénin. Rapport de synthèse. ONAB, KfW, GTZ, Cotonou, Bénin.
FAO. 2001. Global forest resources assessment 2000, Rome.
FAO. 2003a. State of the world's forests, 2003, Rome.
FAO. 2003b. Forestry outlook study for Africa: African forests: A view to 2020, Rome.
Fermon, H., Schulze, C.H., Waltert, M. and Mühlenberg, M. 2001. The butterfly fauna of the Noyau Central, Lama Forest (Republic of Benin), with notes on its ecological composition and geographic distribution. African Entomology, 9, 177-185.
Goodman, S.M., Rakotondravony, D., Schatz, G. and Wilmé, L. 1996. Species richness of forest-dwelling birds, rodents and insectivores in a planted forest of native trees: a test case from Ankaratra, Madagascar. Ecotropica, 2, 109-120.
6

IMPACT OF TROPICAL FOREST MANAGEMENT ON ARTHROPODS
Grove, S.J. 2000. Trunk window trapping: an effective technique for sampling tropical saproxylic beetles. Memoirs of the Queensland Museum, 46, 149-160.
Grove, S.J. 2001. The influence of forest management history on the integrity of the saproxylic beetle fauna in an Australian lowland tropical rainforest. Biological Conservation, 104, 149-171.
Grove, S.J. 2002. The influence of forest management history on the integrity of the saproxylic beetle fauna in an Australian lowland tropical rainforest. Biological Conservation, 104, 149-171.
Harmon, M.E. 2002. Moving towards a new paradigm for woody detritus management. USDA Forest Service Gen. Tech. Rep. PSW-GTR-181.
Holloway, J.D., Kirk-Spriggs, A.H. and Khen, C.V. 1992. The response of some rain forest insect groups to logging and conversion to plantation. Philosophical Transactions: Biological Sciences: Tropical rain forest: disturbance and recovery, 335, 425-436.
Jones, C.G., Lawton, J.H. and Shachak, M. 1997. Positive and negative effects of organisms as physical ecosystem engineers. Ecology Washington D C, 78, 1946-1957.
Kremen, C., Colwell, R.K., Erwin, T.L., Murphy, D.D., Noss, R.F. and Sanjayan, M.A. 1993. Terrestrial arthropod assemblages: their use in conservation planning. Conservation Biology, 7, 796-808.
Laiho, R. and Prescott, C.E. 1999. The contribution of coarse woody debris to carbon, nitrogen, and phosphorus cycles in three Rocky Mountain coniferous forests. Canadian Journal of Forest Research, 29, 1592-1603.
Lamb, D. 1998 Large-scale ecological restoration of degraded tropical forest lands: The potential role of timber plantations. Restoration Ecology, 6, 271-279.
Laurance, W.F. 1999. Reflections on the tropical deforestation crisis. Biological Conservation, 91, 109-117.
Lawton, J.H., Bignell, D.E., Bolton, B., Bloemers, G.F., Eggleton, P., Hammond, P.M., Hodda, M., Holt, R.D., Larsen, T.B., Mawdsley, N.A., Stork, N.E., Srivastava, D.S. and Watt, A.D. 1998. Biodiversity inventories, indicator taxa and effects of habitat modification in tropical forest. Nature, 391, 72-76.
McIntosh, R.L., Katinic, P.J., Allison, J.D., Borden, J.H. and Downey, D.L. 2001. Comparative efficacy of five types of trap for woodborers in the Cerambycidae, Buprestidae and Siricidae. Agricultural and Forest Entomology, 3, 113-120.
Myers, N. 1984. The primary source: Tropical forests and our future. W. W. Norton, New York.
Myers, N., Mittermeier, R.A., Mittermeier, C.G., Fonseca, G.A.B.D. and Kent, J. 2000. Biodiversity hotspots for conservation priorities. Nature, 403, 853-858.
Nummelin, M. and Hanski, I. 1989. Dung beetles of the Kibale Forest, Uganda; comparison between virgin and managed forests. Journal of Tropical Ecology, 5, 349-352.
Ravindranath, N.H. and Hall, D.O. 1996. Estimates of feasible productivities of short rotation tropical forestry plantations. Energy for Sustainable Development, II, 14-20.
7
GENERAL INTRODUCTION
Sinsin, B., Attignon, S., Lachat, T., Peveling, R. and Nagel, P. (Eds.). 2003. The Lama forest reserve in Benin – a threatened ecosystem in focus. Opuscula Biogeographica Basileensia III, pp. 32.
Specht, I. 2002. La forêt de la Lama, Bénin SIG basé sur Landsat 7. Opuscula Biogeographica Basileensia II, Bâle, Suisse.
Speight, M.C.D. 1989. Saproxylic invertebrates and their conservation. Council of Europe, Strasbourg.
Speight, M.R. and Wylie, F.R. 2001. Insect Pests in Tropical Forestry CABI Publishing, Oxford, Brisbane.
Tchibozo, S. 1995. Inventaire préliminaire des ravageurs des essences forestières (plantations et naturelles) et de la faune entomologique de la forêt de la Lama (République du Bénin). IITA, Cotonou, Bénin.
Tucker, N. and Murphy, T. 1997. The effect of ecological rehabilitation on vegetation recruitment: some observations from the wet tropics of North Queensland. Forest Ecology and Management, 99, 133-152.
Vasconcelos, H.L., Vilhena, J.M.S. and Caliri, G.J.A. 2000. Responses of ants to selective logging of a central Amazonian forest. Journal of Applied Ecology, 37, 508-514.
Watt, A.D., Stork, N.E., McBeeath, C. and Lawson, G.L. 1997. Impact of forest management on insect abundance and damage in a lowland tropical forest in southern Cameroon. Journal of Applied Ecology, 34, 985-998.
Wilson, E.O. 1988. Biodiversity. National Academy of Sciences, Washington, DC.
8

CHAPTER 1 – ARTHROPOD DIVERSITY
Arthropod diversity in Lama forest reserve (South Benin),
a mosaic of natural, degraded and plantation forests
Thibault Lachat, Serge Attignon, Julien Djego, Georg Goergen, Peter Nagel, Brice Sinsin and Ralf Peveling
Biodiversity and Conservation, in press
Arthropod assemblages were examined in Lama forest reserve, a protected area situated in the Dahomey gap, southern Benin, composed of plantations, degraded forest and remnants of natural forest. The objectives were to compare assemblages in relation to forest type and use, to elucidate the value of forest plantations for biodiversity conservation and to identify indicator species for specific forest habitats. Arthropods were collected over an 11-month period, using standardized sets of traps (pitfall, emergence, Malaise and flight intercept traps). Nine different habitats were studied, including natural and degraded forest, forest plantations (Tectona grandis and Senna siamea) of different age, and isolated forest fragments. Our analysis focused on detritivorous and xylophagous arthropods but also included ground beetles and heteropterans, totalling 393 species. We found no differences in species richness among natural and degraded forest habitats in the centre of the reserve (Noyau central). Outside of the Noyau central, species richness was highest in old teak plantations and isolated forest fragments and lowest in young teak and fuelwood plantations. Detrended correspondence analysis (DCA) separated three main groups: (1) natural forest, (2) degraded forest and young plantations, and (3) old plantations and isolated forest fragments. Multiple regression of DCA scores of the first two axes on environmental variables identified one natural and three disturbance-related predictors of arthropod assemblages in Lama forest: soil type (texture), canopy height, naturalness (proportion of Guineo-Congolian plant species) and understorey vegetation cover. We identified 15 indicator species for six different forest habitats. The highest numbers were found in abandoned settlements and old teak plantations. Beta-diversity was similar among the three DCA ordination groups (degraded forest excluded). Values for β-diversity were relatively high, suggesting that all major forest habitats contribute significantly to regional species pools und should therefore be protected. To enhance arthropod diversity, we propose that management practices in Lama forest should aim to encourage the development of species-rich understorey vegetation of the Guineo-Congolian phytogeographical region.
Key words: Arthropod assemblages, Biodiversity conservation, Dahomey gap, Degraded forest, Forest plantations, Indicator species, Natural forest
9

CHAPTER 1
Introduction
West African forests are listed among the 25 hotspots considered as priority areas for biodiversity conservation (Myers et al. 2000). At the same time, there is consensus that secondary forests are becoming increasingly important for biodiversity conservation (Gemerden et al. 2003; Zapfack et al. 2002), and that the contribution of forest plantations to the conservation of tropical forests must be evaluated.
Forest plantations are extending world-wide. Since 1990, the area planted has quadrupled. In Africa, plantations account for only 1.2% of the total forest cover (FAO 2000), but the proportion in Benin is relatively high (4.2%). Forest plantations provide a range of forest products on a relatively limited land surface, and can therefore contribute to reducing deforestation and degradation of natural forests (FAO 2001). Being a man-made type of forest, plantations are considered to support low biodiversity and hence be of little interest for biodiversity research and conservation. Thus, only few studies on the biodiversity in tropical forest plantations have been completed to date (e.g. Watt et al. 1997; Lawton et al. 1998; Davis et al. 2001). These studies showed that forest plantations are not necessarily “biodiversity deserts” (Speight and Wylie 2001) but that they can support a rich and varied fauna. The importance of tropical forest plantations for the conservation of wildlife and as nuclei for natural forest regeneration has been demonstrated in Madagascar (Goodman et al. 1996), Sri Lanka (Ashton et al. 1993), Thailand (Elliott et al. 1998) and Australia (Tucker and Murphy 1997).
Several authors studied the response of insects (ants, termites, moths, dung and carrion beetles) to the degradation of tropical forests (e.g. Nummelin and Hanski 1989; Holloway et al. 1992; Vasconcelos et al. 2000; Eggleton et al. 2002). These studies showed that the composition and species richness of arthropod assemblages vary depending on disturbance levels, regional species pools and the spatial and temporal scale of the study. However, little information is available on the effects of different forest management regimes on the composition of arthropod assemblages in West Africa.
As one of the last remnants of natural forest within the Dahomey gap (Ballouche et al. 2000), and an important refuge for several endangered plants and animals, Lama forest reserve is of key concern for biodiversity conservation in Benin. Only few studies have been conducted so far, the majority focusing on natural forest. Despite their larger size, degraded forests and forest plantations have received little attention. With the exception of litter-dwelling arthropods (Attignon et al. 2004) and butterflies (Fermon et al. 2001), arthropod assemblages have not been well studied, let alone surveyed in different habitat types and successional stages of forest in the reserve.
10
ARTHROPOD DIVERSITY
The goal of the present study was to enhance the scientific understanding of the Lama forest arthropod fauna as a basis for improved, conservation-oriented forest management. The specific objectives were (1) to compare arthropod diversity and assemblages in the principal forest types of Lama forest, (2) to assess the value of forest plantations for biodiversity conservation and (3) to identify indicator taxa for specific forest habitats.
Materials and Methods
Study site
The Lama forest reserve is situated about 80 km north of Cotonou (6°55.8’ to 6°58.8’ N and 2°4.2’ to 2°10.8’ E), covering an area of 16,250 ha in a shallow depression between the Allada and Abomey plateaus. The forest is located in the Dahomey gap, a low rainfall zone separating the western and eastern part of the humid Guineo-Congolian evergreen and semi-evergreen forests of West and West-central Africa (White 1983). The climate is relatively dry (ca. 1200 mm rainfall), with a pronounced dry season from November to March (Sayer et al. 1992). The prevailing soils are hydromorphic vertisols rich in nutrients and clay, as well as sandy ferralsols. The natural vegetation is a semi-deciduous forest, belonging to the drier peripheral semi-evergreen Guineo-Congolian rain forest system (White 1983).
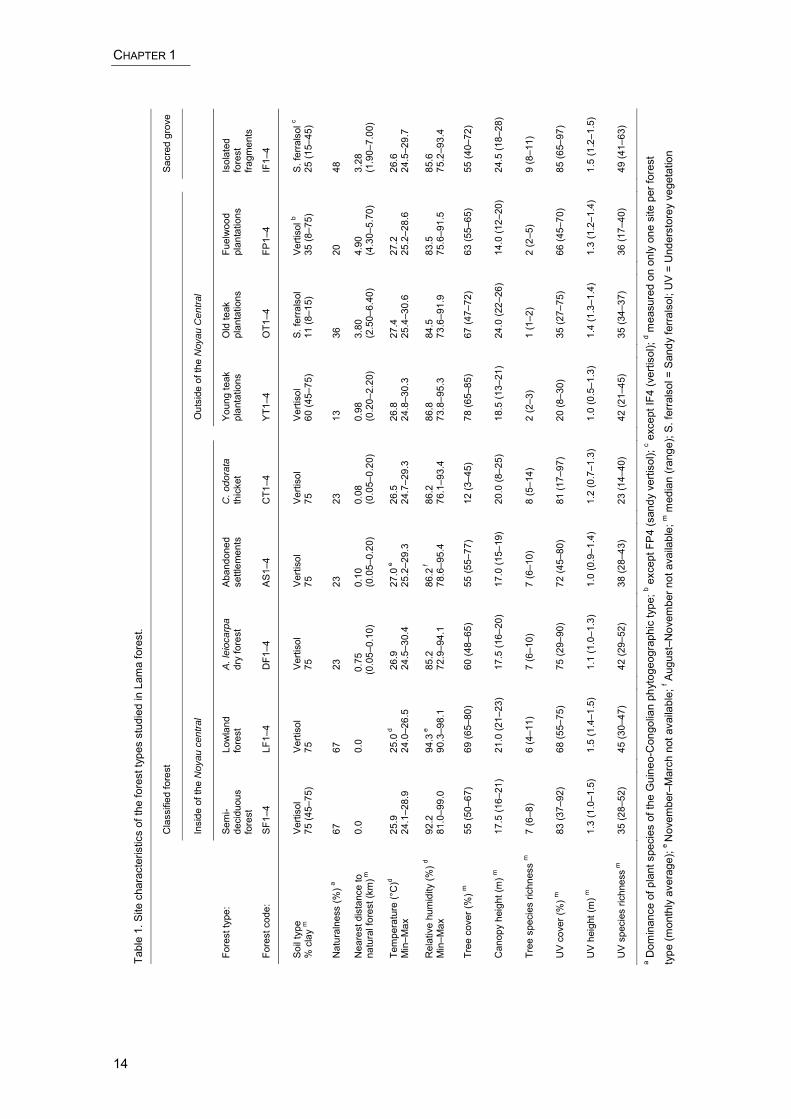
Despite having been legally protected since 1946, deforestation for agriculture in Lama forest continued until 1988, leading to the reduction of natural forest cover from 11000 ha to 1900 ha. Since then, a central part covering 4800 ha, the so-called Noyau central, lies under strict protection. Peasants living in the Noyau central were resettled in nearby agroforestry schemes. Reflecting the traditional farming system, the Noyau central is composed of a small-scale mosaic of natural and degraded forest patches of variable size and successional stages (Specht 2002). The Noyau central is surrounded by young and old teak plantations (7000 ha, Tectona grandis) and fuelwood plantations (2400 ha, mainly Senna siamea, interspersed with T. grandis, and a few stands of Acacia auriculiformis) (Figure 1). The present study focused on nine different forest types representing all major habitats within the reserve boundaries plus a few forest remnants outside of the reserve. Five forest types were situated within the Noyau central and four outside:
1. Semi-deciduous forest (1937 ha) is dominated by tree species such as Afzelia africana, Ceiba pentandra, Dialium guineense, Diospyros mespiliformis, Drypetes floribunda, Celtis brownii, Mimusops andongensis. The understorey vegetation can be dense and canopy height reaches 16 to 21 meters (Table 1).
2. Cynometra megalophylla lowland forest (< 100 ha) grows in seasonally flooded areas. This forest is characterized by C. megalophylla and other plants adapted to
11

CHAPTER 1
seasonal flooding. The understorey vegetation is usually less dense than in semi-deciduous forest.
3. Anogeissus leiocarpa dry forest (1222 ha) is a secondary forest developing on former slash-and-burn patches. A. leiocarpus can reach 20 m in height and promotes the establishment of shade-tolerant plants.
Cropland
Cropla
Cropland IFI
IFI
S
S
T
FP
C
Figure 1. Schematic view of LamaFP, Fuelwood plantations; S, Settscale).
4. Abandoned settlements characteristic vegetation type comguineensis) and guava (Psidium gu
5. Perennial Chromolaena odC. odorata is an alien, invasive spforest patches, clearings, as well canopy cover exceeds about 40%.
6. Young teak plantations (7vertisol around the Noyau central.
12
NN
nd
Cropland
0 1 2 3 4 5 km
N
IF
IF
T
T
forest reserve. NC, Noyau central; T, Teak plantations; lements; IF, Isolated forest fragments (the latter not to
(166 ha) of the resettled population present a posed of cultivated trees such as oil palm (Elaeis ajava), and secondary regrowth.
orata thicket (1452 ha) grows on former farmland. ecies of neotropical origin encroaching open-canopy as fallow land. It is rapidly shaded out if the forest
200 ha) were planted between 1985 and 1995 on
ARTHROPOD DIVERSITY
7. Old teak plantations (2200 ha) were planted between 1955 and 1965 on sandy ferralsol (transition between vertisols in the valley and ferralitic soils on the surrounding plateaus).
8. Fuelwood plantations (2400 ha) were planted between 1988 and 1996. They are composed of S. siamea, T. grandis and A. auriculiformis.
9. Most isolated forest fragments are located outside of the reserve. These widely scattered sacred groves are embedded in a matrix of farmland and degraded savannah. They are used as ceremonial places and remain in a relatively natural state. The remnants are usually very small (1–2 ha).
Sampling sites were selected according to three criteria: (1) spatial representativeness, (2) patch size and (3) accessibility. Each forest type was represented by four replicates. Thus, the total number of sites was 36 (Table 1). Distances between sites of the same forest type ranged from 0.3 km to 19.0 km. A minimum distance of 20 m (small patches) or 50 m (large patches) was maintained between sampling sites and patch borders.
A botanical survey was also conducted within the scope of our study, using the Braun-Blanquet system. Two hundred ninety plant species in 77 families were sampled (unpublished data).
Sampling methods
On each site, we installed an equal number of sampling devices, comprising (1) three funnel pitfall traps, each consisting of a collecting jar inside a plastic sleeve, an 11 cm diameter funnel and a transparent plastic roof 20 cm in diameter (Southwood 1978), (2) one Malaise trap (after Townes 1972) with a 1.5 m2 black vertical mesh panel, (3) one flight intercept trap intercepting insects flying between 1.0 and 1.5 m above the ground, consisting of two crossed black vertical mesh panels, each measuring 0.25 m2 (0.5 × 0.5 m), and top and bottom funnels 50 cm in diameter (Wilkening et al. 1981), and (4) one pyramid-shaped emergence trap (ground photo-eclector) covering an area of 0.75 m2 (≈ 0.86 × 0.86 m), equipped with a collecting jar on the top and one pitfall trap (Mühlenberg 1993). The traps were spaced out along 30 m north-south transects. The placement design was similar at all sites. We used formalin (0.5%) as a preservative, adding some detergent to lower the surface tension. A preliminary two-week sampling was conducted in May 2001 to establish the methodology. The sampling period for the present study was one week per month from June 2001 to April 2002. Specimens were sorted, counted, labelled and stored in alcohol (75%) for later identification.
13
CHAPTER 1
Tabl
e 1.
Site
cha
ract
eris
tics
of th
e fo
rest
type
s st
udie
d in
Lam
a fo
rest
.
C
lass
ified
fore
st
S
acre
d gr
ove
In
side
of t
he N
oyau
cen
tral
O
utsi
de o
f the
Noy
au C
entra
l
Fore
st ty
pe:
Fore
st c
ode:
Sem
i-de
cidu
ous
fore
st
SF1
–4
Low
land
fo
rest
LF
1–4
A. l
eioc
arpa
dr
y fo
rest
D
F1–4
Aba
ndon
ed
settl
emen
ts
AS1
–4
C. o
dora
ta
thic
ket
CT1
–4
Youn
g te
ak
plan
tatio
ns
YT1
–4
Old
teak
pl
anta
tions
O
T1–4
Fuel
woo
d pl
anta
tions
FP
1–4
Isol
ated
fo
rest
fra
gmen
ts
IF1–
4
Soi
l typ
e
% c
lay
m
Ver
tisol
75
(45–
75)
V
ertis
ol
75
Ve
rtiso
l 75
Ver
tisol
75
Ver
tisol
75
Ver
tisol
60
(45–
75)
S.
ferra
lsol
11
(8–1
5)
Ve
rtiso
l b
35 (8
–75)
S. f
erra
lsol
c 25
(15–
45)
Nat
ural
ness
(%) a
67
67
23
23
23
13
36
20
48
Nea
rest
dis
tanc
e to
na
tura
l for
est (
km) m
0.
0
0.
0
0
.75
(0
.05–
0.10
)
0.10
(0
.05–
0.20
)
0.08
(0
.05–
0.20
)
0.98
(0
.20–
2.20
)
3.80
(2
.50–
6.40
)
4.90
(4
.30–
5.70
)
3.28
(1
.90–
7.00
)
Tem
pera
ture
(°C
)d
Min
–Max
25
.9
24.1
–28.
9
25.0
d
24.0
–26.
5
26.9
24
.5–3
0.4
27
.0 e
25
.2–2
9.3
26
.5
24.7
–29.
3
26.8
24
.8–3
0.3
27
.4
25.4
–30.
6
27.2
25
.2–2
8.6
26
.6
24.5
–29.
7
Rel
ativ
e hu
mid
ity (%
) d
Min
–Max
92
.2
81.0
–99.
0
94.3
e
90.3
–98.
1
85.2
72
.9–9
4.1
86
.2 f
78.6
–95.
4
86.2
76
.1–9
3.4
86
.8
73.8
–95.
3
84.5
73
.6–9
1.9
83
.5
75.6
–91.
5
85.6
75
.2–9
3.4
Tree
cov
er (%
) m
55 (5
0–67
)
69 (6
5–80
)
60 (4
8–65
)
55 (5
5–77
)
12 (3
–45)
78 (6
5–85
)
67 (4
7–72
)
63 (5
5–65
)
55 (4
0–72
)
Can
opy
heig
ht (m
) m
17.5
(16–
21)
21
.0 (2
1–23
)
17.5
(16–
20)
17
.0 (1
5–19
)
20.0
(8–2
5)
18
.5 (1
3–21
)
24.0
(22–
26)
14
.0 (1
2–20
)
24.5
(18–
28)
Tree
spe
cies
rich
ness
m
7 (6
–8)
6
(4–1
1)
7
(6–1
0)
7
(6–1
0)
8
(5–1
4)
2
(2–3
)
1 (1
–2)
2
(2–5
)
9 (8
–11)
UV
cove
r (%
) m
83 (3
7–92
)
68 (5
5–75
)
75 (2
9–90
)
72 (4
5–80
)
81 (1
7–97
)
20 (8
–30)
35 (2
7–75
)
66 (4
5–70
)
85 (6
5–97
)
UV
heig
ht (m
) m
1.3
(1.0
–1.5
)
1.5
(1.4
–1.5
)
1.1
(1.0
–1.3
)
1.0
(0.9
–1.4
)
1.2
(0.7
–1.3
)
1.0
(0.5
–1.3
)
1.4
(1.3
–1.4
)
1.3
(1.2
–1.4
)
1.5
(1.2
–1.5
)
UV
spec
ies
richn
ess m
35
(28–
52)
45
(30–
47)
42
(29–
52)
38
(28–
43)
23
(14–
40)
42
(21–
45)
35
(34–
37)
36
(17–
40)
49
(41–
63)
a Dom
inan
ce o
f pla
nt s
peci
es o
f the
Gui
neo-
Con
golia
n ph
ytog
eogr
aphi
c ty
pe; b e
xcep
t FP
4 (s
andy
ver
tisol
); c e
xcep
t IF4
(ver
tisol
); d m
easu
red
on o
nly
one
site
per
fore
st
type
(mon
thly
ave
rage
); e N
ovem
ber–
Mar
ch n
ot a
vaila
ble;
f Aug
ust–
Nov
embe
r not
ava
ilabl
e; m
med
ian
(ran
ge);
S. fe
rral
sol =
San
dy fe
rral
sol;
UV
= U
nder
stor
ey v
eget
atio
n
14
ARTHROPOD DIVERSITY
Sorting scope and identification
Among the wide range of invertebrates sampled, we focused on detritivorous and xylophagous arthropods because of their important role in nutrient cycling in forest ecosystems (Didham et al. 1996). These taxa comprised fourteen coleopteran families, as well as representatives of Isoptera, Diplopoda and Isopoda. We also included epigeal predators (Carabidae and Chilopoda), omnivorous beetles (Tenebrionidae) and both herbivorous and predatory bugs (Heteroptera). These additional taxa were retained for a more comprehensive characterization of arthropod assemblages and because some have been used as representative indicators in previous biodiversity assessments (Duelli and Obrist 1998; Giulio et al. 2001; Rainio and Niemelä 2003).
All arthropods were first sorted to morphospecies (sensu New 1998) and then taxonomically identified at the International Institute of Tropical Agriculture (IITA) in Benin. Voucher specimens were deposited at the IITA Biodiversity Center and partly at the Museum of Natural History, Basel, Switzerland. The analysis was done at the morphospecies level for taxa with difficult taxonomy (e.g. most Diplopoda).
Environmental variables
Soils were classified according to the FAO system (FAO-UNESCO 1974), and the percentage of clay (soil texture) was estimated by touch. Temperature (°C) and relative humidity (RH) were recorded every hour from April 2002 to March 2003, using one data logger (Hobo Pro RH/Temp) per forest type. Loggers were attached to tree trunks about one meter above ground level. The naturalness (sensu Angermeier 1999) of the different forest types was calculated based on the proportion of plant species belonging to the Guineo-Congolian phytogeographical region. We also determined cover, height and species richness of the main vegetation strata (Table 1). The nearest distance between sampling sites and natural forest patches was measured with a geographic information system (ArcView 3.1), using the vegetation map of Specht (2002) (Table 1).
Measures of diversity
We used species richness as a measure of α-diversity (the number of species within a habitat). Beta-diversity (the degree of change in species composition between habitats) was evaluated for selected groups of forest habitats according to Whittaker’s formula βw = γ /⎯α, where γ is the species pool within a group of habitats (γ-diversity) and⎯α is the average number of species per site (Whittaker 1960).
Data analysis
We used the total catch per taxon and per sampling site for statistical analyses. This was done by pooling specimens from all sampling periods and traps within sampling sites.
15

CHAPTER 1
One-way analysis of variance (ANOVA) was conducted to test differences in arthropod assemblages among forest types (Zar 1999), followed by Bonferroni multiple comparison of means. In view of an unfavourable ratio between factor levels (n = 9) and replicates (n = 4), we also performed a post hoc power analysis (SPSS 12.0).
To determine the similarity of forest types based on their arthropod assemblages, we performed detrended correspondence analysis (DCA) (Hill and Gauch 1980), using PC-ORD 4.27 (McCune and Mefford 1999). Abundances of species rarer than Fmax/5 (where Fmax is the frequency of the most common species) were down-weighted in proportion to their frequency. Axes were rescaled with a threshold of zero, and the number of segments was set to 26 (default). Reciprocal averaging (RA), also known as correspondence analysis, revealed the same grouping, but DCA was preferred because it squashed the arch effect associated with RA and corrected the compression of the axis ends. The proportion of variance represented by the ordination axes was calculated according to an after-the-fact method, using the relative Euclidean distance (McCune and Mefford 1999). Stepwise multiple regression with forward selection (SPSS 12.0) was conducted to relate DCA ordination scores of the first two axes to the environmental variables listed in Table 1.
A hierarchical cluster analysis based on presence/absence data was employed to distinguish groups of sites in the DCA ordination plot (SPSS, 12.0, settings: Ward’s method, squared Euclidean distance). Clusters were grouped in probability ellipses whose axes are proportional in length to a specified percentage of the x and y coordinates (Jennrich and Turner 1969). The inclusion probability was set to P = 0.90. Computation of the ellipses was done with ArcView 3.1.
We used Mantel tests to evaluate the relationship between arthropod assemblages and the distance to the nearest natural forest patch (Mantel 1967). These tests were performed with PC-ORD 4.27 (McCune and Mefford 1999), using binary data (Sørensen distance) and Monte Carlo randomisation (1000 runs).
Indicator species
Indicator species for the different forest types were determined according to Dufrêne and Legendre (1997). The method combines data on the frequency of occurrence (faithfulness) and relative abundance (concentration) of species in a particular habitat. The significance of indicator values was tested using Monte Carlo randomisation (1000 runs). The threshold level for the indicator value was 25%. This implies that the frequency of occurrence of a species indicative of a particular habitat must be ≥ 50%, and its relative abundance therein ≥ 50% of its total abundance at all sites (Dufrêne and Legendre 1997). The significance level was p ≤ 0.01, as proposed by the authors. The analysis was performed with PC-ORD 4.27 (McCune and Mefford 1999). Note that indicator organisms may include both species restricted to a certain habitat and those more widely distributed yet especially abundant in a particular type of forest.
16
ARTHROPOD DIVERSITY
Estimation of true species richness
True species richness was estimated by computing the abundance-based coverage estimator (ACE) and the incidence-based coverage estimator ICE (1000 runs) for the eleven collecting periods, using EstimateS 6.0 (Colwell 1997). The ACE is based on species with ≤ 10 individuals in the sample (Chao et al. 1993). The corresponding ICE, likewise, is based on species found in ≤ 10 sampling sites (Lee and Chao 1994). These estimations were the most appropriate for our data set which was characterized by a large number of singletons (species occurring with one individual only) and uniques (species occurring in one sample only).
Results
A total of 9431 specimens belonged to the taxonomic groups examined in the present study, representing 393 species (Appendix 1). More than one third of all species were singletons, and only fourteen were collected in all forest types. Seventy one percent (ACE) and 66% (ICE) of the estimated true species number were sampled.
Coleoptera
We collected 264 species in 16 families of Coleoptera, representing 67% of the total number of species and 58% (5499 specimens) of the total number of arthropods included in the analysis. Except for carabids, the high number of specimens was due to a few very abundant species. Of 37 scarabaeid species, six represented over 63% of all specimens. One of 17 species of Elateridae represented 97% of the total catch in this family, and one of 12 species of Scolytidae 58% of the total catch. All but one scarabaeid species of the dominant taxa were found in all forest types. Thirty eight percent of all coleopteran species were singletons. Most coleopterans were collected in isolated forest fragments (111 species, 42% of all coleopterans) and old teak plantations (94 species, 36%), and the smallest number in young teak plantations (64 species, 24%) and fuelwood plantations (59 species, 22%). Forest types within the Noyau central had about the same number of coleopteran species, with an average of 81 ± 1 species (mean ± SE).
Heteroptera
Within 15 families of Heteroptera, we found 75 species (19% of the total number of arthropod species analysed) and 558 specimens (6% of the total catch analysed). Forty-one percent of the Reduviidae (22 species) and 54% of the Lygaeidae (17 species) were represented by three species only. One of five species of Alydidae made up 95% of the total catch for this family. More than 41% of all heteropterans were singletons. Species numbers were highest in isolated forest fragments (32 species)
17
CHAPTER 1
and lowest in semi-deciduous forest (13 species). The other forest types within the Noyau central presented an average species number of 23 ± 1 (mean ± SE).
Chilopoda, Isopoda, Diplopoda and Isoptera
For the classes Isopoda, Diplopoda and Chilopoda and for the order Isoptera, the analysis was performed at the morphospecies level. Forty eight percent of all Diplopoda (27 species) were represented by only one species occurring in all forest types. Two of 14 species of Isopoda made up 52% of the total catch of this taxon. Only six species of Isoptera were sampled, with one species representing 96% of all specimens.
Arthropod diversity
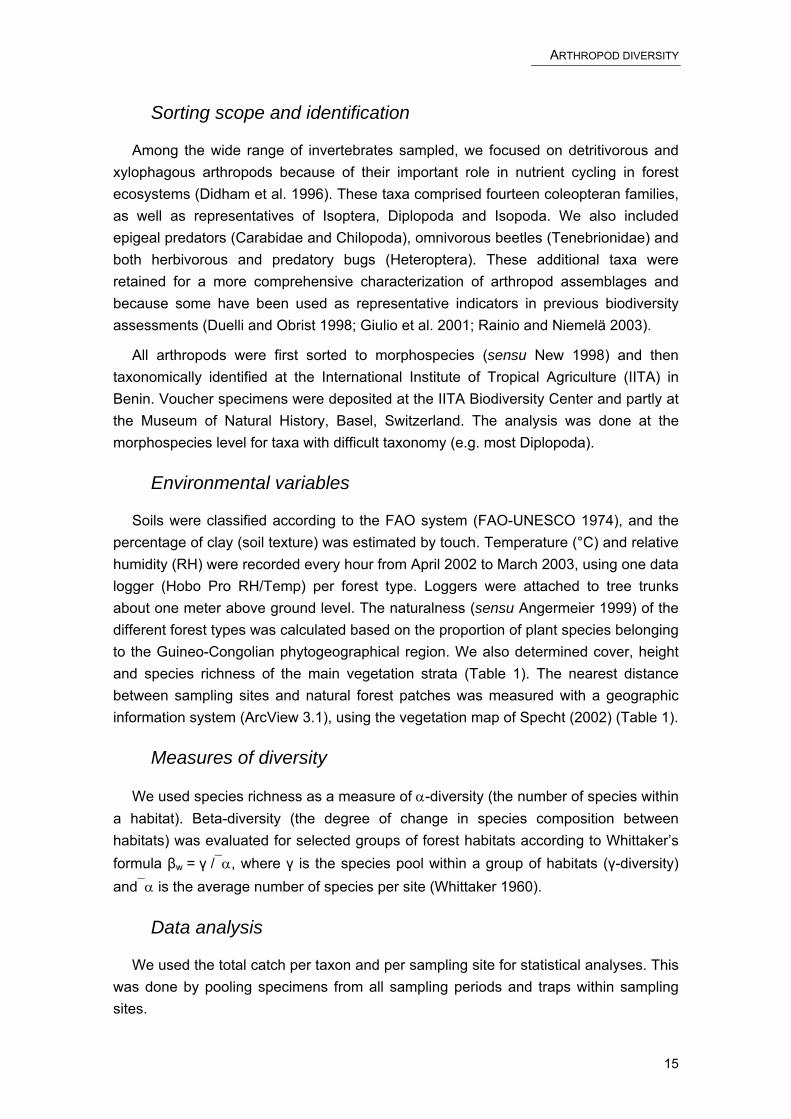
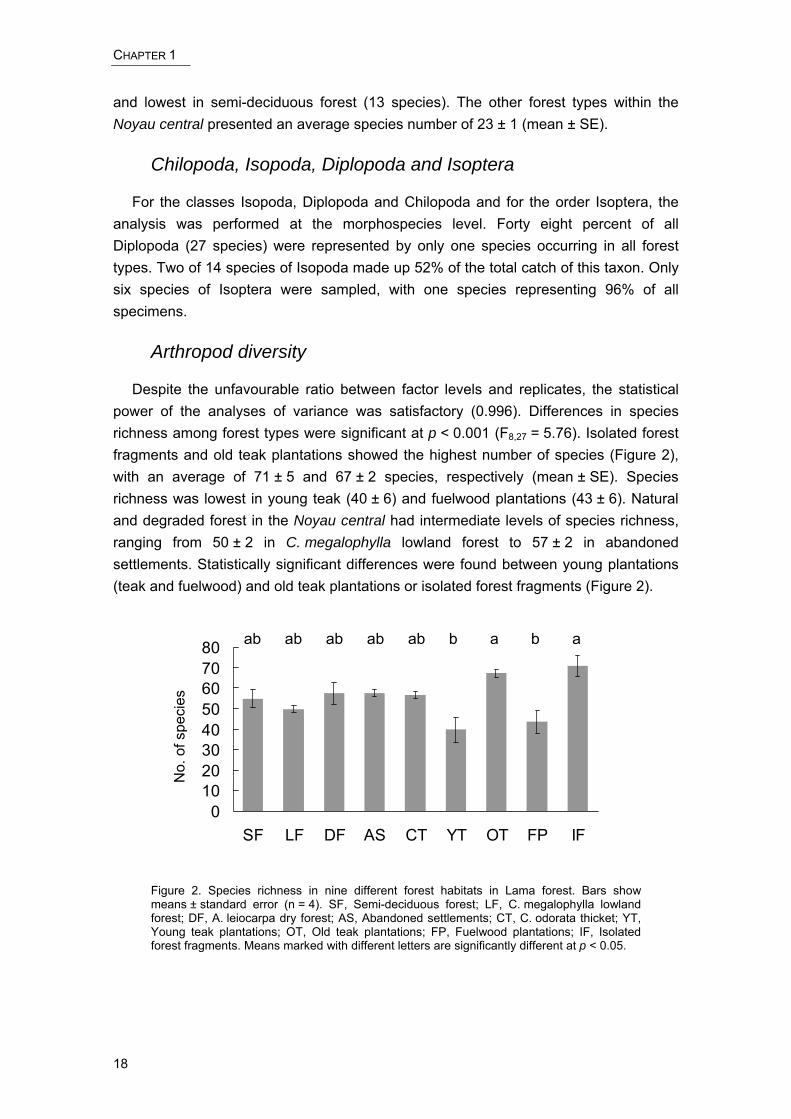
Despite the unfavourable ratio between factor levels and replicates, the statistical power of the analyses of variance was satisfactory (0.996). Differences in species richness among forest types were significant at p < 0.001 (F8,27 = 5.76). Isolated forest fragments and old teak plantations showed the highest number of species (Figure 2), with an average of 71 ± 5 and 67 ± 2 species, respectively (mean ± SE). Species richness was lowest in young teak (40 ± 6) and fuelwood plantations (43 ± 6). Natural and degraded forest in the Noyau central had intermediate levels of species richness, ranging from 50 ± 2 in C. megalophylla lowland forest to 57 ± 2 in abandoned settlements. Statistically significant differences were found between young plantations (teak and fuelwood) and old teak plantations or isolated forest fragments (Figure 2).
ab ab ab b ab ab b a a
01020304050607080
SF LF DF AS CT YT OT FP IF
No.
of s
peci
es
Figure 2. Species richness in nine different forest habitats in Lama forest. Bars show means ± standard error (n = 4). SF, Semi-deciduous forest; LF, C. megalophylla lowland forest; DF, A. leiocarpa dry forest; AS, Abandoned settlements; CT, C. odorata thicket; YT, Young teak plantations; OT, Old teak plantations; FP, Fuelwood plantations; IF, Isolated forest fragments. Means marked with different letters are significantly different at p < 0.05.
18

ARTHROPOD DIVERSITY
9
99
9
77
77
8 8
88
6
6
6
6
5
5
5
5
4
44
4
3
33
3
2
2
2
2
1
1
1
1
0 100 150 20050
0
100
150
200
50
DCA axis 1 [0.45]
DC
A a
xis
2 [0
.1]
Group 1
Group 3
Group 2
9
99
9
77
77
8 8
88
6
6
6
6
5
5
5
5
4
44
4
3
33
3
2
2
2
2
1
1
1
1
0 100 150 20050
0
100
150
200
50
DCA axis 1 [0.45]
DC
A a
xis
2 [0
.1]
9
99
9
77
77
8 8
88
6
6
6
6
5
5
5
5
4
44
4
3
33
3
2
2
2
2
1
1
1
1
0 100 150 20050
0
100
150
200
50
9
99
9
77
77
8 8
88
6
6
6
6
5
5
5
5
4
44
4
3
33
3
2
2
2
2
1
1
1
1
9
99
9
77
77
8 8
88
6
6
6
6
5
5
5
5
4
44
4
3
33
3
2
2
2
2
1
1
1
1
9
99
9
77
77
8 8
88
6
6
6
6
5
5
5
5
4
44
4
3
33
3
2
2
2
2
1
1
1
1
0 100 150 200500 100 150 20050
0
100
150
200
50
0
100
150
200
50
DCA axis 1 [0.45]
DC
A a
xis
2 [0
.1]
Group 1
Group 3
Group 2
Figure 3. Detrended correspondence analysis (DCA) of sampling sites in species space [proportion of variance]. Groups 1, 2 and 3 are defined by probability ellipses (p = 90%). 1, Semi-deciduous forest; 2, C. megalophylla lowland forest; 3, A. leiocarpa dry forest; 4, Abandoned settlements; 5, C. odorata thicket; 6, Young teak plantations; 7, Old teak plantations; 8, Fuelwood plantations; 9, Isolated forest fragments.
Beta-diversity of arthropod assemblages was computed for the three habitat (site) groups obtained by the DCA ordination (see below). Two of these groups (group one and three, Figure 3) contained two forest types each, including all old-growth forests, and one group (group two) the remaining forest types. Of these, we selected young teak and fuelwood plantations as representatives of young-growth forest. Because some groups comprised only three of the four replicate sites per forest type, we randomly excluded one replicate site of each complete sample to achieve an equal number of sites per group which is a prerequisite for comparing βw-diversity. Thus, each group contained three replicate sites of two different forest types (n = 6). Beta-diversity was very similar among these three groups of forest habitats, ranging from βw = 2.8 in group three (old teak plantations and isolated forest fragments) and βw = 3.1 in group two (young teak and fuelwood plantations) to βw = 3.2 in group one (semi-deciduous forest and C. megalophylla lowland forest).
19

CHAPTER 1
Arthropod assemblages
DCA of sampling sites in species space revealed three distinct groups of forest habitats: (1) natural forest, comprising semi-deciduous forest and C. megalophylla lowland forest, (2) degraded forest and young plantations, including A. leiocarpa dry forest, abandoned settlements, C. odorata thicket, young teak plantations (all but one site) and fuelwood plantations (all but one site), and (3) old teak plantations and isolated forest fragments (all but one site) (Figure 3).
The proportion of variance represented by the first axis of the DCA ordination was 0.45. Multiple regression identified two significant predictors of DCA axis one scores, soil texture and canopy height (F2,33 = 76.6, R2 = 0.823, p < 0.001). The regression equation is:
Axis 1 = 78.3 – 1.6 (PC) + 3.8 (CH),
where PC = Percentage of clay and CH = Canopy height; t-values for the partial regression coefficients were –9.0 (p < 0.001) and 3.6 (p = 0.001), respectively, indicating that soil texture was the major explanatory variable in this model.
The proportion of variance represented by the second axis was 0.10. DCA axis two scores were also best predicted by two variables only, naturalness and understorey cover (F2,33 = 49.7, R2 = 0.751, p < 0.001). For the second axis, the regression equation is:
Axis 2 = 26.8 + 2.3 (PG) – 0.6 (PU),
where PG = Percentage of Guineo-Congolian plant species and PU = Percentage of understorey vegetation cover; t-values for the partial regression coefficients were 10.0 (p < 0.001) and –3.3 (p = 0.002), respectively. Thus, naturalness was the more important explanatory variable.
The remaining environmental variables listed in Table 1 had no significant effect on the ordination scores.
Mantel tests revealed that arthropod assemblages of replicate sites within young teak and fuelwood plantations were not correlated with the distance to the nearest natural forest patches (rs = 0.436, p = 0.260 and rs = 0.533, p = 0.169, respectively).
Indicator species
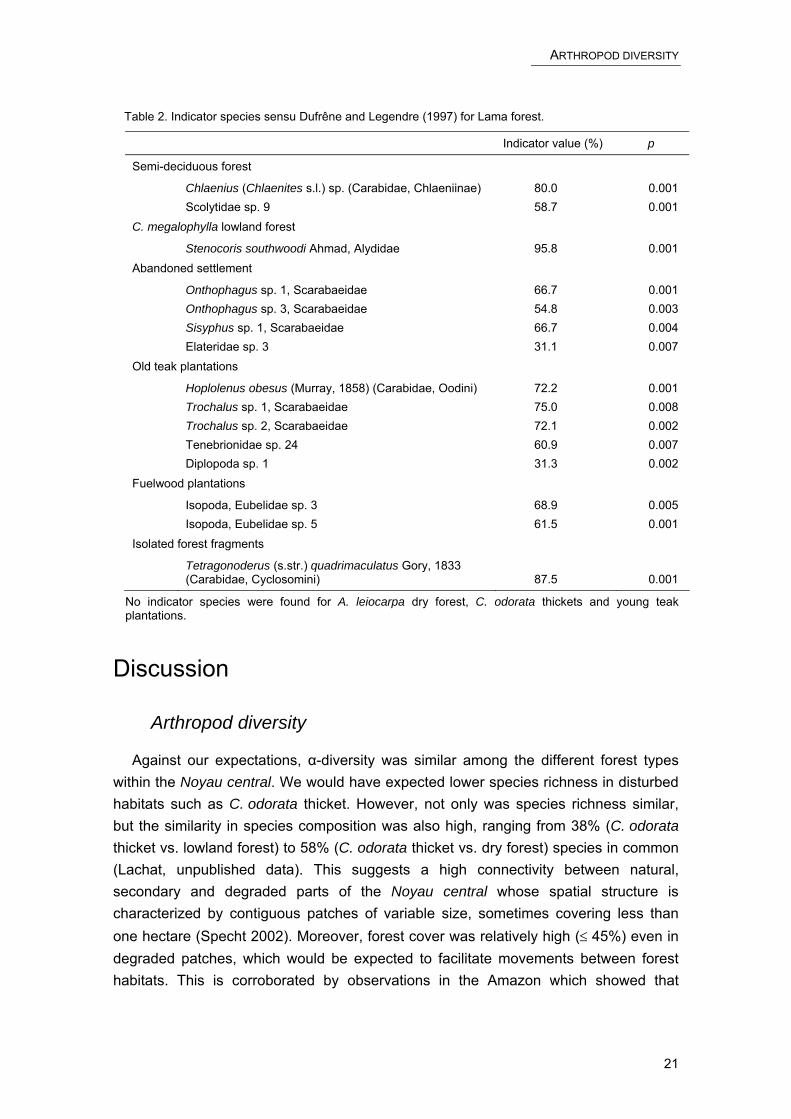
We identified 15 indicator species for six different forest habitats, ranging from one to five species per forest type (Table 2). No indicators were found for dry forest, C. odorata thicket and young teak plantations. The indicators included 11 species of Coleoptera, two species of Isopoda and one species each of Diplopoda and Heteroptera. Most indicator species were recorded for abandoned settlements (n = 4) and old teak plantations (n = 5).
20
ARTHROPOD DIVERSITY
Table 2. Indicator species sensu Dufrêne and Legendre (1997) for Lama forest.
Indicator value (%) p
Semi-deciduous forest
Chlaenius (Chlaenites s.l.) sp. (Carabidae, Chlaeniinae) 80.0 0.001 Scolytidae sp. 9 58.7 0.001 C. megalophylla lowland forest
Stenocoris southwoodi Ahmad, Alydidae 95.8 0.001 Abandoned settlement
Onthophagus sp. 1, Scarabaeidae 66.7 0.001 Onthophagus sp. 3, Scarabaeidae 54.8 0.003 Sisyphus sp. 1, Scarabaeidae 66.7 0.004 Elateridae sp. 3 31.1 0.007 Old teak plantations
Hoplolenus obesus (Murray, 1858) (Carabidae, Oodini) 72.2 0.001 Trochalus sp. 1, Scarabaeidae 75.0 0.008 Trochalus sp. 2, Scarabaeidae 72.1 0.002 Tenebrionidae sp. 24 60.9 0.007 Diplopoda sp. 1 31.3 0.002 Fuelwood plantations
Isopoda, Eubelidae sp. 3 68.9 0.005 Isopoda, Eubelidae sp. 5 61.5 0.001 Isolated forest fragments
Tetragonoderus (s.str.) quadrimaculatus Gory, 1833 (Carabidae, Cyclosomini) 87.5 0.001
No indicator species were found for A. leiocarpa dry forest, C. odorata thickets and young teak plantations.
Discussion
Arthropod diversity
Against our expectations, α-diversity was similar among the different forest types within the Noyau central. We would have expected lower species richness in disturbed habitats such as C. odorata thicket. However, not only was species richness similar, but the similarity in species composition was also high, ranging from 38% (C. odorata thicket vs. lowland forest) to 58% (C. odorata thicket vs. dry forest) species in common (Lachat, unpublished data). This suggests a high connectivity between natural, secondary and degraded parts of the Noyau central whose spatial structure is characterized by contiguous patches of variable size, sometimes covering less than one hectare (Specht 2002). Moreover, forest cover was relatively high (≤ 45%) even in degraded patches, which would be expected to facilitate movements between forest habitats. This is corroborated by observations in the Amazon which showed that
21
CHAPTER 1
secondary growth reduces the barrier effect of cleared forest for forest dung and carrion beetles (Klein 1989).
Our results confirm those of other studies that found no major difference in species richness of arthropod assemblages between primary forest and secondary and/or degraded (logged) forest (e.g. Nummelin and Hanski 1989; Holloway et al. 1992; Kalif et al. 2001).
Significant differences in species richness were found only among forest habitats outside of the Noyau central (Figure 2). Notably, species richness in old teak plantations was as high as in forest fragments and in the Noyau central, which demonstrates the importance of old teak for arthropod diversity conservation. The low species richness in young teak and fuelwood plantations came as no surprise. These forests are more exposed to silvicultural practices. Moreover, despite a fire exclusion strategy adopted by the forestry authorities, agricultural fires sometimes escape into young teak and fuelwood plantations.
Beta-diversity was similar between the three groups obtained by the DCA-ordination (natural forest, young plantations, old plantations and isolated forest fragments). Furthermore, βw-values were relatively high (2.8–3.2), compared to a theoretical minimum of βw = 1 (each species occurs on all sites) and a maximum of βw = 6 (each species occurs on one site only) for n = 6 sites per group. Beta-diversity ─ hence species turnover ─ increases with increasing spatial heterogeneity, resource selectivity and the diversity of refugia available to rare species (Stanton 1979; Deshmukh 1986). From a conservation point of view, high β-diversity implies that the preservation of diversity is most effective if habitats are protected entirely.
The importance of plantations for biodiversity conservation
Several modifications to the design and management of tropical plantations have been proposed that may enhance regional biodiversity without compromising economic benefits (reviewed in Lamb 1998). Among the various approaches, two are pertinent to Lama forest: the establishment of plantations in the vicinity of natural forest ─ which may act as a reservoir and source of forest species ─ and the development of understorey vegetation. The second option is only feasible for long-rotation sawlogs such as teak. The growth of understorey vegetation and a concomitant increase in biodiversity is enhanced by the selective harvesting of logs which creates gaps for plant colonization. In Lama forest, this process seems to be supported by the fire exclusion practice. Contrary to timber plantations, understorey development is unlikely in short-rotation forests such as fuelwood plantations (Lamb 1998). Fuelwood in Lama forest is harvested at an age of 20 years or less. These plantations obviously contribute less to biodiversity conservation, as reflected by the low species richness found in our study. Even though, the production of fuelwood itself may reduce the pressure on natural forest resources.
22
ARTHROPOD DIVERSITY
The evidence provided in the present study shows that old teak plantations are important habitats for forest species. This is supported by the presence of typical forest specialists such as Paussus excavatus, P. liber and P. bicornis (Carabidae, Paussinae). Similar observations were made in mature plantations of endemic hardwood in Cameroon where butterfly assemblages were undistinguishable from those found in natural forest (Stork et al. 2003). An elevated arthropod diversity in old plantations may have consequences not only from a biodiversity conservation but also from a pest management perspective. A high degree of naturalness and/or close distance to natural forest may benefit natural enemies of forest pests, thereby reducing the risk of infestations of plantation forests (Speight and Wylie 2001).
The distance between natural forest and sampling sites in young teak plantations varied from 0.2 to 2.2 km, and the distance to sampling sites in fuelwood plantations from 4.3 to 5.7 km. Thus, one might hypothesise that assemblages within plantations differ depending on their distance to the nearest natural forest patch. Yet, a border effect was dismissed on the basis of the Mantel tests performed, suggesting that plantations adjacent to the Noyau central may act as dispersal corridors. However, our study design was not conceived to monitor movement pathways between forest patches.
Influence of environmental variables on arthropod assemblages
Arthropod assemblages in the different forest types were most strongly related to soil type (DCA axis 1), a natural site character, and to naturalness of the vegetation (DCA axis 2), an indicator of disturbance. The other two statistically significant explanatory variables were canopy height (DCA axis 1) and understorey cover (DCA axis 2), representing disturbance indicators related to land use and management.
Soil may have influenced arthropod assemblages in two ways. First, the prevailing vertisols show distinct seasonal swelling-shrinking cycles. During the dry season, they harden and form deep cracks. In the rainy season, they are saturated with water, leading to flooding in depressions. This in turn might reduce the habitat available to epigeal species not tolerating temporary flooding, forcing them to retreat to mounds of the so-called gilgai micro relief (irregular land surface with alternating mounds and depressions in areas with vertisol). To the contrary, physical properties of the sandy ferralsols in old teak plantations and isolated forest fragments do not change dramatically between seasons, and the soil may offer suitable habitats throughout the year. Second, soil influences arthropods indirectly by affecting the vegetation. However, ordination of our vegetation data did not clearly segregate plant associations of forests stocking on vertisol and ferralsol (Djego, unpublished data), suggesting that soil type had a more pronounced influence on arthropod assemblages than on plant associations.
The importance of soil as a co-determinant of arthropod assemblages was also evidenced by the sites plotted outside of the corresponding probability ellipses in the
23
CHAPTER 1
DCA ordination (Figure 3). For example, the soil of one of the fuelwood plantation sites (label 8) was a sandy vertisol. This site plotted next to group three which also comprised sites on ferralsol. Likewise, the only isolated forest fragment (label 9) located on vertisol ─ and being embedded in a matrix of young teak plantations ─ was plotted together with group two sites, all of which shared the same soil.
The remaining environmental predictors of arthropod assemblages in Lama forest (naturalness, canopy height, understorey vegetation cover) are related to land use and silvicultural practices. Naturalness is an indicator of human disturbance (clearing for agriculture, conversion to plantation forests and other land uses). Highly disturbed parts of Lama forest have a higher proportion of plant species with wide (sometimes pantropical) distribution, while Guineo-Congolian species dominate in less disturbed parts. Naturalness increases not only from degraded to natural forest, but also from young to old plantations. Unfortunately, little is known about the biogeography of the arthropod species sampled, which makes it difficult to define geographic types and to draw parallels with phytogeographic types.
Canopy height reflects a succession towards old-growth forest. The tallest canopy trees were found in old teak plantations and isolated forest fragments (c.f., Table 1). The similarity in vegetation structure may have contributed to the high similarity of arthropod assemblages among these forests.
The development of understorey vegetation is a characteristic of old-growth stands (Lamb 1998). However, understorey cover in Lama forest was highly variable within and among the different forest types (Table 1) and should therefore be interpreted with caution. For example, disturbed, open-canopy forests were often dominated by uniform C. odorata thicket, whereas a diversity of native, shade-tolerant plants prevailed in closed-canopy forests (Djego, unpublished data). Thus, understorey cover alone appears to be an insufficient predictor of arthropod assemblages, but together with naturalness it defines environmental conditions relevant to their composition.
Edge effects in old teak plantations and isolated forest
fragments
In contrast to other studies (Didham et al. 1998; Barbosa and Marquet 2001), the highest species richness was encountered in isolated forest fragments and old teak. Moreover, the similarity of arthropod assemblages was high, despite long distances among replicate sites (16–19 km).
Another common trait of these forest types ─ apart from soil type and naturalness ─ is their adjacency to open country (degraded savannah and/or cropland). Forest edges are likely to attract arthropods from open landscape as well as forest, thereby increasing overall species richness (Laurance et al. 2002). Some forest species may even increase in abundance near edges, in particular those adapted to the microclimate prevailing in open forest or treefall gaps (Kapos 1989; Laurance et al.
24

ARTHROPOD DIVERSITY
2002). Such edge effects ─ along with the combined effect of the four environmental explanatory variables ─ may explain the high diversity and distinctiveness of arthropod assemblages in old teak plantations and isolated forest fragments.
Indicator species
Indicator species have been defined as taxa that “mirror changes in a wider array of groups as a consequence of environmental change” or that “reflect overall diversity and complexity of an assemblage” (New 1998). The idea to focus on indicator species is also owed to limitations in processing and identifying the huge numbers of samples typically collected during invertebrate surveys. The four most important criteria for choosing invertebrate indicators are that they have a well known taxonomy and ecology, are accessible to sampling and respond to environmental changes (New 1998). Strictly speaking, none of the species identified in the present study fulfils all of these criteria. At this initial stage of research, they are therefore simply considered as species characteristic of certain forest habitats. Their role as indicators of successional changes requires validation in future monitoring programmes.
Notably, the highest numbers of indicators were found in abandoned settlements and old teak plantations. This can be interpreted as an indication of the importance of these two forest types to regional biodiversity.
Taxonomically, most species belong to the family Scarabaeidae (chafers, Melolonthinae, and dung beetles, Scarabaeinae). Dung beetles have often been used as indicators because of their reliance on vertebrate dung or carrion and their sensitivity to habitat disturbance (Klein 1989; Nummelin and Hanski 1989; Hill 1995). Carabidae are also well represented. While being common indicators in temperate ecosystems, their suitability for tropical forests is as yet not well established (Rainio and Niemelä 2003).
Conclusions
This study provides a first overview of the arthropod diversity in Lama forest reserve, one of the last and largest vestiges of natural forest in southern Benin, and highlights its importance for biodiversity conservation. No differences in arthropod species richness were found among habitats within the Noyau central, a small-scale mosaic of natural and degraded forest. However, great differences were observed among forest plantations separating the Noyau central from the matrix of agricultural land. We identified four environmental variables as significant predictors of arthropod assemblages. Of these, soil type is a natural factor promoting high species richness in old plantations and isolated forest fragments. The remaining variables naturalness, understorey cover and canopy height are related to silvicultural practices and are therefore amenable to an improved, conservation-oriented forest management. To
25
CHAPTER 1
enhance arthropod diversity in Lama forest, we propose that management practices should aim to encourage the development of species-rich understorey vegetation of the Guineo-Congolian phytogeographical region. Animals higher up the food chain, in particular insectivorous reptiles, birds and mammals, may also benefit from increased arthropod diversity. In this respect, arthropod conservation is not an end in itself but a contribution to overall biodiversity conservation.
Acknowledgements
This study was funded by the Swiss National Science Foundation and the Swiss Agency for Development and Cooperation. It was carried out in the framework of the project BioLama. We thank all BioLama staff for their support, especially M. Guedegbé, C. Houngbedji, L. Konetche and D. Weibel. We are grateful to P. Houayé, R. Akossou, D. Honfozo, H. Hodonou and A. V. N'velin of the Office National du Bois for their backing, to G. Altherr for statistical help and to C. Schmid for the determination of Isopoda. Further, J. Refisch and two anonymous referees are acknowledged for helpful comments on an earlier version of this article.
References
Angermeier P. L. 1999. The natural imperative for biological conservation. Conservation Biology 14: 373-381.
Ashton P. M. S., Gunatilleke C. V. S. and Gunatilleke I. A. U. N. 1993. A shelterwood method of regeneration for sustained timber production in Mesua-Shorea forest of Southwest Sri Lanka. In: Erdelen W., Preu C., Ishwaran C. M. and Bandara M. (eds), Ecology and Landscape Management in Sri Lanka, pp. 255-274. Margraf Verlag, Weikersheim.
Attignon S. E., Weibel D., Lachat T., Sinsin B., Nagel P. and Peveling, R. 2004. Leaf litter breakdown in natural and plantation forests of the Lama forest reserve in Benin. Applied Soil Ecology, in press.
Ballouche A., Akoègninou A., Neumann K., Salzmann U. and Sowunmi M. A. 2000. Le projet "Dahomey Gap": une contribution à l'histoire de la végétation au Sud-Bénin et Sud-Ouest du Nigeria. Berichte des Sonderforschungsbereichs 268: 237-251.
Barbosa O. and Marquet P. A. 2001. Effects of forest fragmentation on the beetle assemblage at the relict forest of Fray Jorge, Chile. Oecologia 132: 296-306.
Chao A., Ma M.-C. and Yang M. C. K. 1993. Stopping rules and estimation for recapture debugging with unequal failure rates. Biometrica 80: 193-201.
Colwell R. K. 1997. EstimateS: Statistical estimation of species richness and shared species from samples. http://viceroy.eeb.uconn.edu/estimates.
26
ARTHROPOD DIVERSITY
Davis A. J., Holloway J. D., Huijbregts H, Krikken J., Kirk-Spriggs A. H. and Sutton S. L. 2001. Dung beetles as indicators of change in the forests of northern Borneo. Journal of Applied Ecology 38: 593-616.
Deshmukh, I. 1986. Ecology and tropical biology. Blackwell Scientific Publications, Boston.
Didham R. K., Ghazoul J., Stork N. E. and Davis A. J. 1996. Insects in fragmented forests: a functional approach. Tree 11: 255-260.
Didham R. K., Hammond P. M., Lawton J. H., Eggleton P. and Stork N. E. 1998. Beetle species responses to tropical forest fragmentation. Ecological Monographs 68: 295-323.
Duelli P. and Obrist M. K. 1998. In search of the best correlates for local organismal biodiversity in cultivated areas. Biodiversity and Conservation 7: 297-309.
Dufrêne M. and Legendre P. 1997. Species assemblages and indicator species: the need of a flexible asymmetrical approach. Ecological Monographs 67: 345-366.
Eggleton P., Bignell D. E., Hauser S., Dibog L., Norgrove L. and Madong B. 2002. Termite diversity across an anthropogenic disturbance gradient in the humid forest zone of West Africa. Agriculture, Ecosystems and Environment 90: 189-202.
Elliott S., Blakesley D. and Anusaransunthron V. 1998. Forests for the future ─ Growing and planting native trees for restoring forest ecosystems. Forest Restoration Research Unit, Chiang Mai University, Chiang Mai.
FAO. 2000. Global forest resources assessment 2000, Main report, Rome.
FAO. 2001. State of the world's forests 2001, Rome.
FAO-UNESCO. 1974. Map of the World, Paris.
Fermon, H. Schulze C. H., Waltert M. and Mühlenberg M. 2001. The butterfly fauna of the Noyau central, Lama Forest (Republic of Benin), with notes on its ecological composition and geographic distribution. African Entomology 9: 177-185.
Gemerden B. S. V., Shu G. N. and Olff H. 2003. Recovery of conservation values in Central African rain forest after logging and shifting cultivation. Biodiversity and Conservation 12: 1553-1570.
Giulio M. D., Edwards P. J. and Meister E. 2001. Enhancing insects in agricultural grasslands: the roles of management and landscape structure. Journal of Applied Ecology 38: 310-319.
Goodman S. M., Rakotondravony D., Schatz G. and Wilmé L. 1996. Species richness of forest-dwelling birds, rodents and insectivores in a planted forest of native trees: a test case from Ankaratra, Madagascar. Ecotropica 2: 109-120.
Hill C. J. 1995. Linear strips of rain forest vegetation as potential dispersal corridors for rain forest insects. Conservation Biology 9: 1559-1566.
Hill M. O. and Gauch H. G. J. 1980. Detrended correspondance analysis: an improved ordination technique. Vegetatio 42: 47-58.
Holloway J. D., Kirk-Spriggs A. H. and Khen C. V. 1992. The response of some rain forest insect groups to logging and conversion to plantation. In: Marshall A. G. and. Swaine M.
27
CHAPTER 1
D. (eds), Tropical Rain Forest: Disturbance and Recovery. Philosophical Transactions of the Royal Society of London Series B 335: 425-436.
Jennrich R. I. and Turner F. B. 1969. Measurement of non-circular home range. Journal for Theoretical Biology 22: 227-237.
Kalif K. A. B., Azevedo-Ramos C., Moutinho P. and Malcher S. A. O. 2001. The effect of logging on the ground-foraging ant community in eastern Amazonia. Studies on Neotropical Fauna and Environment 36: 1-5.
Kapos V. 1989. Effects of isolation on the water status of forest patches in the Brazilian Amazon. Journal of Tropical Ecology 5: 173-185.
Klein B. 1989. Effects of forest fragmentation on dung and carrion beetle communities in central Amazonia. Ecology 70: 1715-1725.
Lamb D. 1998. Large-scale ecological restoration of degraded tropical forest lands: the potential role of timber plantations. Restoration Ecology 6: 271-279.
Laurance W. F., Lovejoy T. E., Vasconcelos H. L., Bruna E. M., Didham R. K., Stouffer P. C., Gascon C., Bierregaard R. O., Laurance S. G. and Sampaio E. 2002. Ecosystem decay of Amazonian forest fragments: a 22-year investigation. Conservation Biology 16: 605-618.
Lawton J. H., Bignell D. E., Bolton B., Bloemers G. F., Eggleton P., Hammond P. M., Hodda M., Holt R. D., Larsen T. B., Mawdsley N. A., Stork N. E., Srivastava D. S. and Watt A. D. 1998. Biodiversity inventories, indicator taxa and effects of habitat modification in tropical forest. Nature 391: 72-76.
Lee S.-M. and Chao A. 1994. Estimating population size via sample coverage for closed capture-recapture models. Biometrics 50: 88-97.
Mantel N. 1967. The detection of disease clustering and a generalized regression approach. Cancer Research 27: 209-221.
McCune B. and Mefford M. J. 1999. PC-ORD: Multivariate Analysis of Ecological Data. MjM Software Design, Gleneden Beach, Oregon.
Mühlenberg M. 1993. Freilandökologie. UTB für Wissenschaft. Quelle und Meyer Heidelberg, Wiesbach.
Myers N., Mittermeier R. A., Mittermeier C. G., d. Fonseca G. A. B. and Kent J. 2000. Biodiversity hotspots for conservation priorities. Nature 403: 853-858.
New T. R. 1998. Invertebrate Surveys for Conservation. Oxford University Press, Oxford.
Nummelin M. and Hanski I. 1989. Dung beetles of the Kibale Forest, Uganda; comparison between virgin and managed forests. Journal of Tropical Ecology 5: 349-352.
Rainio J. and Niemelä J. 2003. Ground beetles (Coleoptera: Carabidae) as bioindicators. Biodiversity and Conservation 12: 487-506.
Sayer J. A., Harcourt C. S. and Collins N. M. 1992. The Conservation Atlas of Tropical Forests. Africa. IUCN, New York.
Southwood T. R. E. 1978. Ecological Methods: with particular reference to the study of insect population. Chapman and Hall, London, New-York.
28

ARTHROPOD DIVERSITY
Specht I. 2002. La forêt de la Lama, Bénin ─ SIG basé sur Landsat 7. Opuscula Biogeographica Basileensia 2, Basel, Switzerland.
Speight M. R. and Wylie F. R. 2001. Insect Pests in Tropical Forestry. CABI Publishing, Oxford, Brisbane.
Stanton, N. L. 1979. Patterns of species diversity in the temperate and tropical litter mites. Ecology 60: 295-304.
Stork N. E., Srivastava D. S., Watt A. D. and Larsen T. B. 2003. Butterfly diversity and silvicultural practice in lowland rainforests of Cameroon. Biodiversity and Conservation 12: 387-410.
Townes H. 1972. A light-weight malaise trap. Entomological News 83: 239-247.
Tucker N. and Murphy T. 1997. The effect of ecological rehabilitation on vegetation recruitment: some observations from the wet tropics of North Queensland. Forest Ecology and Management 99: 133-152.
Vasconcelos H. L., Vilhena J. M. S. and Caliri G. J. A. 2000. Responses of ants to selective logging of a central Amazonian forest. Journal of Applied Ecology 37: 508-514.
Watt A. D., Stork N. E., McBeeath C. and Lawson G. L. 1997. Impact of forest management on insect abundance and damage in a lowland tropical forest in southern Cameroon. Journal of Applied Ecology 34: 985-998.
White F. 1983. The Vegetation of Africa. UNESCO, Paris.
Wilkening A. J., Foltz J. L., Atkinson T. H. and Connor M. D. 1981. An omnidirectional flight trap for ascending and descending insects. The Canadian Entomologist 113: 453-455.
Whittaker R. H. 1960. Vegetation of the Siskiyou Mountains, Oregon and California. Ecological Monographs 30: 279-338.
Zapfack L., Engwald S., Sonke B., Achoundong G. and Madong B. A. 2002. The impact of land conversion on plant biodiversity in the forest zone of Cameroon. Biodiversity and Conservation 11: 2047-2061.
Zar J. H. 1999. Biostatistical Analysis. Pearson Education, New Jersey.
29

CHAPTER 2 – PRIMARY ATTRACTION OF BEETLES TO FRESHLY CUT WOOD
Primary attraction of beetles to native and exotic tree
species in natural and plantation forests
in Lama forest reserve, Benin
Thibault Lachat, Brice Sinsin, Serge Attignon, Georg Goergen, Ralf Peveling and Peter Nagel
Manuscript
Wood-associated beetles have evolved specialised foraging techniques to rapidly locate and colonize suitable host substrate. Many species rely on olfactory stimuli such as volatiles released by dead or injured wood. We studied the primary attraction of beetles to freshly cut wood in natural forest and teak plantations of the Lama forest reserve in Benin, West Africa, using a newly designed bait trap (twin-Malaise trap). Traps were baited for four weeks with the native tree species Dialium guineense or Antiaris africana and with the exotic plantation species Tectona grandis, or they were left unbaited. We found six beetle species showing primary attraction (species whose relative abundance was higher in baited than in unbaited traps), and two species showing primary repulsion (species whose relative abundance was higher in unbaited than in baited traps). Three species preferred native wood over teak, but none teak over native wood. Different beetles showed different temporal patterns in relative abundance, reflecting different sensitivities to injured or recently dead wood volatiles. Moreover, primary attraction differed depending on whether the bait wood was offered in natural forest or teak plantations, indicating an effect of forest type on colonisation patterns. Among the beetles attracted to teak logs, we found no pest species of economic importance.
Key words: Saproxylic beetles, Native and exotic trees, Natural forest, Plantations, Primary attraction, Twin-Malaise trap, Wood decomposition
31

CHAPTER 2
Introduction
The decomposition of dead wood is a slow process, starting immediately after a tree or part of it has died. The causes for the death of trees are manifold, including natural mortality and natural or anthropogenic disturbances such as windstorm, fire, diseases, or logging and forest clearing activities. Wood-boring beetles are pioneers of wood decay. By boring and tunnelling the wood, they create important infection courts for wood-rotting fungi and provide access into the wood to other wood-boring and -dwelling insects (McIntosh et al. 2001). In a companion study conducted in the Lama forest reserve in Benin, we found an extraordinary diversity of dead wood-associated (saproxylic) beetle assemblages on dead wood of all decay stages (Chapter 3). However, little is known about the first colonizers of dead wood in Lama forest or in other tropical forests. Understanding processes and biological clues governing the colonisation of dead wood by beetles is not only of scientific interest but also of importance in tropical forestry.
Recently dead or severely stressed trees release higher amounts of volatile chemicals than live and healthy ones, and these volatiles may act as kairomones attracting wood-boring beetles (Byers 1996). Unless responding to pheromones emitted by conspecifics that have already colonized a dead wood resource, beetles follow two different strategies to find and select their substrate, primary attraction or random attack. Species following the primary attraction strategy select dead wood prior to landing. This selection behaviour is initiated by olfactory and visual stimuli (Byers 1996) and requires the ability to detect suitable dead wood in flight (Tunset et al. 1993). For species following the random attack strategy, dead wood encounters are by chance, and only after landing – and possibly feeding – the resource is accepted or rejected as a host substrate (Brattli et al. 1998; Tunset et al. 1993).
De Groot and Nott (2001) suggested that many saproxylic beetles rely mainly on visual cues such as dark silhouettes for host finding. In contrast, Barata and Araújo (2001) found that cerambycid beetles do not respond to visual stimuli unless associated with olfactory stimuli (dead wood volatiles).
In the present study, we investigated the attraction of native and exotic, freshly cut wood for colonizer beetles (pioneers). Our aims were to test primary attraction and host tree selection of beetles in two different forest types (natural and plantation forests) within the Lama forest reserve, and to determine ecological traits of potential pest species.
32
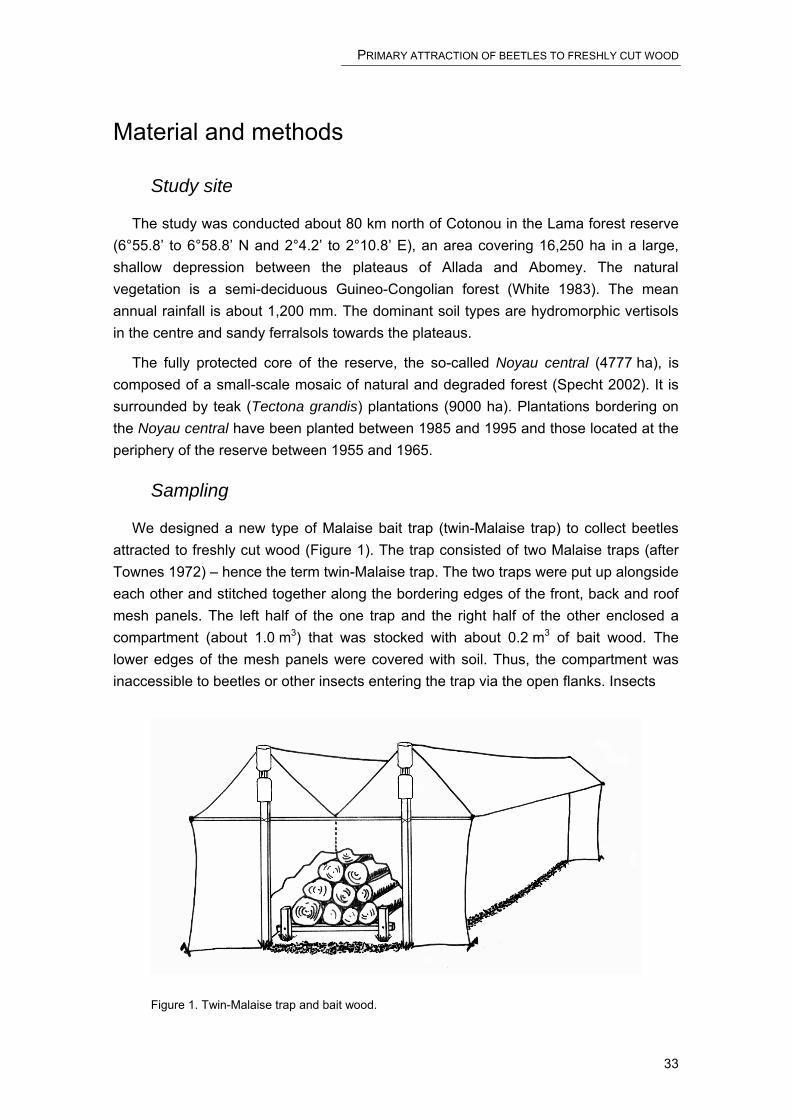
PRIMARY ATTRACTION OF BEETLES TO FRESHLY CUT WOOD
Material and methods
Study site
The study was conducted about 80 km north of Cotonou in the Lama forest reserve (6°55.8’ to 6°58.8’ N and 2°4.2’ to 2°10.8’ E), an area covering 16,250 ha in a large, shallow depression between the plateaus of Allada and Abomey. The natural vegetation is a semi-deciduous Guineo-Congolian forest (White 1983). The mean annual rainfall is about 1,200 mm. The dominant soil types are hydromorphic vertisols in the centre and sandy ferralsols towards the plateaus.
The fully protected core of the reserve, the so-called Noyau central (4777 ha), is composed of a small-scale mosaic of natural and degraded forest (Specht 2002). It is surrounded by teak (Tectona grandis) plantations (9000 ha). Plantations bordering on the Noyau central have been planted between 1985 and 1995 and those located at the periphery of the reserve between 1955 and 1965.
Sampling
We designed a new type of Malaise bait trap (twin-Malaise trap) to collect beetles attracted to freshly cut wood (Figure 1). The trap consisted of two Malaise traps (after Townes 1972) – hence the term twin-Malaise trap. The two traps were put up alongside each other and stitched together along the bordering edges of the front, back and roof mesh panels. The left half of the one trap and the right half of the other enclosed a compartment (about 1.0 m3) that was stocked with about 0.2 m3 of bait wood. The lower edges of the mesh panels were covered with soil. Thus, the compartment was inaccessible to beetles or other insects entering the trap via the open flanks. Insects
Figure 1. Twin-Malaise trap and bait wood.
33

CHAPTER 2
were collected in two 0.25 L vials at the top of each of the two front gables, using a 0.5% formaldehyde preservative with a few drops of liquid detergent to lower the surface tension. During the experiments, the vials were emptied weekly.
Bait wood
The bait wood was cut from healthy trees outside of Lama forest reserve a few hours before installing the traps. The logs were one meter long and had a diameter between 5 cm and 25 cm. The logs were piled up on a support rack (10 cm above the ground) in the bait wood compartment of the twin-Malaise trap. We used bait wood from one plantation (exotic) and two native tree species. The exotic species was Tectona grandis (Verbenaceae), a species introduced from tropical Asia and widely cultivated in West Africa. In Lama forest, it is the dominant plantation tree. The indigenous species included Dialium guineense (Caesalpiniaceae) and Antiaris africana (Moraceae). D. guineense is the most common and widespread tree in West-African semi-deciduous forest. The tree is to 20 m high, but may also grow as a shrub (Keay 1989). Densities in Lama forest have been estimated at 205 stems ha-1 (≥ 10 cm diameter at breast height) (Emrich et al. 1999). Antiaris africana (Moraceae) is a tree of lowland rainforest and outlier forest in the savannah regions to 40 m high. In Lama forest, it is a common yet widely scattered tree. Along with Afzelia africana and kapok (Ceiba pentandra), Antiaris africana is one of the tallest trees in the reserve (Paradis and Houngnon 1977).
Experimental design
We selected four sites each in tracts of natural forest in the Noyau central and in old-growth teak plantations. At each site, two baited traps and one unbaited control trap were installed in random order along an axis oriented North-South. A minimum distance of 10 m between traps was maintained to reduce neighbour effects. Two independent four-week experiments were conducted, hereafter referred to as experiment I and II, respectively.
Experiment I
Experiment I was carried out from 9 April to 7 May 2003. At each site, one trap was baited with freshly cut logs from T. grandis, a second one with logs from D. guineense, and a third one was left unbaited.
Experiment II
The same sites and traps were used in the second experiment which lasted from 14 May to 11 June 2003. The traps were re-baited in a similar fashion as in the first experiment, using logs from T. grandis and A. africana. Treatments were allocated to traps at random.
34
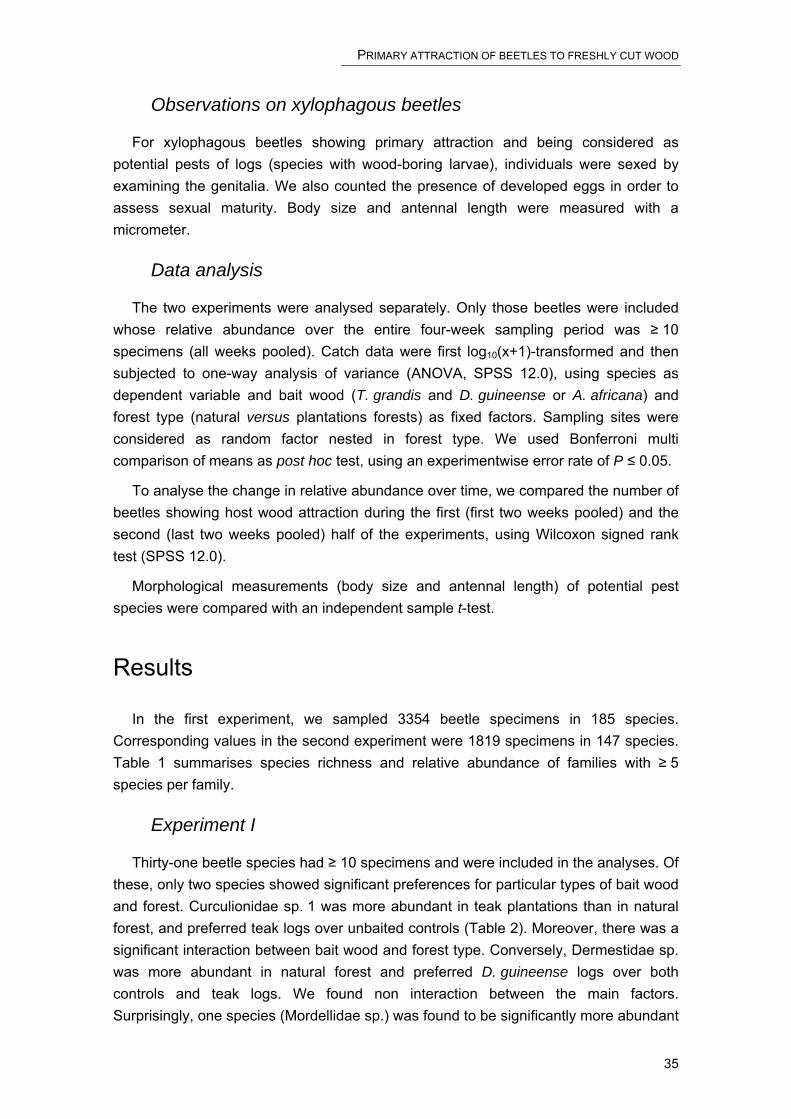
PRIMARY ATTRACTION OF BEETLES TO FRESHLY CUT WOOD
Observations on xylophagous beetles
For xylophagous beetles showing primary attraction and being considered as potential pests of logs (species with wood-boring larvae), individuals were sexed by examining the genitalia. We also counted the presence of developed eggs in order to assess sexual maturity. Body size and antennal length were measured with a micrometer.
Data analysis
The two experiments were analysed separately. Only those beetles were included whose relative abundance over the entire four-week sampling period was ≥ 10 specimens (all weeks pooled). Catch data were first log10(x+1)-transformed and then subjected to one-way analysis of variance (ANOVA, SPSS 12.0), using species as dependent variable and bait wood (T. grandis and D. guineense or A. africana) and forest type (natural versus plantations forests) as fixed factors. Sampling sites were considered as random factor nested in forest type. We used Bonferroni multi comparison of means as post hoc test, using an experimentwise error rate of P ≤ 0.05.
To analyse the change in relative abundance over time, we compared the number of beetles showing host wood attraction during the first (first two weeks pooled) and the second (last two weeks pooled) half of the experiments, using Wilcoxon signed rank test (SPSS 12.0).
Morphological measurements (body size and antennal length) of potential pest species were compared with an independent sample t-test.
Results
In the first experiment, we sampled 3354 beetle specimens in 185 species. Corresponding values in the second experiment were 1819 specimens in 147 species. Table 1 summarises species richness and relative abundance of families with ≥ 5 species per family.
Experiment I
Thirty-one beetle species had ≥ 10 specimens and were included in the analyses. Of these, only two species showed significant preferences for particular types of bait wood and forest. Curculionidae sp. 1 was more abundant in teak plantations than in natural forest, and preferred teak logs over unbaited controls (Table 2). Moreover, there was a significant interaction between bait wood and forest type. Conversely, Dermestidae sp. was more abundant in natural forest and preferred D. guineense logs over both controls and teak logs. We found non interaction between the main factors. Surprisingly, one species (Mordellidae sp.) was found to be significantly more abundant
35
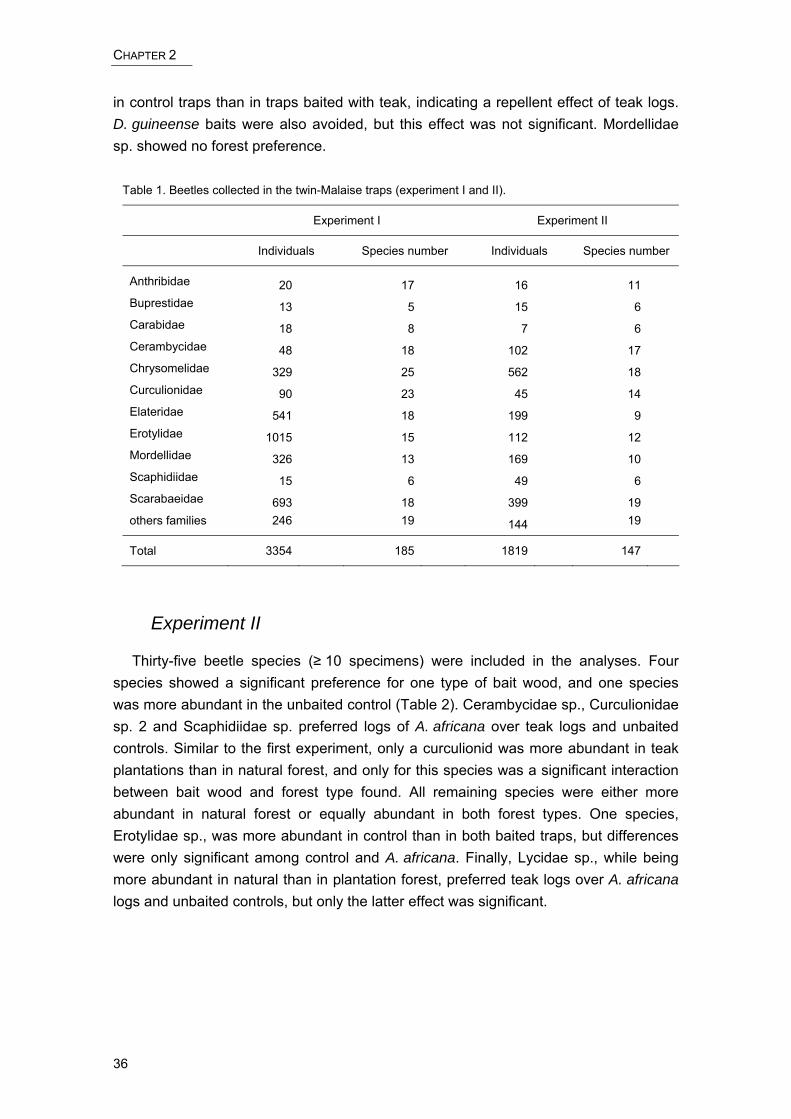
CHAPTER 2
in control traps than in traps baited with teak, indicating a repellent effect of teak logs. D. guineense baits were also avoided, but this effect was not significant. Mordellidae sp. showed no forest preference.
Table 1. Beetles collected in the twin-Malaise traps (experiment I and II).
Experiment I Experiment II
Individuals Species number Individuals Species number
Anthribidae 20 17 16 11
Buprestidae 13 5 15 6
Carabidae 18 8 7 6
Cerambycidae 48 18 102 17
Chrysomelidae 329 25 562 18
Curculionidae 90 23 45 14
Elateridae 541 18 199 9
Erotylidae 1015 15 112 12
Mordellidae 326 13 169 10
Scaphidiidae 15 6 49 6
Scarabaeidae 693 18 399 19
others families 246 19 144 19
Total 3354 185 1819 147
Experiment II
Thirty-five beetle species (≥ 10 specimens) were included in the analyses. Four species showed a significant preference for one type of bait wood, and one species was more abundant in the unbaited control (Table 2). Cerambycidae sp., Curculionidae sp. 2 and Scaphidiidae sp. preferred logs of A. africana over teak logs and unbaited controls. Similar to the first experiment, only a curculionid was more abundant in teak plantations than in natural forest, and only for this species was a significant interaction between bait wood and forest type found. All remaining species were either more abundant in natural forest or equally abundant in both forest types. One species, Erotylidae sp., was more abundant in control than in both baited traps, but differences were only significant among control and A. africana. Finally, Lycidae sp., while being more abundant in natural than in plantation forest, preferred teak logs over A. africana logs and unbaited controls, but only the latter effect was significant.
36

PRIMARY ATTRACTION OF BEETLES TO FRESHLY CUT WOOD
Tabl
e 2.
Attr
acte
d be
etle
spe
cies
to fr
eshl
y cu
t woo
d in
Lam
a fo
rest
At
tract
ion
(F-v
alue
, df =
2)
Bait
woo
d se
lect
ion
Perc
ent o
f ind
ivid
uals
by
tree
spec
ies
Fore
st ty
pe
(F-v
alue
, df =
1)
Fore
st p
refe
renc
e Ba
it w
ood*
fore
st ty
pe
(F-V
alue
, df =
2)
Expe
rimen
t I
T. g
rand
is
D. g
uine
ense
C
ontr
ol
Cur
culio
nida
e sp
. 1
(29
ind.
) 7.
8**
72
a
28
ab
0
b
7.9*
Teak
pla
ntat
ions
5.
0*
Der
mes
tidae
sp.
(1
0 in
d.)
7.8*
*
10 b
80 a
10 b
11.3
*
Nat
ural
fore
st
3.2
Mor
dellid
ae s
p.
(35
ind.
) 5.
0*
4 b
27 a
b
69 a
1.0
N
one
0.8
Expe
rimen
t II
T. g
rand
is
A. a
fric
ana
Con
trol
Cer
amby
cida
e sp
. (6
2 in
d.)
21.6
**
2
b
98 a
0 b
0.
6
Non
e 0.
3
Cur
culio
nida
e sp
. 2
(11
ind.
) 4.
4*
20
ab
80
a
0
b
6.7*
Teak
pla
ntat
ion
4.4*
Erot
ylid
ae s
p.
(18
ind.
) 5.
6*
17
ab
22
b
61
a
1.
9
Non
e 0.
4
Lyci
dae
sp.
(46
ind.
) 5.
2*
67
a
30
ab
3
b
15.0
**
N
atur
al fo
rest
2.
9
Scap
hidi
idae
sp.
(2
5 in
d.)
5.3*
8 b
84
a
8
b
9.8*
Nat
ural
fore
st
1.7
*sig
nific
ant a
t P =
0.0
5, *
*sig
nific
ant a
t P =
0.0
1. P
erce
nt w
ith d
iffer
ent l
ette
rs a
re s
igni
fican
tly d
iffer
ent a
t P <
0.0
5.
(exp
erim
ent I
and
II).
37
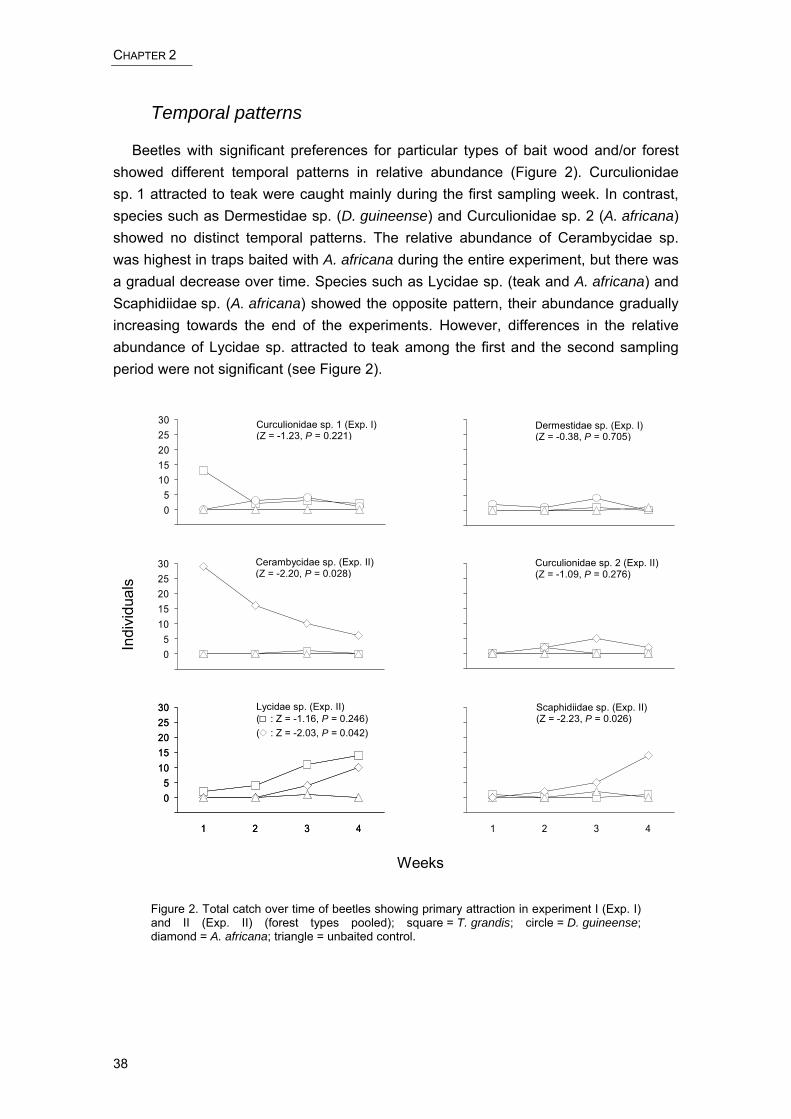
CHAPTER 2
Temporal patterns
Beetles with significant preferences for particular types of bait wood and/or forest showed different temporal patterns in relative abundance (Figure 2). Curculionidae sp. 1 attracted to teak were caught mainly during the first sampling week. In contrast, species such as Dermestidae sp. (D. guineense) and Curculionidae sp. 2 (A. africana) showed no distinct temporal patterns. The relative abundance of Cerambycidae sp. was highest in traps baited with A. africana during the entire experiment, but there was a gradual decrease over time. Species such as Lycidae sp. (teak and A. africana) and Scaphidiidae sp. (A. africana) showed the opposite pattern, their abundance gradually increasing towards the end of the experiments. However, differences in the relative abundance of Lycidae sp. attracted to teak among the first and the second sampling period were not significant (see Figure 2).
-505
1015202530
1 2 3 4
-505
1015202530
1 2 3 4
-505
1015202530
1 2 3 4-505
1015202530
1 2 3 4
-505
1015202530
1 2 3 4
-505
1015202530
1 2 3 4
D. Curculionidae sp. 11C*. Cerambycidae sp. 11
B. Dermestidae sp. 1
E*. Lycidae sp. 1
A. Curculionidae sp. 1
F*. Scaphidiidae sp. 6
-505
1015202530
1 2 3 4
-505
1015202530
1 2 3 4
-505
1015202530
1 2 3 4-505
1015202530
1 2 3 4
-505
1015202530
1 2 3 4
-505
1015202530
1 2 3 4
D. Curculionidae sp. 11C*. Cerambycidae sp. 11
B. Dermestidae sp. 1
E*. Lycidae sp. 1
A. Curculionidae sp. 1
F*. Scaphidiidae sp. 6
-505
1015202530
1 2 3 4
-505
1015202530
1 2 3 4-505
1015202530
1 2 3 4
-505
1015202530
1 2 3 4
-505
1015202530
1 2 3 4
D. Curculionidae sp. 11C*. Cerambycidae sp. 11
B. Dermestidae sp. 1
E*. Lycidae sp. 1
A. Curculionidae sp. 1
F*. Scaphidiidae sp. 6
-505
1015202530
1 2 3 4
-505
1015202530
1 2 3 4-505
1015202530
1 2 3 4
-505
1015202530
1 2 3 4
-505
1015202530
1 2 3 4-505
1015202530
1 2 3 4
-505
1015202530
1 2 3 4-505
1015202530
1 2 3 4
-505
1015202530
1 2 3 4
-505
1015202530
1 2 3 4
D. Curculionidae sp. 11C*. Cerambycidae sp. 11
B. Dermestidae sp. 1
E*. Lycidae sp. 1
A. Curculionidae sp. 1
F*. Scaphidiidae sp. 6
Weeks
Indi
vidu
als
Dermestidae sp. (Exp. I) (Z = -0.38, P = 0.705)
Cerambycidae sp. (Exp. II) (Z = -2.20, P = 0.028)
Curculionidae sp. 1 (Exp. I) (Z = -1.23, P = 0.221) Curculionidae sp. 1
(Z = -1.23, P = 0.221)
Lycidae sp. (Exp. II) (< : Z = -1.16, P = 0.246) (a : Z = -2.03, P = 0.042)
Curculionidae sp. 2 (Exp. II) (Z = -1.09, P = 0.276)
Scaphidiidae sp. (Exp. II) (Z = -2.23, P = 0.026)
Figure 2. Total catch over time of beetles showing primary attraction in experiment I (Exp. I) and II (Exp. II) (forest types pooled); square = T. grandis; circle = D. guineense; diamond = A. africana; triangle = unbaited control.
38
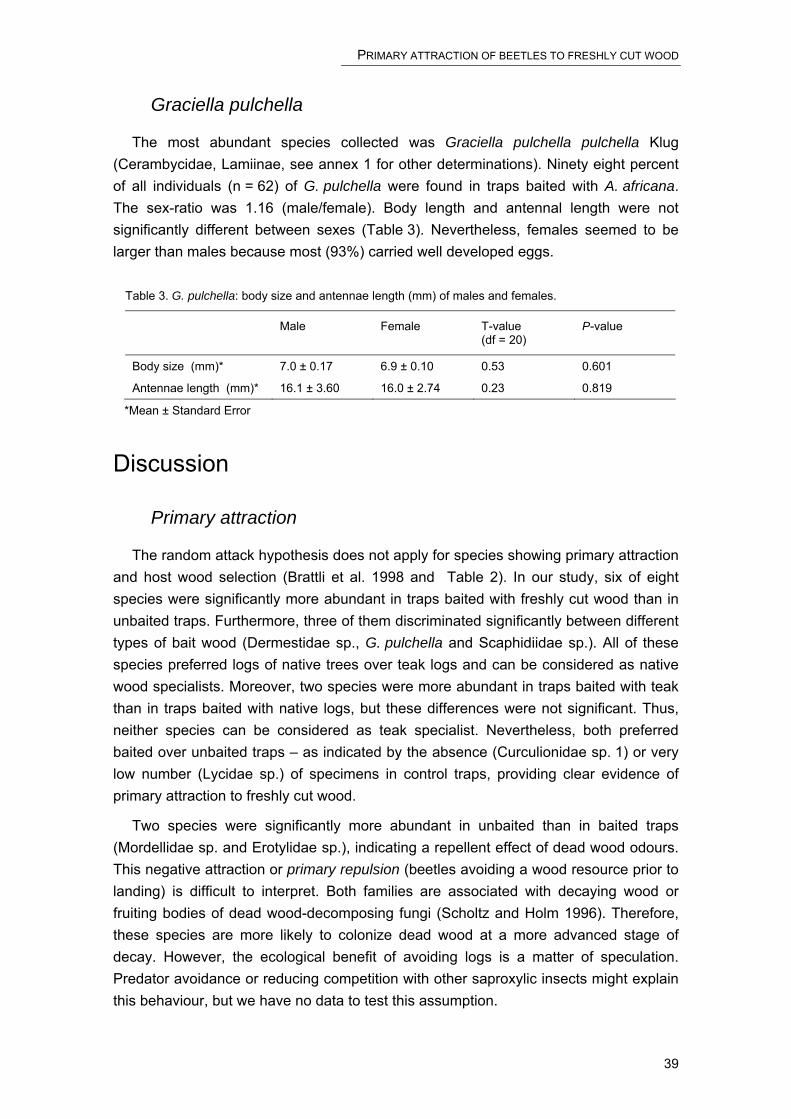
PRIMARY ATTRACTION OF BEETLES TO FRESHLY CUT WOOD
Graciella pulchella
The most abundant species collected was Graciella pulchella pulchella Klug (Cerambycidae, Lamiinae, see annex 1 for other determinations). Ninety eight percent of all individuals (n = 62) of G. pulchella were found in traps baited with A. africana. The sex-ratio was 1.16 (male/female). Body length and antennal length were not significantly different between sexes (Table 3). Nevertheless, females seemed to be larger than males because most (93%) carried well developed eggs.
Table 3. G. pulchella: body size and antennae length (mm) of males and females.
Male Female T-value (df = 20)
P-value
Body size (mm)* 7.0 ± 0.17 6.9 ± 0.10 0.53 0.601
Antennae length (mm)* 16.1 ± 3.60 16.0 ± 2.74 0.23 0.819
*Mean ± Standard Error
Discussion
Primary attraction
The random attack hypothesis does not apply for species showing primary attraction and host wood selection (Brattli et al. 1998 and Table 2). In our study, six of eight species were significantly more abundant in traps baited with freshly cut wood than in unbaited traps. Furthermore, three of them discriminated significantly between different types of bait wood (Dermestidae sp., G. pulchella and Scaphidiidae sp.). All of these species preferred logs of native trees over teak logs and can be considered as native wood specialists. Moreover, two species were more abundant in traps baited with teak than in traps baited with native logs, but these differences were not significant. Thus, neither species can be considered as teak specialist. Nevertheless, both preferred baited over unbaited traps – as indicated by the absence (Curculionidae sp. 1) or very low number (Lycidae sp.) of specimens in control traps, providing clear evidence of primary attraction to freshly cut wood.
Two species were significantly more abundant in unbaited than in baited traps (Mordellidae sp. and Erotylidae sp.), indicating a repellent effect of dead wood odours. This negative attraction or primary repulsion (beetles avoiding a wood resource prior to landing) is difficult to interpret. Both families are associated with decaying wood or fruiting bodies of dead wood-decomposing fungi (Scholtz and Holm 1996). Therefore, these species are more likely to colonize dead wood at a more advanced stage of decay. However, the ecological benefit of avoiding logs is a matter of speculation. Predator avoidance or reducing competition with other saproxylic insects might explain this behaviour, but we have no data to test this assumption.
39
CHAPTER 2
Temporal abundance patterns
Species attracted to bait wood showed different temporal patterns in relative abundance, reflecting variable attractiveness of dead wood over time. The cerambycid G. pulchella was most abundant at the beginning. This species was obviously attracted by primary volatiles immediately released from freshly cut wood (i.e., components of the sap). Fast reacting, early colonizer such as G. pulchella may have an advantage over slower ones, especially if they rely on subcortical tissues of stressed or dying trees, an ephemeral, limited and unpredictable resource heavily competed for by intra- and interspecific competitors (Allison et al. 2001; Hanks 1999).
Species whose relative abundance increased towards the end of the four-week experiments (Lycidae sp. and Scaphidiidae sp.) may have responded to secondary volatiles such as ethanol which are formed during the decay. Ethanol is an important attractant for a wide range of wood-associated beetles. Release rates are low in live trees but high in stressed plants and decaying woody tissue (Brattli et al. 1998). Thus, the release of ethanol from recently dead wood increases as the decay progresses, thereby also increasing the attraction of colonizer beetles sensitive to this agent (Joseph et al. 2001; Jonsell et al. 2003). During wet periods, the vascular tissue of dead wood fills with water, impeding the gas exchange and leading to an accumulation of ethanol in the tissue (Kelsey and Joseph 1999). These ethanol stores are released in pulses when the wood dries up, attracting beetles and other wood-associated insects.
Very little is known about the biology of Lycidae, especially those from tropical forests. There is some evidence that lycid larvae consume sap from freshly cut surfaces (Bocak, personal communication) or from decomposing wood (Pototskaya 1981).
Imagoes of Scaphidiidae feed on fungal spores and hyphae (Scholtz and Holm 1996). Even though no fruiting bodies were visible at the end of the four-week experiments, cryptic mycelia may have developed already and attracted scaphidiids. On dead or injured wood, fungi can develop very fast. For example, in a study of fungal communities of beech, superficial brown mottling of wood cuts was already visible after three weeks (Coates and Rayner 1985). However, in the present study we could not distinguish fungal mottling and wood oxidation.
The duration of our experiments was only four weeks. Morewood et al. (2002) warned that firm conclusions about primary attraction cannot be drawn if the experi-ments are conducted only during part of the wood beetle flying season. Furthermore, responses to olfactory stimuli varies greatly even within species, depending on the physiological state at different times of the year. To detect such seasonal fluctuations, it would therefore be necessary to conduct experiments lasting for one year.
40
PRIMARY ATTRACTION OF BEETLES TO FRESHLY CUT WOOD
Habitat preference and host-finding
The composition and relative abundance of arthropod assemblages in Lama forest reserve differs greatly among natural forest and teak plantations (Lachat et al., in press, see Chapter 1). In view of these differences, we also expected different habitat preferences of species showing primary attraction to recently dead wood, and hence different host-finding ability. On the other hand, it is known that some wood-associated beetles are able to disperse over very long distances (Nilssen 1984), suggesting that locating and colonizing the dead wood resource may be more important than living in a particular forest habitat.
The beetles examined in the present study can be loosely divided into three groups, reflecting different habitat preferences and host-finding abilities.
1. The first group is represented only by G. pulchella. This species showed no forest preference but a strong preference for A. africana wood, irrespective of whether the logs were located in natural forest or in teak plantations. Foraging techniques that combine high host-finding ability with strong flight capacity are typical for species specialised on resources that are sparsely distributed (Jonsell and Nordlander 1995).
2. The second group comprises species preferring wood characteristic of their preferred habitat. Dermestidae sp. and Scaphidiidae sp. were more abundant in natural forest dominated by D. guineense than in teak plantations, and consequently preferred D. guineense logs. These beetle species seem to have poor dispersal capacities because they were unable to locate and colonize suitable wood outside of their preferred habitat.
3. The third group (Curculionidae sp. 2 and Lycidae sp.) includes species preferring wood that was untypical of their preferred habitat (teak in natural forest and native wood in plantations). This shows that the attractiveness of certain dead wood varies depending on the habitat. This in turn may be related to differences in the resource base (dead wood quantity and quality) and in the dead wood fauna, leading to different colonisation patterns and competition regimes.
For the two Curculionidae species (spp.1 and 2) we found an interaction between dead wood and forest type, indicating dissimilar preferences for dead wood across forest types. However, it is difficult to interpret this observation in an ecologically meaningful way.
Catchability of twin-Malaise traps
We used a newly designed bait trap to capture wood-associated beetles. These new traps have several advantages. First, large volumes (≈ 0.2 m3) of bait wood can be used. Higher volumes release higher amounts of volatiles and may attract colonizer
41

CHAPTER 2
beetles over larger distances. Second, insects lured into the trap by olfactory cues have no direct contact with the bait, reducing a confounding effect of secondary attraction (Tunset et al. 1993). Third, once installed, twin-Malaise traps require very little maintenance. Fourth, ordinary Malaise traps are common and widely used devices and can be easily transformed into twin-Malaise traps.
However, no trap collects the whole species spectrum (New 1998), and this is also true for twin-Malaise traps. For example, very few Scolytidae and Platypodidae were sampled, even though these families are known to be colonizers of freshly cut wood (Beaver and Löyttyniemi 1991; Byers 1996). They may have been excluded for different reasons. First, Malaise and related traps sample only insects moving upwards. Species with different escape behaviour do not reach the collecting vial at the top. Other traps are more efficient to catch these taxa (see Flechtmann and Gaspareto 1997; Tunset et al. 1988). Second, according to Wood (1982) and Brattli et al. (1998), host wood selection by many Scolytidae requires probing of the outer bark into the phloem tissue or reception of host volatiles at close range. In the twin-Malaise traps, the distance between bait wood and mesh may have been too long (> 10 cm). Other authors suggest that host tree volatiles are not important at all in the host finding and selection of many bark beetles (Byers 1996).
Ecological traits of Graciella pulchella
G. pulchella was attracted nearly exclusively to A. africana (61 of 62 individuals). Of all the species showing primary attraction in our study, G. pulchella was certainly the most selective. In the following we provide an overview of the ecology and behaviour of this interesting species, based on our observations and existing literature.
This longhorn beetle bores into the phloem and oviposits on bark (Wagner et al. 1991). It is considered a typical stressed host species (Hanks 1999). A common trait of stressed host species is that they oviposit mainly on freshly fallen trees or cut logs. A single generation of stressed host species develops in the host wood which gradually becomes infested with other species preferring dead wood in a more advanced stage of decay.
In contrast to ambrosia and bark beetles, most cerambycids respond to contact or short-range pheromones to mate (Ginzel et al. 2003; Ginzel and Hanks 2003; Reagel et al. 2002). Thus, beetles are first attracted by dead wood volatiles. Once landed on the wood, short-range pheromones govern short distance mate-finding. This may explain the balanced sex ratio between males and females collected in our study. Most species copulate immediately after the first antennal contact and mate recognition. The presence of eggs in 93% of the females can be explained in two ways. First, most members of the Lamiinae subfamily emerge with their eggs fully developed (Hanks, personal communication). Alternatively, mating may already have taken place before arriving at the trap. Depending on stressed hosts, G. pulchella mates and oviposits in a
42
PRIMARY ATTRACTION OF BEETLES TO FRESHLY CUT WOOD
short period. However, a long time may lay between adult emergence and oviposition because this requires locating rare and widely dispersed stressed hosts.
From an economic point of view, damages caused by stressed host cerambycids are negligible, because larvae feed exclusively within the subcortical tissue and enter the sapwood only to pupate (Hanks 1999). More observations are certainly needed to draw a more complete picture of the larval development of cerambycid beetles.
Conclusions
The present study found different beetle species showing primary attraction (six species) or repulsion (two species). Three of them were native wood specialists, but none were teak specialists. Among the beetles showing primary attraction, we found no economically important pest species.
The twin-Malaise trap proved to be a suitable device to examine the primary attraction of beetles, even though the entire spectrum of wood-associated beetles was not sampled. Baiting experiments conducted over longer periods of time would be useful to validate and follow up on our findings, and to monitor potential pests on logs.
Because plantation systems plays an increasing role in tropical forestry (Speight and Wylie 2001), the mechanism of primary attraction and host tree selection in natural and plantation forest ecosystems should receive more attention. Direct observations of ecological traits as well as chemical analyses of plant odours may improve our understanding of both host stimuli and beetle responsiveness. This knowledge is of great interest for both the conservation and management of tropical forest resources (Brattli et al. 1998).
Acknowledgements
This study was funded by the Swiss National Science Foundation and the Swiss Agency for Development and Cooperation. It was carried out in the framework of the project BioLama. We thank all BioLama staff for their support, especially M. Guedegbé, C. Houngbedji, L. Konetche. We are grateful to P. Houayé, R. Akossou, D. Honfozo, H. Hodonou and A. V. N'velin of the Office National du Bois. Many thank to L. Bocak, C. Germann, A. Hermann, A. Kaupp and Y. Löbl for helping with some determinations.
43
CHAPTER 2
References
Allison, J.D., Borden, J.H., McIntosch, R.L., De Groot, P. and Gries, R. 2001. Kairomonal response by four Monochamus species (Coleoptera: Cerambycidae) to bark beetle pheromones. Journal of Chemical Ecology 27:633-646.
Barata, E.N. and Araújo, J. 2001. Olfactory orientation responses of the eucalyptus woodborer, Phoracantha semipunctata, to host plant in a wind tunnel. Physiological Entomology 26:26-37.
Beaver, R.A. and Löyttyniemi, K. 1991. Annual flight patterns and diversity of bark and ambrosia beetles (Col., Scolytidae and Platypodidae) attracted to bait logs in Zambia. Journal of Applied Entomology 112:505-511.
Byers, J.A. 1996. An encounter rate model of bark beetle populations searching at random for susceptible host trees. Ecological Modelling 91:57-66.
Brattli, J.G., Andersen, J. and Nilssen, A.C. 1998. Primary attraction and host tree selection in deciduous and conifer living Coleoptera: Scolytidae, Curculionidae, Cerambycidae and Lymexylidae. Journal of Applied Entomology 122:345-352.
Coates, D. and Rayner, A.D.M. 1985. Fungal population and community development in cut beech logs: I. Establishment via the aerial cut surface. New Phytologist 101:153-171.
De Groot, P. and Nott, R. 2001. Evaluation of traps of six different designs to capture pine sawyer beetles (Coleoptera: Cerambycidae). Agricultural and Forest Entomology 3:107-111.
Emrich, A., Mühlenberg, M., Steinhauer-Burkhart, B. and Sturm, H.J. 1999. Evaluation écologique intégrée de la forêt naturelle de la Lama en République du Bénin. Rapport de synthèse. Page 74. ONAB, KfW, GTZ, Cotonou, Bénin.
Flechtmann, C.A. and Gaspareto, C.L. 1997. A new trap for capturing Scolytidae (Coleoptera), based on primary attraction. Journal of Applied Ecology 121:357-359.
Ginzel, M.D., Blomquist, G.J., Millar, J.G. and Hanks, L.M. 2003. Role of contact pheromones in mate recognition in Xylotrechus colonus. Journal of Chemical Ecology 29:533-545.
Ginzel, M.D. and Hanks, L.M. 2003. Contact pheromones as mate recognition cues of four species of longhorned beetles (Coleoptera: Cerambycidae). Journal of Insect Behavior 16:181-187.
Hanks, L.M. 1999. Influence of the larval host plant on reproductive strategies of cerambycid beetles. Annual Review of Entomology 44:483-505.
Jonsell, M. and Nordlander, G. 1995. Field attraction of Coleoptera to odours of the wood-decaying polypores Fomitopsis pinicola and Fomes fomentarius. Ann. Zool. Fennici 32:391-402.
Jonsell, M., Schroeder, M. and Larsson, T. 2003. The saproxylic beetle Bolitophagus reticulatus: its frequency in managed forests, attraction to volatiles and flight period. Ecography 26:421-428.
44
PRIMARY ATTRACTION OF BEETLES TO FRESHLY CUT WOOD
Joseph, G., Kelsey, R.G., Peck, R.W. and Niwa, C.G. 2001. Response of some scolytids and their predators to ethanol and 4-allylanisole in pine forests of central oregon. Journal of Chemical Ecology 27:697-715.
Keay, R.W.J. 1989. Trees of Nigeria. Clarendon Press, Oxford.
Kelsey, R.G. and Joseph, G. 1999. Ethanol and ambrosia beetles in douglas fir logs exposed or protected from rain. Journal of Chemical Ecology 25:2793-2809.
Lachat, T., Attignon, S., Djego, J., Goergen, G., Nagel, P., Sinsin, B. and Peveling, R. Arthropod diversity in Lama forest reserve (South Benin), a mosaic of natural, degraded and plantation forests. Biodiversity and Conservation, in press.
McIntosh, R.L., Katinic, P.J., Allison, J.D., Borden, J.H. and Downey, D.L. 2001. Comparative efficacy of five types of trap for woodborers in the Cerambycidae, Buprestidae and Siricidae. Agricultural and Forest Entomology 3:113-120.
Morewood, W.D., Hein, K.E., Katinic, P.J. and Borden, J.H. 2002. An improved trap for large wood-boring insects, with special reference to Monochamus scutellatus (Coleoptera: Cerambycidae). Canadian Journal for Forestry Research 32:519-525.
New, T.R. 1998. Invertebrate surveys for conservation. Oxford University Press, Oxford, New York, Tokyo.
Nilssen, A.C. 1984. Long-range aerial dispersal of bark beetles and bark weevils (Coleoptera, Scolytidae and Curculionidae) in northern Finland.
Paradis, G. and Houngnon, P. 1977. La végétation de l'aire classée de la Lama dans la mosaïque forêt-savane du Sud-Bénin (ex-Sud-Dahomey). Bulletin du Muséum national d'histoire naturelle: botanique 34:170-196.
Pototskaya, V.A. 1981. Morphology and ecology of larvae of the lycid genera Aplatopterus Rtt. and Xylobanus C. O. Waterh. (Coleoptera, Lycidae). Entomologischeskoye Obozreniye 60: 337–347.
Reagel, P.F., Ginzel, M. D. and Hanks, L.M. 2002. Aggregation and mate location in the red milkweed beetle (Coleoptera: Cerambycidae). Journal of Insect Behavior 15:811-830.
Scholtz, C. H. and Holm, E.1996. Insects of soutern Africa. University of Pretoria, Pretoria.
Specht, I. 2002. La forêt de la Lama, Bénin SIG basé sur Landsat 7. Opuscula Biogeographica Basileensia III, Bâle, Suisse.
Speight, M.R. and Wylie, F.R. 2001. Insect Pests in Tropical Forestry. CABI Publishing, Oxford, Brisbane.
Townes, H. 1972. A light-weight malaise trap. Entomological News 83:239-247.
Tunset, K., Nilssen, A.C. and Andersen, J. 1988. A new trap design for primary attraction of bark beetles and bark weevils (Col., Scolytidae and Curculionidae). Journal of Applied Entomology 106:266-269.
Tunset, K., Nilssen, A.C. and Andersen, J. 1993. Primary attraction in host recognition of coniferous bark beetles and bark weevils (Col., Scolytidae and Curculionidae). Journal of Applied Entomology:115 (112) 155-169.
45
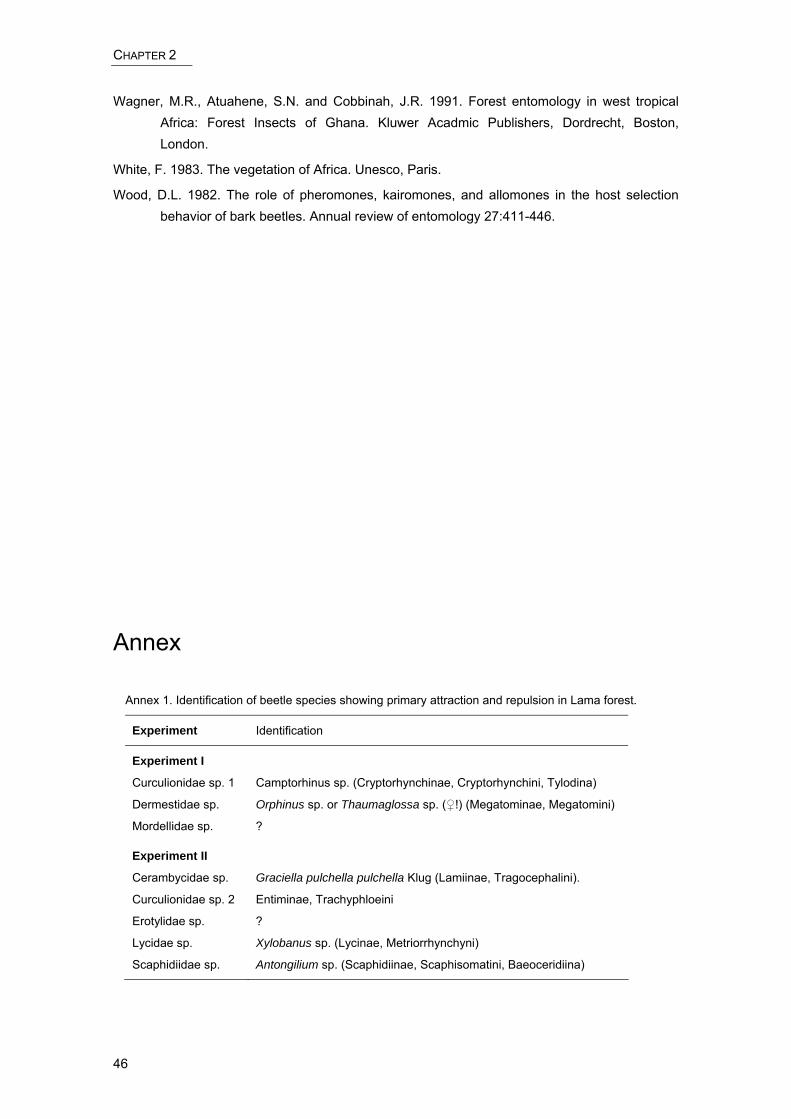
CHAPTER 2
Wagner, M.R., Atuahene, S.N. and Cobbinah, J.R. 1991. Forest entomology in west tropical Africa: Forest Insects of Ghana. Kluwer Acadmic Publishers, Dordrecht, Boston, London.
White, F. 1983. The vegetation of Africa. Unesco, Paris.
Wood, D.L. 1982. The role of pheromones, kairomones, and allomones in the host selection behavior of bark beetles. Annual review of entomology 27:411-446.
Annex
Annex 1. Identification of beetle species showing primary attraction and repulsion in Lama forest.
Experiment Identification
Experiment I
Curculionidae sp. 1 Camptorhinus sp. (Cryptorhynchinae, Cryptorhynchini, Tylodina)
Dermestidae sp. Orphinus sp. or Thaumaglossa sp. (♀!) (Megatominae, Megatomini)
Mordellidae sp. ?
Experiment II
Cerambycidae sp. Graciella pulchella pulchella Klug (Lamiinae, Tragocephalini).
Curculionidae sp. 2 Entiminae, Trachyphloeini
Erotylidae sp. ?
Lycidae sp. Xylobanus sp. (Lycinae, Metriorrhynchyni)
Scaphidiidae sp. Antongilium sp. (Scaphidiinae, Scaphisomatini, Baeoceridiina)
46
CHAPTER 3 – DEAD WOOD AND SAPROXYLIC BEETLES
Dead wood and saproxylic beetle assemblages in a semi-
deciduous forest in Southern Benin
Thibault Lachat, Peter Nagel, Yvonne Cakpo, Serge Attignon Georg Goergen, Brice Sinsin and Ralf Peveling
Manuscript submitted to Forest Ecology and Management
Saproxylic (dead wood associated) beetles play an important role in all forest ecosystems and are known to be highly susceptible to forest management and fragmentation. Contrary to temperate forests, there has been very little research on saproxylic beetle assemblages in tropical forests. In Africa, large tracts of natural forest have been converted to tree plantations and cropland, and these land use changes are expected to have a dramatic effect on saproxylic beetle assemblages. In the Lama forest reserve in Southern Benin, we conducted an inventory of dead wood and the associated saproxylic beetle fauna, focusing on three different forest types, natural semi-deciduous forest, teak plantations and fuelwood plantations. The dead wood recorded included all coarse woody debris, standing dead trees (snags) and dead branches or stems on live trees (limbs). Saproxylic beetles were reared from dead wood of different decay stages and tree species, using emergence traps. Both the quantity and quality of dead wood resources differed greatly among natural forest and plantations. Average volumes were about thirty, four and one cubic meter per hectare in natural forest, teak and fuelwood plantations, respectively. Dead wood of advanced decay was basically absent in plantations, due to wood collecting activities of the local population. The overall species richness of saproxylic beetles was higher in natural forest, and detrended correspondence analysis clearly segregated dead wood beetle assemblages from natural forest and plantations. Multiple regression found four significant predictors of the first two ordination axes, the volume of (a) recently dead wood, (b) large pieces of dead wood and (c) coarse woody debris (axis one), or to the volume of (a) recently dead wood and (b) snags (axis two). Despite the overall paucity of dead wood, in particular the lack of strongly decayed wood, saproxylic beetle diversity in teak and fuelwood plantations was surprisingly high, providing evidence of the importance of dead wood for biodiversity conservation. Different management measures are proposed to increase the amount of dead wood in plantations so as to protect and enhance the diversity of the saproxylic fauna.
Key words: Dead wood, Emergence traps, Forest management, Plantations, Saproxylic beetles, Tropical forest
47
CHAPTER 3
Introduction
Saproxylic insects comprise “species that are dependant, during some part of their life cycle, upon dead or dying wood of moribund or dead trees (standing or fallen), or upon wood-inhabiting fungi, or upon the presence of other saproxylics” (Speight, 1989). Over the last decades, saproxylic insects have been subject of intensive research in Europe and Australia. Results emerging from these studies show that dead wood insect assemblages are exceptionally rich in species diversity. For example, an estimated 21% of all beetles living in the canopy of subtropical rainforests in Australia are xylophagous (Hammond et al., 1996). In Central Europe, 56% of all forest beetles were found to be associated with dead wood (Köhler, 2000). However, the fraction of species living on dead or decaying wood seems to be larger in temperate and boreal forests than in tropical and temperate forests (Hanski and Hammond, 1995).
The diversity of saproxylic fauna depends on the availability and diversity of dead wood habitats, which in turn are governed mainly by the physicochemical quality and stage of decomposition of dead wood (Grove, 2002a). Moreover, dead wood is an important medium-term store of carbon (Mackensen et al., 2003), and as it decays nutrients are gradually returned to the soil, thereby restoring soil fertility (Laiho and Prescott, 1999). Thus, dead wood represents a valuable resource in all forest ecosystems, and its removal may lead to a depletion of soil nutrients and an impoverishment in biodiversity.
Saproxylic invertebrate assemblages are highly susceptible to forest management and fragmentation, over time scales ranging from decades to millennia (Kaila et al., 1997; Martikainen et al., 2000; Grove, 2000, 2001, 2002b). In the tropics, dead wood habitats are threatened mainly by the conversion of forests to cropland or intensively managed tree plantations, and by the fragmentation of pristine forests. Even selective logging may endanger the fauna associated with overmature trees and the dead wood they generate because mature trees are felled before they die naturally. In view of the manifold risks to saproxylic fauna and the ecological functions they mediate, it is important to study their diversity and ecology, and to devise dead wood management measures for their protection (Okland et al., 1996).
Despite the important role of saproxylic fauna in all forest ecosystems (Elton, 1966), only few studies have been conducted in tropical forests, most of them in Australia (Grove, 2000, 2001, 2002a, 2002b, 2002c). To our knowledge, the research reported here is the first to examine the diversity of saproxylic insects and their interaction with dead wood in African tropical forests. The objectives of our study were (i) to quantify and qualify dead wood habitats in different forest types of the Lama forest reserve in Benin, West Africa, (ii) to compare saproxylic beetle assemblages in relation to different forest management regimes (natural and plantation forests), (iii) to identify dead wood habitat attributes determining the diversity and composition of beetle
48
DEAD WOOD AND SAPROXYLIC BEETLES
assemblages and (iv) to evaluate preferences of saproxylic beetles for particular species or decay stages of dead wood.
Material and Methods
Study area
The Lama forest reserve is situated in southern Benin in a shallow depression between the Allada and Abomey plateaus (6°55.8’ to 6°58.8’ N and 2°4.2’ to 2°10.8’ E). The reserve covers an area of 16,250 ha and comprises remnants of semi-deciduous forest as well as timber and fuelwood plantations. The mean annual rainfall is about 1,200 mm. The dominant soil types are hydromorphic vertisols in the centre and sandy ferralsols towards the plateaus.
Despite having been protected since 1946, human encroachment and deforestation in the reserve continued until 1988 when only 1,900 ha of natural forest were left. Since then, a central part (Noyau central) covering 4,800 ha lies under strict protection, and the population living therein has been resettled. The Noyau central is composed of a small-scale mosaic of natural and degraded forest patches of variable size and successional stage (Specht, 2002). It is surrounded by teak (Tectona grandis) and fuelwood (predominantly Senna siamea) plantations, covering 7,000 ha and 2,400 ha, respectively.
Three different forest types were studied, each covering about 2,000 ha and representing different management systems:
1. Semi-deciduous natural forest is composed of trees such as Afzelia africana, Ceiba pentandra, Dialium guineense, Diospyros mespiliformis, Drypetes floribunda, Celtis brownii and Mimusops andongensis. The understorey vegetation can be very dense throughout all seasons, and canopy height is about 20 m, with some emergent trees reaching 30 meters. The average basal area on the study plots was 28.2 m2 ha-1, and the stand density of stems with ≥ 5 cm diameter at breast height (DBH) 904 stems ha-1 (Fig. 1a). The remnants of natural forest within the Noyau central are unmanaged. However, various management measures are being practiced on adjacent patches of degraded forest to assist the restoration of natural forest, including enrichment plantings with native trees and annual weeding.
2. Old-growth teak plantations were planted between 1955 and 1965. Canopy height is about 25 meters. The understorey vegetation cover may reach 75% during the rainy season. The average basal area on the study plots was 20.8 m2 ha-1, and the stand density 203 stems ha-1 (≥ 5 cm DBH) (Fig. 1b). Mature teak plantations are selectively logged for the local production of floor tiles.
49

CHAPTER 3
3. Fuelwood plantations were planted between 1988 and 1996. These forests are up to 20 m high and have an understorey vegetation cover of up to 70% during the rainy season. The average basal area on the study plots was 11.8 m2 ha-1, and the stand density 304 stems ha-1 (≥ 5 cm DBH) (Fig. 1c). The rotation period of fuelwood plantations is about 20 years. Contrary to natural forest and teak plantations, these forests are sometimes affected by anthropogenic fires.
10 20 30 40 50 60 70 80
0
25
50
75
100
125
150
0
25
50
75
100
125
150
0
25
50
75
100
125
150
1a. Natural forest
1b. Old teak plantations
1c. Fuelwood plantations
1a. Natural forest
1b. Old teak plantations
1c. Fuelwood plantations
Diameter class (cm)
Num
ber
of tr
ees
347 237
0
25
50
75
100
125
150
0
25
50
75
100
125
150
0
25
50
75
100
125
150
1a. Natural forest
1b. Old teak plantations
1c. Fuelwood plantations
1a. Natural forest
1b. Old teak plantations
1c. Fuelwood plantations
Diameter class (cm)
Num
ber
of tr
ees
347 237
Fig. 1. Distribution of stem diameter classes in natural forest (1a), teak (1b) and fuelwood plantations (1c). Values are means of three replicate plots.
50

DEAD WOOD AND SAPROXYLIC BEETLES
Assessment of dead wood
The amount of dead wood was assessed on three replicate 1 ha plots in natural forest and on three replicate 0.25 ha plots in the more uniform teak and fuelwood plantations. All plots were divided into grids of 16 (natural forest) or four (plantations) contiguous cells (subplots) measuring 625 m2 (25 m × 25 m). These subplots were systematically searched for dead wood. The assessment was conducted before collecting dead wood for the rearing of saproxylic insects (see below).
Within each subplot, we recorded the size of all coarse woody debris (CWD) on the ground, snags (standing dead trees) as well as dead branches or stems (limbs) on live trees. Length and circumference (at both ends and the middle) of items down to a minimum circumference of 15 cm were measured with a tape. Of the pieces lying partially outside a grid cell, we included only the portion lying within the respective cell. Length and circumference of inaccessible items or parts of dead wood (e.g. snags and limbs) were visually estimated. Each item was classified according to its stage of decay, using a four-scale classification key (Table 1). We further distinguished small (stem diameter < 30 cm) and large (stem diameter ≥ 30 cm) items of dead wood.
Table 1. The classification adopted for determining decay stage of dead wood in the Lama forest reserve (after Bretz-Guby and Dobbertin, 1996; Irmler et al. 1996)
Stage Characters
I Wood recently dead, bark and all wood sound, current year twigs still attached, no insect holes
II Wood still sound, bark loose from sapwood or absent, insect holes, twigs absent
III Wood soft, not sound, numerous insect holes
IV Wood soft and rotten, partly integrated to the forest soil (humus)
Volume calculation
Homologising the shape of dead wood items with truncated cones, we used Newton’s formula to calculate individual volumes of each dead wood item:
V = L × (Ab + 4 × Am + At) / 6
where V = Volume, L = length, and Ab, Am, At = area at the base, middle and top, respectively (Harmon and Sexton, 1996). Individual volumes of all dead wood items were summed for each plot, yielding the total dead wood volume. In natural forest, this value corresponded to the total volume per hectare (V ha-1). Volumes for plantation plots were multiplied by four to yield the same unit.
51
CHAPTER 3
Emergence traps
Samples of dead wood were transferred into sealed emergence traps fabricated from solid black tissue. Sealing the entire trap was important to assure that only saproxylic insects reared from dead wood were collected. The traps were equipped with translucent collecting vials. These provided the sole source of light in order to attract newly emerged, positively phototactic insects. Assuming that traps were inaccessible to other insects, all specimens collected were considered as saproxylic (New, 1998). This assumption was necessary because many species were only identifiable on the morphospecies level, and because the ecology of most species was basically unknown. However, full exclusion of non-saproxylic species throughout the 15-month rearing period could not be achieved. This was evident from sporadic occurrences of clearly non-saproxylic taxa such as Chrysomelidae. These specimens were therefore discounted. Collecting vials were filled with formaldehyde solution (5%). They were emptied every three weeks from the 25 December 2002 to 31 March 2004 (22 sampling dates). Within the scope of this study, we used two kinds of emergence traps:
Pyramidal emergence traps
Pyramidal emergence traps (PETs) had a space volume of about 0.2 m3 (86 × 86 cm wide, 70 cm high) and were stocked with 0.08 m3 of dead wood on the average. The lateral faces were covered with fine black mesh reinforced with black cotton tissue on the outside. Dead wood pieces were first cut into pieces up to 70 cm long and then heaped up on fine plastic mesh (ground mesh) to exclude epigeal and hypogeal arthropods. Subsequently, the pyramids were placed over the dead wood heaps. Their base covered the ground mesh and was buried in the soil to a depth of about 5 cm to seal the interior space. The top was equipped with a translucent collecting vial (Mühlenberg, 1993).
Cylindrical emergence traps
Cylindrical emergence traps (CETs) were based on the same principle as PETs but were easier to fabricate and to install. They consisted of fine black mesh bags (150 cm circumference, 120 cm long) with a space volume of about 0.18 m3 when closed. One end was connected to a translucent collecting vial attached to a pole about 60 cm above the ground. At the opposite end, the bag was tightly closed with a cord after having been stocked with dead wood (average dead wood volume: 0.04 m3). The whole trap (except the collecting vial) was covered with black cotton tissue.
Rearing experiments
Representative samples of dead wood items (> 5 cm diameter) were collected from the three study plots (and their surroundings, as appropriate) used for the dead wood
52

DEAD WOOD AND SAPROXYLIC BEETLES
assessment, plus one additional plot per forest type. Thus, the total number of replicate samples of dead wood was four in all rearing experiments. In natural forest, emergence traps were installed on the sites from where the dead wood had been collected. However, for logistical reasons, and to avoid the damage of traps through vandalism ─ a problem sometimes encountered in plantations ─ all rearing experiments with dead wood collected from plantation forests were conducted at a single protected site in the teak plantations. Within this site, traps were distributed in random order. A shade roof of palm leaves (2 m high) was constructed to protect the emergence traps from direct sun exposure during the dry season.
PETs were used to rear saproxylic beetles from dead wood of different decay stages. In natural forest, all decay stages were found. Thus, one representative sample of each stage was collected on each replicate plot (4 decay stages × 4 replicates). In teak and fuelwood plantations, decay stages 3 and 4 were not encountered in sufficient quantities. Therefore, only stages 1 and 2 were sampled (2 decay stages × 4 replicates × 2 plantation types). The total number of PETs employed was 32 (16 in natural forest and 8 in teak plantations and 8 in fuelwood plantations).
CETs were used to rear saproxylic beetles from dead wood of certain tree species. Only dead wood of decay stage 2 was used for these rearing experiments. In natural forest, we selected dead wood of the seven most abundant species: A. africana (Caesalpiniaceae), Anogeissus leiocarpus (Combretaceae), C. pentandra (Bombacaceae), D. guineense (Caesalpiniaceae), D. mespiliformis (Ebenaceae), M. andongensis (Sapotaceae) and Zanthoxylum zanthoxyloides (Rutaceae). In plantation forests, we only sampled dead wood of cultivated trees, i.e., T. grandis (Verbenaceae) and S. siamea (Caesalpiniaceae) in teak and fuelwood plantations, respectively. The total number of CETs employed was 36 (9 tree species × 4 replicates).
Note that the overall sampling effort in terms of the total number of emergence traps employed (PETs plus CETs) was dissimilar among natural forest (11 traps per plot, all decay stages and dead wood species pooled) and forest plantations (3 traps per plot).
Species identification
All specimens were sorted to morphospecies and determined to the family level. Voucher specimens were deposited at the IITA-Benin in Cotonou, and partially at the Natural History Museum in Basel.
Statistical analyses
Differences in dead wood volumes and attributes among forest types were compared by one-way analysis of variance (ANOVA), followed by Bonferroni multiple comparison of means (SPSS 12.0). All data were log10(n+1)-transformed prior to the analyses to achieve homogeneity of variances.
53
CHAPTER 3
Similar analyses were conducted to examine the effect of forest type on measured species richness (= species richness per trap, as opposed to estimated species richness, see below), relative abundance and evenness of saproxylic beetle assemblages. Abundance and species richness data were also log10(n+1)-transformed.
In order to standardise species richness estimates by sampling effort, we combined species accumulation and rarefaction, two closely related analytical techniques (Magurran, 2003). The former was employed for plantation plots because the number of sampling units (traps) therein was insufficient for rarefaction (n = 3). The latter was used for natural forest plots (n = 11). Computations were done with the programme EstimateS 6.0b1 (Colwell, 1997). Smoothed accumulation curves were obtained after 50 randomisations. Rarefaction curves were calculated according to Colman’s random placement method (Coleman, 1981). Species richness was estimated for the highest possible equivalent sampling effort (= three traps per plot) among the more and the less intensively sampled forest types (Gotelli and Colwell, 2001). Hence species richness estimates for natural forest plots represent rarefied values, and those for plantation plots cumulated ones (Magurran, 2003).
All P-values reported are for individual analyses. Where appropriate, we also give significance levels after sequential Bonferroni adjustments for multiple testing.
Saproxylic beetle assemblages from individual traps were further analysed with detrended correspondence analysis (DCA), using PC-Ord 28.0 (McCune and Mefford, 1999) (default parameters). Prior to the analysis, abundance data were log10(n+1)-transformed. We only interpreted the ordination space determined by the first two axes.
We used linear multiple regression with forward selection to analyse the relationship between dead wood variables (characters) and measures of saproxylic beetle assemblages (species richness, abundance, evenness and DCA ordination scores). Cut-off values for the F-statistics determining inclusion or exclusion of explanatory variables in the regression models were set to P = 0.1 and P = 0.4, respectively (Okland et al., 1996; Grove, 2002c).
We adopted a method for the determination of indicator species (Dufrêne and Legendre, 1997) to assess preferences of certain beetle species and families for certain dead wood species or decay stages. The threshold level for the indicator value was 25%, and the significance level P ≤ 0.01. Species abundance data were stored in a main matrix and grouping variables for the computation of indicator species in a second matrix. All indicator species were identified using the same main matrix by changing the grouping variables in the second matrix. This method is available in the programme PC-Ord 28.0 (McCune and Mefford, 1999).
54
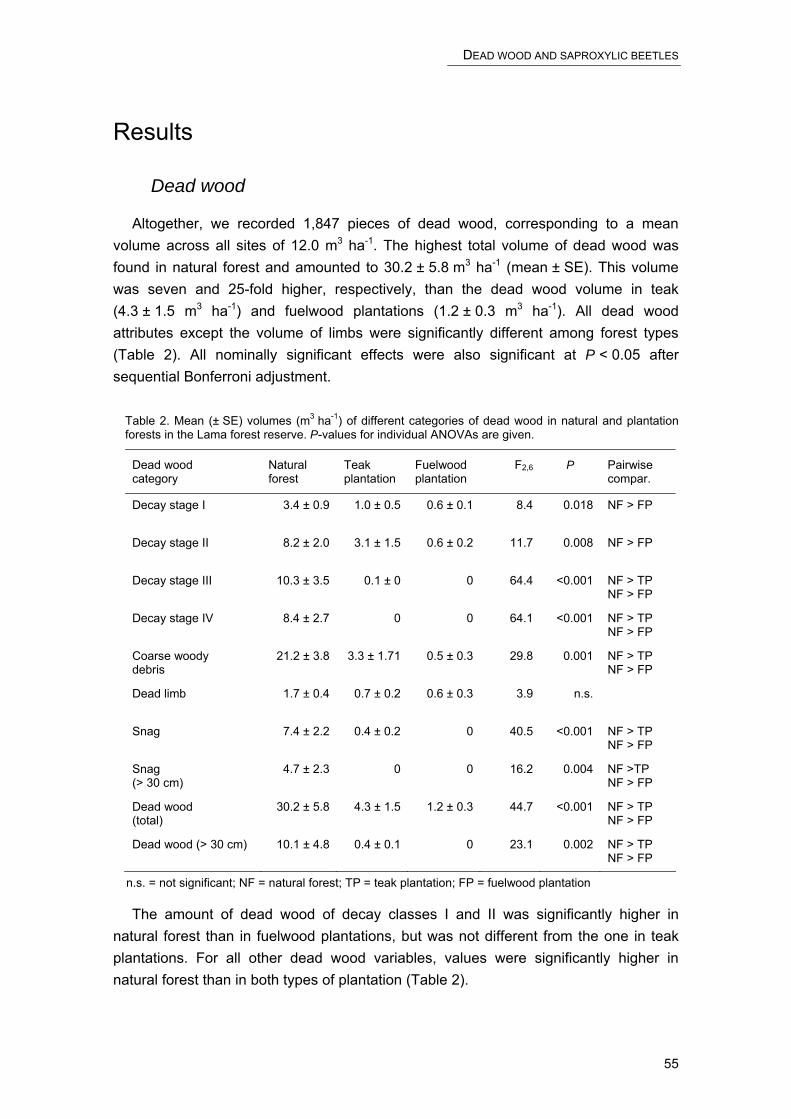
DEAD WOOD AND SAPROXYLIC BEETLES
Results
Dead wood
Altogether, we recorded 1,847 pieces of dead wood, corresponding to a mean volume across all sites of 12.0 m3 ha-1. The highest total volume of dead wood was found in natural forest and amounted to 30.2 ± 5.8 m3 ha-1 (mean ± SE). This volume was seven and 25-fold higher, respectively, than the dead wood volume in teak (4.3 ± 1.5 m3 ha-1) and fuelwood plantations (1.2 ± 0.3 m3 ha-1). All dead wood attributes except the volume of limbs were significantly different among forest types (Table 2). All nominally significant effects were also significant at P < 0.05 after sequential Bonferroni adjustment.
Table 2. Mean (± SE) volumes (m3 ha-1) of different categories of dead wood in natural and plantation forests in the Lama forest reserve. P-values for individual ANOVAs are given.
Dead wood category
Natural forest
Teak plantation
Fuelwood plantation
F2,6 P Pairwise compar.
Decay stage I 3.4 ± 0.9 1.0 ± 0.5 0.6 ± 0.1 8.4 0.018 NF > FP
Decay stage II 8.2 ± 2.0 3.1 ± 1.5 0.6 ± 0.2 11.7 0.008 NF > FP
Decay stage III 10.3 ± 3.5 0.1 ± 0 0 64.4 <0.001 NF > TP NF > FP
Decay stage IV 8.4 ± 2.7 0 0 64.1 <0.001 NF > TP NF > FP
Coarse woody debris
21.2 ± 3.8 3.3 ± 1.71 0.5 ± 0.3 29.8 0.001 NF > TP NF > FP
Dead limb 1.7 ± 0.4 0.7 ± 0.2 0.6 ± 0.3 3.9 n.s.
Snag 7.4 ± 2.2 0.4 ± 0.2 0 40.5 <0.001 NF > TP NF > FP
Snag (> 30 cm)
4.7 ± 2.3 0 0 16.2 0.004 NF >TP NF > FP
Dead wood (total)
30.2 ± 5.8 4.3 ± 1.5 1.2 ± 0.3 44.7 <0.001 NF > TP NF > FP
Dead wood (> 30 cm) 10.1 ± 4.8 0.4 ± 0.1 0 23.1 0.002 NF > TP NF > FP
n.s. = not significant; NF = natural forest; TP = teak plantation; FP = fuelwood plantation
The amount of dead wood of decay classes I and II was significantly higher in natural forest than in fuelwood plantations, but was not different from the one in teak plantations. For all other dead wood variables, values were significantly higher in natural forest than in both types of plantation (Table 2).
55

CHAPTER 3
In natural forest, the highest proportion of dead wood belonged to the advanced decay stages III and IV, representing 34% and 28%, respectively, of the total amount of dead wood (Fig. 2). In contrast, about 95% of the total amount of dead wood in teak and fuelwood plantations belonged to decay stages I and II.
0%
10%
20%
30%
40%
50%
60%
70%
80%
90%
100%
Natural forest Teak plantations Fuelwood plantations
Fig. 2. Proportion of dead wood of different decay stages in natural forest, teak and fuelwood plantations. Progressive shading of columns indicates successive decay stages, ranging from stage I (white) to IV (black).
Dialium guineense was the dominant dead wood tree species in natural forest, representing at least 50% of the total amount of dead wood on all sampling sites, followed by A. africana and M. andongensis (about 10% each). In plantation forests, T. grandis (teak plantations) and S. siamea (fuelwood plantations) represented > 95% of the total amount of dead wood.
Saproxylic beetle assemblages
The total volume of dead wood used in the rearing experiments was 4.1 m3 (all 68 traps pooled). During the 15-month rearing period, we collected 7,474 specimens in 469 species and 33 identified families of saproxylic beetles (Table 3).
Twenty-nine percent of all species were singletons, and 26% occurred with > 10 individuals. We reared 4,168 individuals from dead wood of decay stages I to IV in pyramid-shaped emergence traps, representing 349 species. Corresponding values for beetles reared from specific dead wood in cylinder-shaped emergence traps were 3,306 individuals and 319 species. One hundred ninety-nine species were reared in both types of trap.
Even though the dead wood volume contained in PETs was significantly higher than the one in CETs (0.08 versus 0.04 m3 per trap; Mann-Whitney test, U = 53.0,
56
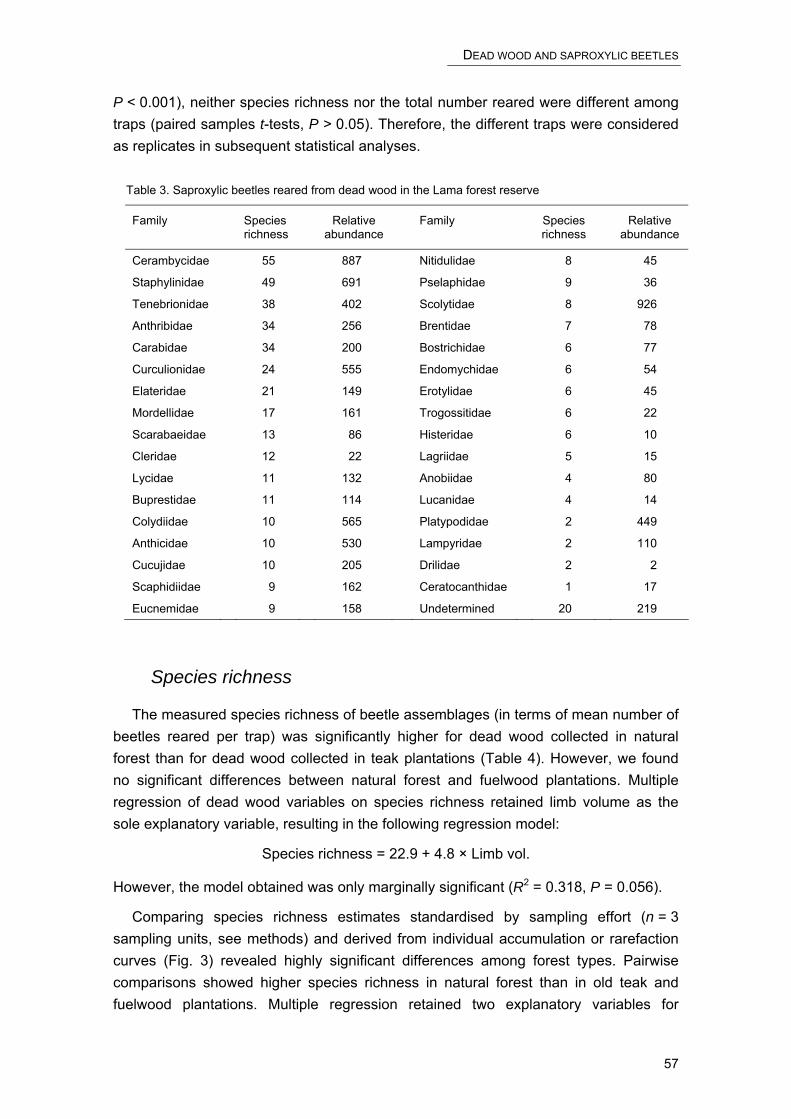
DEAD WOOD AND SAPROXYLIC BEETLES
P < 0.001), neither species richness nor the total number reared were different among traps (paired samples t-tests, P > 0.05). Therefore, the different traps were considered as replicates in subsequent statistical analyses.
Table 3. Saproxylic beetles reared from dead wood in the Lama forest reserve
Family Species richness
Relative abundance
Family Species richness
Relative abundance
Cerambycidae 55 887 Nitidulidae 8 45
Staphylinidae 49 691 Pselaphidae 9 36
Tenebrionidae 38 402 Scolytidae 8 926
Anthribidae 34 256 Brentidae 7 78
Carabidae 34 200 Bostrichidae 6 77
Curculionidae 24 555 Endomychidae 6 54
Elateridae 21 149 Erotylidae 6 45
Mordellidae 17 161 Trogossitidae 6 22
Scarabaeidae 13 86 Histeridae 6 10
Cleridae 12 22 Lagriidae 5 15
Lycidae 11 132 Anobiidae 4 80
Buprestidae 11 114 Lucanidae 4 14
Colydiidae 10 565 Platypodidae 2 449
Anthicidae 10 530 Lampyridae 2 110
Cucujidae 10 205 Drilidae 2 2
Scaphidiidae 9 162 Ceratocanthidae 1 17
Eucnemidae 9 158 Undetermined 20 219
Species richness
The measured species richness of beetle assemblages (in terms of mean number of beetles reared per trap) was significantly higher for dead wood collected in natural forest than for dead wood collected in teak plantations (Table 4). However, we found no significant differences between natural forest and fuelwood plantations. Multiple regression of dead wood variables on species richness retained limb volume as the sole explanatory variable, resulting in the following regression model:
Species richness = 22.9 + 4.8 × Limb vol.
However, the model obtained was only marginally significant (R2 = 0.318, P = 0.056).
Comparing species richness estimates standardised by sampling effort (n = 3 sampling units, see methods) and derived from individual accumulation or rarefaction curves (Fig. 3) revealed highly significant differences among forest types. Pairwise comparisons showed higher species richness in natural forest than in old teak and fuelwood plantations. Multiple regression retained two explanatory variables for
57
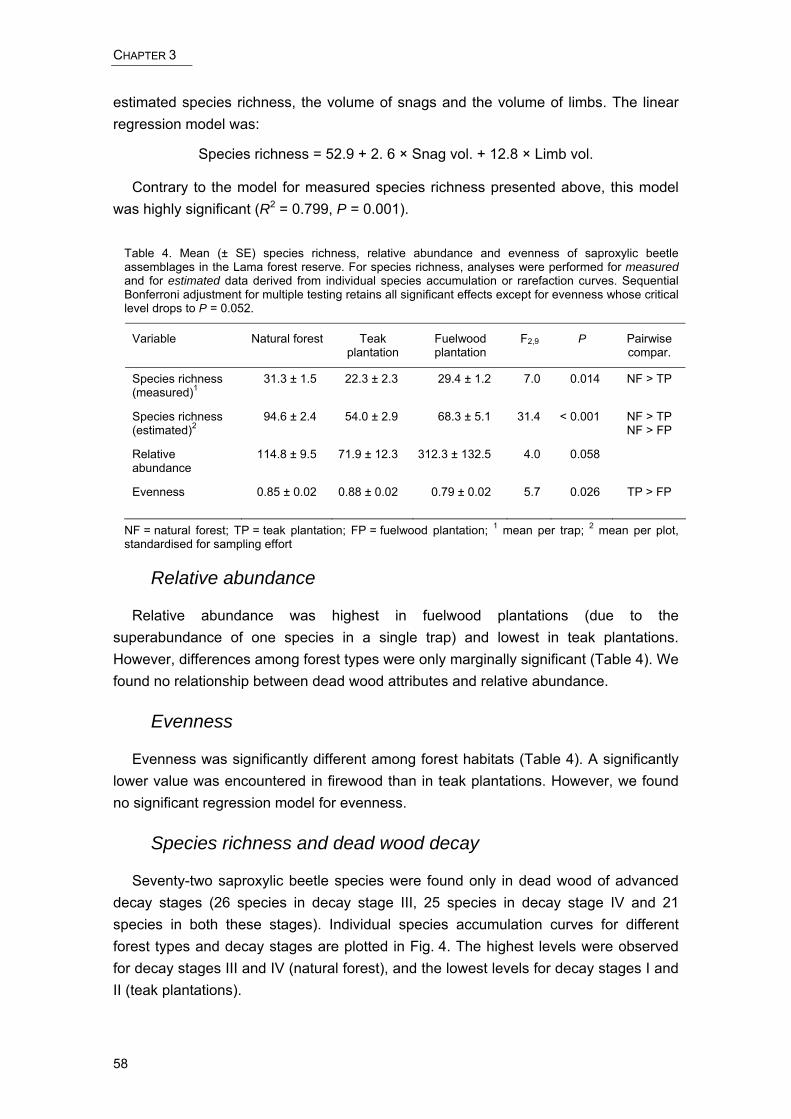
CHAPTER 3
estimated species richness, the volume of snags and the volume of limbs. The linear regression model was:
Species richness = 52.9 + 2. 6 × Snag vol. + 12.8 × Limb vol.
Contrary to the model for measured species richness presented above, this model was highly significant (R2 = 0.799, P = 0.001).
Table 4. Mean (± SE) species richness, relative abundance and evenness of saproxylic beetle assemblages in the Lama forest reserve. For species richness, analyses were performed for measured and for estimated data derived from individual species accumulation or rarefaction curves. Sequential Bonferroni adjustment for multiple testing retains all significant effects except for evenness whose critical level drops to P = 0.052.
Variable Natural forest Teak plantation
Fuelwood plantation
F2,9 P Pairwise compar.
Species richness (measured)1
31.3 ± 1.5 22.3 ± 2.3 29.4 ± 1.2 7.0 0.014 NF > TP
Species richness (estimated)2
94.6 ± 2.4 54.0 ± 2.9 68.3 ± 5.1 31.4 < 0.001 NF > TP NF > FP
Relative abundance
114.8 ± 9.5 71.9 ± 12.3 312.3 ± 132.5 4.0 0.058
Evenness 0.85 ± 0.02 0.88 ± 0.02 0.79 ± 0.02 5.7 0.026 TP > FP
NF = natural forest; TP = teak plantation; FP = fuelwood plantation; 1 mean per trap; 2 mean per plot, standardised for sampling effort
Relative abundance
Relative abundance was highest in fuelwood plantations (due to the superabundance of one species in a single trap) and lowest in teak plantations. However, differences among forest types were only marginally significant (Table 4). We found no relationship between dead wood attributes and relative abundance.
Evenness
Evenness was significantly different among forest habitats (Table 4). A significantly lower value was encountered in firewood than in teak plantations. However, we found no significant regression model for evenness.
Species richness and dead wood decay
Seventy-two saproxylic beetle species were found only in dead wood of advanced decay stages (26 species in decay stage III, 25 species in decay stage IV and 21 species in both these stages). Individual species accumulation curves for different forest types and decay stages are plotted in Fig. 4. The highest levels were observed for decay stages III and IV (natural forest), and the lowest levels for decay stages I and II (teak plantations).
58
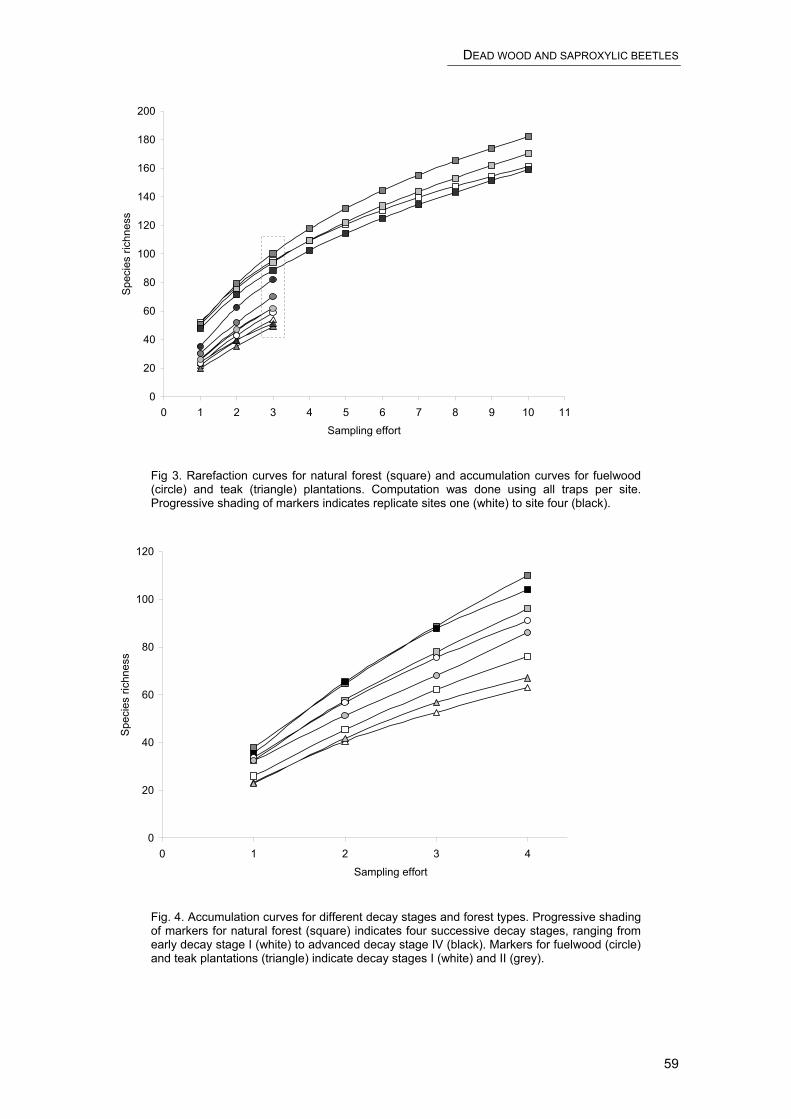
DEAD WOOD AND SAPROXYLIC BEETLES
0
20
40
60
80
100
120
140
160
180
200
0 1 2 3 4 5 6 7 8 9 10 11
Sampling effort
Spe
cies
rich
ness
Fig 3. Rarefaction curves for natural forest (square) and accumulation curves for fuelwood (circle) and teak (triangle) plantations. Computation was done using all traps per site. Progressive shading of markers indicates replicate sites one (white) to site four (black).
0
20
40
60
80
100
0 1 2 3
120
5
Sampling effort
Spe
cies
rich
ness
4
Fig. 4. Accumulation curves for different decay stages and forest types. Progressive shading of markers for natural forest (square) indicates four successive decay stages, ranging from early decay stage I (white) to advanced decay stage IV (black). Markers for fuelwood (circle) and teak plantations (triangle) indicate decay stages I (white) and II (grey).
59

CHAPTER 3
Preferences for specific tree species
Sixteen beetles were identified as indicator species and can be considered as specialists for specific dead wood tree species. Eight indicators were cerambycids. The other ones were species of Tenebrionidae, Curculionidae, Eucnemidae and Carabidae. Half of the dead wood specialists were reared from D. guineense. A separate indicator analysis for all leguminous trees (D. guineense, A. africana and S. siamea) found no specialist beetles for this plant family as a whole.
Preferences for specific decay stages
The analysis of specialists for particular decay stages found two species for decay stage I (Cerambycidae and Curculionidae) and one species for decay stage III (Tenebrionidae). However, when pooling early (I and II) and advanced (III and IV) decay stages, the analysis was more discriminative and revealed seven species in the early decay stages (species of Cerambycidae, Curculionidae, Cucujidae, Bostrichidae) and six in the advanced decay stages (species of Cerambycidae, Mordellidae and Scarabaeidae).
Saproxylic beetle assemblages
The DCA ordination of dead wood (all emergence traps included) clearly segregated dead wood assemblages from natural forest (left) and those from plantations (right) (Fig. 5). No other ecological grouping of traps was evident from the ordination.
The proportion of variance represented by the first axis of the DCA was 0.378. Multiple regression identified three significant predictors of axis one scores, the volumes of coarse woody debris (CWD), dead wood of decay stage I (DW-I) and large dead wood items (DW-30) (R2 = 0.786, F3,64 = 76.6, P < 0.001). The regression equation is:
Axis 1 = 283.0 – 8.9 × CWD vol. – 19.5 × DW-I vol. + 4.9 × DW-30 vol.
The proportion of variance represented by the second axis was 0.055. Axis two scores were best predicted by two variables, the volume of snags and the one of dead wood of decay class I (DW-I) (R2 = 0.165, F2,65 = 6.4, P = 0.003). The corresponding regression equation is:
Axis 2 = 112.6 – 5.7 × Snag vol. + 12.0 × DW-I vol.
60
DEAD WOOD AND SAPROXYLIC BEETLES
1-I
2-I
3-I
4-I
1-I
2-I
3-I4-I
1-I
2-I4-I
3-I
1-II
2-II
3-II
4-II
1-II
2-II
3-II
4-II
1-II
2-II
4-II
3-II
1-III
2-III
3-III
4-III
1-IV2-IV
3-IV
4-IV
1-Aa
2-Aa3-Aa
4-Aa
1-Al2-Al
3-Al
4-Al
1-Cp
2-Cp
3-Cp
4-Cp
1-Dg
2-Dg3-Dg
4-Dg
1-Dm
2-Dm
3-Dm
4-Dm
1-Ma
2-Ma
3-Ma4-Ma
1-Ss
2-Ss
4-Ss
3-Ss
1-Tg
2-Tg
3-Tg
4-Tg
1-Xx
2-Xx
3-Xx
4-Xx
00
50 100 150 200 250 300 350
50
100
150
200
250
Axis 1 [0,378]
Axi
s2
[0,0
55 ]
1-I
2-I
3-I
4-I
1-I
2-I
3-I4-I
1-I
2-I4-I
3-I
1-II
2-II
3-II
4-II
1-II
2-II
3-II
4-II
1-II
2-II
4-II
3-II
1-III
2-III
3-III
4-III
1-IV2-IV
3-IV
4-IV
1-Aa
2-Aa3-Aa
4-Aa
1-Al2-Al
3-Al
4-Al
1-Cp
2-Cp
3-Cp
4-Cp
1-Dg
2-Dg3-Dg
4-Dg
1-Dm
2-Dm
3-Dm
4-Dm
1-Ma
2-Ma
3-Ma4-Ma
1-Ss
2-Ss
4-Ss
3-Ss
1-Tg
2-Tg
3-Tg
4-Tg
1-Xx
2-Xx
3-Xx
4-Xx
00
50 100 150 200 250 300 350
50
100
150
200
250
Axis 1 [0,378]
Axi
s2
[0,0
55 ]
Fig. 5. Detrended correspondence analysis of sampling units (traps) in species space. Circle = natural forest, square = fuelwood plantations, triangle = teak plantations; replicate sites are marked with numerals 1 to 4 and decay stages with I (early decay stage) to IV (advanced decay stage); Aa = Afzelia africana, Al = Anogeissus leiocarpus, Cp = Ceiba pentandra, Dg = Dialium guineense, Dm = Diospyros mespiliformis, Mm = Mimusops andongensis, Zz = Zanthoxylum zanthoxyloides, Tg = Tectona grandis and Ss = Senna siamea.
Discussion
Dead wood
The amount of dead wood of all different types, decay stages and size classes was generally higher in natural forest than in plantations, reflecting the importance and diversity of dead wood habitats in natural forest remnants of the Noyau central. The overall paucity of dead wood items in teak and fuelwood plantations, in particular the lack of strongly decayed wood, results from various human activities. First, plantation trees cannot reach overmature stages that would generate dead wood since the intention is to harvest trees before they die naturally (Nicholson et al., 1983). This holds particularly for fuelwood plantations which are harvested at a maximum age of 20 years. Second, after the felling of trees, logging residues are systematically collected by the local population, either for their own use or as a commodity. The cumulative effect of these practices is the near absence of strongly decayed and a deficit in newly generated dead wood. In particular, dead wood originating from large trees is essentially absent from plantations. It is this type of dead wood which is known to provide the most diverse and favourable habitats for a variety of rare and highly
61
CHAPTER 3
specialized saproxylic species (Jonsell et al., 1998). Hence, these species can hardly survive in plantations.
In natural forest, advanced decay stages dominated. Since the eviction of residents from the Noyau central in 1988, anthropogenic removal of dead wood has been negligible. Thus, dead wood is decomposed mainly in situ. The residence time of moderately decayed dead wood may be relatively short, leading to the dominance of dead wood of advanced decay stages. In boreal forests of central Europe, dead wood volumes can reach as much as 300 m3 ha-1 (Korpel, 1995). In Lama forest, the maximum volume found was 41.8 m3 ha-1. This confirms results from studies in other tropical forests which found volumes between 33 and 126 m3 ha-1 (Harmon et al., 1995). The lower amount in tropical forests compared to most temperate and boreal forests appears to be due mainly to higher decay rates (Grove, 2001). For example, the mean residence time of coarse litter in central Amazonia was only 5.9 years (Chamber et al., 2000). A study in Lama forest showed that leaf litter decay in natural forest was faster than in most other tropical forests (Attignon et al., in press). We would therefore also expect a rapid wood decay.
Besides, the low amount of dead wood may also be related to the peculiar structure and physiognomy of natural forest patches in the Noyau central. Most study sites were characterised by a high frequency of stems in small diameter classes (Fig. 1a), indicating a relatively young age structure which in turn may be due to earlier anthropogenic disturbances incurred before the resettlement of forest settlers in 1988. Young forests generate only a low amount of dead wood. Oldeman (1983) found that dead wood generation in tropical forest reaches a peak in late successional stages. This is supported by our observation that the highest volume of dead wood (41.8 m3 ha-1) in Lama forest was recorded on a site showing the lowest basal area (19.7 m2 ha-1), suggesting that this site may have reached a senescent stage.
In the present study, no snags were found on the study sites located in forest plantations. Subsequent surveys, however, revealed that snags occur at very low densities in both teak and fuelwood plantations. Saproxylic beetle assemblages of snags will be the subject of Chapter 4.
Species richness of saproxylic beetles
Both measured and estimated species richness of saproxylic beetle assemblages were significantly higher in natural forest than in plantations. However, the latter was clearly the more discriminative variable because it integrated species richness data from various types of dead wood, including all decay stages and different tree species. This was achieved by first determining total species richness in natural forest (species from all traps pooled) and then rarefying species richness to the point where the sampling effort was equivalent to the one for plantation forests, i.e., at three sampling
62
DEAD WOOD AND SAPROXYLIC BEETLES
units. Such a high diversity of dead wood was not available in plantations, which explains why we reduced the sampling effort. Putting equal effort into the rearing of saproxylic beetles from dead wood collected in plantations – with only one tree species and two decay stages each – would not only have produced redundant data but would also have surpassed our sampling capacity. To conclude, a higher sampling effort in natural forest was necessary because of the high diversity of dead wood therein. Rarefaction was an a posteriori means of standardisation by sampling effort so as to compare species richness of saproxylic beetles from natural and plantation forests.
Quality and quantity of dead wood and hence saproxylic species richness in the plantations of Lama forest are greatly affected by the anthropogenic removal of dead wood. These activities result in a scarcity of large and/or strongly decayed dead wood items. Even though, the number of species reared from dead wood collected in plantations was not as low as expected. To the contrary, species richness was high relative to the low amount and diversity of dead wood habitats. This may explain why only few of the many dead wood character variables showing significant differences among natural forest and plantations were significant explanatory variables in multiple regression analyses. In particular, factors such as the amount of large-sized and strongly decayed dead wood pieces which are known to enhance species richness (Kleinevoss et al., 1996; Kolström and Lumatjärvi, 2000) did not seem to be so important in our study. Nevertheless, rarefied (estimated) species richness was significantly related to two similar variables, the volume of limbs and the volume of snags, i.e., species diversity increased with increasing volumes of limbs and snags. These two types of dead wood share several ecological and management properties. (i) Not lying on the ground, they provide habitats for saproxylic species adapted to drier and warmer conditions (Jonsell and Weslien, 2003). (ii) They usually collapse before reaching an advanced degree of decay. (iii) Due to their size and architecture, they are not systematically removed by the local population.
Overall arthropod diversity
Our finding that the diversity of saproxylic beetles was higher in natural forest than in plantations – while being equal among teak and fuelwood plantations – contrasts with a previous study on arthropod diversity which showed that old teak plantations were among the most species-rich forest habitats and fuelwood plantations the poorest (Lachat et al., in press, see Chapter 1). Moreover, the same study found no difference in species richness among natural forest and plantations. This shows that overall diversity of invertebrates in tropical forests can hardly be predicted from single inventories of selected taxonomic or functional groups. A more comprehensive account requires repeated inventories of a wide spectrum of invertebrate assemblages.
63
CHAPTER 3
Superabundance in fuelwood plantations
In fuelwood plantations, saproxylic beetle assemblages were dominated by several small-sized, superabundant species of the families Cucujidae, Colydiidae, Platypodidae and Scolytidae. The dominance was also reflected in a significantly lower evenness compared to teak plantations. The massive emergence of these species in fuelwood plantations may be due to the wood quality of S. siamea. This species is a fast growing, soft wood leguminous (not nitrogen fixing) plantation tree whose dead wood appears to be rapidly colonized by small saproxylic invertebrates with short life-cycles.
Singletons
The proportion of singletons (29%) in our study was lower than the one found in an Australian tropical forest (≈ 43%; Grove, 2001). However, the Australian study used window (flight intercept) traps which capture a different portion of the saproxylic fauna. Specifically, they are designed to intercept flying insects. Thus captures depend on the flight activity. In contrast, emergence traps measure the abundance of beetles reared from a definite quantity of dead wood. Because most saproxylic beetles lay more than one egg on the same piece of decaying wood, the probability to rear and capture several individuals of the same species is higher than with intercept traps.
Saproxylic beetle assemblages
The two main groups of saproxylic beetle assemblages obtained in the DCA reflect the gross division of Lama forest into two different forest types, natural forest and plantations. It underlines the importance of silvicultural and forest management practices for the composition of saproxylic beetle assemblages. Within these two main groups, it was not possible to clearly distinguish subgroups of sampling sites, decay class or tree species. An exception was the concentration of assemblages associated with teak wood in the centre of the main group “plantations”. Dead wood assemblages within the main group “natural forest” are more widely dispersed which may be due to the high heterogeneity of dead wood habitats (different tree species and decay stages).
Saproxylic beetle assemblages were related to the amount of (a) recently dead wood (decay stage I), (b) large pieces of dead wood and (c) coarse woody debris (axis one), or to the amount of (a) recently dead wood and (b) snags (axis two).
In both regression models, the regression coefficient was highest for the variable “decay stage I”, indicating that recently dead wood was crucial to the composition of beetle assemblages. In natural forest, recently dead wood passes through all decay stages, and the nutrients are recycled in situ. In plantations, wood items are usually collected before reaching advanced decay stages. The removal of dead wood leads to a depletion of soil nutrients and reduces the diversity of habitats for saproxylic beetles. Despite the short residence time of dead wood in plantations we found characteristic and species-rich saproxylic beetles assemblages. These appear to be well adapted to
64
DEAD WOOD AND SAPROXYLIC BEETLES
a dead wood decomposition regime in which habitats are available only for short periods of time (McPeek and Holt, 1992).
Larger pieces of dead wood are known to provide important habitats to saproxylic arthropods, including rare and threatened species. They are generated mainly in old-aged forests with a high proportion of trees of large diameters. A positive relationship between the diversity of saproxylic insects and the frequency of large diameters has been found in several studies (Kleinevoss et al., 1996; Jonsell et al., 1998; Martikainen et al., 2000; Grove, 2002c). The ecological value of larger-diameter material is due to several reasons. First, decomposition is slow. Thus, large dead wood pieces may harbour species with long life cycles. Second, as the decomposition proceeds, they develop a diversity of habitats (e.g., different decay stages) and resources (e.g., different fungal species). Thus, highly specialised saproxylics may colonize different micro-habitats within the same piece of wood at the same time (Kolström and Lumatjärvi, 2000).
The importance of the other predictors included in the models (CWD and/or snags) shows that dead wood architecture and exposure may also influence the composition of the saproxylic fauna. Abiotic (e.g., humidity, temperature) and biotic (e.g., fungal growth) features of decay depend on whether or not dead wood is in contact with the soil. To maintain a high diversity of saproxylic beetle assemblages, both of these types of dead wood must be present.
Dead wood preferences
The association of saproxylic beetles with specific types of dead wood depends on a range of factors, including tree species or family (hence wood quality), decay stage, size, exposure as well as the composition of wood-decomposing fungal communities. Preferences for specific host wood are rare at the species level but common at higher taxonomic levels (genus, family) (Basset et al., 1996, Tavakilian et al., 1997). Some saproxylic species show clear preferences for recently dead wood (Hamilton, 1978; see Chapter 2). A high degree of specificity in host wood selection might be advantageous in forests dominated by few abundant species (Beaver, 1979). In Lama forest, D. guineense is the most abundant tree, its dead wood representing more than 50% of the total amount of dead wood. It was therefore not surprising that half of the specialist beetles identified preferred this species.
Several beetles showed significant preferences for the exotic trees T. grandis (three species) or S. siamea (one species). Unfortunately, we have no information about their origin and biogeography that would allow us to decide whether they are introduced or indigenous species. The interpretation is further complicated by the lack of taxonomic and ecological data. Further studies are required to collect this information.
Caesalpiniaceae was the only family represented by several species for which we could test dead wood preferences at the family level. However, we found no significant
65
CHAPTER 3
preferences for caesalpiniaceous dead wood. While a preference for the family as a whole may indeed not exist, it is also possible that the distance between natural forest with D. guineense and A. africana on the one hand and S. siamea fuelwood plantations on the other hand was too long (> 4 km), or that the exotic tree species was not attractive to Caesalpiniaceae specialists.
As the diversity and biomass of dead wood-decomposing fungi increases, the range of saproxylic colonisers of decaying wood broadens. For many species, these saprophytic fungi are the essential factor in dead wood habitat or host selection (Jonsell et al., 1998). We found only three species with significant preferences for individual decay stages (I and III) but 13 species when distinguishing early (classes I and II pooled) and late (classes III and IV pooled) decay. This suggests that the different decay classes represent a spatio-temporal continuum of wood decomposition rather than distinct decay sequences, and that preferences for certain decay stages become apparent only towards the extremes (i.e., recently dead versus rotten wood).
To conclude, we found more preferences for individual tree species than for individual decay stages. Similar observations were made in a boreal forest in Scandinavia (Jonsell et al., in press). However, more tree species should be investigated to confirm host tree fidelity of specialists identified in this study.
Conclusions
To our knowledge, this is the first study of saproxylic beetle assemblages in tropical West Africa and their relationship with dead wood attributes. Our objective was to provide an overview of this important and largely neglected functional group in Lama forest, and to explore conditions for its conservation.
The overall amount and quality of dead wood in teak and fuelwood plantations was lower than in natural forest. Types of dead wood known to be particularly species-rich were either rare or absent (snags, large and/or strongly decomposed wood items). Due to the low dead wood habitat diversity in forest plantations, a full complement of saproxylic beetles was not retained. Consequently, species richness was lower than in natural forest, and species assemblages were found to be distinctly different from those in natural forest. Nevertheless, given the low amount and quality of dead wood, saproxylic beetle diversity in plantations was surprisingly high. Moreover, nearly 25% of all species were found only in plantations (Lachat, unpublished data). This demonstrates that even small quantities of dead wood, however dispersed, may enhance the diversity of saproxylic insect assemblages.
The plantations in Lama forest have been established mainly to provide the human population with alternative timber and fuelwood resources, thereby preserving the remaining tracts of natural forest. From a conservation standpoint, this is certainly the most important objective. However, single-objective forest management and protection
66
DEAD WOOD AND SAPROXYLIC BEETLES
approaches are considered to be increasingly unattractive (Lamb, 1998). Creating plantations to reduce the pressure on natural forest should not preclude measures enhancing the biodiversity in plantations. Moreover, plantations can be managed so as to enhance dead wood resources available to saproxylic insects without compromising economic benefits. At the landscape level, management measures should aim to promote and maintain ecological processes characteristic of natural forests by allowing some trees to live to ecological maturity and subsequent decay without intervention (Grove, 2002b). To create dead wood habitats in the short term, some logs or high stumps should be retained during logging or harvesting operations (Jonsell et al., in press). In the teak plantations in Lama forest, such measures are unlikely to cause economic losses, because the wood at buttress level is often of inferior quality (hollow trunks). In order to restore natural forest dynamics in the long term, restoration of natural forest patches should be promoted.
The provision of dead wood resources in plantations would not only benefit saproxylic insect assemblages, but also vertebrates feeding on them, e.g. woodpeckers, soricids and lizards.
Acknowledgements
This study was funded by the Swiss National Science Foundation and the Swiss Agency for Development and Cooperation. It was carried out in the framework of the project “BioLama”. We thank all BioLama staff for their support, especially M. Guedegbé, C. Houngbedji, L. Konetche. We are grateful to P. Houayé, R. Akossou, D. Honfozo, H. Hodonou and A. V. N'velin of the Office National du Bois.
References
Attignon, S.E., Weibel, D., Lachat, T., Sinsin, B., Nagel, P., Peveling, R., Leaf litter breakdown in natural and plantation forests of the Lama forest reserve in Benin. Applied Soil Ecology, in press.
Basset, Y., Samuelson, G.A., Miller, S.E., 1996. Similarities and contrasts in the local insect faunas associated with ten forest tree species of New Guinea. Pacific Science, 50, 157-183.
Beaver, R.A., 1979. Host specificity of temperate and tropical animals. Nature, 281, 139-141.
Bretz-Guby, N.A., Dobbertin, M., 1996. Quantitative estimates of coarse woody debris and standing trees in selected Swiss forests. Global Ecology and Biogeography Letters, 5, 327-341.
67

CHAPTER 3
Chambers, J.Q., Higuchi, N., Schimel, J.P., Ferreira, L.V., Melack, J.M., 2000. Decomposition and carbon cycling of dead trees in tropical forests of the central Amazon. Oecologia Berlin, 122, 380-388.
Coleman, B.D., 1981. On random placement and species-area relations. Mathematical Biosciences, 54, 191-215.
Colwell, R.K., 1997. EstimateS: Statistical estimation of species richness and shared species from samples, http://viceroy.eeb.uconn.edu/estimates.
Dufrêne, M. Legendre, P., 1997. Species assemblages and indicator species: the need of a flexible asymmetrical approach. Ecological monographs, 67, 345-366.
Elton, C.S., 1966. Dead and dying wood: the pattern of animal communities. John Wiley & Sons Inc., New York.
Gotelli, N.J. Colwell, R.K., 2001. Quantifying biodiversity: procedures and pitfalls in the measurement and comparison of species richness. Ecological Letters, 4, 379-391.
Grove, S.J., 2000. Trunk window trapping: an effective technique for sampling tropical saproxylic beetles. Memoirs of the Queensland Museum, 46, 149-160.
Grove, S.J., 2001. Extent and composition of dead wood in Australian lowland tropical rainforest with different management histories. Forest Ecology and Management, 154, 35-53.
Grove, S.J., 2002a. The influence of forest management history on the integrity of the saproxylic beetle fauna in an Australian lowland tropical rainforest. Biological Conservation, 104, 149-171.
Grove, S.J., 2002b. Saproxylic insect ecology and the sustainable management of forests. Annu. Rev. Ecol. Syst, 33, 1-23.
Grove, S.J., 2002c. Tree basal area and dead wood as surrogate indicators of saproxylic insect faunal integrity: a case study from the Australian lowland tropics. Ecological Indicators, 1, 171-188.
Hamilton, W.D., 1978. Evolution and diversity under bark. In: Mound, L.A., Waloff, N. (Eds.), Diversity of insect fauna. R. Entomol. Soc. London, London.pp. 154-175.
Hammond, P.M., Kitching, R.L., Stork, N.E., 1996. The composition and richness of the tree-crown Coleoptera assemblage in an Australian subtropical forest. Ecotropica, 2, 99-108.
Hanski, I., Hammond, P.M., 1995. Biodiversity in boreal forests. Trends in Ecology and Evolution, 10, 5-6.
Harmon, M.E., 2002. Moving towards a new paradigm for woody detritus management. USDA Forest Service Gen. Tech. Rep. PSW-GTR-181.
Harmon, M.E., Sexton, J., 1996. Gidelines for measurements of woody detritus in forest ecosystems, http://lternet.edu/documents/Publications/woodydetritus.
Harmon, M.E., Whigham, D.F., Sexton, J., & Olmsted, I., 1995. Decomposition and mass of woody detritus in the northeastern Yucatan peninsula, Mexico. Biotropica, 27, 305-316.
Irmler, U., Heller, K., Warning, J., 1996. Age and tree species as factors influencing the populations of insects living in dead wood (Coleoptera, Diptera: Scaridae, Mycetophilidae). Pedobiologia, 40, 134-148.
68
DEAD WOOD AND SAPROXYLIC BEETLES
Jonsell, M., Weslien, J., 2003. Felled or standing retained wood – it makes a difference for saproxylic beetles. Forest Ecology and Management, 175, 425-435.
Jonsell, M., Weslien, J., Ehnström, B., 1998. Substrate requirements of red listed saproxylic invertebrates in Sweden. Biodiversity and Conservation, 7, 749-764.
Jonsell, M., Nitterus, K., Stighall, K., Saproxylic beetles in natural and man-made deciduous high stumps retained for conservation. Biological Conservation, in press.
Kaila, L., Martikainen, P., Punttila, P., 1997. Dead trees left in clear-cuts benefit saproxylic Coleoptera adapted to natural disturbances in boreal forest. Biodiversity and Conservation, 6, 1-18.
Kleinevoss, K., Topp, W., Bohac, J., 1996. Buchen-Totholz im Wirtschaftswald als Lebensraum für xylobionte Insekten. Zeitschrift für Ökologie und Naturschutz, 5, 85-95.
Köhler, F., 2000. Totholzkäfer in Naturwaldzellen des nördlichen Rheinlandes, Landesamt für Agrarordnung Nordrhein-Westfalen edn. LÖBF- Schriftenreihe, Recklinghausen.
Kolström, M., Lumatjärvi, J., 2000. Saproxylic beetles on aspen in commercial forests: A simulation approach to species richness. Forest Ecology and Management, 126, 113-120.
Korpel, S., 1995. Die Urwälder der Westkarpaten Fischer Verlag, Stuttgart, Jena, New York.
Lachat, T., Attignon, S., Djego, J., Goergen, G., Nagel, P., Sinsin, B., Peveling, R., Arthropod diversity in Lama forest reserve (South Benin), a mosaic of natural, degraded and plantation forests. Biodiversity and Conservation, in press.
Laiho, R., Prescott, C.E., 1999. The contribution of coarse woody debris to carbon, nitrogen, and phosphorus cycles in three Rocky Mountain coniferous forests. Canadian Journal of Forest Research, 29, 1592-1603.
Lamb, D., 1998. Large-scale ecological restoration of degraded tropical forest lands: The potential role of timber plantations. Restoration Ecology, 6, 271-279.
Mackensen, J., Bauhus, J., Webber, E., 2003. Decomposition rates of coarse woody debris: A review with particular emphasis on Australian tree species. Australian-Journal-of-Botany, 51, 27-37.
Magurran, A.E. 2003. Measuring biological diversity. Blackwell Pubishing, Oxford.
Martikainen, P., Siitonen, J., Punttila, P., Kaila, L., Rauh, J., 2000. Species richness of Coleoptera in mature managed and old-growth boreal forests in southern Finland. Biological Conservation, 94, 199-209.
McCune, B., Mefford, M.J., 1999. PC-ORD: Multivariate Analysis of Ecological Data. MjM Software Design, Gleneden Beach, Oregon.
McPeek, M.A., Holt, R.D., 1992. The evolution of dispersal in spatially and temporally varying environments. American Naturalist, 140, 1010-1027.
Mühlenberg, M., 1993. Freilandökologie Quelle und Meyer, Heidelberg, Wiesbach.
New, T.R., 1998. Invertebrate surveys for conservation. Oxford University Press, Oxford, New York, Tokyo.
69

CHAPTER 3
Nicholson, D.I., Henry, N.B., Rudder, J., Anderson, T.M., 1983. Research basis on rainforest management in north Queensland. In Proceedings of the 15th Pacific Science Congress, Dunedin.
Okland, B., Bakke, A., Hagvar, S., Kvamme, T., 1996. What factors influence the diversity of saproxylic beetles? A multiscaled study from a spruce forest in southern Norway. Biodiversity and Conservation, 5, 75-100.
Oldeman, R.A.A., 1983. Dead wood in tropical rainforest (In Dutch with English summary). Ned. Bosb. Tijdschr., 55.
Specht, I., 2002. La foret de la Lama, Bénin SIG basé sur Landsat 7. Opuscula Biogeographica Basileensia II, Bâle, Suisse.
Speight, M.C.D., 1989. Saproxylic invertebrates and their conservation. Concil of Europe, Strasbourg.
Tavakilian, G., Berkov, A., Meurer-Grimes, B., Mori, S., 1997. Neotropical Tree species and their faunas of xylophagous longicorns (Coleoptera: Cerambycidae) in French Guiana. The Botanical Review, 63, 304-355.
70

CHAPTER 4 – SAPROXYLIC BEETLES ON SNAGS
Saproxylic beetle assemblages on native and exotic snags
in a West African tropical forest
Thibault Lachat, Ralf Peveling, Serge Attignon, Georg Goergen, Brice Sinsin and Peter Nagel
Manuscript
Abstract
Standing dead trees (snags) and their saproxylic (dependent on dead wood) beetle assemblages were studied in the Lama forest reserve in Benin, West Africa. The study comprised several snag species in different forest systems (native snag species in protected forest and exotic snag species in plantations) and types (natural semi-deciduous forest, degraded forest, teak plantations, fuelwood plantations). We compared native snag species in protected forest and exotic snag species in plantations. The snag beetle fauna was sampled for a total of 12 weeks during one year, using trunk window traps. To distinguish saproxylic and non-saproxylic beetles, we also sampled an equal number of live trees (controls). Species richness, relative abundance and the number of singletons (species sampled only once) of saproxylic beetle assemblages were similar among native and exotic snags. However, overall species richness and beta-diversity of snag beetle assemblages were higher for native than for exotic snags, reflecting a high heterogeneity in habitat quality among the snags in natural forest. Thus, snag beetle assemblages were influenced mainly by the forest system. From a dead wood management point of view, it is suggested that the retention or creation of snags in natural forest as well as in plantations can enhance and preserve the diversity of the saproxylic beetle fauna.
Key words: Dead wood, Natural forest, Plantations, Snag, Saproxylic beetle assemblages, Trunk window trap
71

CHAPTER 4
Introduction
In view of high deforestation rates on the one hand and a high demand for wood and wood products on the other, there is a growing need for large-scale reforestation and afforestation programmes in the tropics. However, single-objective forest plantation management in terms of maximizing wood production is an increasingly unattractive option (Lamb 1998). In addition to producing timber or fuelwood, plantation forestry should also aim to maintain and enhance biodiversity (Kolström and Lumatjärvi 2000), and to contribute to the protection of natural forests.
In tropical forests, dead wood-associated (saproxylic) invertebrates make up a large part of the total invertebrate diversity (Hammond et al. 1996). Therefore, the management of dead wood is crucial to the conservation of invertebrate diversity in both natural and plantation forests. Saproxylic organisms include species that are dependent, during some part of their life-cycle, upon dead or dying wood of moribund or dead trees (standing or fallen), or upon wood-inhabiting fungi, or upon the presence of other saproxylics (Speight 1989). Decaying wood is an extremely heterogeneous substrate with hundreds of different microhabitats hosting a great variety of species, especially beetles (Siitonen 2001). Moreover, saproxylic beetle assemblages differ greatly among different types of dead wood (Sverdrup- Palm 1959; Thygeson and Ims 2002). Dead wood lying on the ground is exposed to more humid conditions than standing dead wood (snags), which is exposed to drier conditions and to higher temperature and humidity fluctuations (Hunter 1990). To design and adopt effective and practicable conservation strategies for saproxylic beetles, it is therefore important to understand their respective specialization patterns (Kaila et al. 1994).
During the past 20 years, saproxylics were studied mainly in temperate forests of the northern hemisphere (e.g. Speight 1989; Siitonen 1994; Köhler 2000; Martikainen et al. 2000; Schiegg 2000; Jonsell et al. 2004; Martikainen and Kaila, in press). These studies revealed that saproxylic beetle assemblages are highly susceptible to forest management. In contrast, only few studies have been done in tropical forest ecosystems, most of them in tropical Australia (Grove 1999, 2000, 2001, 2002a, 2002b, 2002c). The results of these studies await validation from tropical forests of all other continents.
With more than 650 million ha, the African continent represents one sixth of the world forest area. The annual decline in forest cover (-0.8%) due to deforestation or conversion to cropland is the highest in the world (FAO 2003). These changes are expected to cause dramatic changes in the diversity and composition of saproxylic invertebrate assemblages. A study conducted in the Lama forest reserve in Benin, West Africa, showed great differences of the saproxylic fauna among natural and plantation forests (see Chapter 3). These were related to different forest management practices and use patterns, including the removal of dead wood for fuelwood by the
72
SAPROXYLIC BEETLES ON SNAGS
local population. Notably, the study found that even small amounts of dead wood in plantation forests harbour a high diversity of saproxylic beetles, and that the volume of snags is an important factor determining saproxylic beetle assemblages.
The goal of the present study was to follow up these findings by evaluating the importance of snags for the conservation of saproxylic beetle assemblages in Lama forest. Our specific objective was to compare beetle assemblages from native snag tree species in remnants of natural forest (including degraded forest) in the central part of the reserve (Noyau central) with those from exotic snag tree species in monospecific plantations surrounding the Noyau central.
Materials and Methods
Study area
The Lama forest reserve is located about 80 km north of Cotonou (6°55.8’ to 6°58.8’ N and 2°4.2’ to 2°10.8’ E), covering an area of 16,250 ha in a shallow depression between the Allada and Abomey plateaus. The forest is situated in the Dahomey gap, a low rainfall zone separating the western and eastern part of the humid Guineo-Congolian evergreen and semi-evergreen forests of West and West-central Africa (White 1983). The annual rainfall is about 1,200 mm, with a pronounced dry season from November to March (Sayer et al. 1992). The prevailing soils are hydromorphic vertisols and sandy ferralsols. The natural vegetation is a semi-deciduous forest, belonging to the drier peripheral semi-evergreen Guineo-Congolian rain forest system (White 1983). Remnants of this forest type are nowadays confined to the Noyau central (4,800 ha) which has been strictly protected since 1988. The forests within the Noyau central are characterised by of a small-scale mosaic of natural forest and abandoned, gradually recovering slash-and-burn patches (Specht 2002). The Noyau central is surrounded by teak (Tectona grandis, 7,000 ha) and fuelwood plantations (mainly Senna siamea and Acacia auriculiformis, 2,400 ha).
Study sites
We studied snags in each of two different forest types within two main forest systems, protected forest (Noyau central) and forest plantations. The forest types comprised (1) natural and (2) degraded forest in the Noyau central (native tree species), and (3) teak and (4) fuelwood plantations in forest plantations (exotic tree species).
The vestiges of natural forest within the Noyau central are dominated by tree species such as Afzelia africana, Ceiba pentandra, Dialium guineense, Diospyros mespiliformis, Drypetes floribunda, Celtis brownii and Mimusops andongensis. The understorey vegetation is dense and canopy height reaches up to 25 meters.
73
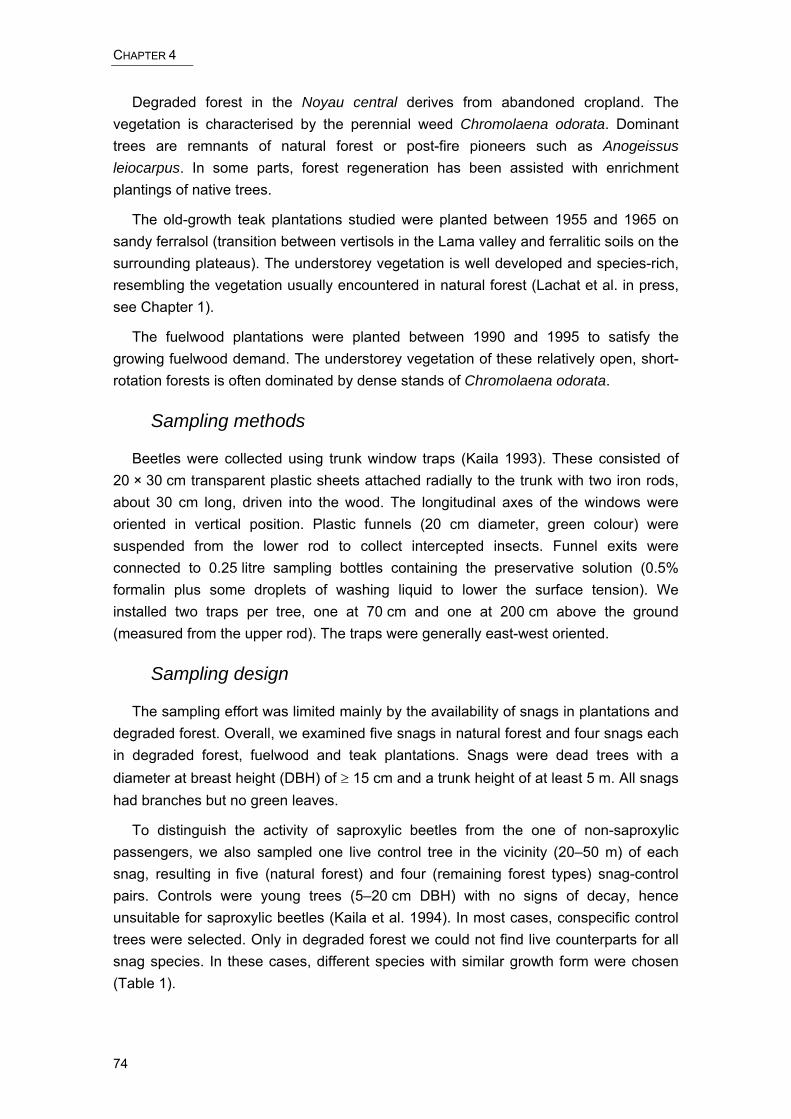
CHAPTER 4
Degraded forest in the Noyau central derives from abandoned cropland. The vegetation is characterised by the perennial weed Chromolaena odorata. Dominant trees are remnants of natural forest or post-fire pioneers such as Anogeissus leiocarpus. In some parts, forest regeneration has been assisted with enrichment plantings of native trees.
The old-growth teak plantations studied were planted between 1955 and 1965 on sandy ferralsol (transition between vertisols in the Lama valley and ferralitic soils on the surrounding plateaus). The understorey vegetation is well developed and species-rich, resembling the vegetation usually encountered in natural forest (Lachat et al. in press, see Chapter 1).
The fuelwood plantations were planted between 1990 and 1995 to satisfy the growing fuelwood demand. The understorey vegetation of these relatively open, short-rotation forests is often dominated by dense stands of Chromolaena odorata.
Sampling methods
Beetles were collected using trunk window traps (Kaila 1993). These consisted of 20 × 30 cm transparent plastic sheets attached radially to the trunk with two iron rods, about 30 cm long, driven into the wood. The longitudinal axes of the windows were oriented in vertical position. Plastic funnels (20 cm diameter, green colour) were suspended from the lower rod to collect intercepted insects. Funnel exits were connected to 0.25 litre sampling bottles containing the preservative solution (0.5% formalin plus some droplets of washing liquid to lower the surface tension). We installed two traps per tree, one at 70 cm and one at 200 cm above the ground (measured from the upper rod). The traps were generally east-west oriented.
Sampling design
The sampling effort was limited mainly by the availability of snags in plantations and degraded forest. Overall, we examined five snags in natural forest and four snags each in degraded forest, fuelwood and teak plantations. Snags were dead trees with a diameter at breast height (DBH) of ≥ 15 cm and a trunk height of at least 5 m. All snags had branches but no green leaves.
To distinguish the activity of saproxylic beetles from the one of non-saproxylic passengers, we also sampled one live control tree in the vicinity (20–50 m) of each snag, resulting in five (natural forest) and four (remaining forest types) snag-control pairs. Controls were young trees (5–20 cm DBH) with no signs of decay, hence unsuitable for saproxylic beetles (Kaila et al. 1994). In most cases, conspecific control trees were selected. Only in degraded forest we could not find live counterparts for all snag species. In these cases, different species with similar growth form were chosen (Table 1).
74
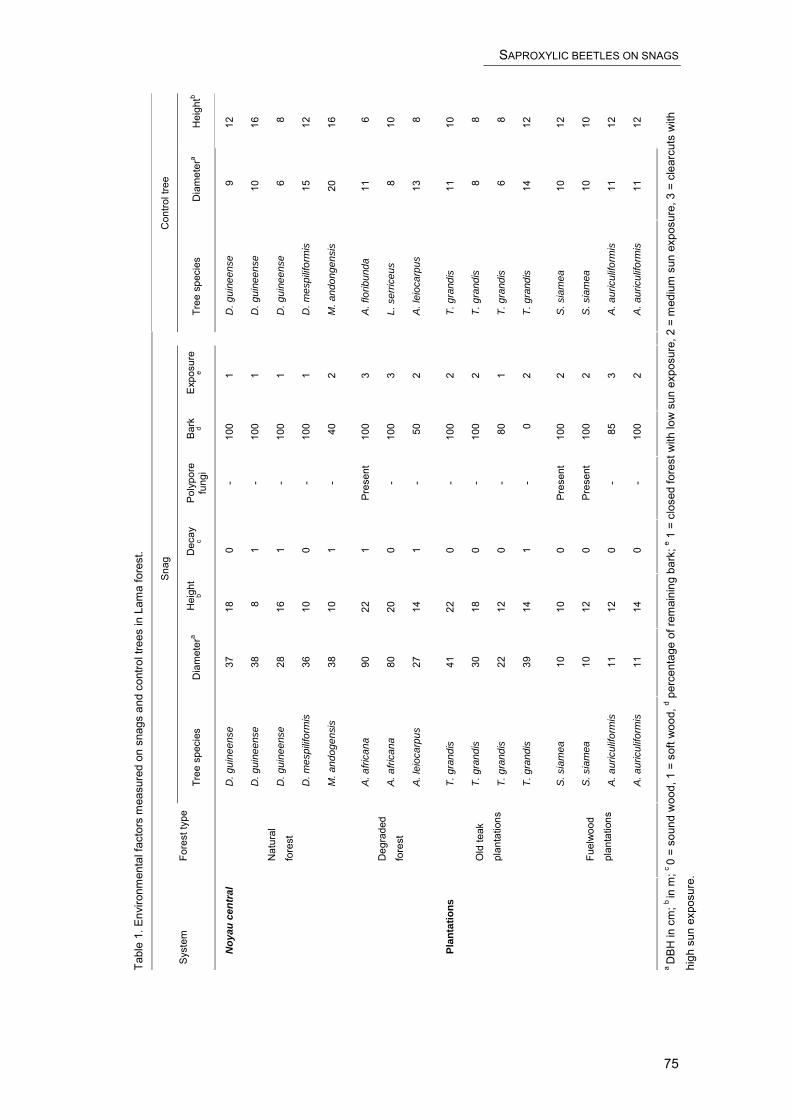
SAPROXYLIC BEETLES ON SNAGS
Tabl
e 1.
Env
ironm
enta
l fac
tors
mea
sure
d on
sna
gs a
nd c
ontro
l tre
es in
Lam
a fo
rest
.
Sna
g C
ontro
l tre
e
Syst
em
Fore
st ty
pe
Tree
spe
cies
D
iam
eter
a H
eigh
tb
Dec
ayc
Poly
pore
fu
ngi
Bar
kd
Exp
osur
ee
Tree
spe
cies
D
iam
eter
a H
eigh
tb
Nat
ural
fore
st
D. g
uine
ense
D. g
uine
ense
D. g
uine
ense
D. m
espi
lifor
mis
M. a
ndog
ensi
s
37
38
28
36
38
18 8 16
10
10
0 1 1 0 1
- - - - -
100
100
100
100 40
1 1 1 1 2
D. g
uine
ense
D. g
uine
ense
D. g
uine
ense
D. m
espi
lifor
mis
M. a
ndon
gens
is
9 10 6 15
20
12
16 8 12
16
Noy
au c
entr
al
Deg
rade
d
fore
st
A. a
frica
na
A. a
frica
na
A. l
eioc
arpu
s
90
80
27
22
20
14
1 0 1
Pres
ent
- -
100
100 50
3 3 2
A. f
lorib
unda
L. s
erric
eus
A. l
eioc
arpu
s
11 8 13
6 10 8
Old
teak
plan
tatio
ns
T. g
rand
is
T. g
rand
is
T. g
rand
is
T. g
rand
is
41
30
22
39
22
18
12
14
0 0 0 1
- - - -
100
100 80
0
2 2 1 2
T. g
rand
is
T. g
rand
is
T. g
rand
is
T. g
rand
is
11 8 6 14
10 8 8 12
Plan
tatio
ns
Fuel
woo
d
plan
tatio
ns
S. s
iam
ea
S. s
iam
ea
A. a
uric
ulifo
rmis
A. a
uric
ulifo
rmis
10
10
11
11
10
12
12
14
0 0 0 0
Pres
ent
Pres
ent
- -
100
100 85
100
2 2 3 2
S. s
iam
ea
S. s
iam
ea
A. a
uric
ulifo
rmis
A. a
uric
ulifo
rmis
10
10
11
11
12
10
12
12
a D
BH
in c
m; b
in m
; c 0
= so
und
woo
d, 1
= s
oft w
ood,
d per
cent
age
of re
mai
ning
bar
k; e 1
= c
lose
d fo
rest
with
low
sun
exp
osur
e, 2
= m
ediu
m s
un e
xpos
ure,
3 =
cle
arcu
ts w
ith
high
sun
exp
osur
e.
75
CHAPTER 4
There is an elevated risk that snags collapse during studies extending over longer periods of time. Previous studies managed this problem by selecting nearby replacement snags similar in species, decay and size (Hammond 1997). In our study, two snags collapsed, one in degraded forest and one in fuelwood plantations. A suitable replacement snag was found in fuelwood plantations but not in degraded forest. The latter was therefore considered as missing.
Beetles were sampled from June 2002 to June 2003 for a total period of 12 weeks. Individual sampling periods lasted one or two weeks. During this time, the traps were emptied weekly.
Identification
Suspected saproxylic beetles were first identified and enumerated at the morphospecies level (Oliver and Beattie 1996). Beetles were regarded as saproxylic if so suggested by their habitat association found during this and other studies in the Lama forest reserve, or if their ecology could be inferred from the literature. Taxa whose saproxylic status was dubious or clearly wrong were discounted. Examples are the families Chrysomelidae, Curculionidae and Staphylinidae. To reduce sampling and computation bias due to passengers, the main analyses focused on the so-called true snag beetles (see analysis).
Environmental factors
A range of environmental variables were recorded, representing different scales and describing different (micro-) habitat attributes. These variables included tree species, trunk diameter (DBH), height, decay stage (sound and soft wood), sun exposure (closed forest with low or medium sun exposure, clear-cuts with high sun exposure; after Sverdrup-Thygeson and Ims 2002), the presence of polypore fungi growing in the wood and the percentage of bark remaining.
Data analysis
Beetle assemblages were examined using three summary variables, species richness, relative abundance and the number of singletons (species occurring with one individual only). All data of the summary variables were log10(n+1)-transformed prior to statistical analyses.
We first tested differences in beetle assemblages among traps positioned at 70 cm and 200 cm above the ground, using paired-sample t-tests (SPSS 12.0). Similar tests were employed to compare beetle assemblages on snags and paired control trees. In these and all remaining analyses, sequential Bonferroni adjustments were made to correct the error rate for multiple testing if significant effects were found (Manly 2001).
76
SAPROXYLIC BEETLES ON SNAGS
Beta-diversity (the degree of change in species composition between habitats) was calculated according to Whittaker’s formula βw = γ /⎯α, where γ is the total species number recorded (γ-diversity or the local species pool) and⎯α is the average number of species per site (Whittaker 1960). βw was then related to the maximum βw_max to allow comparisons of samples with different size (Magurran 2003).
Trunk window traps intercept insects flying close to the trunk. This may reflect a specific relationship of these insects with the dead wood substrate (e.g., saproxylic beetles hatching from or attracted to snags). However, other insects intercepted may respond to clues that are not specific to dead wood, or travel in a quasi random fashion (Jonsell and Weslien 2003; Kaila et al.1994). These arbitrary passengers or transient visitors may introduce a bias in the analysis of dead wood beetle assemblages and reduce the variation among individual snags (Hammond 1997). To reduce this bias, we included only those species that were only found on snags, or – in case of common occurrence on snags and control – species whose relative abundance was at least four times higher on snags than on paired control trees. These beetles were considered as truly saproxylic (true snag beetles). Unless otherwise stated, all remaining analyses were done using this subset of data.
Differences in species richness, relative abundance and the number of singletons of true snag beetles among forest systems (Noyau central versus plantations) and forest types (natural versus degraded forest versus teak versus fuelwood plantations) were tested using factorial analysis of variance (ANOVA). Because the different tree species were not present in all forest types, and the latter not in all forest systems, we considered tree species as a factor nested in forest type, and the latter as a factor nested in forest system, with tree species being a random factor.
Differences in species richness, relative abundance and the number of singletons of beetle assemblages on snags with different environmental attributes were analysed with one-way ANOVA. For these analyses, quantitative variables were transformed into factor variables comprising four levels each (height: ≤ 10 m, > 10 to ≤ 15 m, > 15 to ≤ 20 m and >20 m; diameter: ≤ 20 cm, >20 to ≤ 30 cm, >30 to ≤ 40 cm and >40 cm; bark cover: 0%, >0% to ≤ 50%, >50% to < 100% and 100%).
True snag beetle species accumulation curves were generated for both forest systems (Noyau central and plantations) after 100 randomisations, using the programme EstimateS (Colwell 1997).
We performed detrended correspondence analysis (DCA; McCune and Grace 2002; Hill and Gauch 1980) to ordinate snags according to their saproxylic beetle composition and abundance. The analysis was run with the programme PC-Ord 4.28, using default parameter settings (McCune and Mefford 1999). Canonical correspondence analysis was conducted using the same programme to examine the relationship between selected environmental data and true snag beetle assemblages (CCA; Ter Braak 1986, 1994). For this analysis, categorical variables were transformed into binary dummy
77

CHAPTER 4
variables. Because inclusion of correlated groups of variables may yield unreliable results (Ter Braak 1986), variables were first tested for correlations using Pearson’s correlation coefficient (SPSS 12.0). Four uncorrelated, biologically relevant variables were retained. Axis scores were standardised according to the method of Hill (1979) and scaled to optimise the representation of sampling units (snags). Snag scores were considered as linear combinations of environmental variables. The correlation between the species matrix and the environmental variables matrix was tested at 100 Monte Carlo randomisations. Following a recommendation of McCune (personal communication), we only report P-values for axis one because simple randomisation tests for subsequent axes may be constrained by the interdependence with previous axes.
To test the hypothesis of no difference between two or more groups of snags (e.g., exotic versus native trees), and to measure the average distance within groups (used as heterogeneity measure; Grove 2002a), we applied multi-response permutation procedures (MRPP, PC-Ord 4.28).
Beetle species showing preferences for particular tree species or forest systems were determined according to the indicator species method of Dufrêne and Legendre (1997), using PC-Ord 4.28. For this analysis, dead and live trees of the same species were considered as separate habitats, and the whole dataset was included.
Results
Overall, we collected 2,275 beetle specimens, representing 348 species in 38 families (Table 2). Singletons made up 41% of the total beetle catch. Sixty-seven and 163 species, respectively, were sampled only on control trees and snags, and 118 species on both live and dead trees.
We found no significant difference in species richness, relative abundance and the number of singletons between traps mounted at 70 cm and 200 cm above the ground (Table 3). Likewise, MRPP using rank-transformed Euclidean distance found no significant differences among traps (P = 0.19). For further analyses, catches of both traps were therefore pooled, yielding a single datum (total catch) per tree.
78
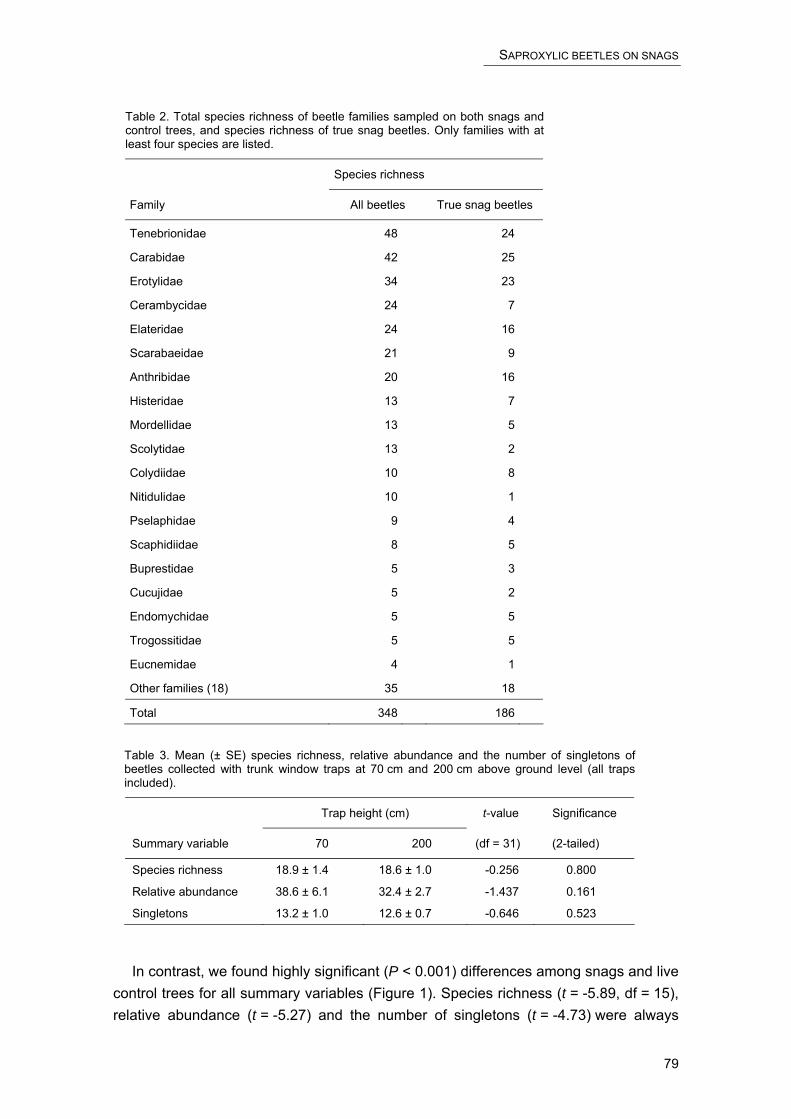
SAPROXYLIC BEETLES ON SNAGS
Table 2. Total species richness of beetle families sampled on both snags and control trees, and species richness of true snag beetles. Only families with at least four species are listed.
Species richness
Family All beetles True snag beetles
Tenebrionidae 48 24
Carabidae 42 25
Erotylidae 34 23
Cerambycidae 24 7
Elateridae 24 16
Scarabaeidae 21 9
Anthribidae 20 16
Histeridae 13 7
Mordellidae 13 5
Scolytidae 13 2
Colydiidae 10 8
Nitidulidae 10 1
Pselaphidae 9 4
Scaphidiidae 8 5
Buprestidae 5 3
Cucujidae 5 2
Endomychidae 5 5
Trogossitidae 5 5
Eucnemidae 4 1
Other families (18) 35 18
Total 348 186
Table 3. Mean (± SE) species richness, relative abundance and the number of singletons of beetles collected with trunk window traps at 70 cm and 200 cm above ground level (all traps included).
Trap height (cm) t-value Significance
Summary variable 70 200 (df = 31) (2-tailed)
Species richness 18.9 ± 1.4 18.6 ± 1.0 -0.256 0.800
Relative abundance 38.6 ± 6.1 32.4 ± 2.7 -1.437 0.161
Singletons 13.2 ± 1.0 12.6 ± 0.7 -0.646 0.523
In contrast, we found highly significant (P < 0.001) differences among snags and live control trees for all summary variables (Figure 1). Species richness (t = -5.89, df = 15), relative abundance (t = -5.27) and the number of singletons (t = -4.73) were always
79
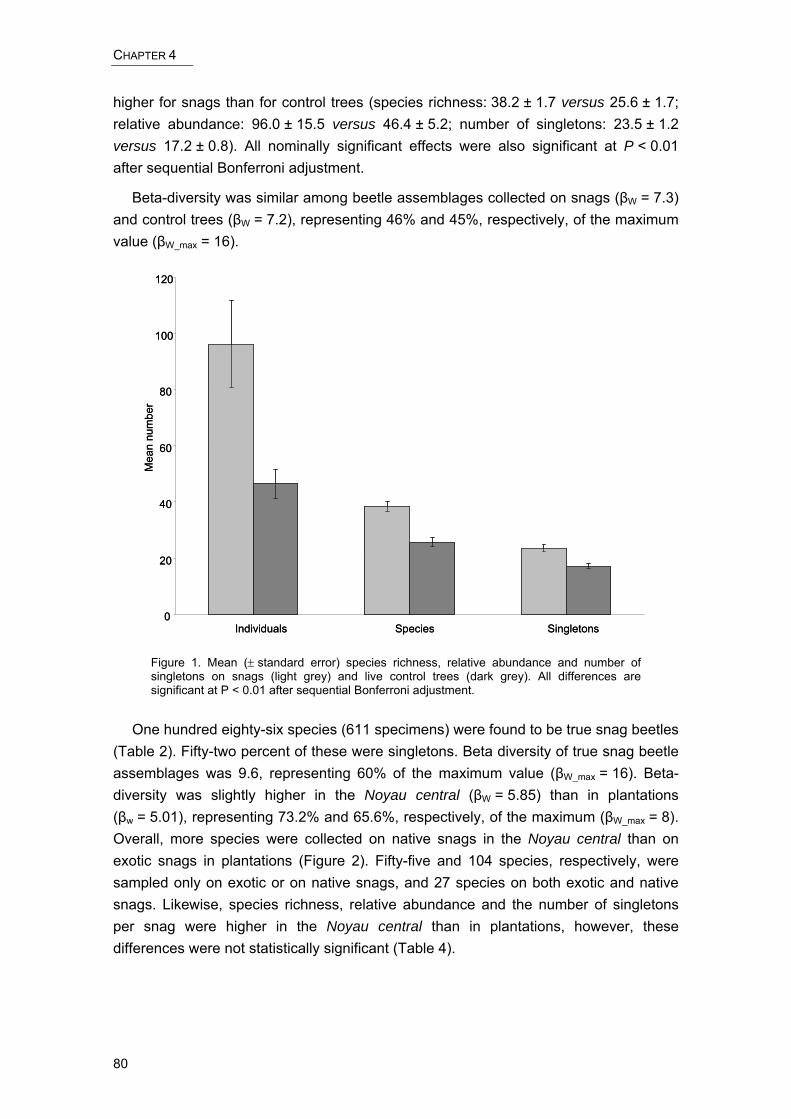
CHAPTER 4
higher for snags than for control trees (species richness: 38.2 ± 1.7 versus 25.6 ± 1.7; relative abundance: 96.0 ± 15.5 versus 46.4 ± 5.2; number of singletons: 23.5 ± 1.2 versus 17.2 ± 0.8). All nominally significant effects were also significant at P < 0.01 after sequential Bonferroni adjustment.
Beta-diversity was similar among beetle assemblages collected on snags (βW = 7.3) and control trees (βW = 7.2), representing 46% and 45%, respectively, of the maximum value (βW_max = 16).
0
20
40
60
80
100
120
Individuals Species Singletons
Mea
nnu
mbe
r
0
20
40
60
80
100
120
Individuals Species Singletons
Mea
nnu
mbe
r
Figure 1. Mean (± standard error) species richness, relative abundance and number of singletons on snags (light grey) and live control trees (dark grey). All differences are significant at P < 0.01 after sequential Bonferroni adjustment.
One hundred eighty-six species (611 specimens) were found to be true snag beetles (Table 2). Fifty-two percent of these were singletons. Beta diversity of true snag beetle assemblages was 9.6, representing 60% of the maximum value (βW_max = 16). Beta-diversity was slightly higher in the Noyau central (βW = 5.85) than in plantations (βw = 5.01), representing 73.2% and 65.6%, respectively, of the maximum (βW_max = 8). Overall, more species were collected on native snags in the Noyau central than on exotic snags in plantations (Figure 2). Fifty-five and 104 species, respectively, were sampled only on exotic or on native snags, and 27 species on both exotic and native snags. Likewise, species richness, relative abundance and the number of singletons per snag were higher in the Noyau central than in plantations, however, these differences were not statistically significant (Table 4).
80
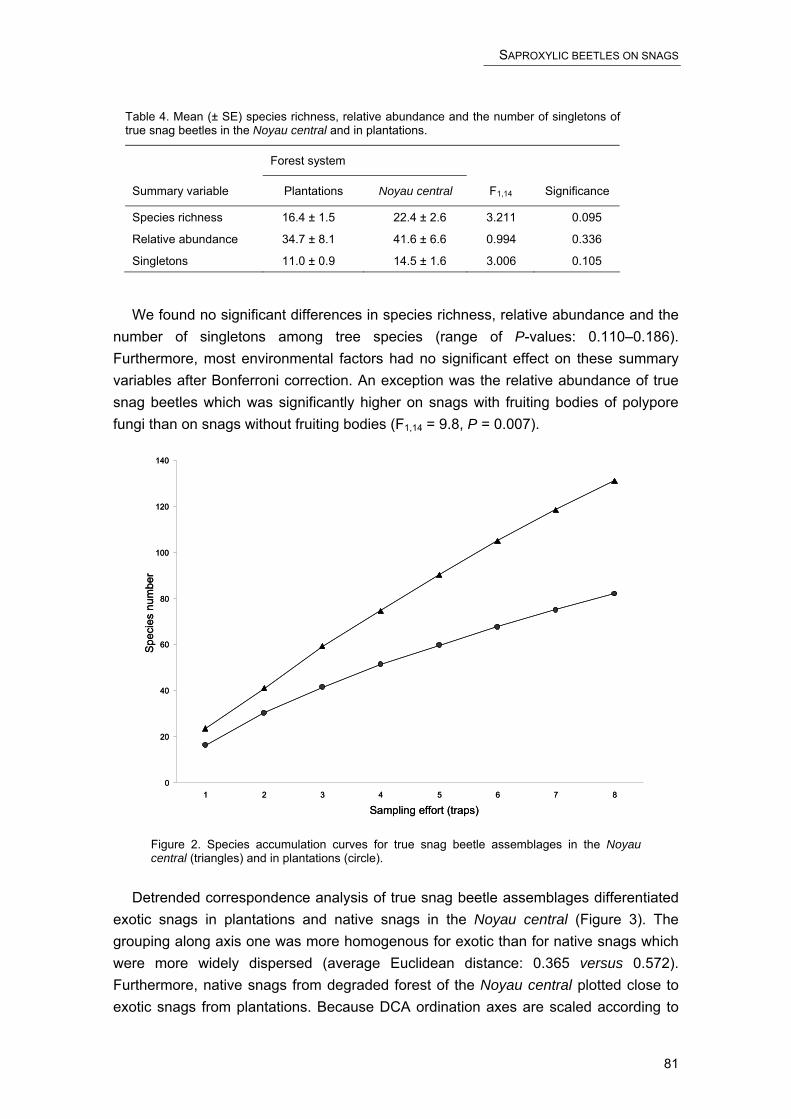
SAPROXYLIC BEETLES ON SNAGS
Table 4. Mean (± SE) species richness, relative abundance and the number of singletons of true snag beetles in the Noyau central and in plantations.
Forest system
Summary variable Plantations Noyau central F1,14 Significance
Species richness 16.4 ± 1.5 22.4 ± 2.6 3.211 0.095
Relative abundance 34.7 ± 8.1 41.6 ± 6.6 0.994 0.336
Singletons 11.0 ± 0.9 14.5 ± 1.6 3.006 0.105
We found no significant differences in species richness, relative abundance and the number of singletons among tree species (range of P-values: 0.110–0.186). Furthermore, most environmental factors had no significant effect on these summary variables after Bonferroni correction. An exception was the relative abundance of true snag beetles which was significantly higher on snags with fruiting bodies of polypore fungi than on snags without fruiting bodies (F1,14 = 9.8, P = 0.007).
0
20
40
60
80
100
120
140
1 2 3 4 5 6 7 8
Sampling effort (traps)
Spec
ies
num
ber
0
20
40
60
80
100
120
140
1 2 3 4 5 6 7 8
Sampling effort (traps)
Spec
ies
num
ber
Figure 2. Species accumulation curves for true snag beetle assemblages in the Noyau central (triangles) and in plantations (circle).
Detrended correspondence analysis of true snag beetle assemblages differentiated exotic snags in plantations and native snags in the Noyau central (Figure 3). The grouping along axis one was more homogenous for exotic than for native snags which were more widely dispersed (average Euclidean distance: 0.365 versus 0.572). Furthermore, native snags from degraded forest of the Noyau central plotted close to exotic snags from plantations. Because DCA ordination axes are scaled according to
81

CHAPTER 4
the average standard deviation of species turnover, the first axis can be interpreted directly to assess the heterogeneity of snag assemblages (Bestelmeyer and Wiens 1996; McCune and Grace 2002). Standard deviations of one and four, respectively, correspond to approximately 50% and 100% species turnover. With an ordination length of six standard deviations, the species turnover observed in our study was one and a half times higher than the full turnover, indicating a very strong heterogeneity (high β-diversity) of snag beetle assemblages among snags.
TP1
TP2
TP3
TP4
FP1
FP2
FP3
FP4DF1
DF2
DF3
NF1
NF2
NF3
NF4
NF5
00
2 4
2
4
Axis 1 [0.255]
Axi
s2
[0.0
91]
6
TP1
TP2
TP3
TP4
FP1
FP2
FP3
FP4DF1
DF2
DF3
NF1
NF2
NF3
NF4
NF5
00
2 4
2
4
Axis 1 [0.255]
Axi
s2
[0.0
91]
6
Figure 3. Detrended correspondence analysis of snag beetle assemblages in the Noyau central (triangle) and in plantations (circle). NF1–5 (filled triangle): natural forest; DF1–3 (open triangle): degraded forest; TP1–4 (filled circle): teak plantations; TP1–4 (open circle): fuelwood plantations.
The first three axes of the CCA-ordination explained only 23% of the total variance in the true snag beetle data (Table 5). Of the four environmental variables, forest system accounted for the highest percentage of the total variance explained. This value, even though relatively low, was significant at P < 0.05.
The number of beetle species with significant preferences for particular tree types or species differed. When comparing control trees and snags, we found only snag species specialists (two Scolytidae species, and one species each of Cerylonidae and Scydmaeidae). On the tree species level (based on an analysis of five species), we found seven snag specialists (one species in each of the families Anthribidae, Ceratocanthidae, Colydiidae, Scaphidiidae, Scarabaeidae, Scolytidae and Scydmaenidae) and one live tree specialist (Scarabaeidae).
82

SAPROXYLIC BEETLES ON SNAGS
Table 5. Summary statistics for the first three CCA axes. The analysis was performed using a primary matrix of snag beetle assemblages and a secondary matrix of four environment variables and their canonical coefficients.
Canonical axis 1* 2a 3a
Eigenvalue 0.718 0.641 0.535
Percentage of variance explained 8.7 7.8 6.5
Cumulative percentage of variance explained 8.7 16.5 23.0
Pearson correlation (species–environment variables) 0.993 0.983 0.967
Environmental variables (Canonical coefficients)
Forest system 1.405 0.078 0.174
Sun exposure -0.297 1.235 0.310
Percentage of bark remaining -0.573 -0.191 1.029
Diameter 0.105 0.121 0.412
* significant at P = 0.05; a significance not computed (see explanations in data analysis)
Discussion
Abundant life in dead wood
The high diversity and abundance of saproxylic beetle assemblages on individual snags – irrespective of forest system – provides impressive evidence of the importance of this type of dead wood for invertebrate diversity in Lama forest.
Even though species richness, relative abundance and the number of singletons were slightly higher on snags from the Noyau central than on those from plantations (see Table 3), no significant differences were found. This surprising result shows that the widely scattered snags in plantation forests are a rare yet readily colonised resource for saproxylic beetles. This may be related to the greatly enhanced attractiveness of isolated, rare snags in forests that provide few alternative dead wood habitats (Schroeder et al. 1999). Nevertheless, as expected, overall species richness was much higher in the Noyau central than in plantation forests (see Figure 2), and about twice as many species were encountered exclusively there than in plantations, indicating a high species turnover among snags from natural and degraded forest.
Snags are not all the same
Window traps mounted on control trees were supposed to intercept insects flying in a random fashion, and those mounted on snags to intercept these random passengers plus insects that are specifically attracted to dead wood or fungi growing on dead wood. Therefore, we expected the snag fauna to be more homogenous. However, beta-diversity was similar among snags and control trees, indicating that snag beetle assemblages were as heterogeneous as passenger assemblages. This was also
83

CHAPTER 4
reflected in the large scale of DCA axis one which spanned six standard deviations, and in the low percentage of variance explained by the environmental variables. The heterogeneity of snag beetle assemblages mirrors a strong heterogeneity of dead wood habitats but may also be related to different spatio-temporal colonisation patterns. Kaila (1993) proposed that the colonisation of dead wood substrate strongly depends on the presence of similar substrates in the surroundings. In the plantations of Lama forest, the overall biomass of snags and other types of dead wood is low, and densities are less than one snag per hectare, compared to up to 15 snags in natural forest (see Chapter 3). This suggests that saproxylic beetle diversity might be greatly enhanced by management practices promoting snag and other dead wood resources.
Effects of environmental factors
Of the six snag habitat attributes (environmental factors) examined with ANOVA, only the presence of fruiting bodies of polypore fungi (sexual stage of the fungal life-cycle) had a significant effect, and this only with respect to the relative abundance of saproxylic beetles. Fruiting bodies of polypore fungi, in particular those that decay, are a substrate that hosts a very diverse beetle fauna (Kaila et al. 1994; Jonsell et al. 2003). In our study, fruiting bodies were found only on three snags, giving the impression that saproxylic beetles specialised on fungal substrate must be rare. However, many wood-decaying fungi are cryptic, and their actual density and diversity – hence the quantity and quality of fungal substrate available to saproxylic beetles – cannot be inferred from the abundance of fruiting bodies (Jonsell et al. 2003).
Fruiting bodies were not included as a factor in the CCA because their occurrence was significantly correlated with sun exposure. Of the four variables included in the CCA, forest system was the most important determinant of saproxylic beetle assemblages, followed by sun exposure and bark cover.
The dependence of the snag beetle fauna on the forest system is a straightforward result. Both natural and degraded forest of the Noyau central are composed of native tree species only and are no longer subjected to anthropogenic disturbances (Specht 2002). In contrast, plantations are composed mainly of exotic tree species and are exposed to high levels of disturbance such as thinning, logging, clearing and firewood collecting. However, our interpretation is strongly constrained by the nesting of snag species (representing dead wood quality) in forest system (representing an environmental matrix). As a consequence, differences in beetle assemblages may be related to only one or both of these factors. To distinguish these factors, it would be necessary to compare the fauna of exotic snags in natural forest and/or native snags in plantations. First evidence from translocation experiments with freshly cut wood showed that preferences of saproxylic beetles may differ depending on whether the resource is provided in natural forest or plantations (see Chapter 2). Further studies are clearly necessary to address this issue. An equally important aspect is the effect of snag and other dead wood biomass on snag beetle assemblages.
84

SAPROXYLIC BEETLES ON SNAGS
Sun exposure was the second most important habitat attribute affecting the snag beetle fauna in Lama forest. This confirms observations from boreal forests. These studies found that the species richness of dead wood specialists, including rare and threatened beetles, was correlated with sun exposure (Kaila et al. 1997; Sverdrup-Thygeson and Ims 2002). Even though no significant effect of sun exposure on species richness was found in our study, snags with the highest beetle species richness were situated in clearcuts, i.e. on sites with high sun exposure.
Snags in open areas are likely to be visited more frequently, because the flight activity of insects is greater in open sunshine than in shade (Jonsell et al. 2004). High flight activity in clearcuts, high attractivity of isolated snag and location in ecotone (between natural forest and plantations) may explain the ordination of snags of clearcuts around exotic snags of plantations.
The percentage of bark remaining also affected saproxylic beetle assemblages. Snags with a larger proportion of bark remaining provide a greater diversity and quality of microhabitats than nude snags. Moreover, bark substrate is rich in nutrients and protects dead wood-inhabiting invertebrates from predation and desiccation (Sverdrup-Thygeson and Ims 2002).
Snags support specialists
Despite an unfavourably high percentage of singletons, our indicator analysis identified several snag tree specialists. It has been suggested that the heterogeneity of dead wood habitats promotes a high degree of specialization among the saproxylic beetle fauna (Kaila et al. 1997), which in turn allows the co-occurrence of a diversity of species on a single dead tree. In the Noyau central, resource availability and diversity (tree species, stages of decay, exposure, etc.) may have been sufficiently high to reduce competitive exclusion. In contrast, the scarcity of dead wood resources in plantations makes competitive exclusion more likely, resulting in a more depauperate saproxylic beetle fauna (Hugueny and Cornell 2000; Grove 2002a).
Unfortunately, highly specialized species are particularly sensitive to environmental changes and disturbances, and may be threatened if their habitat is destroyed or highly fragmented (Lawton 1995).
Conclusions
The present study showed that dead native trees in natural and degraded forest and dead exotic trees in plantations harbour very different beetle assemblages. Thus, all snags, wherever they stand, contribute to the overall conservation of saproxylic beetles. Nevertheless, species richness and beta-diversity were clearly lower in plantation forests, which was probably related to the scarcity of dead wood substrate. This offers the opportunity to enhance the diversity of the saproxylic fauna in
85
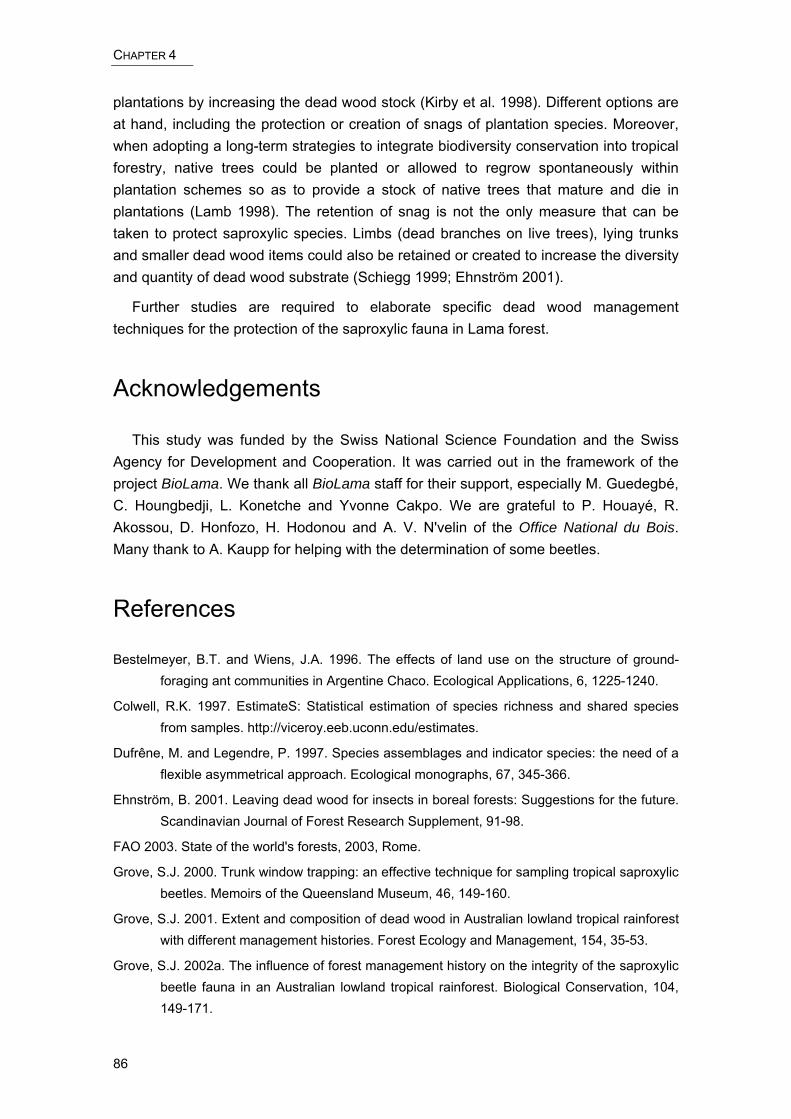
CHAPTER 4
plantations by increasing the dead wood stock (Kirby et al. 1998). Different options are at hand, including the protection or creation of snags of plantation species. Moreover, when adopting a long-term strategies to integrate biodiversity conservation into tropical forestry, native trees could be planted or allowed to regrow spontaneously within plantation schemes so as to provide a stock of native trees that mature and die in plantations (Lamb 1998). The retention of snag is not the only measure that can be taken to protect saproxylic species. Limbs (dead branches on live trees), lying trunks and smaller dead wood items could also be retained or created to increase the diversity and quantity of dead wood substrate (Schiegg 1999; Ehnström 2001).
Further studies are required to elaborate specific dead wood management techniques for the protection of the saproxylic fauna in Lama forest.
Acknowledgements
This study was funded by the Swiss National Science Foundation and the Swiss Agency for Development and Cooperation. It was carried out in the framework of the project BioLama. We thank all BioLama staff for their support, especially M. Guedegbé, C. Houngbedji, L. Konetche and Yvonne Cakpo. We are grateful to P. Houayé, R. Akossou, D. Honfozo, H. Hodonou and A. V. N'velin of the Office National du Bois. Many thank to A. Kaupp for helping with the determination of some beetles.
References
Bestelmeyer, B.T. and Wiens, J.A. 1996. The effects of land use on the structure of ground-foraging ant communities in Argentine Chaco. Ecological Applications, 6, 1225-1240.
Colwell, R.K. 1997. EstimateS: Statistical estimation of species richness and shared species from samples. http://viceroy.eeb.uconn.edu/estimates.
Dufrêne, M. and Legendre, P. 1997. Species assemblages and indicator species: the need of a flexible asymmetrical approach. Ecological monographs, 67, 345-366.
Ehnström, B. 2001. Leaving dead wood for insects in boreal forests: Suggestions for the future. Scandinavian Journal of Forest Research Supplement, 91-98.
FAO 2003. State of the world's forests, 2003, Rome.
Grove, S.J. 2000. Trunk window trapping: an effective technique for sampling tropical saproxylic beetles. Memoirs of the Queensland Museum, 46, 149-160.
Grove, S.J. 2001. Extent and composition of dead wood in Australian lowland tropical rainforest with different management histories. Forest Ecology and Management, 154, 35-53.
Grove, S.J. 2002a. The influence of forest management history on the integrity of the saproxylic beetle fauna in an Australian lowland tropical rainforest. Biological Conservation, 104, 149-171.
86
SAPROXYLIC BEETLES ON SNAGS
Grove, S.J. 2002b. Saproxylic insect ecology and the sustainable management of forests. Annu. Rev. Ecol. Syst, 33, 1-23.
Grove, S.J. 2002c. Tree basal area and dead wood as surrogate indicators of saproxylic insect faunal integrity: a case study from the Australian lowland tropics. Ecological Indicators, 1, 171-188.
Grove, S.J. and Stork, N.E. 1999. The conservation of saproxylic insects in tropical forests: a research agenda. Journal of Insect Conservation, 3, 67-74.
Hammond, H.E.J. 1997. Arthropod biodiversity from Populus coarse woody material in North-central Alberta: a review of taxa and collection methods. The canadian entomologist, 129, 1009-1033.
Hammond, P.M., Kitching, R.L. and Stork, N.E. 1996. The composition and richness of the tree-crown Coleoptera assemblage in an Australian subtropical forest. Ecotropica, 2, 99-108.
Hill, M.O. 1979. Decorana: a Fortran program for detrended correspondence analysis and reciprocal averaging Ecology and Systematics, Cornell University, Ithaca, New York.
Hill, M.O. and Gauch, H.G.J. 1980. Detrended correspondance analysis: an improved ordination technique. Vegetatio, 42, 47-58.
Hugueny, B. and Cornell, H.V. 2000. Predicting the relationship between local and regional species richness from a patch occupancy dynamics model. Journal of Animal Ecology, 69, 194-200.
Hunter, M.L. 1990. Old forests. In Wildlife, forests and forestry: Principles of managing forests for biological diversity. (ed M.L. Hunter), pp. 59-70. Prentice Hall, Englewood Cliffs, New Jersey.
Jonsell, M. and Weslien, J. 2003. Felled or standing retained wood--it makes a difference for saproxylic beetles. Forest Ecology and Management, 175, 425-435.
Jonsell, M., Nittérus, K. and Stighäll, K. 2004. Saproxylic beetles in natural and man-made deciduous high stumps retained for conservation. Biological Conservation, 118, 163-173.
Kaila, L. 1993. A new method for collecting qunatitative samples of insects associated with decaying wood or wood fungi. Entomologica Fennica, 4, 21-24.
Kaila, L., Martikainen, P., Punttila, P. and Yakovlev, E. 1994. Saproxylic beetles (Coleoptera) on dead birch trunks decayed by different polypore species. Annales zoologici fennici, 31, 97-107.
Kaila, L., Martikainen, P. and Punttila, P. 1997. Dead trees left in clear-cuts benefit saproxylic Coleoptera adapted to natural disturbances in boreal forest. Biodiversity and Conservation, 6, 1-18.
Kirby, K.J., Reid, C.M., Thomas, R.C. and Goldsmith, F.B. 1998. Preliminary estimates of fallen dead wood and standing dead trees in managed and unmanaged forests in Britain. Journal of Applied Ecology, 35, 148-155.
Köhler, F. 2000. Totholzkäfer in Naturwaldzellen des nördlichen Rheinlandes, Landesamt für Agrarordnung Nordrhein-Westfalen edn. LÖBF- Schriftenreihe, Recklinghausen.
87
CHAPTER 4
Kolström, M. and Lumatjärvi, J. 2000. Saproxylic beetles on aspen in commercial forests: A simulation approach to species richness. Forest Ecology and Management, 126, 113-120.
Lachat, T., Attignon, S., Djego, J., Goergen, G., Nagel, P., Sinsin, B. and Peveling, R. Arthropod diversity in Lama forest reserve (South Benin), a mosaic of natural, degraded and plantation forests. Biodiversity and Conservation, in press.
Lamb, D. 1998. Large-scale ecological restoration of degraded tropical forest lands: The potential role of timber plantations. Restoration Ecology, 6, 271-279.
Lawton, J.J. 1995. Population dynamic principles. In: Lawton, J.J. and May-Robert-M, E. (eds) 1995. Extinction rates. Oxford University Press, Oxford.
Magurran, A.E. 2003. Measuring biological diversity. Blackwell Pubishing, Oxford.
Manly, B.F.J. 2001. Statistics for environmental science and management. Chapman and Hall/CRC, Boca Raton.
Martikainen, P., Siitonen, J., Punttila, P., Kaila, L. and Rauh, J. 2000. Species richness of Coleoptera in mature managed and old-growth boreal forests in southern Finland. Biological Conservation, 94, 199-209.
Martikainen, P. and Kaila, L. Sampling saproxylic beetles: lessons from a 10-year monitoring study. Biological Conservation, in press.
McCune, B. and Mefford, M.J. 1999. PC-ORD: Multivariate Analysis of Ecological Data. MjM Software Design, Gleneden Beach, Oregon.
McCune, B. and Grace, J.B. 2002. Analysis of Ecological Communities mjm Software, Gleneden Beach, Oregon.
Oliver, I., Beattie, A.J. and York, A. 1998. Spatial fidelity of plant, vertebrate and invertebrate assemblages in multiple-use forest in Eastern Australia. Conservation Biology, 12, 822-835.
Palm, T. 1959. Die Holz- und Rinden-Käfer der süd- und mittelschwedischen Laubbäume. Opusculum Entomologica Suppl, 16, 1-371.
Sayer, J.A., Harcourt, C.S. and Collins, N.M. 1992. The conservation atlas of tropical forests. Africa IUCN, New York.
Schiegg, K. 1999. Limiting factors of saproxylic insects: habitat relationships of an endangered ecological group. Dissertation, Swiss Federal Institute of Technology, Zurich.
Schiegg, K. 2000. Are saprolxylic beetle species characteristic of high dead wood connectivity. Ecography, 23, 579-587.
Schroeder, L.M., Weslien, J., Lindelow, A. and Lindhe, A. 1999. Attacks by bark- and wood-boring Coleoptera on mechanically created high stumps of Norway spruce in the two years following cutting. Forest Ecology and Management, 123, 21-30.
Siitonen, J. 1994. Decaying wood and saproxylic Coleoptera in two old spruce forests: a comparison based on two sampling methods. Annales zoologici fennici, 31, 90-95.
Siitonen, J. 2001. Forest management, coarse woody debris and saproxylic organisms. Fennoscandian boreal forests as an example. Ecological Bulletins, 49, 11-49.
88
SAPROXYLIC BEETLES ON SNAGS
Specht, I. 2002. La foret de la Lama, Bénin SIG basé sur Landsat 7 Opuscula Biogeographica Basileensia II, Bâle, Suisse.
Speight, M.C.D. 1989. Saproxylic invertebrates and their conservation. Concil of Europe, Strasbourg.
Speight, M.R. and Wylie, F.R. 2001. Insect Pests in Tropical Forestry CABI Publishing, Oxford, Brisbane.
Sverdrup-Thygeson, A. and Ims, R.A. 2002. The effect of forest clearcutting in Norway on the community of saproxylic beetles on aspen. Biological Conservation, 106, 347-357.
Ter Braak, C.J.F. 1986. Canonical Correspondance Analysis: a new eigenvector technique for multivariate direct gradient analysis. Ecology, 67, 1167-1179.
Ter Braak, C.J.F. 1994. Canonical community ordination: Part I: Basic theory and linear methods. Ecoscience, 1, 127-140.
White, F. 1983. The vegetation of Africa Unesco, Paris.
Whittaker, R.H. 1960. Vegetation of the Siskiyou Mountains, Oregon and California. Ecological Monographs, 30, 279-338.
89


SUMMARY AND CONCLUSIONS
Tropical forest ecosystems worldwide are suffering from anthropogenic pressures leading to deforestation and forest degradation, and resulting in a loss of biodiversity. Because tropical forests sustain over half of the planet’s life forms, their destruction might evoke an ecological crisis of global dimension. However, in spite of an increasing awareness of the general public and political authorities, tropical forests continue to deteriorate unabatedly, and numerous species are getting extinct every day. At the same time, large-scale reforestation and afforestation programmes in the tropics have been launched to produce timber and fuelwood. Moreover, it has been proposed that plantation forests have an important role to play in maintaining or enhancing regional biodiversity pools and in alleviating anthropogenic pressures on the natural forests remaining. Consequently, studies about the role of forest plantations for biodiversity conservation are emerging worldwide. However, there is a dearth of information from Africa, and basically none about the arthropod fauna in African forest plantations. The present study steps into this gap and aims to generate baseline data about the diversity of arthropods in natural and plantation forests in tropical West Africa. In doing so, it wishes to encourage and inspire the development and implementation of conservation-oriented forest management strategies.
We studied arthropod assemblages in the Lama forest reserve in Southern Benin, an area harbouring one of the last remnants of natural forest in the Dahomey gap. We compared arthropods from different types of forest, including natural, degraded and plantation forest. The fully protected core of the reserve, the so-called Noyau central, is composed of a small-scale mosaic of natural and degraded semi-deciduous Guineo-Congolian forest. It is surrounded by teak (Tectona grandis) and fuelwood (predominantly Senna siamea) plantations. The particular geographical configuration of the reserve provided an ideal set-up to study the impact of different forestry management systems on arthropod diversity and the role of plantations for biodiversity conservation.
In the first chapter, we give an overview of arthropod diversity in the Lama forest reserve, focusing on species related to biomass decomposition, and highlight its importance for biodiversity conservation. No differences in arthropod species richness were found among different forests types within the Noyau central. However, great differences were observed between forest plantations. Of the environmental variables influencing arthropod assemblages, soil type was the most important natural factor, and species richness was highest in soils with coarse texture (old plantations and isolated forest fragments). The remaining variables naturalness, understorey cover and canopy height are related to silvicultural practices and are therefore amenable to an improved, conservation-oriented forest management. High values for β-diversity suggest that all major forest habitats contribute significantly to regional species pools und should therefore be protected.
91
SUMMARY AND CONCLUSIONS
Chapters two to four deal with beetles dependent on dead wood (saproxylics). Saproxylic beetles are an exceptionally species-rich ecological group. Moreover, they are known to be highly sensitive to forest management and are therefore particularly endangered. Despite this, invertebrate diversity studies in Africa have largely ignored saproxylic beetles and their dead wood habitat.
In the second chapter, we investigate the attraction of freshly cut wood for pioneer beetles, using a newly designed trap (twin-Malaise trap) baited with native and exotic wood and exposed in both natural and plantation forests. Six species showed primary attraction and two repulsion. Three species were native wood specialists, but none were teak specialists. Among the beetles showing primary attraction, we found no economically important pest species. The twin-Malaise trap proved to be a suitable device to examine the primary attraction of beetles. However, our study also showed that the entire spectrum of wood-associated beetles cannot be sampled with this type of trap.
In the third chapter, the diversity of saproxylic beetles and their interaction with dead wood are examined for the first time in an African tropical forest. Both the quantity and quality of dead wood resources differed greatly among natural forest and plantations. Dead wood of advanced decay stage and larger size was basically absent in plantations. Despite this paucity of dead wood, saproxylic beetle diversity in teak and fuelwood plantations was surprisingly high. Nonetheless, overall species richness of saproxylic beetles was higher in natural forest, and wood beetle assemblages differed clearly between natural forest and plantations. The volumes of recently dead wood, large pieces of dead wood, coarse woody debris and standing dead trees were found to have the most significant influence on the composition of saproxylic beetle assemblages.
The last chapter focuses on standing dead trees (snags). We found similar species richness of saproxylic beetle assemblages from native and exotic snags. However, overall species richness and β-diversity were higher for native snags, reflecting higher habitat heterogeneity in the protected forest. Species assemblage composition, influenced mainly by the forest system, revealed high heterogeneity, especially among snags of native tree species. Our results showed that retaining or even creating snags is crucial to the protection of saproxylic beetle assemblages.
The results presented here provide evidence that the cultivation of exotic trees in the vicinity of natural forest may be an important element in biodiversity conservation. The system practiced in Lama forest, which combines different management intensities from unmanaged natural forest to intensively managed, short-rotation fuelwood plantations, goes well beyond the single-objective forestry approaches practiced in other tropical areas. The functional and spatial diversity of Lama forest is reflected in a high diversity of saproxylic beetles and other arthropods. The forest ecosystem as a whole benefits from the diversity and abundance of these invertebrates and the ecological services they provide (decomposition, nutrient cycling). Last not least, the
92
IMPACT OF TROPICAL FOREST MANAGEMENT ON ARTHROPODS
rich and varied invertebrate fauna promotes species higher up the food chain feeding on them.
Several conservation-oriented management measures can be proposed to foster the role of plantation forests as habitat surrogates for forest species. In the short term, the regeneration and development of species-rich understorey vegetation of the Guineo-Congolean phytogeographical region should be promoted in plantations. Moreover, different types of dead wood should be retained to improve the resource base for saproxylic beetles. When adopting long-term strategies that aim to integrate biodiversity conservation into tropical forestry, native trees should be planted or allowed to regrow spontaneously within plantation schemes so as to provide a stock of trees that mature and die in plantations.
93
ACKNOWLEDGEMENTS
This study was founded by the Swiss National Science Foundation, the Swiss Agency for Development and Cooperation and the “Freiwillige Akademische Gesellschaft, Basel”. It was carried out in the framework of the project BioLama, a research partnership between the Institute of Environmental Sciences (NLU) – Biogeography of the University of Basel, Switzerland and the Faculty of Agronomy (FSA) of the University of Abomey-Calavi, Benin.
I would like to thank especially the initiator and coordinator of the project BioLama PD. Dr. Ralf Peveling for the stimulating discussions, for his support and for giving me the passion for research.
Special thanks go to the supervisor of this thesis Prof. Dr. Peter Nagel (project director, Switzerland) and to Prof. Dr. Brice Sinsin (project director, Benin) for their support.
My gratitude goes to the team of BioLama project in Benin for their wonderful collaboration and for showing me the magic of Benin. Special thanks to Serge Attignon, Julien Djego, Yvonne Cakpo, Camille Houngbédji, Mathurin Guèdègbé and Lamidi Konetchè.
I am very grateful to Dr. Georg Goergen (IITA) for identifying insect specimens and for sharing his great knowledge about African entomology, to Dr. Michel Brancucci (Museum of Natural History, Basel) for welcoming us to the museum and to Prof. Dr. Peter Duelli and Prof Dr. David Senn for inspiring discussions.
I wish to thank the staff of the Office National du Bois (ONAB) in Benin, for the excellent research conditions they offered us in the Lama forest reserve: Dr. Pierre Houayé, Raphael Akossou, Daniel Honfozo, Hodonou Houndonougbo and Victorin N’velin.
Special gratitude to my parents Anne-Marie et Laurent Lachat, to my sister Stéphanie and my brother Fabian, to Tonina, Laure and Clément, to Chantal and Jean-Claude Rennwald for their support during my study and for visiting me during my stay in Benin.
Very special thanks to my love Wendy Altherr, for her never-ending moral and scientific support, for joining me in Benin and for all that she is and does for me.
94

CURRICULUM VITAE
Name Lachat, Thibault
Place and Date of birth Delémont, 12 August 1975
Nationality Swiss
Education
Dates 2001 to 2004
Institution Institute of Environmental Sciences (Natur-, Landschafts-, und Umweltschutz, NLU) – Biogeography, University of Basel, St. Johanns-Vortsadt 10, 4056 Basel, Switzerland
Disciplines Biodiversity conservation Forest entomology Forest protection and management in Benin, West Africa
Degree PhD
Dates 1994 to 1999
Institution Swiss Federal Institute of Technology Zurich (ETHZ), Department of Environmental Sciences
Degree Diploma (master) in Environmental Sciences
Major area of study Ecology, Biology, Pedology, Forestry and Human Society
Diploma: Mega-herbivores occurring in Switzerland over the last 250,000 years. Swiss Federal Institute for Forest, Snow and Landscape Research
Dates 1991 to 1994
Institution Lycée Cantonal de Porrentruy, Switzerland
Degree Maturity, C
Work experience
Date 2000
Employer Swiss Landscape Foundation (SL-FP)
Hirschengraben 11, 3011 Bern, Switzerland
Disciplines Landscape protection and restoration
Dates July 1997 to December 1997
Employer Geobotanical Institute, ETHZ, Zürichbergstr. 38, 8044 Zürich
Disciplines Fire ecology, Burigi game reserve, Tanzania Sustainable agriculture and forestry, Kagera Region, Tanzania
95
Publications in reviewed journals
Lachat, T., Attignon, S., Djego, J., Goergen, G., Nagel, P., Sinsin, B., Peveling, R. Arthropod diversity in Lama forest reserve (South Benin), a mosaic of natural, degraded and plantation forests. Biodiversity and Conservation, in press.
Attignon, S., Weibel, D., Lachat, T., Sinsin, B., Nagel, P., Peveling R. Leaf litter breakdown in natural and plantation forests of the Lama forest reserve in Benin. Applied soil Ecology, in press.
Manuscripts submitted to reviewed journals
Lachat, T., Nagel, P., Kakpo, Y., Attignon, S., Goergen, G.,Sinsin, B., Peveling, R. Dead wood and saproxylic beetle assemblages in a semi-deciduous forest in Southern Benin. Manuscript submitted to Forest Ecology and Management.
Attignon, S., Lachat, T., Sinsin, B., Nagel, P., Peveling R. Termite Assemblages in a West-African semi-deciduous forest and teak plantations. Manuscript submitted to Agriculture, Ecosystems and Environment.
Attignon, S., Lachat, T., Sinsin, B., Peveling R., Nagel, P. Activity of termites and other epigeal and hypogeal invertebrates in natural semi-deciduous forest and plantation forests in Benin. Manuscript submitted to Journal of Tropical Ecology.
Manuscripts to be submitted
Lachat, T., Sinsin, B., Attignon, S., Goergen, G., Peveling, R., Nagel, P. Primary attraction of beetles (Coleoptera) to native and exotic tree species in natural and plantation forests in Lama forest reserve, Benin, manuscript.
Lachat, T., Peveling, R., Attignon, S., Goergen, G., Sinsin, B., Nagel, P. Saproxylic beetle assemblages on native and exotic snags in a West African tropical forest, manuscript.
Other publications
Sinsin, B., Attignon, S., Lachat, T., Peveling, R., Nagel, P. (Eds.), 2003. The Lama forest reserve in Benin – a threatened ecosystem in focus. Opuscula Biogeographica Basileensia III, pp. 32.
96

Talks
Lachat, T. 2004. Natural and plantation forests in Lama forest reserve (Benin) – Safe heavens or biodiversity deserts for arthropods? 17th Annual Meeting of the Society for Tropical Ecology (GTÖ), Bayreuth, Germany.
Lachat, T. 2004. BioLama: State of the research: From soil dwelling arthropods to saproxylic beetles. NLU-Kolloquium, Basel, Switzerland.
Lachat, T. 2003. Les arthropodes de la forêt de la Lama. Premier séminaire du projet BioLama: Pour une meilleure compréhension de l’écosystème de la Lama. IITA-Cotonou, Benin.
Lachat, T. 2002. BioLama : State of the research: Sampling arthropods in tropical forests. NLU-Kolloquium, Basel, Switzerland.
Attignon, S. and Lachat, T. 2002. Les arthropods de la forêt de la Lama: comparaison de différents habitats. Séminaire de l’Association Béninoise de pastoralisme (ABEPA), Cotonou, Benin.
Lachat, T. 2001. Welche vegetationsprägenden Gross- und Megaherbivoren traten in und nach der vorletzten Zwischeneiszeit in der Schweiz auf. NLU-Colloquium, Basel, Switzerland.
97


![Guenther Rosner FAIR - UK meeting @ DL, 11/10/06 1 Collaboration Universität Basel, IHEP Beijing, [University of Birmingham] Ruhr- Universität Bochum,](https://img.pdfslide.net/doc/110x75/55161c2b550346cf6f8b6705/guenther-rosner-fair-uk-meeting-dl-111006-1-collaboration-universitaet-basel-ihep-beijing-university-of-birmingham-ruhr-universitaet-bochum.jpg)