Embed Size (px)
Citation preview

I. BalestraI. Balestra, Paolo Tozzi, S. Ettori, P. Rosati, , Paolo Tozzi, S. Ettori, P. Rosati, S. Borgani, V. Mainieri, M. Viola, C. NormanS. Borgani, V. Mainieri, M. Viola, C. Norman
Galaxies and Structures through Cosmic Times - Venice, March 2006
Evolution in the chemical enrichment of the intracluster
medium
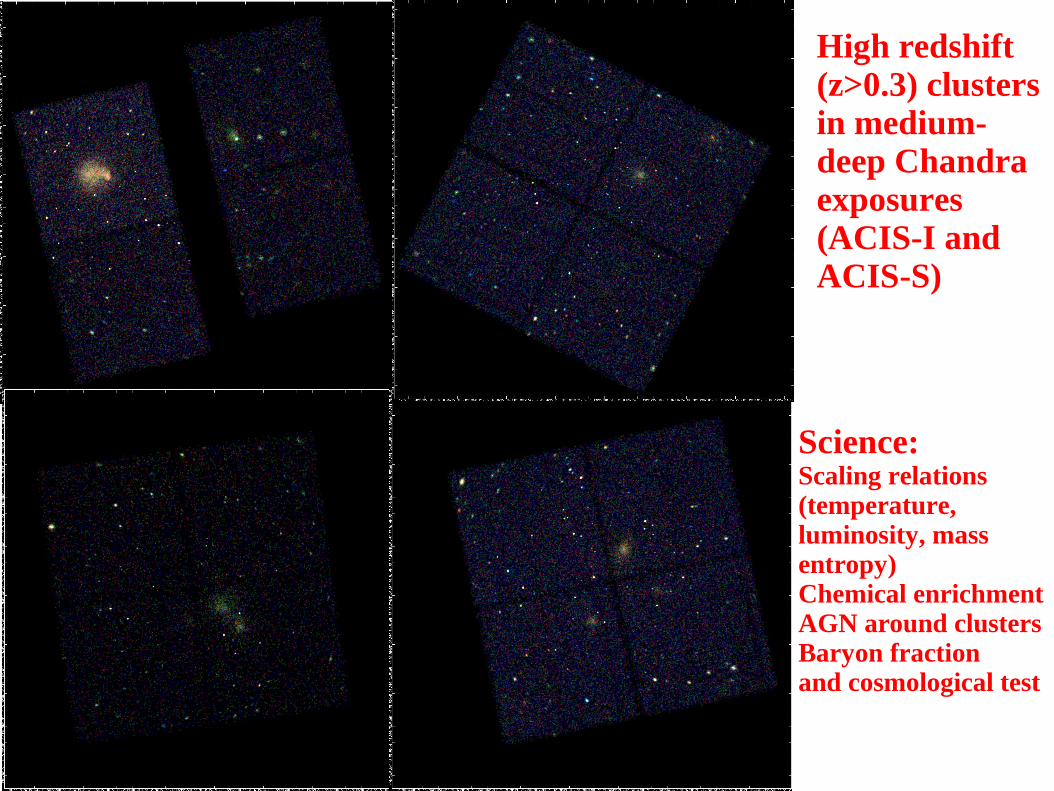
High redshift(z>0.3) clusters in medium-deep Chandraexposures(ACIS-I andACIS-S)
Science:Scaling relations(temperature, luminosity, massentropy)Chemical enrichmentAGN around clustersBaryon fraction and cosmological test
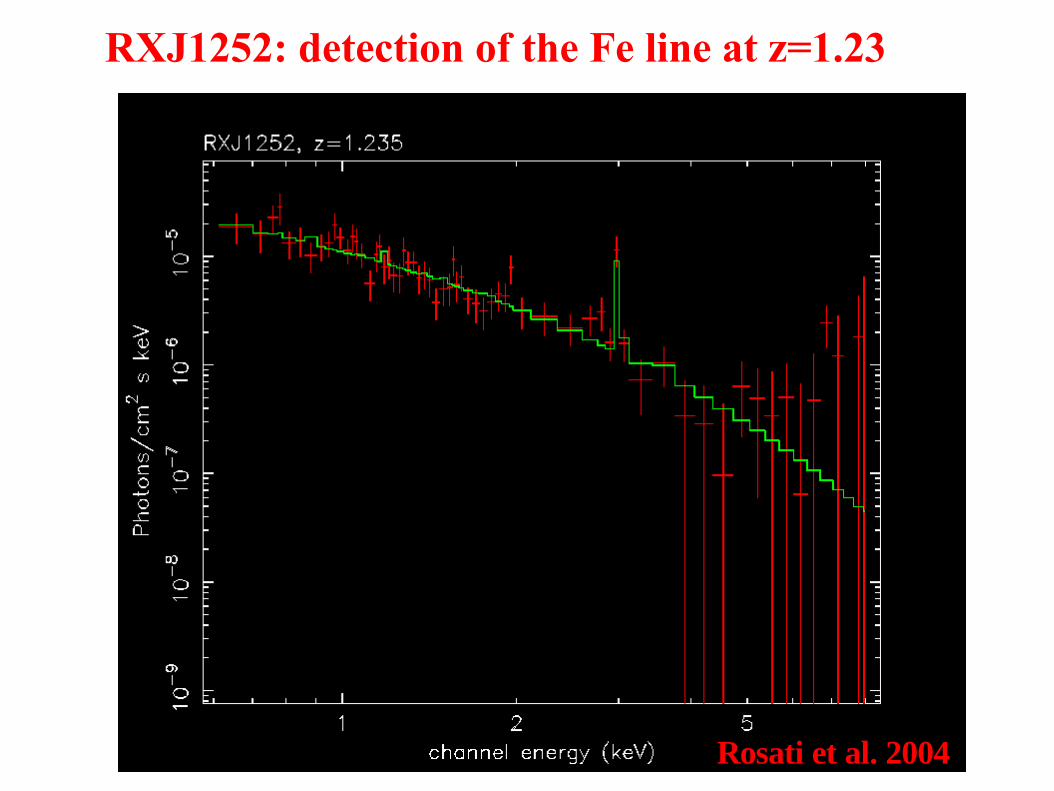
RXJ1252: detection of the Fe line at z=1.23
Rosati et al. 2004

Fe Ions concentration as a function of the ICM temperature
Collisionally dominated optically thin coronal plasmaas a function of electron temperature (Mewe 1991)
5 -10 keVFe XXVFe XXVI
The Iron abundance is determined almost uniquely by the K-shell complex at 6.7-6.9 keV rest-frame

We select from the Chandra archive 56 clusters at z>0.3(among them 7 clusters at z>1)
Distribution with temperature and redshift of the sample
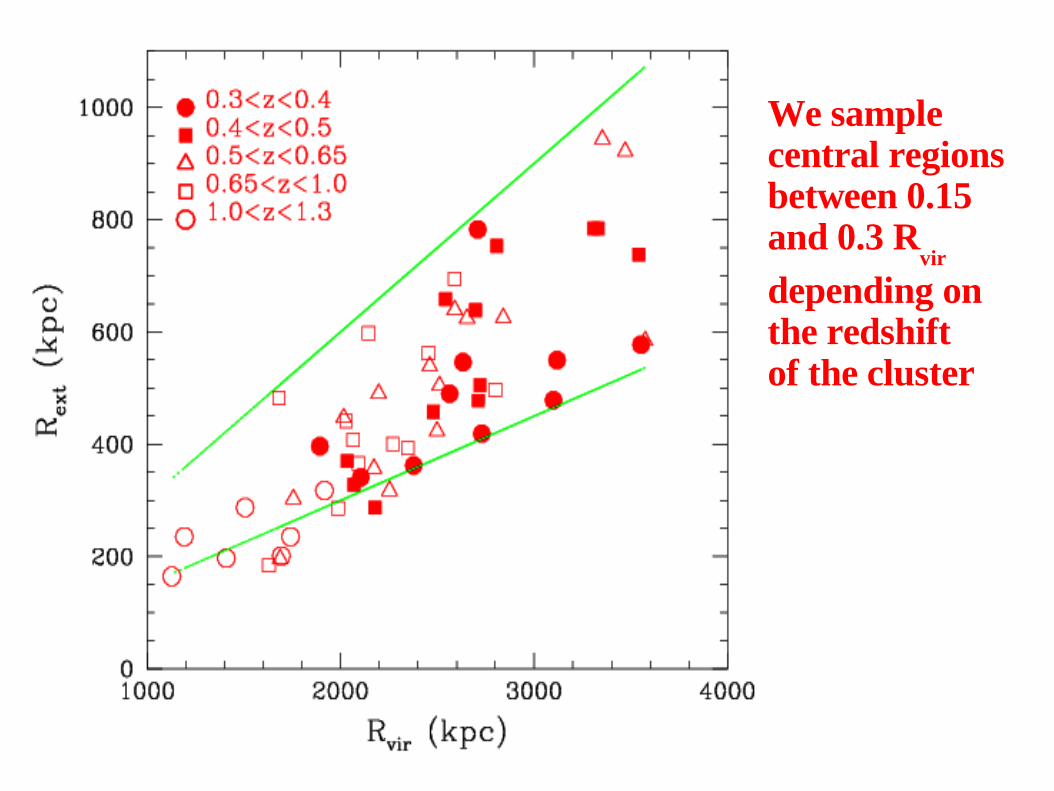
We samplecentral regionsbetween 0.15and 0.3 R
vir
depending on the redshiftof the cluster
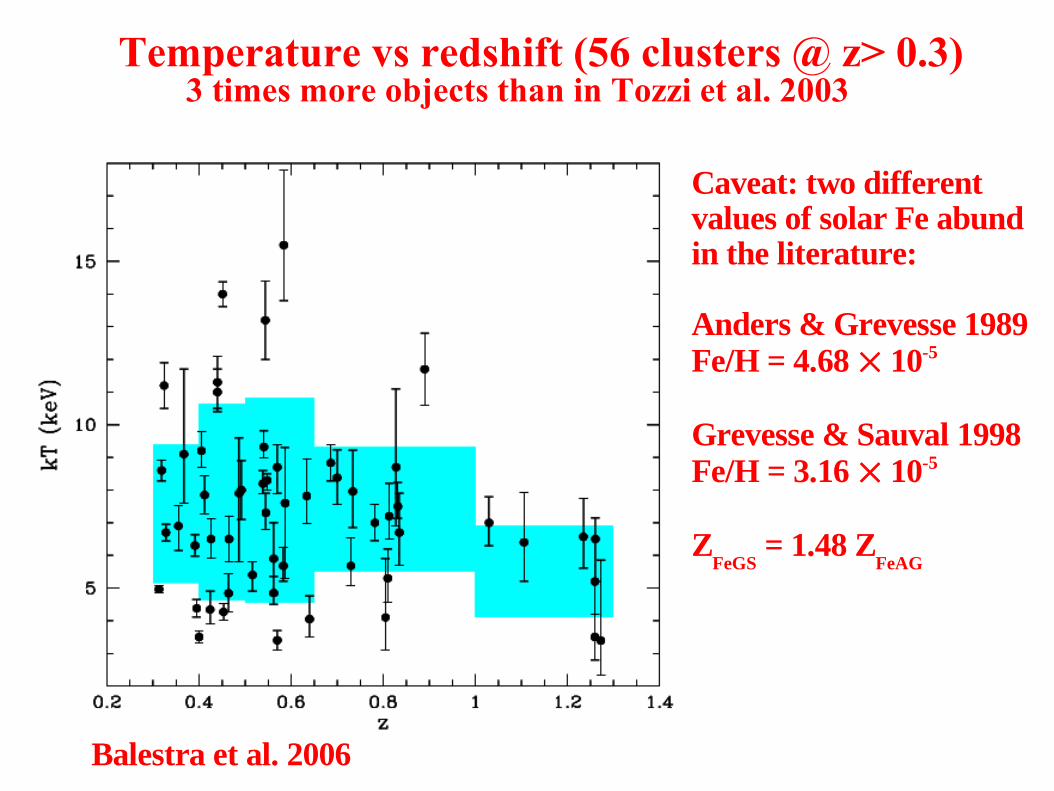
Temperature vs redshift (56 clusters @ z> 0.3)3 times more objects than in Tozzi et al. 2003
Balestra et al. 2006
Caveat: two differentvalues of solar Fe abundin the literature:
Anders & Grevesse 1989Fe/H = 4.68 × 10⁻⁵
Grevesse & Sauval 1998Fe/H = 3.16 × 10⁻⁵
ZFeGS
= 1.48 ZFeAG

Scatter comparable with statistical errorshint ofhigherFe abundanceat low kT<5 keV
Fe abundance-Temperature in different redshift bins
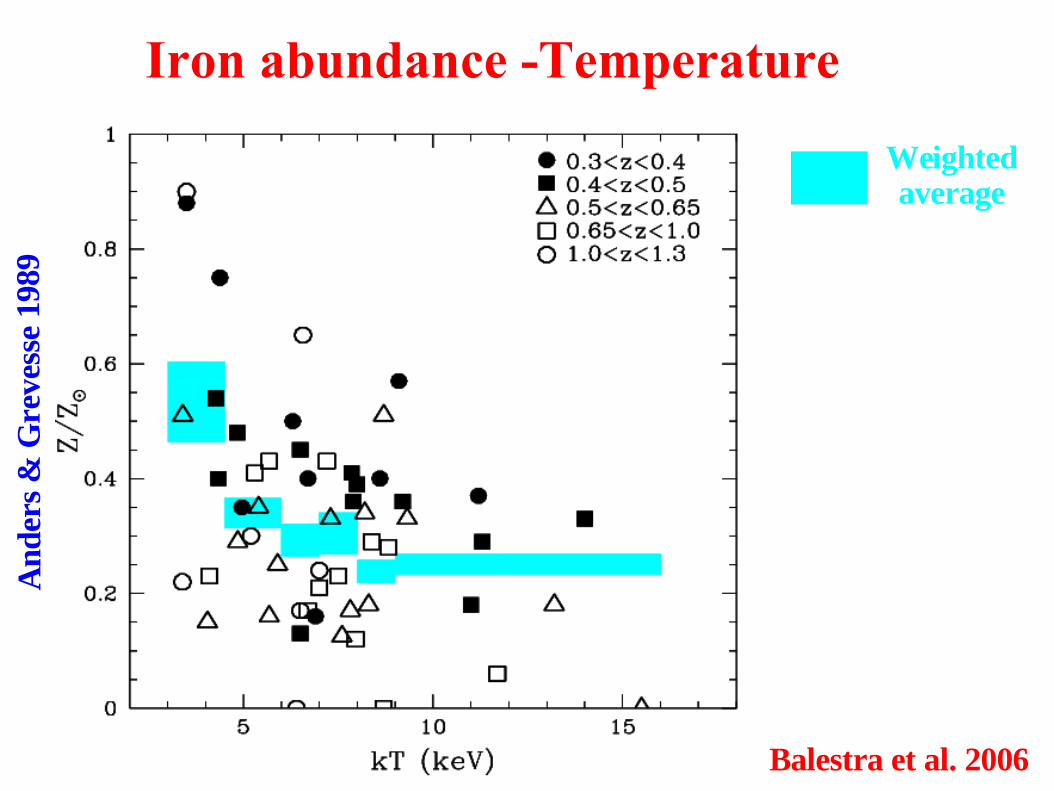
Iron abundance -Temperature
Weightedaverage
Balestra et al. 2006
And
ers
& G
reve
sse
1989
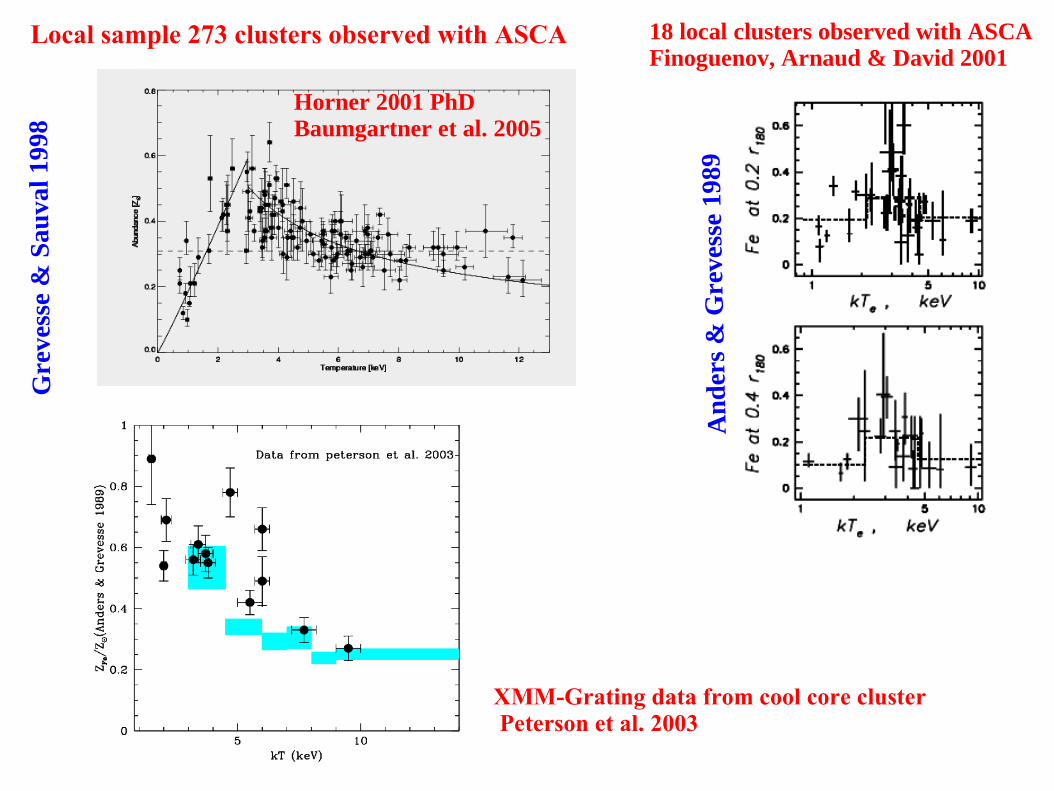
Horner 2001 PhDBaumgartner et al. 2005
Local sample 273 clusters observed with ASCAG
reve
sse
& S
auva
l 199
818 local clusters observed with ASCAFinoguenov, Arnaud & David 2001
And
ers
& G
reve
sse
1989
XMM-Grating data from cool core cluster Peterson et al. 2003
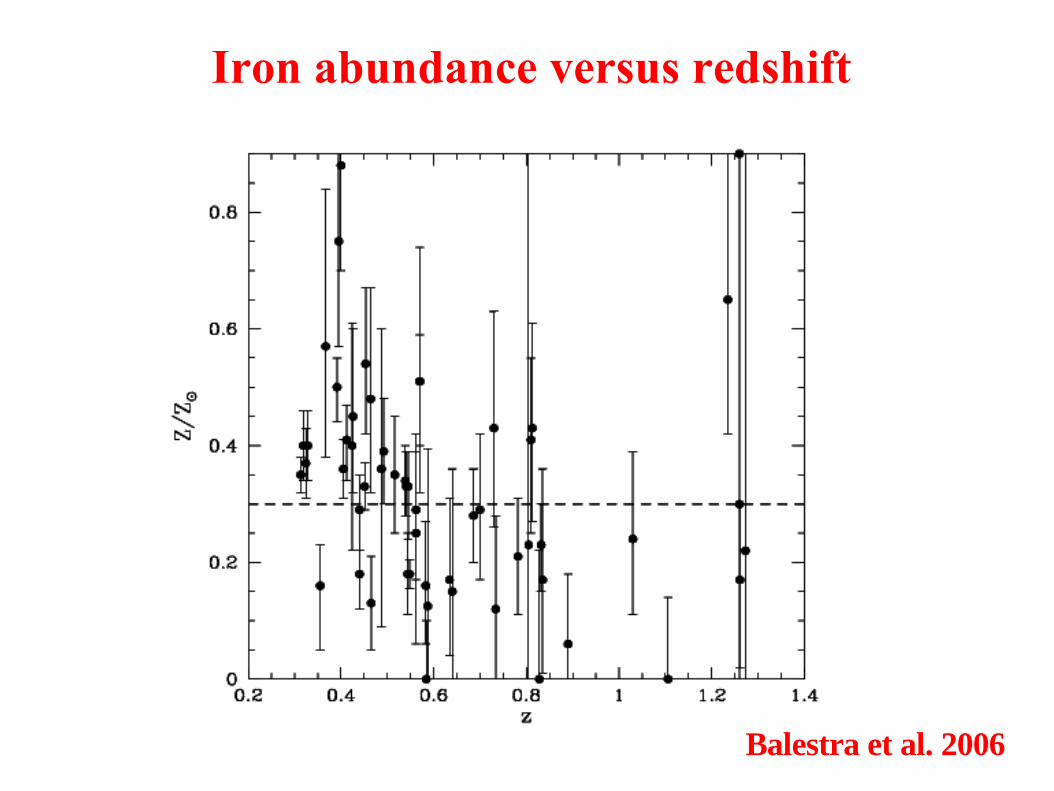
Iron abundance versus redshift
Balestra et al. 2006
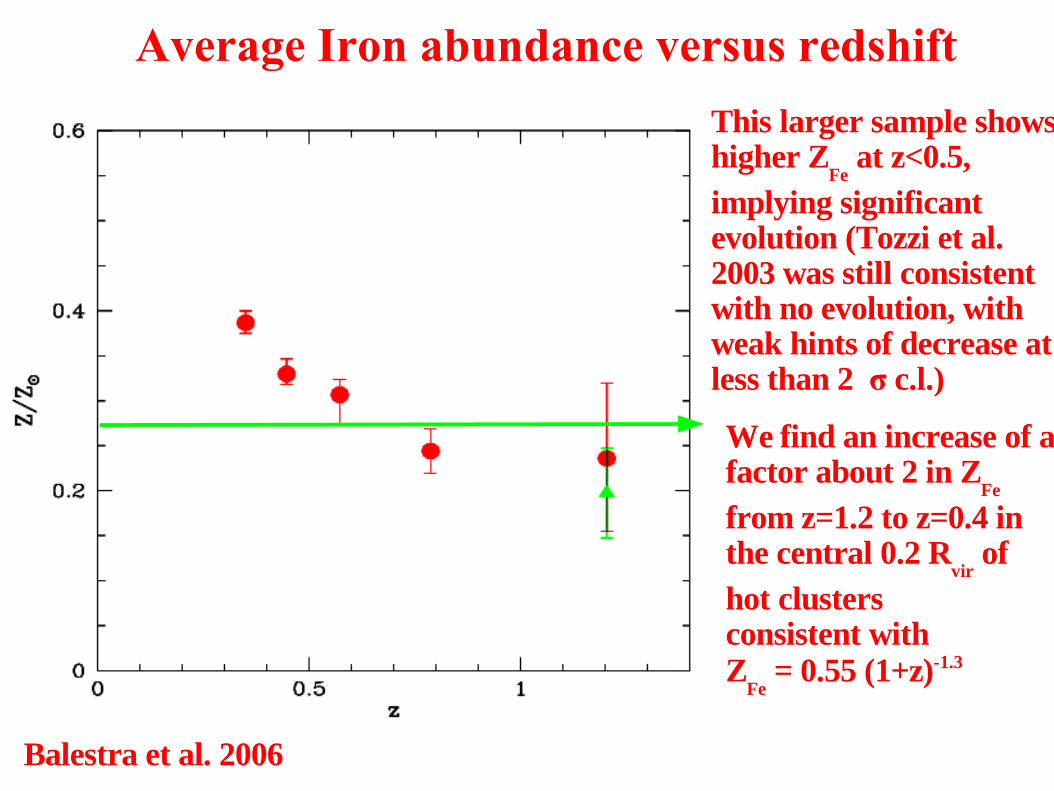
Average Iron abundance versus redshift
Balestra et al. 2006
We find an increase of a factor about 2 in Z
Fe
from z=1.2 to z=0.4 in the central 0.2 R
vir of
hot clustersconsistent with Z
Fe = 0.55 (1+z)-1.3
This larger sample showshigher Z
Fe at z<0.5,
implying significant evolution (Tozzi et al. 2003 was still consistentwith no evolution, with weak hints of decrease at less than 2 σ c.l.)
It is known that locally ZFe
= 0.6 in cold-core clusters and Zfe = 0.2/0.3 in
non cold-core clusters (see De Grandi et al. 2001; 2004).
Is this evolution associated to the evolution of the cold-cores with Iron peak within the central 0.1 R
vir?
First check: Iron abundances are not affected by masking of the central 0.1 R
vir (when possible)
More directly, there is no correlation with the central surface brightness(cooling time)
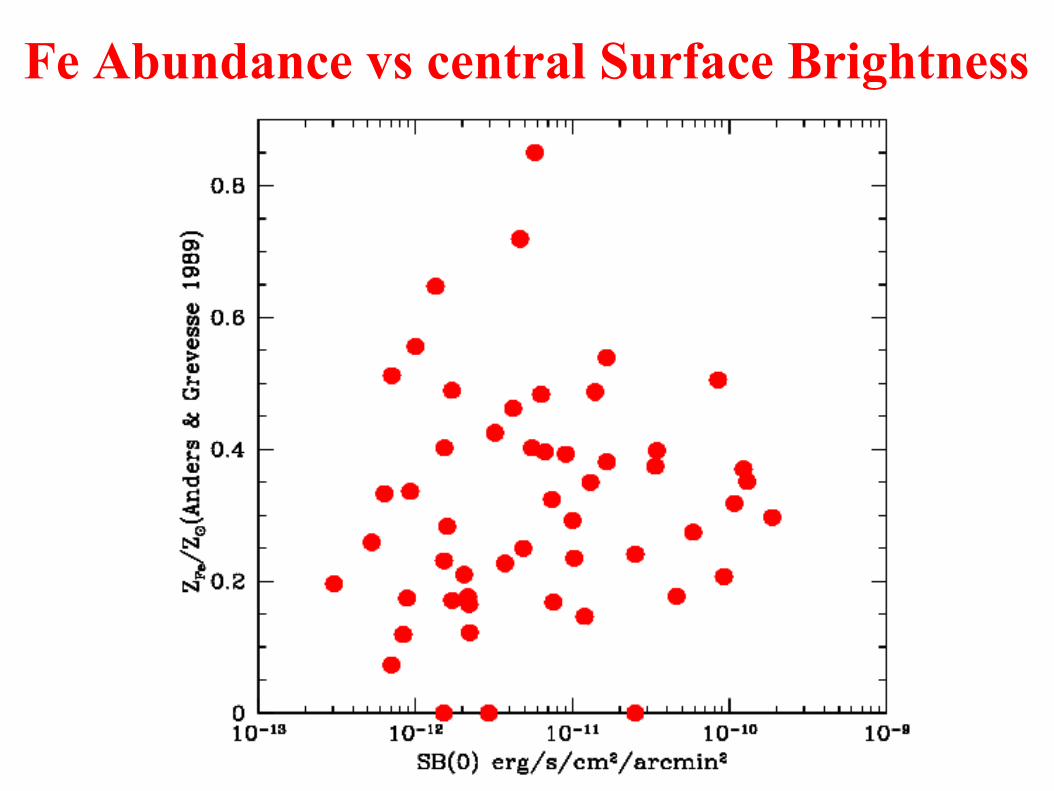
Fe Abundance vs central Surface Brightness

Is the Iron abundance evolution expected?
Ettori 2005
Fe abundance in the ICM from the observed cosmic Star Formation Ratewith large delay times for TyIa Sne (~4 Gyr, see Dahlen et al. 2004)

CONCLUSIONS
Clear detection of the Iron line in the large majority of high-z clusters, up to z~1.3
Correlation in the Iron abundance – Temperature relation at high-z: Iron abundance starts to increase below 5 keV
Fe abundance ~ 0.25 Z⊙ constant for z>0.6
Higher average Fe abundance in the z~0.4-0.6 redshift range
The decrease of the average Iron abundance from ZFe
=0.4 Z⊙(@ z~0.3)
to ZFe
=0.2 Z⊙ (z~1.3), consistent with cosmic star formation rate only
for large TyIa delay times (~ 4 Gyr).
Open question: production of diffusion of Fe enriched gas betweenz=1.2 and z=0.4?
A sample of ~56 clusters @ z>0.3 observed with Chandra