Embed Size (px)
Citation preview
EVOLVING TRENDS OF U.S. DOMESTIC AIRFARES:
THE IMPACTS OF COMPETITION, CONSOLIDATION,
AND LOW-COST CARRIERS
Michael D. Wittman and William S. Swelbar
MIT International Center for Air Transportation
MIT Small Community Air Service White Paper No. 3
Report No. ICAT-2013-07
August 2013
MIT International Center for Air Transportation (ICAT)
Department of Aeronautics & Astronautics
Massachusetts Institute of Technology
Cambridge, MA 02139 USA
Evolving Trends of U.S. Domestic Airfares 2
Introduction to paper series
This report, Evolving Trends of U.S. Domestic Airfares: The Impacts of Competition, Consolidation, and
Low-Cost Carriers, is the third in a series of papers written under the umbrella of the MIT Small
Community Air Service White Paper series. The aim of the paper series is to examine and analyze the
past, current, and anticipated future trends of small community air service in the United States. The
series is intended for a general audience of airline and airport executives, aviation policy makers, the
news media, and anyone with an interest in the evolution of commercial air service at the nation’s
smaller airports. The authors of this paper series hope that these reports will serve to inform the policy
debate with relevant and accurate statistical analysis, such that those responsible for deciding the future
of small community air service will do so armed with factual basis for their actions.
The authors of the MIT Small Community Air Service White Paper series are members of the
Massachusetts Institute of Technology’s International Center for Air Transportation, one of the nation’s
premier centers for aviation, airline, and airport research. Financial support for study authors has been
provided in part by the MIT Airline Industry Consortium, an interdisciplinary group of airlines, airport
councils, manufacturers, suppliers, policy makers, and advocacy groups dedicated to improving the state
of the practice of air transportation research in the United States. However, any views or analyses
presented in this and all future reports are the sole opinions of the authors and do not reflect the
positions of MIT Airline Industry Consortium members or MIT.
Acknowledgements
The authors wish to thank Peter Belobaba and the members of the MIT Airline Industry Consortium for
their helpful comments and suggestions during the completion of this study.
Evolving Trends of U.S. Domestic Airfares 3
Executive Summary Economic theory suggests that prices of goods and services may rise as a result of “supply shocks” such
as increases in net input prices. In the U.S., the airline industry has met with a number of such “shocks”
since 2007, from high and volatile fuel prices (which increased by 57% from 2007-2012, according to the
MIT Airline Data Project) to a global economic downturn. Additionally, airlines have pursued
conservative capacity strategies in recent years in an attempt to regain profitability, putting further
upward pressure on prices. In all, these supply shocks and disciplined capacity management resulted in a
14.3% reduction in scheduled domestic flights in the U.S. from 2007-2012. Theoretically, we would
expect airfares to also increase over the same period, adjusting for inflation. The purpose of this paper is
to investigate whether average airfares have indeed increased at U.S. airports over the last six years.
Through an analysis of ticket data, we find that average one-way airfares at the 29 largest airports in the
U.S. increased by 8.7% on average from 2007-2012, adjusting for inflation. Average inflation-adjusted
one-way airfares at 35 mid-sized airports increased by 11.9% on average over the same period. Some
airports saw increases in airfares of over 20%, while others saw net decreases in average fares. As
economic theory would suggest, airports that gained many new flights over the study period were more
likely to see their average fares fall. For instance, at San Francisco International Airport (SFO)—where
domestic departures increased by 20.9% from 2007-2012—fares decreased by 4% over the same period.
We also investigate how airfares changed in regions with multiple airports. In our earlier report on
domestic capacity1, we found that airlines were consolidating service at larger airports in multi-airport
regions while restricting capacity at the smaller airports in those regions. Similarly, in many multi-airport
regions, we find that average fares at smaller airports increased by a greater percentage than fares at
the larger airports in those regions. This behavior is likely explained in part by recent capacity reduction
decisions by Southwest Airlines, which has a significant presence at many secondary airports, as well as
network carriers cutting redundant flying to secondary hubs.
Finally, we examine the effect of the presence of low-cost carriers on average fares at 445 U.S. airports.
Much research has been done on the famous “Southwest effect,” which suggests that passenger traffic
increases and fares decrease once Southwest Airlines enters a market. Previous research has shown that
entry by Southwest (or even the threat of entry) has the potential to decrease fares in both directly-
competing and adjacent markets.2
However, recent work3 has suggested that the Southwest effect has started to weaken, and no longer
provides the same degree of downward pressure on fares in city-pair markets in which mergers of other
1 Wittman and Swelbar (2013) “Trends and Market Forces Shaping Small Community Air Service in the U.S.” 2 cf. Morrison, S.J. 2001. Actual, adjacent, and potential competition: Estimating the full effect of Southwest Airlines. Journal of Transport Economics and Policy 35(2).239-256; Vowles, T.M. 2001. The “Southwest Effect” in Multi-Airport Regions. Journal of Air Transport Management 7(4). 251-258; Goolsbee, A. and C. Syverson. 2008. How Do Incumbents Respond to the Threat of Entry? Evidence from the Major Airlines. Quarterly Journal of Economics 123(4). 1611-1633; and others. 3 bin Salam, S. and B.S. McMullen. 2013. Is There Still a Southwest Effect? Transportation Research Record: Journal of the Transportation Research Board 2025. 1-8.
Evolving Trends of U.S. Domestic Airfares 4
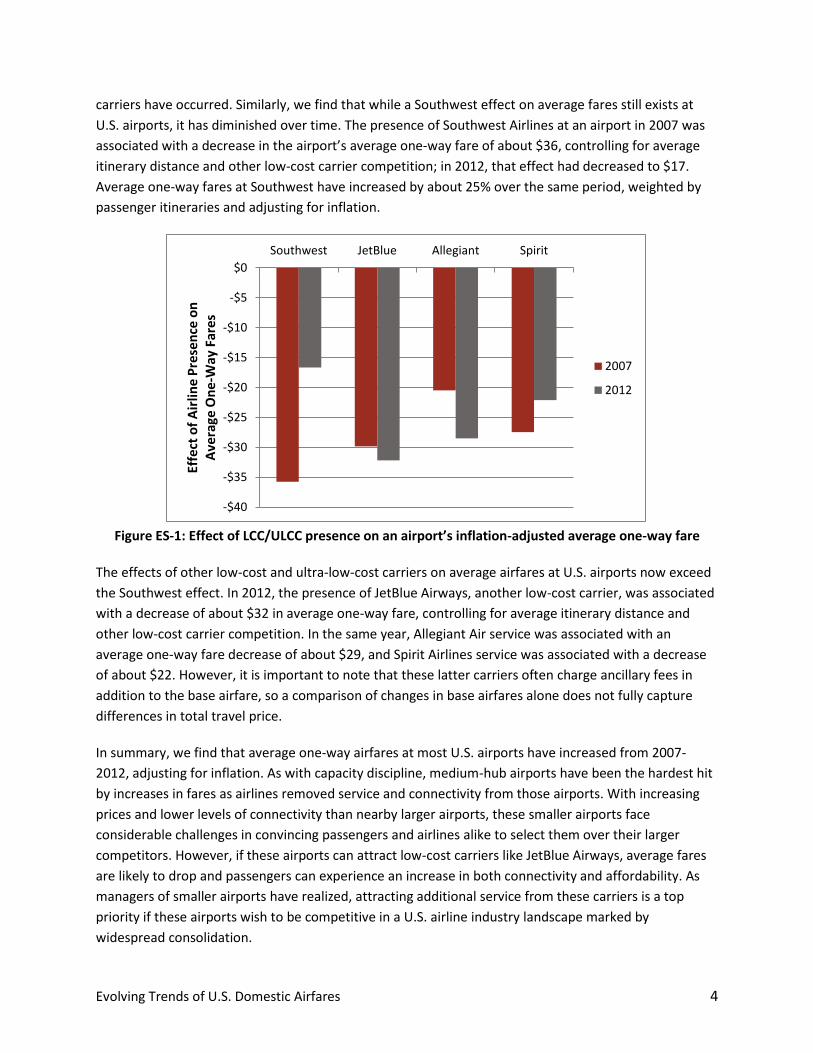
carriers have occurred. Similarly, we find that while a Southwest effect on average fares still exists at
U.S. airports, it has diminished over time. The presence of Southwest Airlines at an airport in 2007 was
associated with a decrease in the airport’s average one-way fare of about $36, controlling for average
itinerary distance and other low-cost carrier competition; in 2012, that effect had decreased to $17.
Average one-way fares at Southwest have increased by about 25% over the same period, weighted by
passenger itineraries and adjusting for inflation.
Figure ES-1: Effect of LCC/ULCC presence on an airport’s inflation-adjusted average one-way fare
The effects of other low-cost and ultra-low-cost carriers on average airfares at U.S. airports now exceed
the Southwest effect. In 2012, the presence of JetBlue Airways, another low-cost carrier, was associated
with a decrease of about $32 in average one-way fare, controlling for average itinerary distance and
other low-cost carrier competition. In the same year, Allegiant Air service was associated with an
average one-way fare decrease of about $29, and Spirit Airlines service was associated with a decrease
of about $22. However, it is important to note that these latter carriers often charge ancillary fees in
addition to the base airfare, so a comparison of changes in base airfares alone does not fully capture
differences in total travel price.
In summary, we find that average one-way airfares at most U.S. airports have increased from 2007-
2012, adjusting for inflation. As with capacity discipline, medium-hub airports have been the hardest hit
by increases in fares as airlines removed service and connectivity from those airports. With increasing
prices and lower levels of connectivity than nearby larger airports, these smaller airports face
considerable challenges in convincing passengers and airlines alike to select them over their larger
competitors. However, if these airports can attract low-cost carriers like JetBlue Airways, average fares
are likely to drop and passengers can experience an increase in both connectivity and affordability. As
managers of smaller airports have realized, attracting additional service from these carriers is a top
priority if these airports wish to be competitive in a U.S. airline industry landscape marked by
widespread consolidation.
-$40
-$35
-$30
-$25
-$20
-$15
-$10
-$5
$0
Southwest JetBlue Allegiant Spirit
Effe
ct o
f A
irlin
e P
rese
nce
on
A
vera
ge O
ne
-Way
Far
es
2007
2012
Evolving Trends of U.S. Domestic Airfares 5
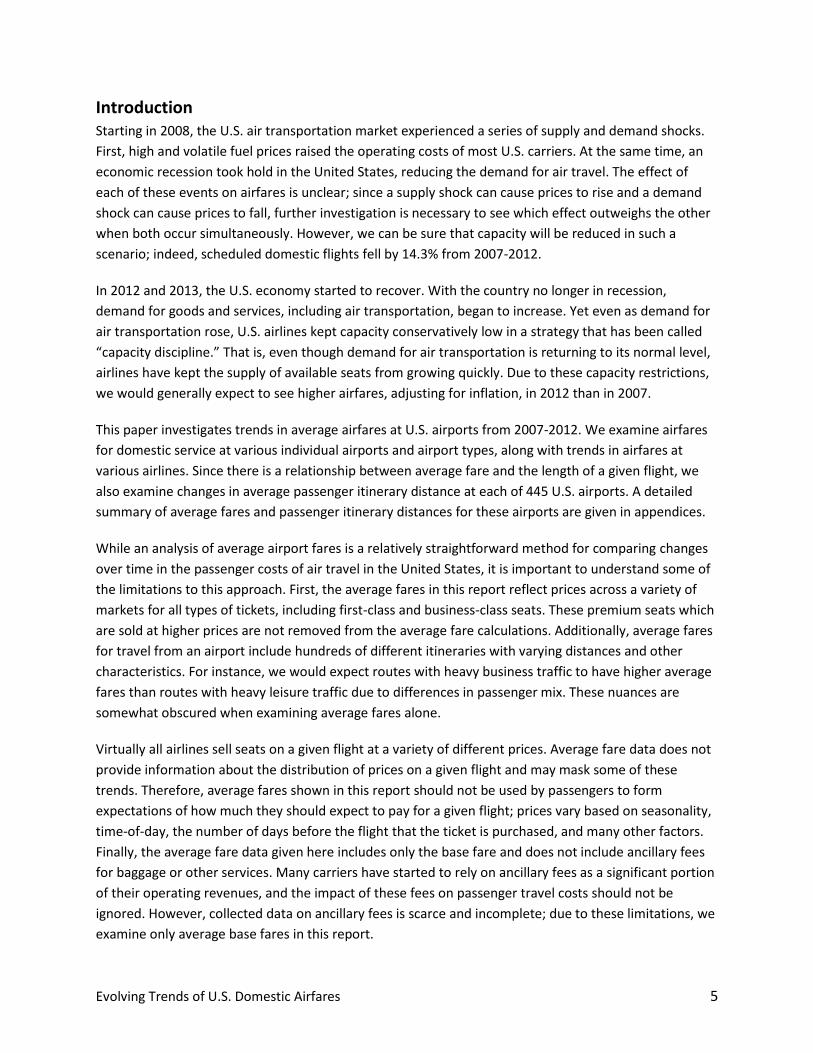
Introduction Starting in 2008, the U.S. air transportation market experienced a series of supply and demand shocks.
First, high and volatile fuel prices raised the operating costs of most U.S. carriers. At the same time, an
economic recession took hold in the United States, reducing the demand for air travel. The effect of
each of these events on airfares is unclear; since a supply shock can cause prices to rise and a demand
shock can cause prices to fall, further investigation is necessary to see which effect outweighs the other
when both occur simultaneously. However, we can be sure that capacity will be reduced in such a
scenario; indeed, scheduled domestic flights fell by 14.3% from 2007-2012.
In 2012 and 2013, the U.S. economy started to recover. With the country no longer in recession,
demand for goods and services, including air transportation, began to increase. Yet even as demand for
air transportation rose, U.S. airlines kept capacity conservatively low in a strategy that has been called
“capacity discipline.” That is, even though demand for air transportation is returning to its normal level,
airlines have kept the supply of available seats from growing quickly. Due to these capacity restrictions,
we would generally expect to see higher airfares, adjusting for inflation, in 2012 than in 2007.
This paper investigates trends in average airfares at U.S. airports from 2007-2012. We examine airfares
for domestic service at various individual airports and airport types, along with trends in airfares at
various airlines. Since there is a relationship between average fare and the length of a given flight, we
also examine changes in average passenger itinerary distance at each of 445 U.S. airports. A detailed
summary of average fares and passenger itinerary distances for these airports are given in appendices.
While an analysis of average airport fares is a relatively straightforward method for comparing changes
over time in the passenger costs of air travel in the United States, it is important to understand some of
the limitations to this approach. First, the average fares in this report reflect prices across a variety of
markets for all types of tickets, including first-class and business-class seats. These premium seats which
are sold at higher prices are not removed from the average fare calculations. Additionally, average fares
for travel from an airport include hundreds of different itineraries with varying distances and other
characteristics. For instance, we would expect routes with heavy business traffic to have higher average
fares than routes with heavy leisure traffic due to differences in passenger mix. These nuances are
somewhat obscured when examining average fares alone.
Virtually all airlines sell seats on a given flight at a variety of different prices. Average fare data does not
provide information about the distribution of prices on a given flight and may mask some of these
trends. Therefore, average fares shown in this report should not be used by passengers to form
expectations of how much they should expect to pay for a given flight; prices vary based on seasonality,
time-of-day, the number of days before the flight that the ticket is purchased, and many other factors.
Finally, the average fare data given here includes only the base fare and does not include ancillary fees
for baggage or other services. Many carriers have started to rely on ancillary fees as a significant portion
of their operating revenues, and the impact of these fees on passenger travel costs should not be
ignored. However, collected data on ancillary fees is scarce and incomplete; due to these limitations, we
examine only average base fares in this report.
Evolving Trends of U.S. Domestic Airfares 6
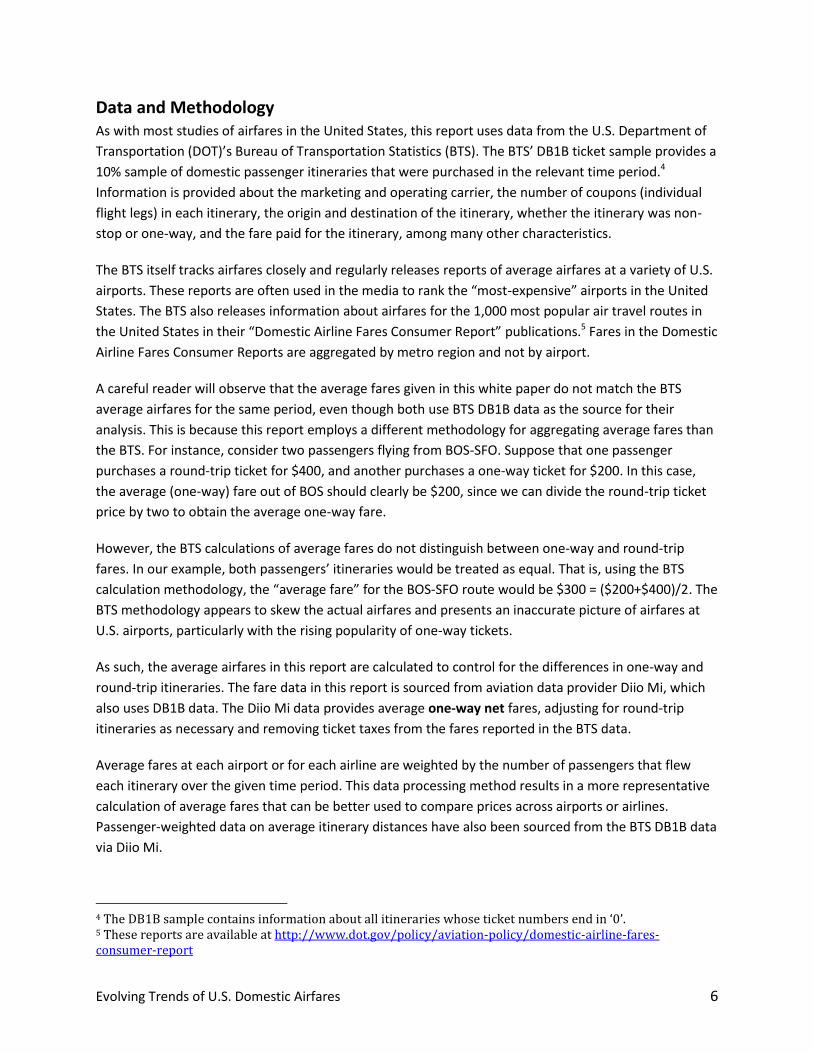
Data and Methodology As with most studies of airfares in the United States, this report uses data from the U.S. Department of
Transportation (DOT)’s Bureau of Transportation Statistics (BTS). The BTS’ DB1B ticket sample provides a
10% sample of domestic passenger itineraries that were purchased in the relevant time period.4
Information is provided about the marketing and operating carrier, the number of coupons (individual
flight legs) in each itinerary, the origin and destination of the itinerary, whether the itinerary was non-
stop or one-way, and the fare paid for the itinerary, among many other characteristics.
The BTS itself tracks airfares closely and regularly releases reports of average airfares at a variety of U.S.
airports. These reports are often used in the media to rank the “most-expensive” airports in the United
States. The BTS also releases information about airfares for the 1,000 most popular air travel routes in
the United States in their “Domestic Airline Fares Consumer Report” publications.5 Fares in the Domestic
Airline Fares Consumer Reports are aggregated by metro region and not by airport.
A careful reader will observe that the average fares given in this white paper do not match the BTS
average airfares for the same period, even though both use BTS DB1B data as the source for their
analysis. This is because this report employs a different methodology for aggregating average fares than
the BTS. For instance, consider two passengers flying from BOS-SFO. Suppose that one passenger
purchases a round-trip ticket for $400, and another purchases a one-way ticket for $200. In this case,
the average (one-way) fare out of BOS should clearly be $200, since we can divide the round-trip ticket
price by two to obtain the average one-way fare.
However, the BTS calculations of average fares do not distinguish between one-way and round-trip
fares. In our example, both passengers’ itineraries would be treated as equal. That is, using the BTS
calculation methodology, the “average fare” for the BOS-SFO route would be $300 = ($200+$400)/2. The
BTS methodology appears to skew the actual airfares and presents an inaccurate picture of airfares at
U.S. airports, particularly with the rising popularity of one-way tickets.
As such, the average airfares in this report are calculated to control for the differences in one-way and
round-trip itineraries. The fare data in this report is sourced from aviation data provider Diio Mi, which
also uses DB1B data. The Diio Mi data provides average one-way net fares, adjusting for round-trip
itineraries as necessary and removing ticket taxes from the fares reported in the BTS data.
Average fares at each airport or for each airline are weighted by the number of passengers that flew
each itinerary over the given time period. This data processing method results in a more representative
calculation of average fares that can be better used to compare prices across airports or airlines.
Passenger-weighted data on average itinerary distances have also been sourced from the BTS DB1B data
via Diio Mi.
4 The DB1B sample contains information about all itineraries whose ticket numbers end in ‘0’. 5 These reports are available at http://www.dot.gov/policy/aviation-policy/domestic-airline-fares-consumer-report
Evolving Trends of U.S. Domestic Airfares 7
Overview: Average Fares by Airport Type and by Region
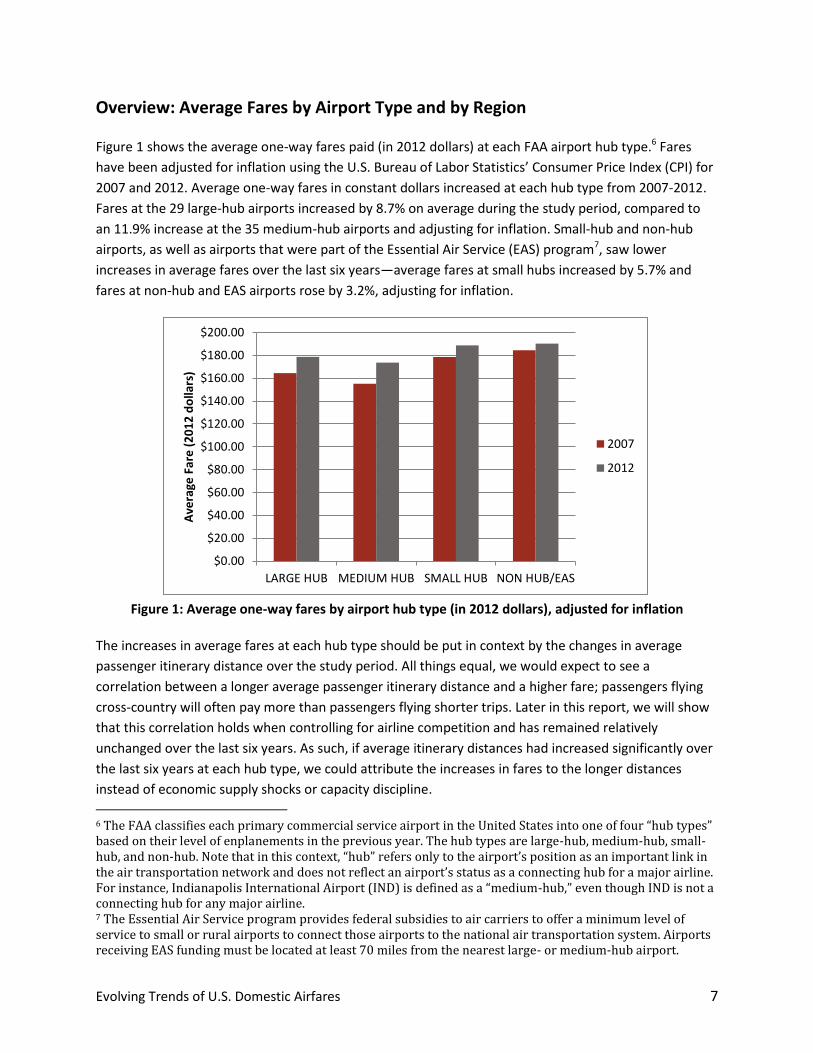
Figure 1 shows the average one-way fares paid (in 2012 dollars) at each FAA airport hub type.6 Fares
have been adjusted for inflation using the U.S. Bureau of Labor Statistics’ Consumer Price Index (CPI) for
2007 and 2012. Average one-way fares in constant dollars increased at each hub type from 2007-2012.
Fares at the 29 large-hub airports increased by 8.7% on average during the study period, compared to
an 11.9% increase at the 35 medium-hub airports and adjusting for inflation. Small-hub and non-hub
airports, as well as airports that were part of the Essential Air Service (EAS) program7, saw lower
increases in average fares over the last six years—average fares at small hubs increased by 5.7% and
fares at non-hub and EAS airports rose by 3.2%, adjusting for inflation.
Figure 1: Average one-way fares by airport hub type (in 2012 dollars), adjusted for inflation
The increases in average fares at each hub type should be put in context by the changes in average
passenger itinerary distance over the study period. All things equal, we would expect to see a
correlation between a longer average passenger itinerary distance and a higher fare; passengers flying
cross-country will often pay more than passengers flying shorter trips. Later in this report, we will show
that this correlation holds when controlling for airline competition and has remained relatively
unchanged over the last six years. As such, if average itinerary distances had increased significantly over
the last six years at each hub type, we could attribute the increases in fares to the longer distances
instead of economic supply shocks or capacity discipline.
6 The FAA classifies each primary commercial service airport in the United States into one of four “hub types” based on their level of enplanements in the previous year. The hub types are large-hub, medium-hub, small-hub, and non-hub. Note that in this context, “hub” refers only to the airport’s position as an important link in the air transportation network and does not reflect an airport’s status as a connecting hub for a major airline. For instance, Indianapolis International Airport (IND) is defined as a “medium-hub,” even though IND is not a connecting hub for any major airline. 7 The Essential Air Service program provides federal subsidies to air carriers to offer a minimum level of service to small or rural airports to connect those airports to the national air transportation system. Airports receiving EAS funding must be located at least 70 miles from the nearest large- or medium-hub airport.
$0.00
$20.00
$40.00
$60.00
$80.00
$100.00
$120.00
$140.00
$160.00
$180.00
$200.00
LARGE HUB MEDIUM HUB SMALL HUB NON HUB/EAS
Ave
rage
Far
e (
20
12
do
llars
)
2007
2012
Evolving Trends of U.S. Domestic Airfares 8
Hub Type Avg. One-Way
Fare (2007)
Avg. One-Way
Fare (2012)
% Change in Avg.
Fare (07-12)
% Change in Avg.
Distance (07-12)
% Change in
Flights (07-12)
Large Hub $164.52 $178.76 8.7% 2.1% -8.8%
Medium Hub $155.13 $173.63 11.9% 1.5% -26.2%
Small Hub $178.63 $188.83 5.7% 0.9% -18.2%
Non-hub/EAS $184.44 $190.34 3.2% 9.8% -13.9%
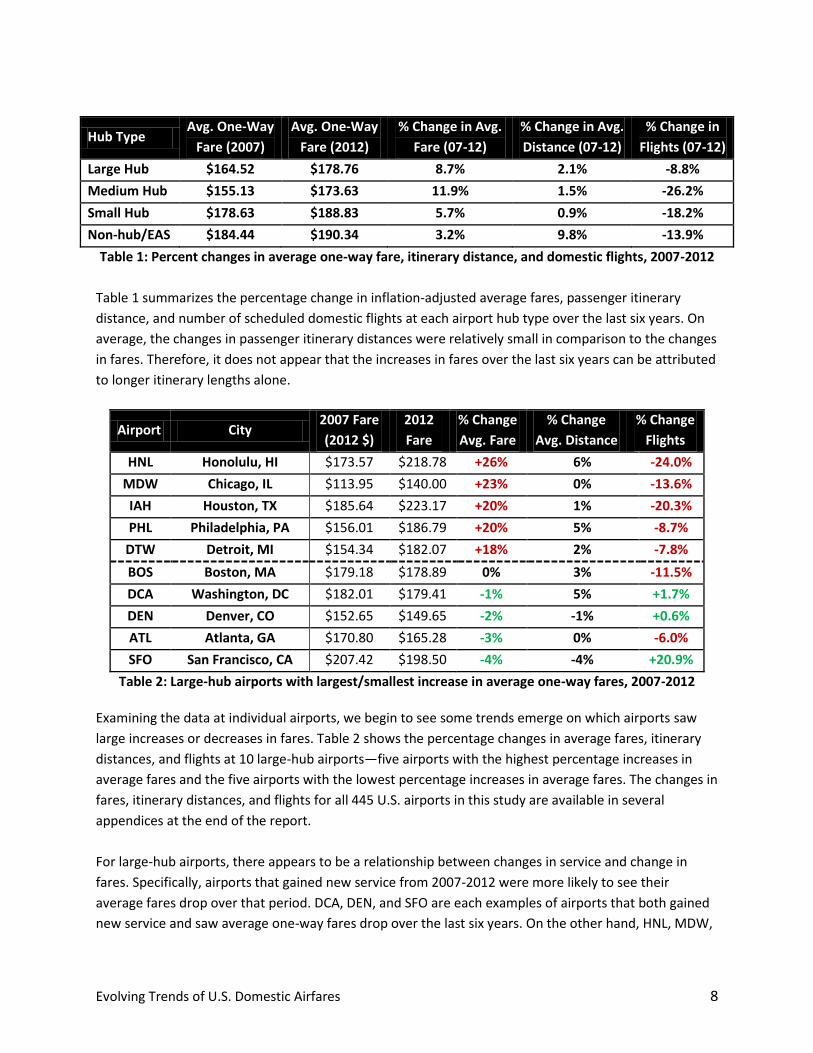
Table 1: Percent changes in average one-way fare, itinerary distance, and domestic flights, 2007-2012
Table 1 summarizes the percentage change in inflation-adjusted average fares, passenger itinerary
distance, and number of scheduled domestic flights at each airport hub type over the last six years. On
average, the changes in passenger itinerary distances were relatively small in comparison to the changes
in fares. Therefore, it does not appear that the increases in fares over the last six years can be attributed
to longer itinerary lengths alone.
Airport City 2007 Fare
(2012 $)
2012
Fare
% Change
Avg. Fare
% Change
Avg. Distance
% Change
Flights
HNL Honolulu, HI $173.57 $218.78 +26% 6% -24.0%
MDW Chicago, IL $113.95 $140.00 +23% 0% -13.6%
IAH Houston, TX $185.64 $223.17 +20% 1% -20.3%
PHL Philadelphia, PA $156.01 $186.79 +20% 5% -8.7%
DTW Detroit, MI $154.34 $182.07 +18% 2% -7.8%
BOS Boston, MA $179.18 $178.89 0% 3% -11.5%
DCA Washington, DC $182.01 $179.41 -1% 5% +1.7%
DEN Denver, CO $152.65 $149.65 -2% -1% +0.6%
ATL Atlanta, GA $170.80 $165.28 -3% 0% -6.0%
SFO San Francisco, CA $207.42 $198.50 -4% -4% +20.9%
Table 2: Large-hub airports with largest/smallest increase in average one-way fares, 2007-2012
Examining the data at individual airports, we begin to see some trends emerge on which airports saw
large increases or decreases in fares. Table 2 shows the percentage changes in average fares, itinerary
distances, and flights at 10 large-hub airports—five airports with the highest percentage increases in
average fares and the five airports with the lowest percentage increases in average fares. The changes in
fares, itinerary distances, and flights for all 445 U.S. airports in this study are available in several
appendices at the end of the report.
For large-hub airports, there appears to be a relationship between changes in service and change in
fares. Specifically, airports that gained new service from 2007-2012 were more likely to see their
average fares drop over that period. DCA, DEN, and SFO are each examples of airports that both gained
new service and saw average one-way fares drop over the last six years. On the other hand, HNL, MDW,
Evolving Trends of U.S. Domestic Airfares 9
IAH, and PHL each saw increases in average fares of at least 20% from 2007-2012. These airports each
lost service over the study period.
Airport City 2007 Fare
(2012 $)
2012
Fare
% Change
Avg. Fare
% Change
Avg. Distance
% Change
Flights
DAL Dallas (Love), TX $97.28 $133.21 37% 22% -13.5%
HOU Houston (Hobby), TX $124.89 $157.94 26% 12% -2.2%
OGG Kahului, HI $169.90 $214.26 26% 8% -1.7%
CMH Columbus, OH $144.01 $174.62 21% -2% -21.2%
PIT Pittsburgh, PA $144.84 $173.35 20% 4% -39.7%
OAK Oakland, CA $127.54 $134.90 6% -12% -36.6%
PDX Portland, OR $161.70 $170.07 5% 2% -15.7%
CVG Cincinnati, OH $224.62 $224.01 0% 3% -64.4%
SJU San Juan, PR $185.79 $175.65 -5% -2% -3.3%
MKE Milwaukee, WI $165.36 $153.53 -7% 4% -36.9%
Table 3: Medium-hub airports with largest/smallest increase in average one-way fares, 2007-2012
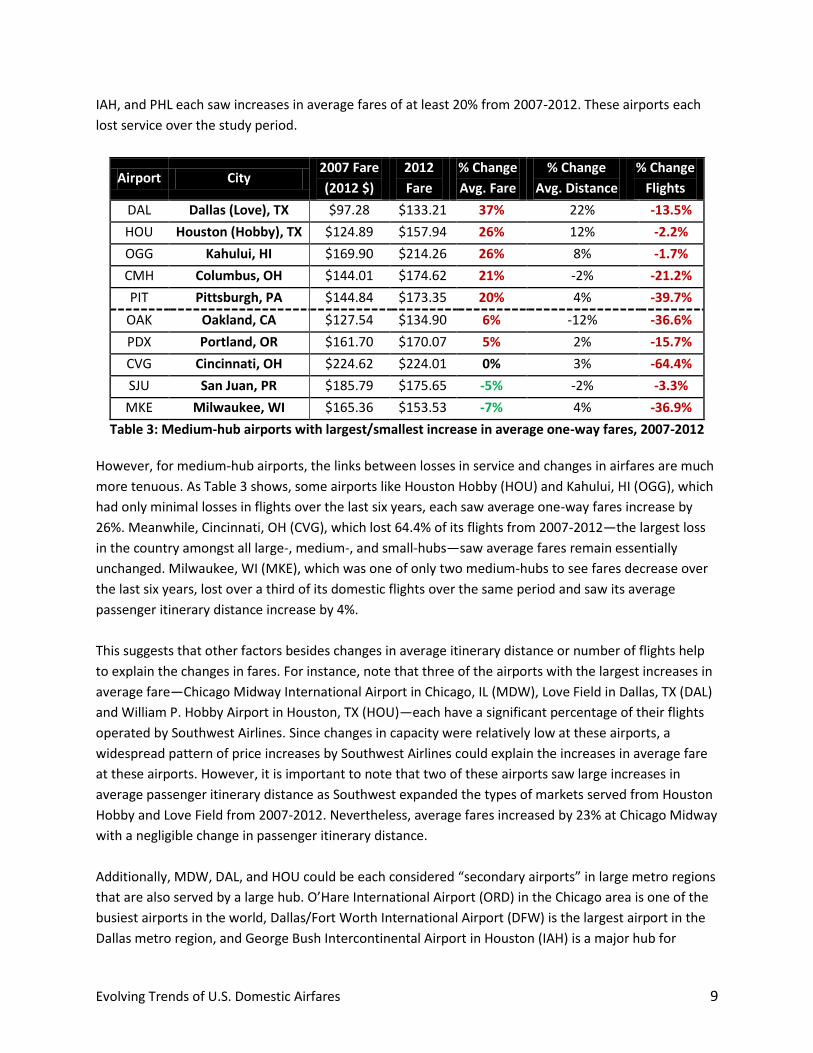
However, for medium-hub airports, the links between losses in service and changes in airfares are much
more tenuous. As Table 3 shows, some airports like Houston Hobby (HOU) and Kahului, HI (OGG), which
had only minimal losses in flights over the last six years, each saw average one-way fares increase by
26%. Meanwhile, Cincinnati, OH (CVG), which lost 64.4% of its flights from 2007-2012—the largest loss
in the country amongst all large-, medium-, and small-hubs—saw average fares remain essentially
unchanged. Milwaukee, WI (MKE), which was one of only two medium-hubs to see fares decrease over
the last six years, lost over a third of its domestic flights over the same period and saw its average
passenger itinerary distance increase by 4%.
This suggests that other factors besides changes in average itinerary distance or number of flights help
to explain the changes in fares. For instance, note that three of the airports with the largest increases in
average fare—Chicago Midway International Airport in Chicago, IL (MDW), Love Field in Dallas, TX (DAL)
and William P. Hobby Airport in Houston, TX (HOU)—each have a significant percentage of their flights
operated by Southwest Airlines. Since changes in capacity were relatively low at these airports, a
widespread pattern of price increases by Southwest Airlines could explain the increases in average fare
at these airports. However, it is important to note that two of these airports saw large increases in
average passenger itinerary distance as Southwest expanded the types of markets served from Houston
Hobby and Love Field from 2007-2012. Nevertheless, average fares increased by 23% at Chicago Midway
with a negligible change in passenger itinerary distance.
Additionally, MDW, DAL, and HOU could be each considered “secondary airports” in large metro regions
that are also served by a large hub. O’Hare International Airport (ORD) in the Chicago area is one of the
busiest airports in the world, Dallas/Fort Worth International Airport (DFW) is the largest airport in the
Dallas metro region, and George Bush Intercontinental Airport in Houston (IAH) is a major hub for
Evolving Trends of U.S. Domestic Airfares 10
United Airlines that is also classified as a large hub by the FAA. In each case, a large-hub airport in the
metro region saw fares increase by a smaller percentage than the secondary airport(s) in the region.
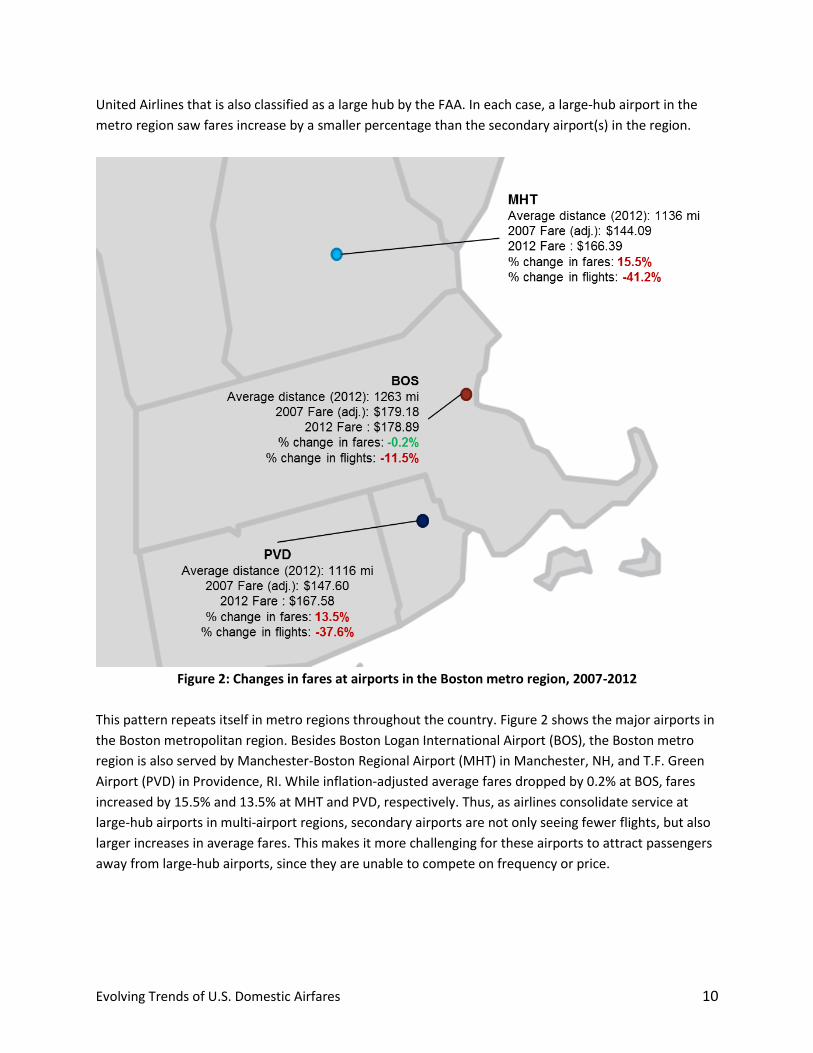
Figure 2: Changes in fares at airports in the Boston metro region, 2007-2012
This pattern repeats itself in metro regions throughout the country. Figure 2 shows the major airports in
the Boston metropolitan region. Besides Boston Logan International Airport (BOS), the Boston metro
region is also served by Manchester-Boston Regional Airport (MHT) in Manchester, NH, and T.F. Green
Airport (PVD) in Providence, RI. While inflation-adjusted average fares dropped by 0.2% at BOS, fares
increased by 15.5% and 13.5% at MHT and PVD, respectively. Thus, as airlines consolidate service at
large-hub airports in multi-airport regions, secondary airports are not only seeing fewer flights, but also
larger increases in average fares. This makes it more challenging for these airports to attract passengers
away from large-hub airports, since they are unable to compete on frequency or price.
Evolving Trends of U.S. Domestic Airfares 11
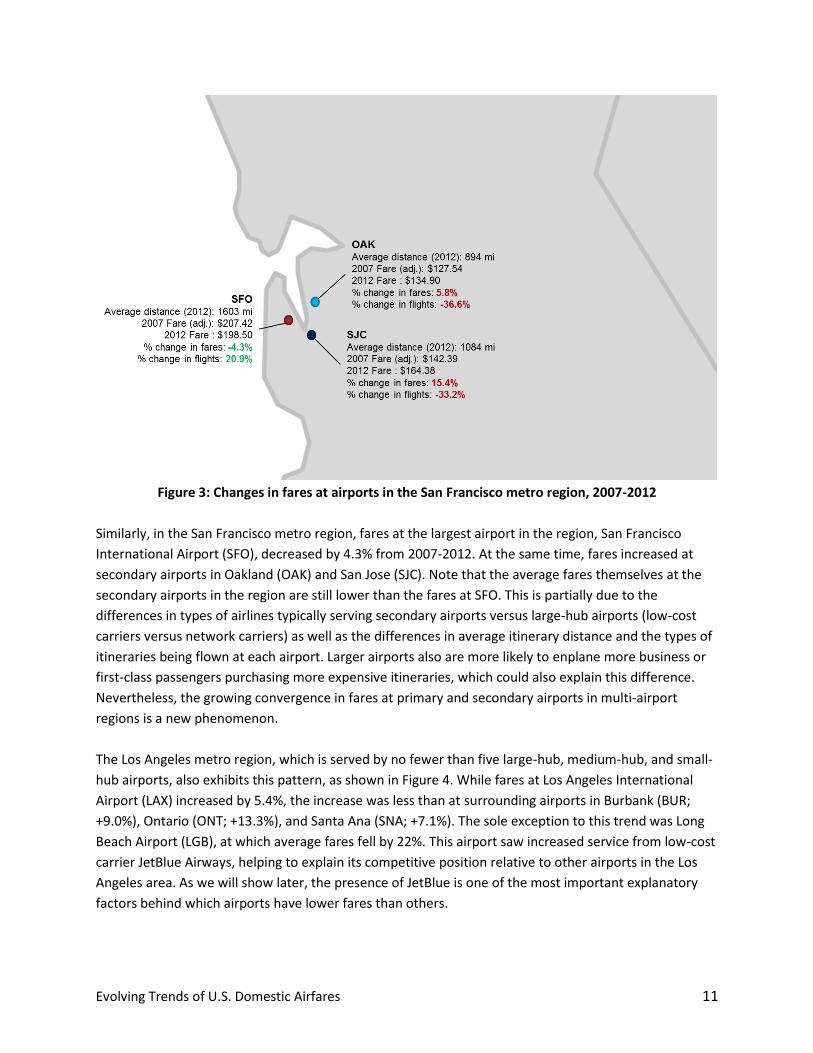
Figure 3: Changes in fares at airports in the San Francisco metro region, 2007-2012
Similarly, in the San Francisco metro region, fares at the largest airport in the region, San Francisco
International Airport (SFO), decreased by 4.3% from 2007-2012. At the same time, fares increased at
secondary airports in Oakland (OAK) and San Jose (SJC). Note that the average fares themselves at the
secondary airports in the region are still lower than the fares at SFO. This is partially due to the
differences in types of airlines typically serving secondary airports versus large-hub airports (low-cost
carriers versus network carriers) as well as the differences in average itinerary distance and the types of
itineraries being flown at each airport. Larger airports also are more likely to enplane more business or
first-class passengers purchasing more expensive itineraries, which could also explain this difference.
Nevertheless, the growing convergence in fares at primary and secondary airports in multi-airport
regions is a new phenomenon.
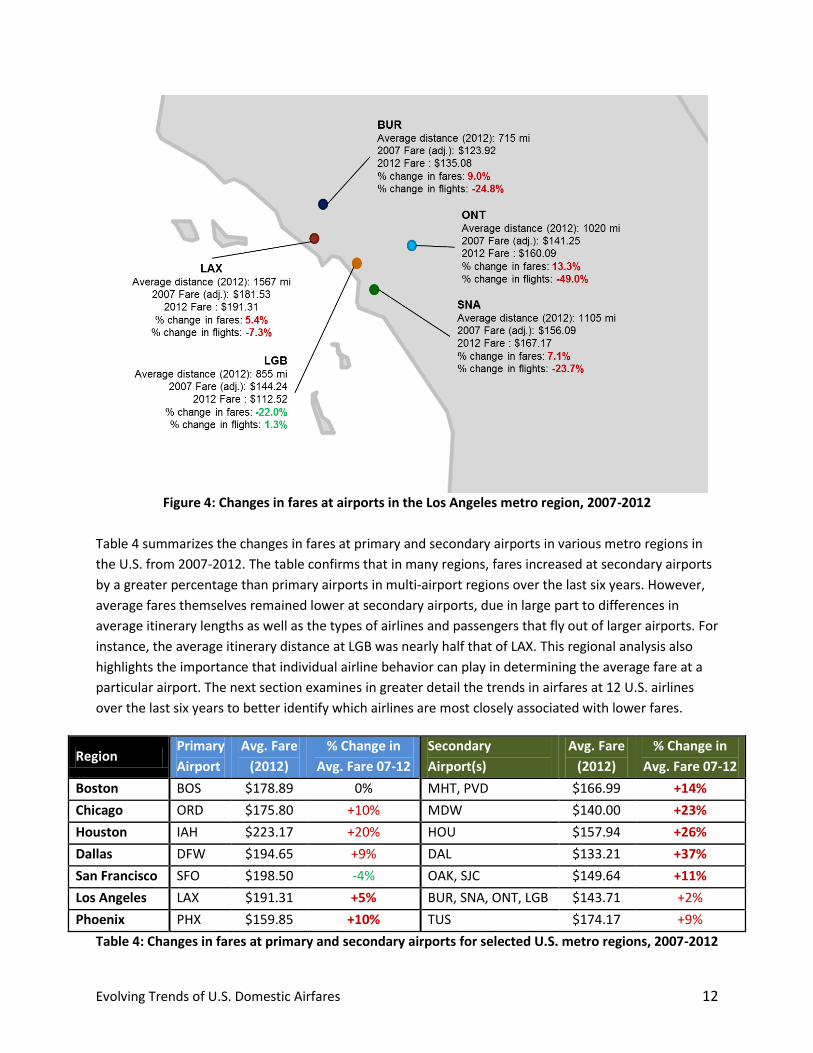
The Los Angeles metro region, which is served by no fewer than five large-hub, medium-hub, and small-
hub airports, also exhibits this pattern, as shown in Figure 4. While fares at Los Angeles International
Airport (LAX) increased by 5.4%, the increase was less than at surrounding airports in Burbank (BUR;
+9.0%), Ontario (ONT; +13.3%), and Santa Ana (SNA; +7.1%). The sole exception to this trend was Long
Beach Airport (LGB), at which average fares fell by 22%. This airport saw increased service from low-cost
carrier JetBlue Airways, helping to explain its competitive position relative to other airports in the Los
Angeles area. As we will show later, the presence of JetBlue is one of the most important explanatory
factors behind which airports have lower fares than others.
Evolving Trends of U.S. Domestic Airfares 12
Figure 4: Changes in fares at airports in the Los Angeles metro region, 2007-2012
Table 4 summarizes the changes in fares at primary and secondary airports in various metro regions in
the U.S. from 2007-2012. The table confirms that in many regions, fares increased at secondary airports
by a greater percentage than primary airports in multi-airport regions over the last six years. However,
average fares themselves remained lower at secondary airports, due in large part to differences in
average itinerary lengths as well as the types of airlines and passengers that fly out of larger airports. For
instance, the average itinerary distance at LGB was nearly half that of LAX. This regional analysis also
highlights the importance that individual airline behavior can play in determining the average fare at a
particular airport. The next section examines in greater detail the trends in airfares at 12 U.S. airlines
over the last six years to better identify which airlines are most closely associated with lower fares.
Region Primary
Airport
Avg. Fare
(2012)
% Change in
Avg. Fare 07-12
Secondary
Airport(s)
Avg. Fare
(2012)
% Change in
Avg. Fare 07-12
Boston BOS $178.89 0% MHT, PVD $166.99 +14%
Chicago ORD $175.80 +10% MDW $140.00 +23%
Houston IAH $223.17 +20% HOU $157.94 +26%
Dallas DFW $194.65 +9% DAL $133.21 +37%
San Francisco SFO $198.50 -4% OAK, SJC $149.64 +11%
Los Angeles LAX $191.31 +5% BUR, SNA, ONT, LGB $143.71 +2%
Phoenix PHX $159.85 +10% TUS $174.17 +9%
Table 4: Changes in fares at primary and secondary airports for selected U.S. metro regions, 2007-2012
Evolving Trends of U.S. Domestic Airfares 13
Trends in Average Domestic Fares at Major U.S. Carriers
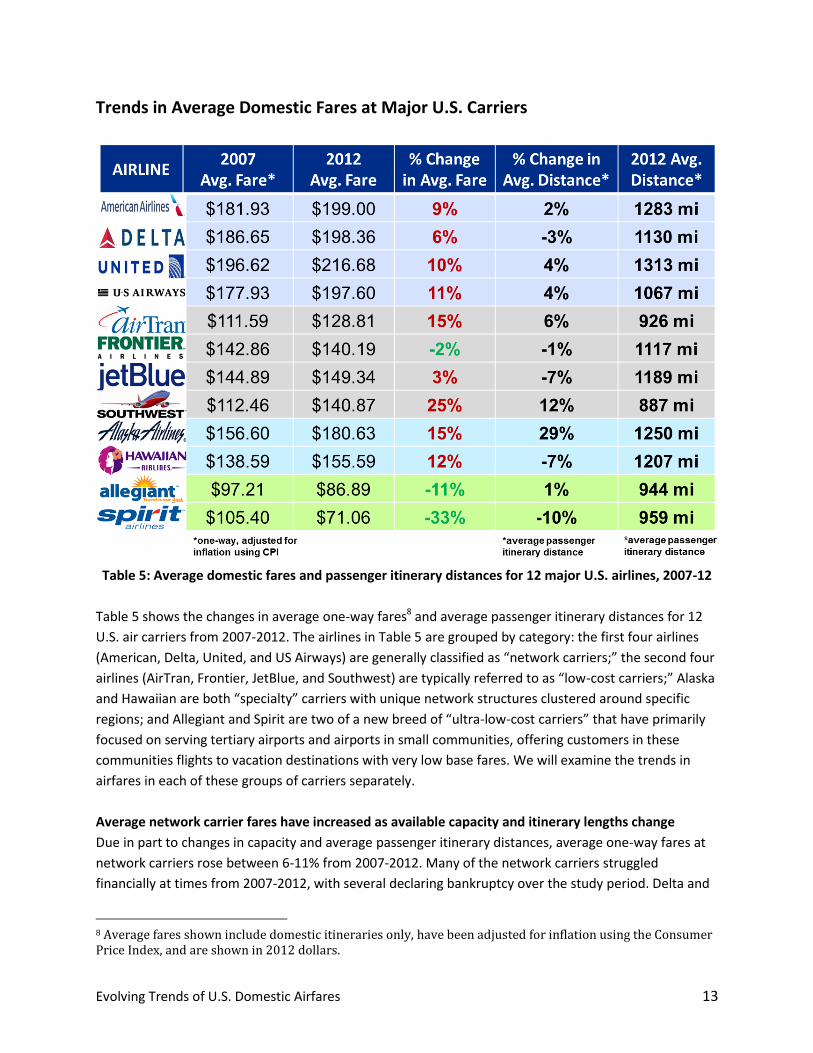
Table 5: Average domestic fares and passenger itinerary distances for 12 major U.S. airlines, 2007-12
Table 5 shows the changes in average one-way fares8 and average passenger itinerary distances for 12
U.S. air carriers from 2007-2012. The airlines in Table 5 are grouped by category: the first four airlines
(American, Delta, United, and US Airways) are generally classified as “network carriers;” the second four
airlines (AirTran, Frontier, JetBlue, and Southwest) are typically referred to as “low-cost carriers;” Alaska
and Hawaiian are both “specialty” carriers with unique network structures clustered around specific
regions; and Allegiant and Spirit are two of a new breed of “ultra-low-cost carriers” that have primarily
focused on serving tertiary airports and airports in small communities, offering customers in these
communities flights to vacation destinations with very low base fares. We will examine the trends in
airfares in each of these groups of carriers separately.
Average network carrier fares have increased as available capacity and itinerary lengths change
Due in part to changes in capacity and average passenger itinerary distances, average one-way fares at
network carriers rose between 6-11% from 2007-2012. Many of the network carriers struggled
financially at times from 2007-2012, with several declaring bankruptcy over the study period. Delta and
8 Average fares shown include domestic itineraries only, have been adjusted for inflation using the Consumer Price Index, and are shown in 2012 dollars.
Evolving Trends of U.S. Domestic Airfares 14
United both completed mergers with other iconic network carriers; American and US Airways proposed
to merge in 2013.
These carriers emerged from this tumultuous period of bankruptcy and mergers with leaner operations
and reduced frequencies across their networks. The network carriers have continued to keep capacity
low over the last several years as they practice a disciplined capacity management strategy that
emphasizes flying profitable routes over gaining market share. As capacity is reduced, increases in
average fares have less of an adverse effect on load factors. This strategy has led the network carriers to
post their first consistent profits in nearly a decade. For these reasons, the increases in average fares
seen at the network carriers from 2007-2012 can largely be attributed to the effects of capacity
discipline strategies and to the differences in these carriers’ networks following a round of mergers.
Low-cost carriers aren’t quite as low-cost for passengers any more
The types of domestic flights flown by network carriers—a mix of short-haul regional service and long-
haul transcontinental options—differ from the service provided by low-cost carriers—a significant
portion of which involves travel to leisure destinations. Hence, it is not surprising that the average fares
of low-cost carriers have remained at least 25% lower than network carriers. Yet despite this, several of
the low-cost carriers saw dramatic increases in their average one-way fares over the last six years.
Average fares increased at AirTran Airways, which was acquired by Southwest Airlines in 2011, by about
15% from 2007-2012. Southwest Airlines itself saw an increase in average fares of 25% over the same
period. Meanwhile, average fares at JetBlue Airways increased by just 3% over the last six years.
There are several possible explanations for Southwest Airlines’ significant increase in average fares.
Southwest itself practiced some capacity discipline over the last six years, particularly in smaller and
mid-sized airports. Southwest cut scheduled domestic flights by 10% at smaller airports in the U.S. from
2007-2012; if there is indeed a link between cuts in service and increases in fares (as economic theory
would predict), this could explain why some smaller airports dominated by Southwest Airlines, such as
Dallas Love Field (DAL) and Houston Hobby (HOU), saw large increases in average fares coupled with
deep cuts in service over the study period.
The last six years have also seen dramatic changes in Southwest’s well-established network strategy. In
the 1990s and early-2000s, Southwest found a niche in operating point-to-point flights from secondary
airports in multi-airport regions, often at lower fares than could be found at primary airports in those
regions. However, over the last six years, Southwest has started to move into those same larger airports
that it had previously forsaken. Southwest has moved into Boston Logan (BOS), New York-LaGuardia
(LGA), and Newark Liberty International Airport (EWR) over the last six years, and it now serves 23 of the
29 largest airports in the United States. Its merger with AirTran Airways will give the combined airline a
larger presence at Hartsfield-Jackson Atlanta International Airport (ATL)—the busiest airport in the
United States by passenger enplanements.
Moving into larger airports could have increased Southwest’s costs. Larger airports are more likely to be
congested, leading to more costs in delays and cancellations. On the other hand, larger airports are
Evolving Trends of U.S. Domestic Airfares 15
more likely to attract business passengers, who often have a higher willingness-to-pay for airline tickets.
Either or both of these factors could have given Southwest leverage to raise average fares. Southwest’s
operating costs may have also increased for other reasons. The advantages from the airline’s famous
fuel hedge have evaporated with constantly high fuel prices, and the seniority levels of the airline’s
employees have started to increase, requiring higher pay and retirement benefits. These increases in
operating costs could have also led to Southwest’s increase in average fares.
Finally, it is worth noting that Southwest, unlike its network carrier competition, does not rely on
checked baggage fees as a source of ancillary revenue. It is possible that Southwest could have raised its
base fares to make up for the lost revenue potential of offering free checked baggage. However, JetBlue
Airways, which also does not charge fees for checked baggage, had only a modest increase in its average
fares in the last six years.
Whatever the reason for Southwest’s increase in average fare, low-cost carriers are starting to behave
more like traditional network carriers. As their brands and their workforces both become more mature,
the LCCs have entered into larger markets at slightly higher average fares. While the low-cost carriers
are not quite as low-cost for passengers any more, we do not expect to see a complete convergence in
fares at network carriers and low-cost carriers. LCCs still offer lower fares to passengers in many
markets, and we expect that these carriers will continue to maintain unique networks with a heavy
focus on leisure travel in the next decade—this alone will continue to keep the average fares at these
carriers lower than at the network carriers.
Specialty carriers are adjusting fares as their networks change
Airline analysts often have difficulty classifying Alaska Airlines and Hawaiian Airlines. Both airlines serve
a targeted area of the United States that remains relatively unserved by other carriers. Traditionally,
Alaska and Hawaiian generally provided a mix of short-haul service linking together small communities
and long-haul service connecting the rest of the United States to hubs in Seattle and Honolulu.
However, these airlines—Alaska in particular—have started to change their networks over the last six
years. Alaska’s average itinerary distance increased by 29% from 2007-2012, reflecting a new
commitment to longer-haul service. The airline has bolstered its presence at Seattle-Tacoma
International Airport (SEA) while also building new cross-country service. As a result of these longer
itinerary distances and stage lengths, Alaska’s average one-way fares have increased by 15%. Hawaiian’s
fares have risen by 12% over the study period, but its average itinerary distance has fallen by 7% as it
has cut unprofitable long-haul service to focus more on inter-island and international service. We should
expect to see further adjustments in fares from these carriers as their networks continue to change over
the next decade.
A new breed of ultra-low-cost carriers is picking up where the traditional LCCs left off
The latter half of the 2000s saw the emergence of a new breed of low-cost airlines with a very different
business model than that of the “traditional” low-cost carriers. These carriers, such as Allegiant Air,
Spirit Airlines, Sun Country Airlines, and others, focused on providing infrequent service to tertiary
Evolving Trends of U.S. Domestic Airfares 16
airports in multi-airport regions, or to airports at which there was no currently existing commercial air
service. At these airports, the “ultra-low-cost” carriers stepped in to provide service to vacation
destinations at heavily discounted base fares, often packaging a flight with a hotel, rental car, or
vacation package. Flights to the smallest airports in these airlines’ networks may only be operated a few
times per week.
Allegiant Air and Spirit Airlines have been two of the most successful ultra-low-cost carriers. Targeting
an exclusively leisure audience, we would expect that their average fares to be lower than network
carriers or even the existing low-cost carriers, which do serve some business routes. Indeed, average
fares at LCCs were nearly twice as high as ULCC fares in 2012; average network carrier fares were nearly
three times as high as ULCC fares in the same year. Additionally, while network carriers, LCCs, and
specialty carriers alike were all increasing average fares from 2007-2012, fares at ULCCs decreased over
the study period by as much as 33%.
While the decreases in base fares at the ULCCs are impressive, it is important to note that these fare
decreases occurred at the same time as these carriers started to rely more on ancillary revenues as a
significant portion of the full travel price. That is, while the base fare of a ULCC ticket is often very low,
passengers may need to pay additional fees to check-in, check bags, access customer service personnel,
or even carry-on a bag on some airlines. Hence, looking only at the base fare may present a skewed
picture of the total passenger cost on ULCCs if ancillary fees are not taken into account.
Data on ancillary revenues is currently collected and defined inconsistently and not tied to individual
itineraries. That is, we currently do not know how much an average Spirit Airlines passenger pays in
ancillary services. Adding ancillary fees to average fares would assist in making apples-to-apples
comparisons in total passenger itinerary cost between the ULCCs and other airlines. Absent that data,
however, we are only able to make comparisons of base fares alone.
The ultra-low-cost carriers have unabashedly targeted extremely price sensitive passengers. Spirit
Airlines CEO Ben Baldanza has suggested that these customers are likely to choose his airline repeatedly
if it offers the lowest base fare, even if passengers have to pay substantially more in additional ancillary
fees.9 The business model of Spirit is still relatively new and its sustainability remains to be seen, but
both Spirit and Allegiant Air have experienced robust financial success, even in challenging periods for
airline profitability. However, these airlines’ pricing strategies and competitive advantages could be
eroded if consumer advocates succeed in passing legislation to require airlines to display full costs of
travel—base fares and ancillary fees combined—on popular distribution systems and travel booking
websites.
9 Maxon, T. 2013. “Spirit Airlines CEO: We have the lowest prices, and that’s what customers care about.” Dallas Morning News. May 22 2013.
Evolving Trends of U.S. Domestic Airfares 17
Determinants of Average Fares at U.S. Airports—the Effects of LCCs
Since the rise of the low-cost and low-fare carriers in the late 1990s and early 2000s, researchers have
been interested in identifying the effects of these carriers on average airfares. Most early work focused
on the largest and most popular low-cost carrier: Southwest Airlines. Specifically, researchers were
interested in investigating whether the presence of low-cost carriers like Southwest Airlines has a
dampening effect on the fares on a given route.
Past research on the “Southwest effect” has shown that either direct competition (competition on the
same route) or adjacent competition (competition in a city-pair market between alternative airports in a
multi-airport region) by Southwest Airlines tends to be associated with an increase in traffic on that
route and a decrease in average fare. That is, once Southwest Airlines enters a market directly or
adjacently, existing network carriers typically lower their fares to match Southwest’s lower prices.10
However, with Southwest Airlines’ average fares increasing by 25% from 2007 to 2012, it is unclear
whether Southwest still holds the same degree of price leadership as it once did. Recent work by bin
Salam and McMullen11 found that the Southwest effect had weakened between 2005 and 2010 in
markets in which mergers had occurred between network carriers, such as United-Continental or Delta-
Northwest. That is, the presence of Southwest Airlines on merger-affected routes did less to lower
average fares than previous research would have suggested. Since the competitive effects of Southwest
on network carrier airfares are often used by merger advocates as an argument in antitrust reviews, bin
Salam and McMullen question whether Southwest can still be relied upon as a protection against
monopolistic competition on air travel routes.
Meanwhile, the effects of other low-cost carriers like JetBlue Airways and the impacts of ultra-low-cost
carriers like Allegiant Air and Spirit Airlines on airfares have not been explored individually in detail.
While these airlines have smaller route networks than Southwest Airlines, they are important players in
the U.S. air transportation system, particularly at smaller airports. This section investigates whether the
presence of these low-cost carriers at U.S. airports reduces average fares at those airports, and how
those effects have changed over time. We will also explore the effects of capacity discipline on average
airfares, and examine if there is a statistically significant link between changes in capacity and changes in
fares.
10 Studies investigating the Southwest effect include: Morrison, S.J. 2001. Actual, adjacent, and potential competition: Estimating the full effect of Southwest Airlines. Journal of Transport Economics and Policy 35(2).23-256; Vowles, T.M. 2001. The “Southwest Effect” in Multi-Airport Regions. Journal of Air Transport Management 7(4). 251-258; Goolsbee, A. and C. Syverson. 2008. How Do Incumbents Respond to the Threat of Entry? Evidence from the Major Airlines. Quarterly Journal of Economics 123(4). 1611-1633; Hofer, C., R.J. Windle, and M.E. Dresner. 2008. Price premiums and low-cost carrier competition. Transportation Research Part E 44(5). 864-882; and Brueckner, J.K., D. Lee, and E.S. Singer. 2012. Airfare competition and domestic US airfares: A comprehensive reappraisal. Economics of Transportation 2(1). 1-17. 11 bin Salam, S. and B.S. McMullen. 2013. Is There Still a Southwest Effect? Transportation Research Record: Journal of the Transportation Research Board 2025. 1-8.
Evolving Trends of U.S. Domestic Airfares 18
Econometric model
Following the research approaches of previous work, we will use a simple econometric model to identify
the effects of LCC competition on average one-way airfares at U.S. airports. In this case, the econometric
model is a linear equation that allows us to isolate the effects of one or more independent variables
(e.g., LCC competition and other airport characteristics) on a dependent variable (in this case, the
average airfare at an airport). Using statistical techniques, we can test whether the coefficients of this
linear equation are significantly different from zero (or not) at a given level of confidence. If an
independent variable’s coefficient is significantly different from zero, we can conclude that there is a
relationship between the independent variable and the dependent variable. Otherwise, no such
conclusion can be drawn.
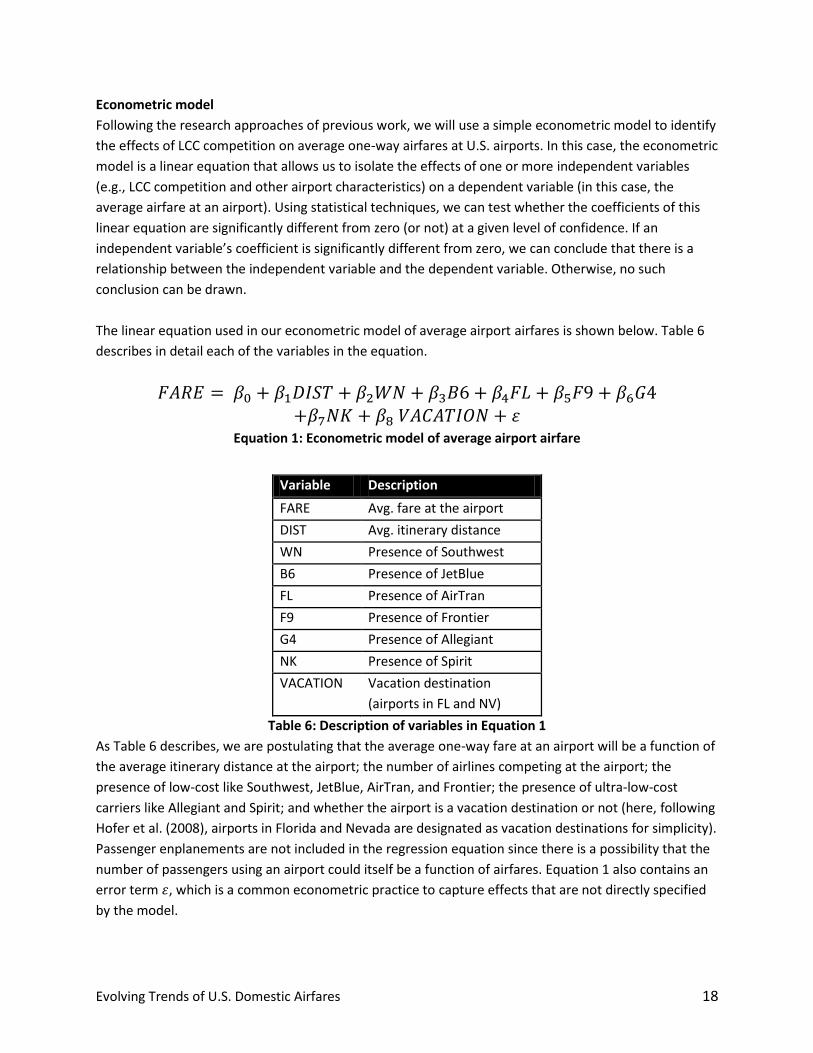
The linear equation used in our econometric model of average airport airfares is shown below. Table 6
describes in detail each of the variables in the equation.
Equation 1: Econometric model of average airport airfare
Variable Description
FARE Avg. fare at the airport
DIST Avg. itinerary distance
WN Presence of Southwest
B6 Presence of JetBlue
FL Presence of AirTran
F9 Presence of Frontier
G4 Presence of Allegiant
NK Presence of Spirit
VACATION Vacation destination
(airports in FL and NV)
Table 6: Description of variables in Equation 1
As Table 6 describes, we are postulating that the average one-way fare at an airport will be a function of
the average itinerary distance at the airport; the number of airlines competing at the airport; the
presence of low-cost like Southwest, JetBlue, AirTran, and Frontier; the presence of ultra-low-cost
carriers like Allegiant and Spirit; and whether the airport is a vacation destination or not (here, following
Hofer et al. (2008), airports in Florida and Nevada are designated as vacation destinations for simplicity).
Passenger enplanements are not included in the regression equation since there is a possibility that the
number of passengers using an airport could itself be a function of airfares. Equation 1 also contains an
error term , which is a common econometric practice to capture effects that are not directly specified
by the model.
Evolving Trends of U.S. Domestic Airfares 19
Data on average fares, itinerary distances, and airlines providing service were gathered from Diio Mi for
445 U.S. airports for the years 2007 and 2012. We estimated the coefficients of Equation 1 for each of
these years, allowing us to see how the effects of Southwest or other low-cost or ultra-low-cost carriers
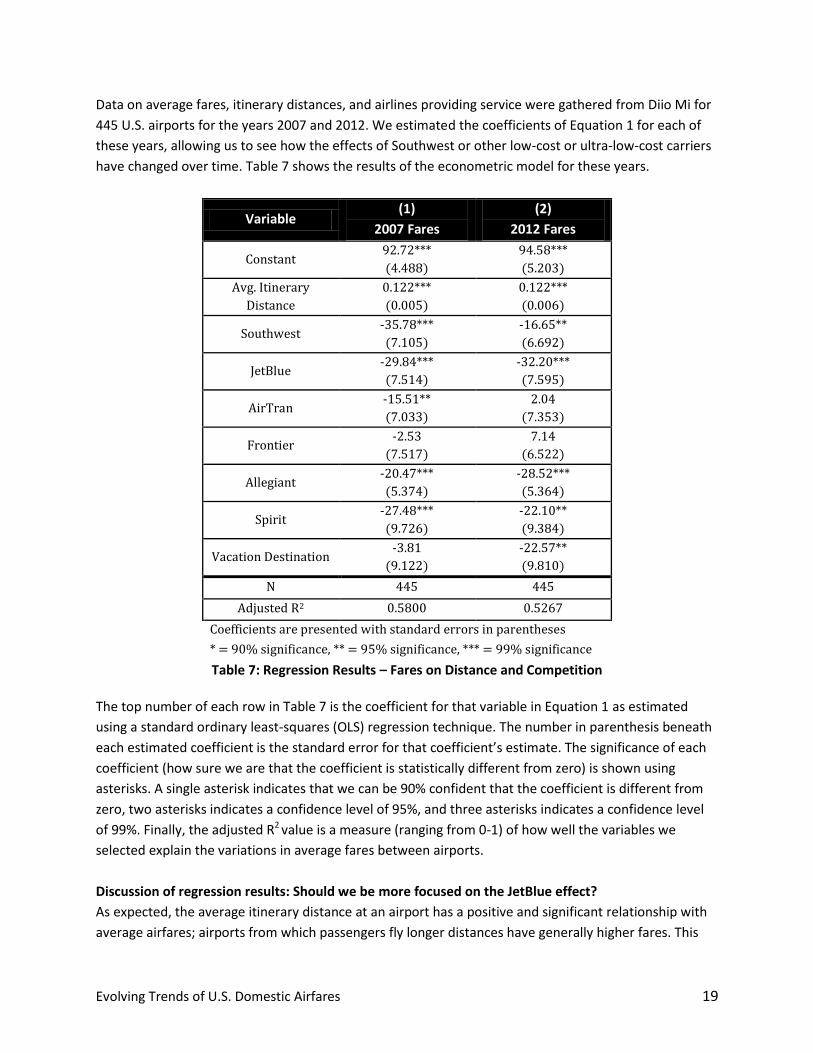
have changed over time. Table 7 shows the results of the econometric model for these years.
Variable (1)
2007 Fares
(2)
2012 Fares
Constant 92.72***
(4.488)
94.58***
(5.203)
Avg. Itinerary
Distance
0.122***
(0.005)
0.122***
(0.006)
Southwest -35.78***
(7.105)
-16.65**
(6.692)
JetBlue -29.84***
(7.514)
-32.20***
(7.595)
AirTran -15.51**
(7.033)
2.04
(7.353)
Frontier -2.53
(7.517)
7.14
(6.522)
Allegiant -20.47***
(5.374)
-28.52***
(5.364)
Spirit -27.48***
(9.726)
-22.10**
(9.384)
Vacation Destination -3.81
(9.122)
-22.57**
(9.810)
N 445 445
Adjusted R2 0.5800 0.5267
Coefficients are presented with standard errors in parentheses
* = 90% significance, ** = 95% significance, *** = 99% significance
Table 7: Regression Results – Fares on Distance and Competition
The top number of each row in Table 7 is the coefficient for that variable in Equation 1 as estimated
using a standard ordinary least-squares (OLS) regression technique. The number in parenthesis beneath
each estimated coefficient is the standard error for that coefficient’s estimate. The significance of each
coefficient (how sure we are that the coefficient is statistically different from zero) is shown using
asterisks. A single asterisk indicates that we can be 90% confident that the coefficient is different from
zero, two asterisks indicates a confidence level of 95%, and three asterisks indicates a confidence level
of 99%. Finally, the adjusted R2 value is a measure (ranging from 0-1) of how well the variables we
selected explain the variations in average fares between airports.
Discussion of regression results: Should we be more focused on the JetBlue effect?
As expected, the average itinerary distance at an airport has a positive and significant relationship with
average airfares; airports from which passengers fly longer distances have generally higher fares. This
Evolving Trends of U.S. Domestic Airfares 20
relationship has remained essentially unchanged over time. It is also interesting to note that while the
number of airlines that provide service at a given airport did not have a significant relationship with
airfares in 2012, the presence of specific competitors is associated with lower average airfares. The
presence of an LCC like Southwest, JetBlue, Allegiant, or Spirit is associated with a decrease in average
one-way fare of between $15-$36, depending on the airline and the year and controlling for distance
and other airport characteristics.12 However, the presence of AirTran and Frontier no longer have a
significant effect on average one-way fares once other LCC competition is taken into account.
In 2007, the Southwest effect was highly significant. The presence of Southwest Airlines at an airport in
2007 was associated with a decrease that airport’s average fare of about $36, controlling for average
itinerary distance and other competition. However, by 2012, that effect had declined to about $17. That
is, the presence of Southwest Airlines no longer is associated with as much of a reduction in average
airport fares as has been previously shown by other researchers. Indeed, the presence of some other
low-cost carriers now outpaces the Southwest effect. In 2012, the presence of JetBlue Airways reduced
average one-way airport fares by about $32, Allegiant Air service reduced average one-way airport fares
by about $29, and the presence of Spirit reduced average one-way fares by about $22.
JetBlue is now the airline whose presence is associated with the largest decrease in average fares. As
such, we would not be surprised to see airports, particularly small community airports or secondary
airports in large multi-airport regions, work particularly hard to attract JetBlue service. Gaining service
from an airline like JetBlue not only attracts customers through a decrease in average fare, but also
through an increase in connectivity and the number of destinations that can be reached through both
non-stop and connecting service. As Southwest begins to focus its expansion efforts internationally
instead of domestically, we would expect the “JetBlue effect” to become part of the business
development and academic lexicon surrounding low-cost carriers.
On the other hand, the recently diminished nature of the Southwest effect is not surprising given the
scale of Southwest’s fare increases over the last six years. It should be noted, however, that Southwest
Airlines does not charge fees for checked baggage, as opposed to many of its competitors who charge
upwards of $25 for a checked bag.13 It is possible that Southwest decided to raise base fares in lieu of
charging bag fees in an attempt to separate themselves from competing airlines.
On the other end of the spectrum, Allegiant Air and Spirit Airlines have chosen strategies of offering the
lowest possible base fare and gaining a large portion of revenue through ancillary sources. While
passengers often see only the base fares when selecting which ticket to purchase, the ULCCs are offering
a fundamentally different service coupled with their base fare as opposed to the “full-service” LCCs like
Southwest and JetBlue, which offer free checked baggage, on-board amenities, and other features.
12 We also tested if an airport’s designation as a hub for a network carrier and/or an LCC had an effect on average one-way airfares at that airport; this variable was found to be insignificant in all years and was removed from the model. 13 As of July 2013, Southwest Airlines offered two free checked bags, JetBlue Airways offered one free checked bag, and Allegiant Air and Spirit Airlines both charged for checked baggage.
Evolving Trends of U.S. Domestic Airfares 21
Therefore, it may not be appropriate to directly compare the “Southwest effect” with the “Spirit effect,”
given that these two airlines are offering different packages of products and services as part of their
base fares.
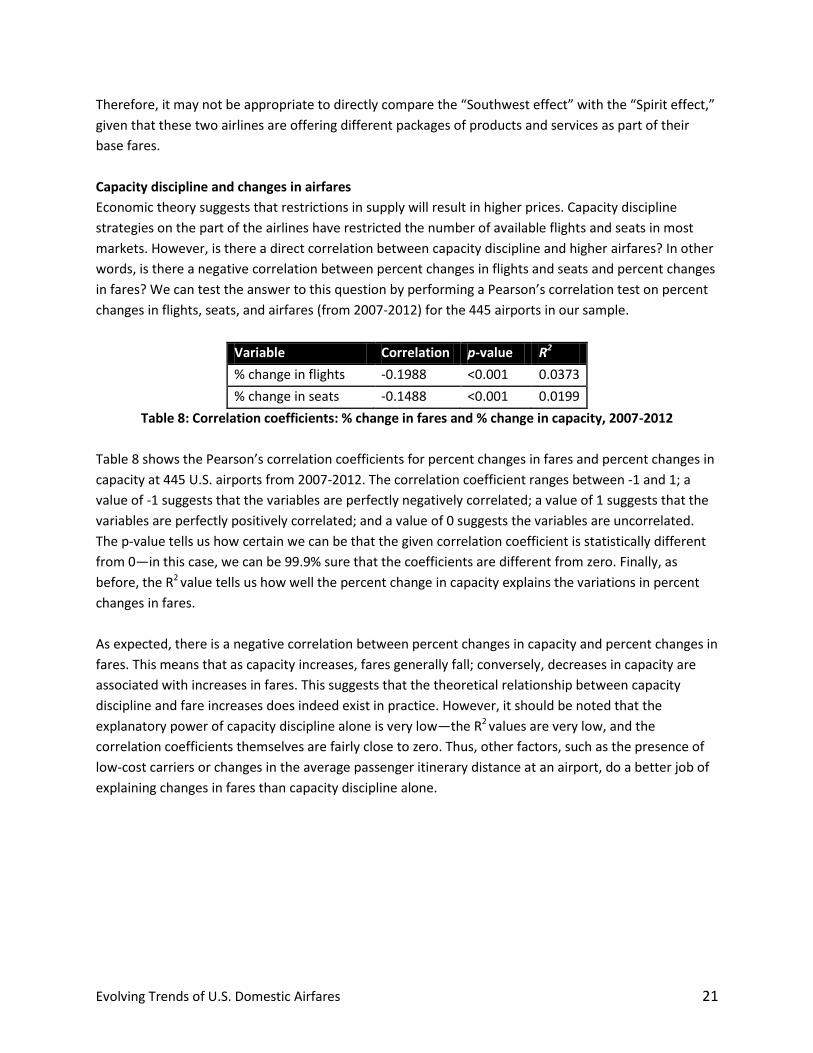
Capacity discipline and changes in airfares
Economic theory suggests that restrictions in supply will result in higher prices. Capacity discipline
strategies on the part of the airlines have restricted the number of available flights and seats in most
markets. However, is there a direct correlation between capacity discipline and higher airfares? In other
words, is there a negative correlation between percent changes in flights and seats and percent changes
in fares? We can test the answer to this question by performing a Pearson’s correlation test on percent
changes in flights, seats, and airfares (from 2007-2012) for the 445 airports in our sample.
Variable Correlation p-value R2
% change in flights -0.1988 <0.001 0.0373
% change in seats -0.1488 <0.001 0.0199
Table 8: Correlation coefficients: % change in fares and % change in capacity, 2007-2012
Table 8 shows the Pearson’s correlation coefficients for percent changes in fares and percent changes in
capacity at 445 U.S. airports from 2007-2012. The correlation coefficient ranges between -1 and 1; a
value of -1 suggests that the variables are perfectly negatively correlated; a value of 1 suggests that the
variables are perfectly positively correlated; and a value of 0 suggests the variables are uncorrelated.
The p-value tells us how certain we can be that the given correlation coefficient is statistically different
from 0—in this case, we can be 99.9% sure that the coefficients are different from zero. Finally, as
before, the R2 value tells us how well the percent change in capacity explains the variations in percent
changes in fares.
As expected, there is a negative correlation between percent changes in capacity and percent changes in
fares. This means that as capacity increases, fares generally fall; conversely, decreases in capacity are
associated with increases in fares. This suggests that the theoretical relationship between capacity
discipline and fare increases does indeed exist in practice. However, it should be noted that the
explanatory power of capacity discipline alone is very low—the R2 values are very low, and the
correlation coefficients themselves are fairly close to zero. Thus, other factors, such as the presence of
low-cost carriers or changes in the average passenger itinerary distance at an airport, do a better job of
explaining changes in fares than capacity discipline alone.
Evolving Trends of U.S. Domestic Airfares 22
Conclusion: Future Changes in Airfares in an Environment of Capacity Discipline
There is no evidence that the current airline strategy of capacity discipline will be reversed in the near
future. Airlines are experiencing profitability for the first time in years, and the equilibrium in which
each of the largest airlines continues to keep capacity low (compared to historical levels and growth in
GDP) seems to be stable in the short run. In the long run, an airline could deviate from the capacity
discipline equilibrium in an attempt to gain market share—this theoretical increase of capacity would
likely be associated with lower fares, particularly if other airlines match this strategy. Meanwhile, we
should expect JetBlue Airways and the ultra-low-cost carriers to continue their pattern of steady growth.
If the levels of available domestic capacity follow the trends described above, we would expect average
one-way domestic airfares to remain flat or increase slightly over the next five years, assuming that
there is no shock to the price of fuel or another local or global economic downturn. In this scenario,
major airlines would keep capacity at current levels (without cutting it further), and base fares would
remain level as airlines continue their shift to ancillary revenues to bolster earnings. The growth of
JetBlue and the other ULCCs could result in even lower average fares at airports served by these airlines.
Should it be approved, the merger of American Airlines and US Airways will bring about further
consolidation of the U.S. air transportation industry and could result in some capacity being removed
from the system. As economic theory and our analysis suggests, a reduction in available capacity could
result in higher fares in some markets. Our work and the work of others suggest that it is unclear
whether low-cost carrier competition will temper the upward pressures of capacity discipline and
mergers on prices; the Southwest effect has diminished in past years, although the effects of carriers
like JetBlue, Allegiant, and Spirit on average one-way fares at U.S. airports remain strong.
At smaller airports and secondary airports in multi-airport regions, increases or decreases in average
airfares will likely continue to outpace the changes at larger airports. These airports will face increasing
pressure to obtain service from low-cost or ultra-low-cost carriers—as network carriers continue to exit
smaller airports, those airports that have not implemented a contingency plan to replace this service
with LCC or ULCC flights could see average fares rise as daily departures fall. This is a challenging
combination for a smaller airport, as passengers will often choose to fly out of a nearby larger airport to
take advantage of lower fares and more flight options, even if this means a significant drive from the
passenger’s origin point. We have already started to see this pattern take hold in some metro areas at
which average fares increased substantially more at secondary airports than at primary airports.
Finally, the total system impact of this continued consolidation of flights and connectivity at large hubs,
coupled with a growing convergence in fares between primary and secondary airports, will be important
to monitor. Risks of congestion and flight delays increase as passengers and departures cluster at larger
airports. If current trends of consolidation continue and result in future growth in traffic at large-hub
airports, improved air traffic management approaches may be necessary to avoid costly periods of
increased delays in the National Airspace System.
Evolving Trends of U.S. Domestic Airfares 23
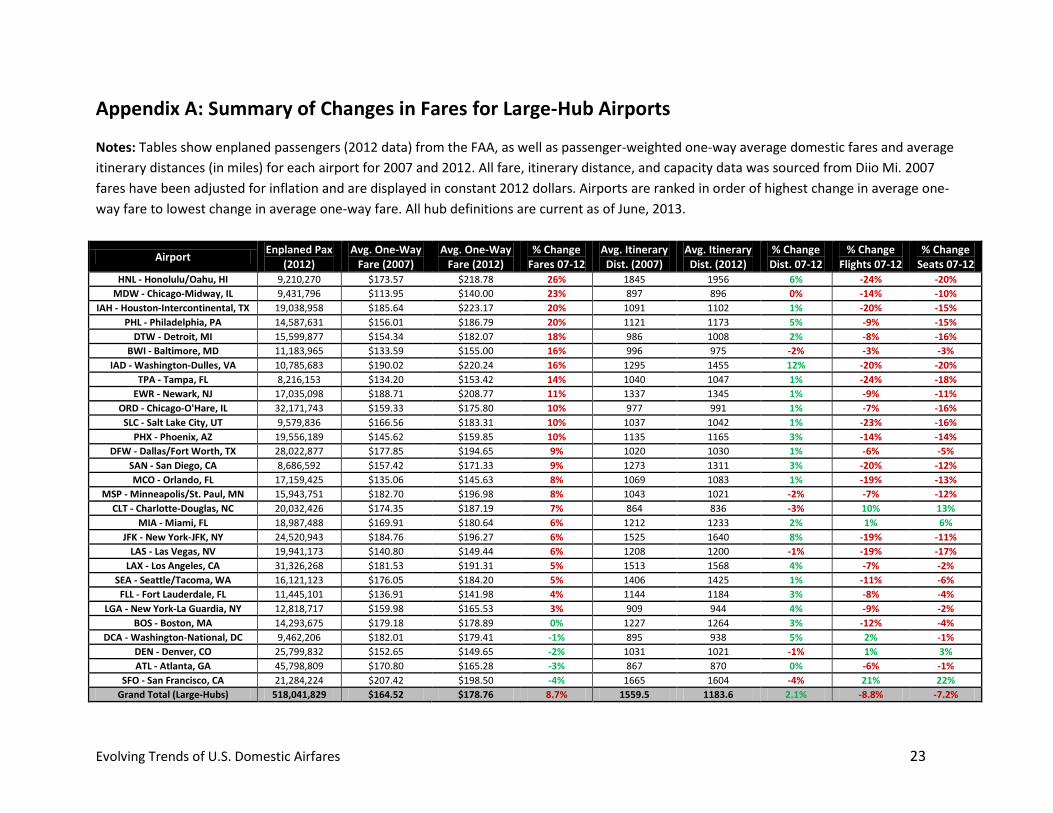
Appendix A: Summary of Changes in Fares for Large-Hub Airports
Notes: Tables show enplaned passengers (2012 data) from the FAA, as well as passenger-weighted one-way average domestic fares and average
itinerary distances (in miles) for each airport for 2007 and 2012. All fare, itinerary distance, and capacity data was sourced from Diio Mi. 2007
fares have been adjusted for inflation and are displayed in constant 2012 dollars. Airports are ranked in order of highest change in average one-
way fare to lowest change in average one-way fare. All hub definitions are current as of June, 2013.
Airport Enplaned Pax
(2012) Avg. One-Way
Fare (2007) Avg. One-Way
Fare (2012) % Change
Fares 07-12 Avg. Itinerary Dist. (2007)
Avg. Itinerary Dist. (2012)
% Change Dist. 07-12
% Change Flights 07-12
% Change Seats 07-12
HNL - Honolulu/Oahu, HI 9,210,270 $173.57 $218.78 26% 1845 1956 6% -24% -20%
MDW - Chicago-Midway, IL 9,431,796 $113.95 $140.00 23% 897 896 0% -14% -10%
IAH - Houston-Intercontinental, TX 19,038,958 $185.64 $223.17 20% 1091 1102 1% -20% -15%
PHL - Philadelphia, PA 14,587,631 $156.01 $186.79 20% 1121 1173 5% -9% -15%
DTW - Detroit, MI 15,599,877 $154.34 $182.07 18% 986 1008 2% -8% -16%
BWI - Baltimore, MD 11,183,965 $133.59 $155.00 16% 996 975 -2% -3% -3%
IAD - Washington-Dulles, VA 10,785,683 $190.02 $220.24 16% 1295 1455 12% -20% -20%
TPA - Tampa, FL 8,216,153 $134.20 $153.42 14% 1040 1047 1% -24% -18%
EWR - Newark, NJ 17,035,098 $188.71 $208.77 11% 1337 1345 1% -9% -11%
ORD - Chicago-O'Hare, IL 32,171,743 $159.33 $175.80 10% 977 991 1% -7% -16%
SLC - Salt Lake City, UT 9,579,836 $166.56 $183.31 10% 1037 1042 1% -23% -16%
PHX - Phoenix, AZ 19,556,189 $145.62 $159.85 10% 1135 1165 3% -14% -14%
DFW - Dallas/Fort Worth, TX 28,022,877 $177.85 $194.65 9% 1020 1030 1% -6% -5%
SAN - San Diego, CA 8,686,592 $157.42 $171.33 9% 1273 1311 3% -20% -12%
MCO - Orlando, FL 17,159,425 $135.06 $145.63 8% 1069 1083 1% -19% -13%
MSP - Minneapolis/St. Paul, MN 15,943,751 $182.70 $196.98 8% 1043 1021 -2% -7% -12%
CLT - Charlotte-Douglas, NC 20,032,426 $174.35 $187.19 7% 864 836 -3% 10% 13%
MIA - Miami, FL 18,987,488 $169.91 $180.64 6% 1212 1233 2% 1% 6%
JFK - New York-JFK, NY 24,520,943 $184.76 $196.27 6% 1525 1640 8% -19% -11%
LAS - Las Vegas, NV 19,941,173 $140.80 $149.44 6% 1208 1200 -1% -19% -17%
LAX - Los Angeles, CA 31,326,268 $181.53 $191.31 5% 1513 1568 4% -7% -2%
SEA - Seattle/Tacoma, WA 16,121,123 $176.05 $184.20 5% 1406 1425 1% -11% -6%
FLL - Fort Lauderdale, FL 11,445,101 $136.91 $141.98 4% 1144 1184 3% -8% -4%
LGA - New York-La Guardia, NY 12,818,717 $159.98 $165.53 3% 909 944 4% -9% -2%
BOS - Boston, MA 14,293,675 $179.18 $178.89 0% 1227 1264 3% -12% -4%
DCA - Washington-National, DC 9,462,206 $182.01 $179.41 -1% 895 938 5% 2% -1%
DEN - Denver, CO 25,799,832 $152.65 $149.65 -2% 1031 1021 -1% 1% 3%
ATL - Atlanta, GA 45,798,809 $170.80 $165.28 -3% 867 870 0% -6% -1%
SFO - San Francisco, CA 21,284,224 $207.42 $198.50 -4% 1665 1604 -4% 21% 22%
Grand Total (Large-Hubs) 518,041,829 $164.52 $178.76 8.7% 1559.5 1183.6 2.1% -8.8% -7.2%
Evolving Trends of U.S. Domestic Airfares 24
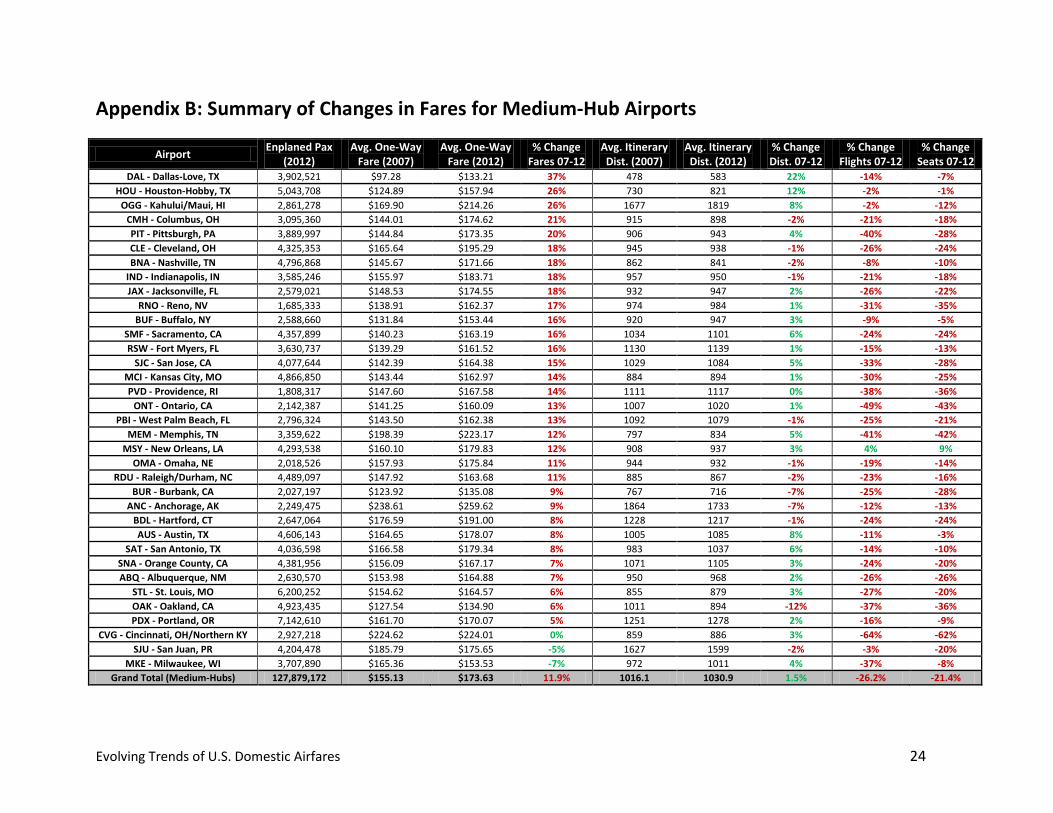
Appendix B: Summary of Changes in Fares for Medium-Hub Airports
Airport Enplaned Pax
(2012) Avg. One-Way
Fare (2007) Avg. One-Way
Fare (2012) % Change
Fares 07-12 Avg. Itinerary Dist. (2007)
Avg. Itinerary Dist. (2012)
% Change Dist. 07-12
% Change Flights 07-12
% Change Seats 07-12
DAL - Dallas-Love, TX 3,902,521 $97.28 $133.21 37% 478 583 22% -14% -7%
HOU - Houston-Hobby, TX 5,043,708 $124.89 $157.94 26% 730 821 12% -2% -1%
OGG - Kahului/Maui, HI 2,861,278 $169.90 $214.26 26% 1677 1819 8% -2% -12%
CMH - Columbus, OH 3,095,360 $144.01 $174.62 21% 915 898 -2% -21% -18%
PIT - Pittsburgh, PA 3,889,997 $144.84 $173.35 20% 906 943 4% -40% -28%
CLE - Cleveland, OH 4,325,353 $165.64 $195.29 18% 945 938 -1% -26% -24%
BNA - Nashville, TN 4,796,868 $145.67 $171.66 18% 862 841 -2% -8% -10%
IND - Indianapolis, IN 3,585,246 $155.97 $183.71 18% 957 950 -1% -21% -18%
JAX - Jacksonville, FL 2,579,021 $148.53 $174.55 18% 932 947 2% -26% -22%
RNO - Reno, NV 1,685,333 $138.91 $162.37 17% 974 984 1% -31% -35%
BUF - Buffalo, NY 2,588,660 $131.84 $153.44 16% 920 947 3% -9% -5%
SMF - Sacramento, CA 4,357,899 $140.23 $163.19 16% 1034 1101 6% -24% -24%
RSW - Fort Myers, FL 3,630,737 $139.29 $161.52 16% 1130 1139 1% -15% -13%
SJC - San Jose, CA 4,077,644 $142.39 $164.38 15% 1029 1084 5% -33% -28%
MCI - Kansas City, MO 4,866,850 $143.44 $162.97 14% 884 894 1% -30% -25%
PVD - Providence, RI 1,808,317 $147.60 $167.58 14% 1111 1117 0% -38% -36%
ONT - Ontario, CA 2,142,387 $141.25 $160.09 13% 1007 1020 1% -49% -43%
PBI - West Palm Beach, FL 2,796,324 $143.50 $162.38 13% 1092 1079 -1% -25% -21%
MEM - Memphis, TN 3,359,622 $198.39 $223.17 12% 797 834 5% -41% -42%
MSY - New Orleans, LA 4,293,538 $160.10 $179.83 12% 908 937 3% 4% 9%
OMA - Omaha, NE 2,018,526 $157.93 $175.84 11% 944 932 -1% -19% -14%
RDU - Raleigh/Durham, NC 4,489,097 $147.92 $163.68 11% 885 867 -2% -23% -16%
BUR - Burbank, CA 2,027,197 $123.92 $135.08 9% 767 716 -7% -25% -28%
ANC - Anchorage, AK 2,249,475 $238.61 $259.62 9% 1864 1733 -7% -12% -13%
BDL - Hartford, CT 2,647,064 $176.59 $191.00 8% 1228 1217 -1% -24% -24%
AUS - Austin, TX 4,606,143 $164.65 $178.07 8% 1005 1085 8% -11% -3%
SAT - San Antonio, TX 4,036,598 $166.58 $179.34 8% 983 1037 6% -14% -10%
SNA - Orange County, CA 4,381,956 $156.09 $167.17 7% 1071 1105 3% -24% -20%
ABQ - Albuquerque, NM 2,630,570 $153.98 $164.88 7% 950 968 2% -26% -26%
STL - St. Louis, MO 6,200,252 $154.62 $164.57 6% 855 879 3% -27% -20%
OAK - Oakland, CA 4,923,435 $127.54 $134.90 6% 1011 894 -12% -37% -36%
PDX - Portland, OR 7,142,610 $161.70 $170.07 5% 1251 1278 2% -16% -9%
CVG - Cincinnati, OH/Northern KY 2,927,218 $224.62 $224.01 0% 859 886 3% -64% -62%
SJU - San Juan, PR 4,204,478 $185.79 $175.65 -5% 1627 1599 -2% -3% -20%
MKE - Milwaukee, WI 3,707,890 $165.36 $153.53 -7% 972 1011 4% -37% -8%
Grand Total (Medium-Hubs) 127,879,172 $155.13 $173.63 11.9% 1016.1 1030.9 1.5% -26.2% -21.4%
Evolving Trends of U.S. Domestic Airfares 25
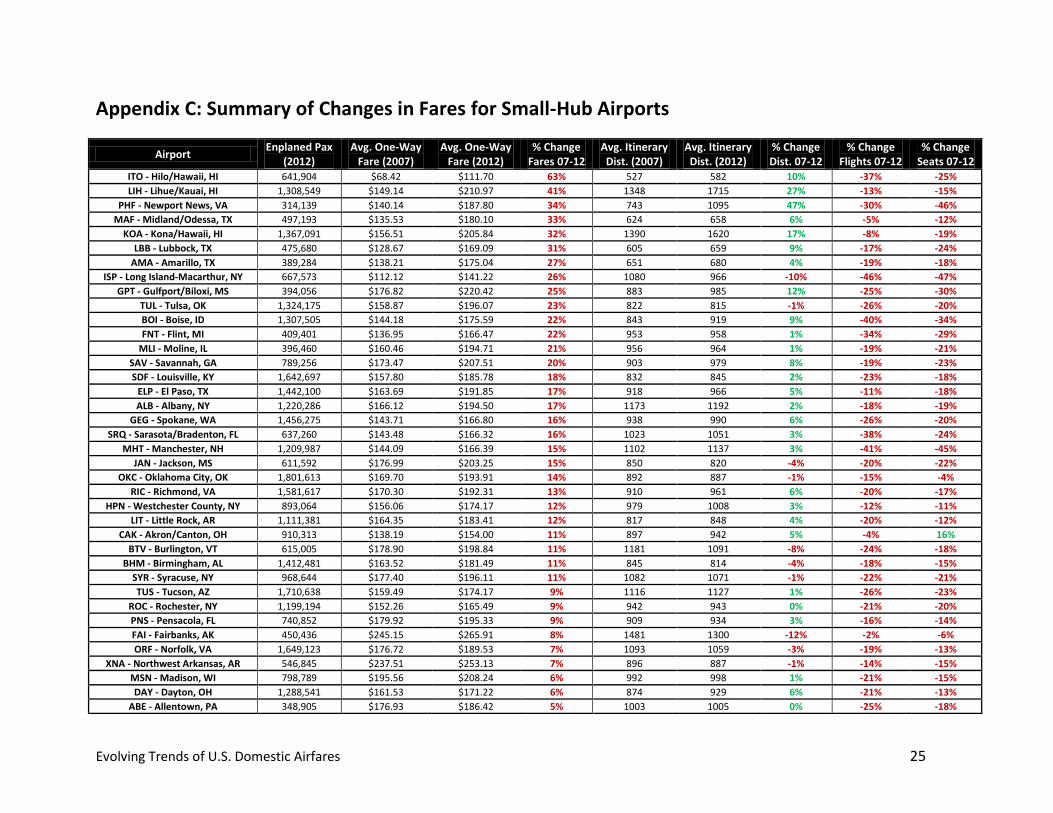
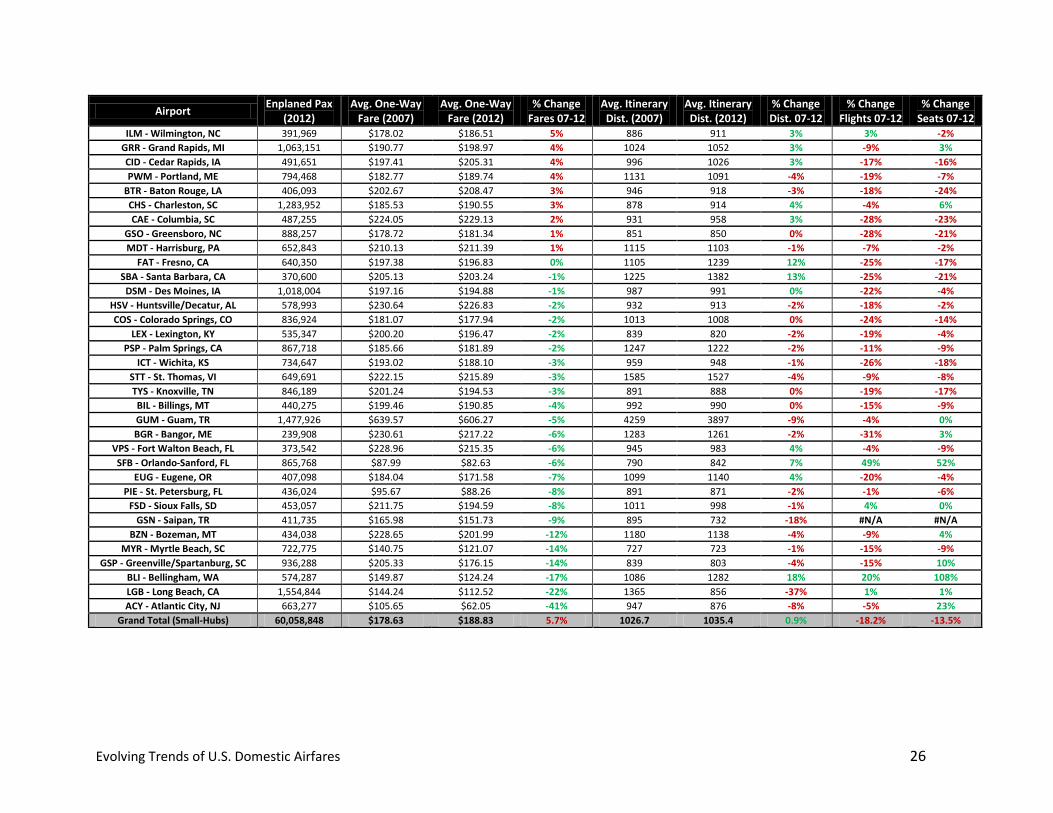
Appendix C: Summary of Changes in Fares for Small-Hub Airports
Airport Enplaned Pax
(2012) Avg. One-Way
Fare (2007) Avg. One-Way
Fare (2012) % Change
Fares 07-12 Avg. Itinerary Dist. (2007)
Avg. Itinerary Dist. (2012)
% Change Dist. 07-12
% Change Flights 07-12
% Change Seats 07-12
ITO - Hilo/Hawaii, HI 641,904 $68.42 $111.70 63% 527 582 10% -37% -25%
LIH - Lihue/Kauai, HI 1,308,549 $149.14 $210.97 41% 1348 1715 27% -13% -15%
PHF - Newport News, VA 314,139 $140.14 $187.80 34% 743 1095 47% -30% -46%
MAF - Midland/Odessa, TX 497,193 $135.53 $180.10 33% 624 658 6% -5% -12%
KOA - Kona/Hawaii, HI 1,367,091 $156.51 $205.84 32% 1390 1620 17% -8% -19%
LBB - Lubbock, TX 475,680 $128.67 $169.09 31% 605 659 9% -17% -24%
AMA - Amarillo, TX 389,284 $138.21 $175.04 27% 651 680 4% -19% -18%
ISP - Long Island-Macarthur, NY 667,573 $112.12 $141.22 26% 1080 966 -10% -46% -47%
GPT - Gulfport/Biloxi, MS 394,056 $176.82 $220.42 25% 883 985 12% -25% -30%
TUL - Tulsa, OK 1,324,175 $158.87 $196.07 23% 822 815 -1% -26% -20%
BOI - Boise, ID 1,307,505 $144.18 $175.59 22% 843 919 9% -40% -34%
FNT - Flint, MI 409,401 $136.95 $166.47 22% 953 958 1% -34% -29%
MLI - Moline, IL 396,460 $160.46 $194.71 21% 956 964 1% -19% -21%
SAV - Savannah, GA 789,256 $173.47 $207.51 20% 903 979 8% -19% -23%
SDF - Louisville, KY 1,642,697 $157.80 $185.78 18% 832 845 2% -23% -18%
ELP - El Paso, TX 1,442,100 $163.69 $191.85 17% 918 966 5% -11% -18%
ALB - Albany, NY 1,220,286 $166.12 $194.50 17% 1173 1192 2% -18% -19%
GEG - Spokane, WA 1,456,275 $143.71 $166.80 16% 938 990 6% -26% -20%
SRQ - Sarasota/Bradenton, FL 637,260 $143.48 $166.32 16% 1023 1051 3% -38% -24%
MHT - Manchester, NH 1,209,987 $144.09 $166.39 15% 1102 1137 3% -41% -45%
JAN - Jackson, MS 611,592 $176.99 $203.25 15% 850 820 -4% -20% -22%
OKC - Oklahoma City, OK 1,801,613 $169.70 $193.91 14% 892 887 -1% -15% -4%
RIC - Richmond, VA 1,581,617 $170.30 $192.31 13% 910 961 6% -20% -17%
HPN - Westchester County, NY 893,064 $156.06 $174.17 12% 979 1008 3% -12% -11%
LIT - Little Rock, AR 1,111,381 $164.35 $183.41 12% 817 848 4% -20% -12%
CAK - Akron/Canton, OH 910,313 $138.19 $154.00 11% 897 942 5% -4% 16%
BTV - Burlington, VT 615,005 $178.90 $198.84 11% 1181 1091 -8% -24% -18%
BHM - Birmingham, AL 1,412,481 $163.52 $181.49 11% 845 814 -4% -18% -15%
SYR - Syracuse, NY 968,644 $177.40 $196.11 11% 1082 1071 -1% -22% -21%
TUS - Tucson, AZ 1,710,638 $159.49 $174.17 9% 1116 1127 1% -26% -23%
ROC - Rochester, NY 1,199,194 $152.26 $165.49 9% 942 943 0% -21% -20%
PNS - Pensacola, FL 740,852 $179.92 $195.33 9% 909 934 3% -16% -14%
FAI - Fairbanks, AK 450,436 $245.15 $265.91 8% 1481 1300 -12% -2% -6%
ORF - Norfolk, VA 1,649,123 $176.72 $189.53 7% 1093 1059 -3% -19% -13%
XNA - Northwest Arkansas, AR 546,845 $237.51 $253.13 7% 896 887 -1% -14% -15%
MSN - Madison, WI 798,789 $195.56 $208.24 6% 992 998 1% -21% -15%
DAY - Dayton, OH 1,288,541 $161.53 $171.22 6% 874 929 6% -21% -13%
ABE - Allentown, PA 348,905 $176.93 $186.42 5% 1003 1005 0% -25% -18%
Evolving Trends of U.S. Domestic Airfares 26
Airport Enplaned Pax
(2012)
Avg. One-Way Fare (2007)
Avg. One-Way Fare (2012)
% Change Fares 07-12
Avg. Itinerary Dist. (2007)
Avg. Itinerary Dist. (2012)
% Change Dist. 07-12
% Change Flights 07-12
% Change Seats 07-12
ILM - Wilmington, NC 391,969 $178.02 $186.51 5% 886 911 3% 3% -2%
GRR - Grand Rapids, MI 1,063,151 $190.77 $198.97 4% 1024 1052 3% -9% 3%
CID - Cedar Rapids, IA 491,651 $197.41 $205.31 4% 996 1026 3% -17% -16%
PWM - Portland, ME 794,468 $182.77 $189.74 4% 1131 1091 -4% -19% -7%
BTR - Baton Rouge, LA 406,093 $202.67 $208.47 3% 946 918 -3% -18% -24%
CHS - Charleston, SC 1,283,952 $185.53 $190.55 3% 878 914 4% -4% 6%
CAE - Columbia, SC 487,255 $224.05 $229.13 2% 931 958 3% -28% -23%
GSO - Greensboro, NC 888,257 $178.72 $181.34 1% 851 850 0% -28% -21%
MDT - Harrisburg, PA 652,843 $210.13 $211.39 1% 1115 1103 -1% -7% -2%
FAT - Fresno, CA 640,350 $197.38 $196.83 0% 1105 1239 12% -25% -17%
SBA - Santa Barbara, CA 370,600 $205.13 $203.24 -1% 1225 1382 13% -25% -21%
DSM - Des Moines, IA 1,018,004 $197.16 $194.88 -1% 987 991 0% -22% -4%
HSV - Huntsville/Decatur, AL 578,993 $230.64 $226.83 -2% 932 913 -2% -18% -2%
COS - Colorado Springs, CO 836,924 $181.07 $177.94 -2% 1013 1008 0% -24% -14%
LEX - Lexington, KY 535,347 $200.20 $196.47 -2% 839 820 -2% -19% -4%
PSP - Palm Springs, CA 867,718 $185.66 $181.89 -2% 1247 1222 -2% -11% -9%
ICT - Wichita, KS 734,647 $193.02 $188.10 -3% 959 948 -1% -26% -18%
STT - St. Thomas, VI 649,691 $222.15 $215.89 -3% 1585 1527 -4% -9% -8%
TYS - Knoxville, TN 846,189 $201.24 $194.53 -3% 891 888 0% -19% -17%
BIL - Billings, MT 440,275 $199.46 $190.85 -4% 992 990 0% -15% -9%
GUM - Guam, TR 1,477,926 $639.57 $606.27 -5% 4259 3897 -9% -4% 0%
BGR - Bangor, ME 239,908 $230.61 $217.22 -6% 1283 1261 -2% -31% 3%
VPS - Fort Walton Beach, FL 373,542 $228.96 $215.35 -6% 945 983 4% -4% -9%
SFB - Orlando-Sanford, FL 865,768 $87.99 $82.63 -6% 790 842 7% 49% 52%
EUG - Eugene, OR 407,098 $184.04 $171.58 -7% 1099 1140 4% -20% -4%
PIE - St. Petersburg, FL 436,024 $95.67 $88.26 -8% 891 871 -2% -1% -6%
FSD - Sioux Falls, SD 453,057 $211.75 $194.59 -8% 1011 998 -1% 4% 0%
GSN - Saipan, TR 411,735 $165.98 $151.73 -9% 895 732 -18% #N/A #N/A
BZN - Bozeman, MT 434,038 $228.65 $201.99 -12% 1180 1138 -4% -9% 4%
MYR - Myrtle Beach, SC 722,775 $140.75 $121.07 -14% 727 723 -1% -15% -9%
GSP - Greenville/Spartanburg, SC 936,288 $205.33 $176.15 -14% 839 803 -4% -15% 10%
BLI - Bellingham, WA 574,287 $149.87 $124.24 -17% 1086 1282 18% 20% 108%
LGB - Long Beach, CA 1,554,844 $144.24 $112.52 -22% 1365 856 -37% 1% 1%
ACY - Atlantic City, NJ 663,277 $105.65 $62.05 -41% 947 876 -8% -5% 23%
Grand Total (Small-Hubs) 60,058,848 $178.63 $188.83 5.7% 1026.7 1035.4 0.9% -18.2% -13.5%
Evolving Trends of U.S. Domestic Airfares 27
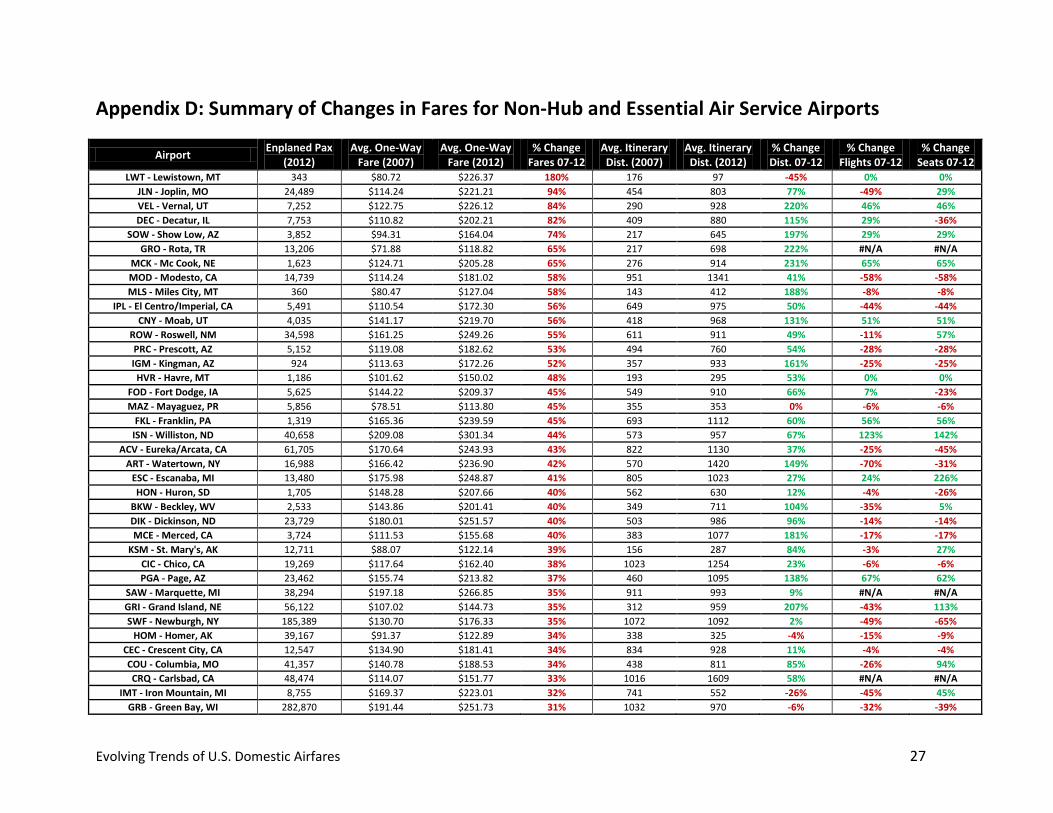
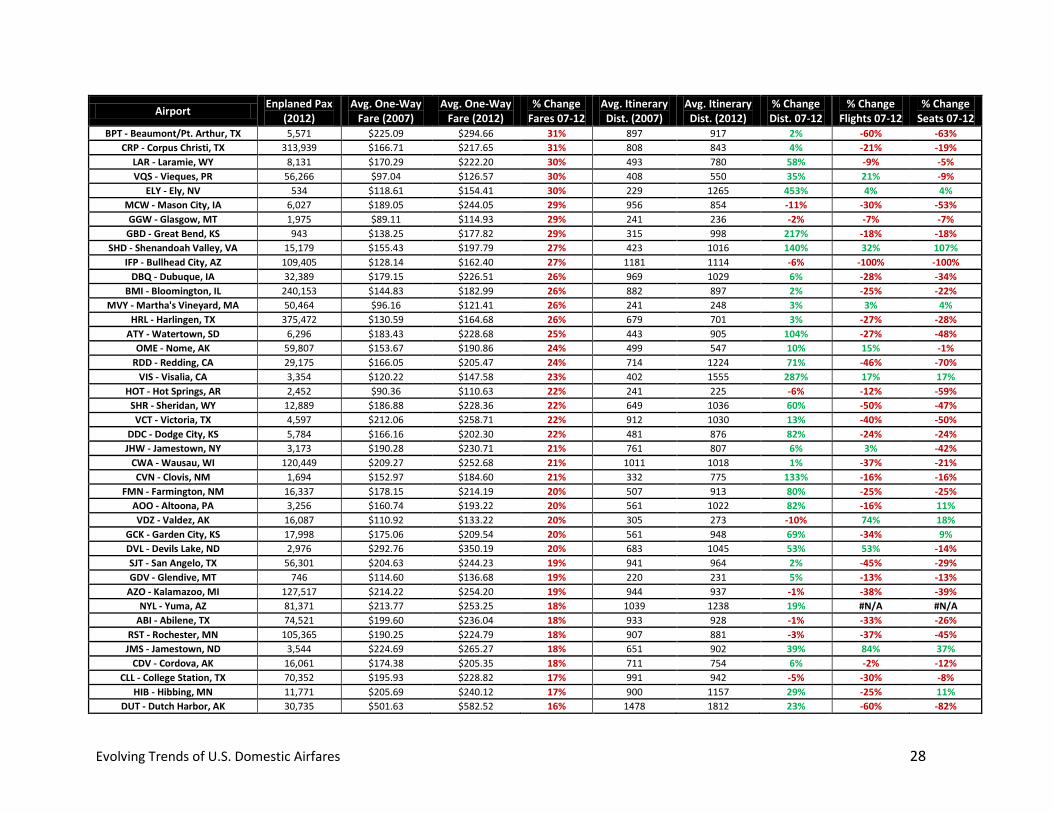
Appendix D: Summary of Changes in Fares for Non-Hub and Essential Air Service Airports
Airport Enplaned Pax
(2012) Avg. One-Way
Fare (2007) Avg. One-Way
Fare (2012) % Change
Fares 07-12 Avg. Itinerary Dist. (2007)
Avg. Itinerary Dist. (2012)
% Change Dist. 07-12
% Change Flights 07-12
% Change Seats 07-12
LWT - Lewistown, MT 343 $80.72 $226.37 180% 176 97 -45% 0% 0%
JLN - Joplin, MO 24,489 $114.24 $221.21 94% 454 803 77% -49% 29%
VEL - Vernal, UT 7,252 $122.75 $226.12 84% 290 928 220% 46% 46%
DEC - Decatur, IL 7,753 $110.82 $202.21 82% 409 880 115% 29% -36%
SOW - Show Low, AZ 3,852 $94.31 $164.04 74% 217 645 197% 29% 29%
GRO - Rota, TR 13,206 $71.88 $118.82 65% 217 698 222% #N/A #N/A
MCK - Mc Cook, NE 1,623 $124.71 $205.28 65% 276 914 231% 65% 65%
MOD - Modesto, CA 14,739 $114.24 $181.02 58% 951 1341 41% -58% -58%
MLS - Miles City, MT 360 $80.47 $127.04 58% 143 412 188% -8% -8%
IPL - El Centro/Imperial, CA 5,491 $110.54 $172.30 56% 649 975 50% -44% -44%
CNY - Moab, UT 4,035 $141.17 $219.70 56% 418 968 131% 51% 51%
ROW - Roswell, NM 34,598 $161.25 $249.26 55% 611 911 49% -11% 57%
PRC - Prescott, AZ 5,152 $119.08 $182.62 53% 494 760 54% -28% -28%
IGM - Kingman, AZ 924 $113.63 $172.26 52% 357 933 161% -25% -25%
HVR - Havre, MT 1,186 $101.62 $150.02 48% 193 295 53% 0% 0%
FOD - Fort Dodge, IA 5,625 $144.22 $209.37 45% 549 910 66% 7% -23%
MAZ - Mayaguez, PR 5,856 $78.51 $113.80 45% 355 353 0% -6% -6%
FKL - Franklin, PA 1,319 $165.36 $239.59 45% 693 1112 60% 56% 56%
ISN - Williston, ND 40,658 $209.08 $301.34 44% 573 957 67% 123% 142%
ACV - Eureka/Arcata, CA 61,705 $170.64 $243.93 43% 822 1130 37% -25% -45%
ART - Watertown, NY 16,988 $166.42 $236.90 42% 570 1420 149% -70% -31%
ESC - Escanaba, MI 13,480 $175.98 $248.87 41% 805 1023 27% 24% 226%
HON - Huron, SD 1,705 $148.28 $207.66 40% 562 630 12% -4% -26%
BKW - Beckley, WV 2,533 $143.86 $201.41 40% 349 711 104% -35% 5%
DIK - Dickinson, ND 23,729 $180.01 $251.57 40% 503 986 96% -14% -14%
MCE - Merced, CA 3,724 $111.53 $155.68 40% 383 1077 181% -17% -17%
KSM - St. Mary's, AK 12,711 $88.07 $122.14 39% 156 287 84% -3% 27%
CIC - Chico, CA 19,269 $117.64 $162.40 38% 1023 1254 23% -6% -6%
PGA - Page, AZ 23,462 $155.74 $213.82 37% 460 1095 138% 67% 62%
SAW - Marquette, MI 38,294 $197.18 $266.85 35% 911 993 9% #N/A #N/A
GRI - Grand Island, NE 56,122 $107.02 $144.73 35% 312 959 207% -43% 113%
SWF - Newburgh, NY 185,389 $130.70 $176.33 35% 1072 1092 2% -49% -65%
HOM - Homer, AK 39,167 $91.37 $122.89 34% 338 325 -4% -15% -9%
CEC - Crescent City, CA 12,547 $134.90 $181.41 34% 834 928 11% -4% -4%
COU - Columbia, MO 41,357 $140.78 $188.53 34% 438 811 85% -26% 94%
CRQ - Carlsbad, CA 48,474 $114.07 $151.77 33% 1016 1609 58% #N/A #N/A
IMT - Iron Mountain, MI 8,755 $169.37 $223.01 32% 741 552 -26% -45% 45%
GRB - Green Bay, WI 282,870 $191.44 $251.73 31% 1032 970 -6% -32% -39%
Evolving Trends of U.S. Domestic Airfares 28
Airport Enplaned Pax
(2012)
Avg. One-Way Fare (2007)
Avg. One-Way Fare (2012)
% Change Fares 07-12
Avg. Itinerary Dist. (2007)
Avg. Itinerary Dist. (2012)
% Change Dist. 07-12
% Change Flights 07-12
% Change Seats 07-12
BPT - Beaumont/Pt. Arthur, TX 5,571 $225.09 $294.66 31% 897 917 2% -60% -63%
CRP - Corpus Christi, TX 313,939 $166.71 $217.65 31% 808 843 4% -21% -19%
LAR - Laramie, WY 8,131 $170.29 $222.20 30% 493 780 58% -9% -5%
VQS - Vieques, PR 56,266 $97.04 $126.57 30% 408 550 35% 21% -9%
ELY - Ely, NV 534 $118.61 $154.41 30% 229 1265 453% 4% 4%
MCW - Mason City, IA 6,027 $189.05 $244.05 29% 956 854 -11% -30% -53%
GGW - Glasgow, MT 1,975 $89.11 $114.93 29% 241 236 -2% -7% -7%
GBD - Great Bend, KS 943 $138.25 $177.82 29% 315 998 217% -18% -18%
SHD - Shenandoah Valley, VA 15,179 $155.43 $197.79 27% 423 1016 140% 32% 107%
IFP - Bullhead City, AZ 109,405 $128.14 $162.40 27% 1181 1114 -6% -100% -100%
DBQ - Dubuque, IA 32,389 $179.15 $226.51 26% 969 1029 6% -28% -34%
BMI - Bloomington, IL 240,153 $144.83 $182.99 26% 882 897 2% -25% -22%
MVY - Martha's Vineyard, MA 50,464 $96.16 $121.41 26% 241 248 3% 3% 4%
HRL - Harlingen, TX 375,472 $130.59 $164.68 26% 679 701 3% -27% -28%
ATY - Watertown, SD 6,296 $183.43 $228.68 25% 443 905 104% -27% -48%
OME - Nome, AK 59,807 $153.67 $190.86 24% 499 547 10% 15% -1%
RDD - Redding, CA 29,175 $166.05 $205.47 24% 714 1224 71% -46% -70%
VIS - Visalia, CA 3,354 $120.22 $147.58 23% 402 1555 287% 17% 17%
HOT - Hot Springs, AR 2,452 $90.36 $110.63 22% 241 225 -6% -12% -59%
SHR - Sheridan, WY 12,889 $186.88 $228.36 22% 649 1036 60% -50% -47%
VCT - Victoria, TX 4,597 $212.06 $258.71 22% 912 1030 13% -40% -50%
DDC - Dodge City, KS 5,784 $166.16 $202.30 22% 481 876 82% -24% -24%
JHW - Jamestown, NY 3,173 $190.28 $230.71 21% 761 807 6% 3% -42%
CWA - Wausau, WI 120,449 $209.27 $252.68 21% 1011 1018 1% -37% -21%
CVN - Clovis, NM 1,694 $152.97 $184.60 21% 332 775 133% -16% -16%
FMN - Farmington, NM 16,337 $178.15 $214.19 20% 507 913 80% -25% -25%
AOO - Altoona, PA 3,256 $160.74 $193.22 20% 561 1022 82% -16% 11%
VDZ - Valdez, AK 16,087 $110.92 $133.22 20% 305 273 -10% 74% 18%
GCK - Garden City, KS 17,998 $175.06 $209.54 20% 561 948 69% -34% 9%
DVL - Devils Lake, ND 2,976 $292.76 $350.19 20% 683 1045 53% 53% -14%
SJT - San Angelo, TX 56,301 $204.63 $244.23 19% 941 964 2% -45% -29%
GDV - Glendive, MT 746 $114.60 $136.68 19% 220 231 5% -13% -13%
AZO - Kalamazoo, MI 127,517 $214.22 $254.20 19% 944 937 -1% -38% -39%
NYL - Yuma, AZ 81,371 $213.77 $253.25 18% 1039 1238 19% #N/A #N/A
ABI - Abilene, TX 74,521 $199.60 $236.04 18% 933 928 -1% -33% -26%
RST - Rochester, MN 105,365 $190.25 $224.79 18% 907 881 -3% -37% -45%
JMS - Jamestown, ND 3,544 $224.69 $265.27 18% 651 902 39% 84% 37%
CDV - Cordova, AK 16,061 $174.38 $205.35 18% 711 754 6% -2% -12%
CLL - College Station, TX 70,352 $195.93 $228.82 17% 991 942 -5% -30% -8%
HIB - Hibbing, MN 11,771 $205.69 $240.12 17% 900 1157 29% -25% 11%
DUT - Dutch Harbor, AK 30,735 $501.63 $582.52 16% 1478 1812 23% -60% -82%
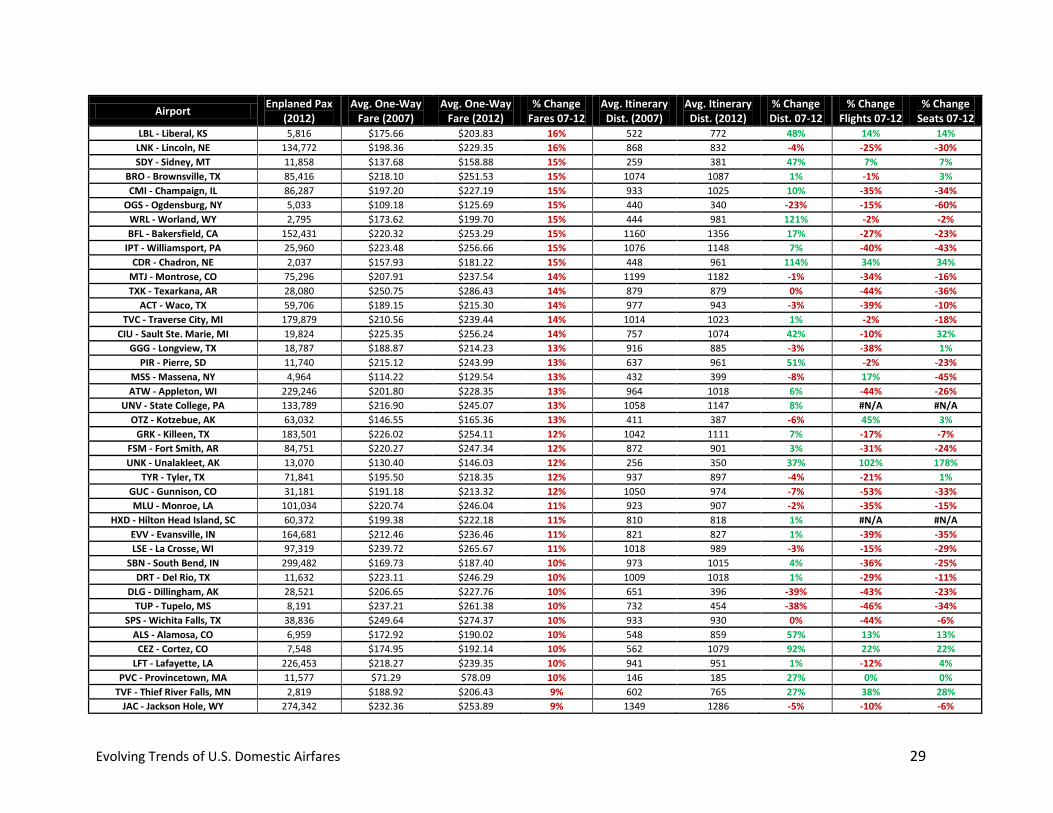
Evolving Trends of U.S. Domestic Airfares 29
Airport Enplaned Pax
(2012)
Avg. One-Way Fare (2007)
Avg. One-Way Fare (2012)
% Change Fares 07-12
Avg. Itinerary Dist. (2007)
Avg. Itinerary Dist. (2012)
% Change Dist. 07-12
% Change Flights 07-12
% Change Seats 07-12
LBL - Liberal, KS 5,816 $175.66 $203.83 16% 522 772 48% 14% 14%
LNK - Lincoln, NE 134,772 $198.36 $229.35 16% 868 832 -4% -25% -30%
SDY - Sidney, MT 11,858 $137.68 $158.88 15% 259 381 47% 7% 7%
BRO - Brownsville, TX 85,416 $218.10 $251.53 15% 1074 1087 1% -1% 3%
CMI - Champaign, IL 86,287 $197.20 $227.19 15% 933 1025 10% -35% -34%
OGS - Ogdensburg, NY 5,033 $109.18 $125.69 15% 440 340 -23% -15% -60%
WRL - Worland, WY 2,795 $173.62 $199.70 15% 444 981 121% -2% -2%
BFL - Bakersfield, CA 152,431 $220.32 $253.29 15% 1160 1356 17% -27% -23%
IPT - Williamsport, PA 25,960 $223.48 $256.66 15% 1076 1148 7% -40% -43%
CDR - Chadron, NE 2,037 $157.93 $181.22 15% 448 961 114% 34% 34%
MTJ - Montrose, CO 75,296 $207.91 $237.54 14% 1199 1182 -1% -34% -16%
TXK - Texarkana, AR 28,080 $250.75 $286.43 14% 879 879 0% -44% -36%
ACT - Waco, TX 59,706 $189.15 $215.30 14% 977 943 -3% -39% -10%
TVC - Traverse City, MI 179,879 $210.56 $239.44 14% 1014 1023 1% -2% -18%
CIU - Sault Ste. Marie, MI 19,824 $225.35 $256.24 14% 757 1074 42% -10% 32%
GGG - Longview, TX 18,787 $188.87 $214.23 13% 916 885 -3% -38% 1%
PIR - Pierre, SD 11,740 $215.12 $243.99 13% 637 961 51% -2% -23%
MSS - Massena, NY 4,964 $114.22 $129.54 13% 432 399 -8% 17% -45%
ATW - Appleton, WI 229,246 $201.80 $228.35 13% 964 1018 6% -44% -26%
UNV - State College, PA 133,789 $216.90 $245.07 13% 1058 1147 8% #N/A #N/A
OTZ - Kotzebue, AK 63,032 $146.55 $165.36 13% 411 387 -6% 45% 3%
GRK - Killeen, TX 183,501 $226.02 $254.11 12% 1042 1111 7% -17% -7%
FSM - Fort Smith, AR 84,751 $220.27 $247.34 12% 872 901 3% -31% -24%
UNK - Unalakleet, AK 13,070 $130.40 $146.03 12% 256 350 37% 102% 178%
TYR - Tyler, TX 71,841 $195.50 $218.35 12% 937 897 -4% -21% 1%
GUC - Gunnison, CO 31,181 $191.18 $213.32 12% 1050 974 -7% -53% -33%
MLU - Monroe, LA 101,034 $220.74 $246.04 11% 923 907 -2% -35% -15%
HXD - Hilton Head Island, SC 60,372 $199.38 $222.18 11% 810 818 1% #N/A #N/A
EVV - Evansville, IN 164,681 $212.46 $236.46 11% 821 827 1% -39% -35%
LSE - La Crosse, WI 97,319 $239.72 $265.67 11% 1018 989 -3% -15% -29%
SBN - South Bend, IN 299,482 $169.73 $187.40 10% 973 1015 4% -36% -25%
DRT - Del Rio, TX 11,632 $223.11 $246.29 10% 1009 1018 1% -29% -11%
DLG - Dillingham, AK 28,521 $206.65 $227.76 10% 651 396 -39% -43% -23%
TUP - Tupelo, MS 8,191 $237.21 $261.38 10% 732 454 -38% -46% -34%
SPS - Wichita Falls, TX 38,836 $249.64 $274.37 10% 933 930 0% -44% -6%
ALS - Alamosa, CO 6,959 $172.92 $190.02 10% 548 859 57% 13% 13%
CEZ - Cortez, CO 7,548 $174.95 $192.14 10% 562 1079 92% 22% 22%
LFT - Lafayette, LA 226,453 $218.27 $239.35 10% 941 951 1% -12% 4%
PVC - Provincetown, MA 11,577 $71.29 $78.09 10% 146 185 27% 0% 0%
TVF - Thief River Falls, MN 2,819 $188.92 $206.43 9% 602 765 27% 38% 28%
JAC - Jackson Hole, WY 274,342 $232.36 $253.89 9% 1349 1286 -5% -10% -6%
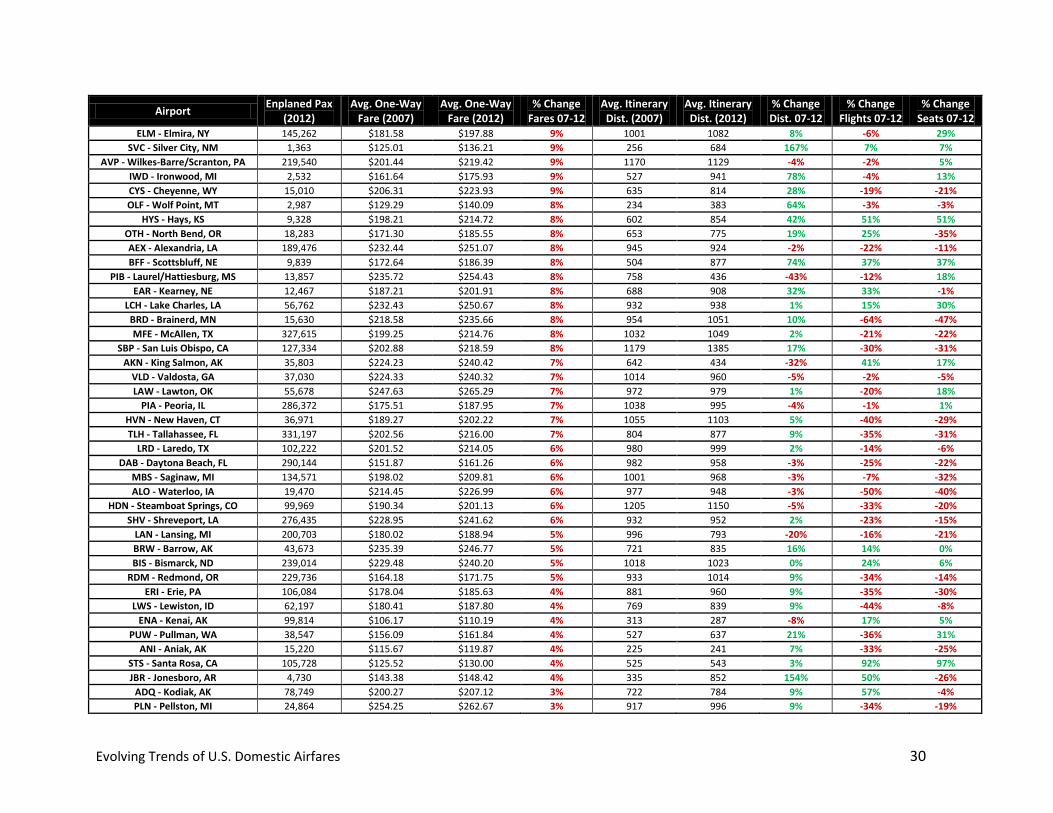
Evolving Trends of U.S. Domestic Airfares 30
Airport Enplaned Pax
(2012)
Avg. One-Way Fare (2007)
Avg. One-Way Fare (2012)
% Change Fares 07-12
Avg. Itinerary Dist. (2007)
Avg. Itinerary Dist. (2012)
% Change Dist. 07-12
% Change Flights 07-12
% Change Seats 07-12
ELM - Elmira, NY 145,262 $181.58 $197.88 9% 1001 1082 8% -6% 29%
SVC - Silver City, NM 1,363 $125.01 $136.21 9% 256 684 167% 7% 7%
AVP - Wilkes-Barre/Scranton, PA 219,540 $201.44 $219.42 9% 1170 1129 -4% -2% 5%
IWD - Ironwood, MI 2,532 $161.64 $175.93 9% 527 941 78% -4% 13%
CYS - Cheyenne, WY 15,010 $206.31 $223.93 9% 635 814 28% -19% -21%
OLF - Wolf Point, MT 2,987 $129.29 $140.09 8% 234 383 64% -3% -3%
HYS - Hays, KS 9,328 $198.21 $214.72 8% 602 854 42% 51% 51%
OTH - North Bend, OR 18,283 $171.30 $185.55 8% 653 775 19% 25% -35%
AEX - Alexandria, LA 189,476 $232.44 $251.07 8% 945 924 -2% -22% -11%
BFF - Scottsbluff, NE 9,839 $172.64 $186.39 8% 504 877 74% 37% 37%
PIB - Laurel/Hattiesburg, MS 13,857 $235.72 $254.43 8% 758 436 -43% -12% 18%
EAR - Kearney, NE 12,467 $187.21 $201.91 8% 688 908 32% 33% -1%
LCH - Lake Charles, LA 56,762 $232.43 $250.67 8% 932 938 1% 15% 30%
BRD - Brainerd, MN 15,630 $218.58 $235.66 8% 954 1051 10% -64% -47%
MFE - McAllen, TX 327,615 $199.25 $214.76 8% 1032 1049 2% -21% -22%
SBP - San Luis Obispo, CA 127,334 $202.88 $218.59 8% 1179 1385 17% -30% -31%
AKN - King Salmon, AK 35,803 $224.23 $240.42 7% 642 434 -32% 41% 17%
VLD - Valdosta, GA 37,030 $224.33 $240.32 7% 1014 960 -5% -2% -5%
LAW - Lawton, OK 55,678 $247.63 $265.29 7% 972 979 1% -20% 18%
PIA - Peoria, IL 286,372 $175.51 $187.95 7% 1038 995 -4% -1% 1%
HVN - New Haven, CT 36,971 $189.27 $202.22 7% 1055 1103 5% -40% -29%
TLH - Tallahassee, FL 331,197 $202.56 $216.00 7% 804 877 9% -35% -31%
LRD - Laredo, TX 102,222 $201.52 $214.05 6% 980 999 2% -14% -6%
DAB - Daytona Beach, FL 290,144 $151.87 $161.26 6% 982 958 -3% -25% -22%
MBS - Saginaw, MI 134,571 $198.02 $209.81 6% 1001 968 -3% -7% -32%
ALO - Waterloo, IA 19,470 $214.45 $226.99 6% 977 948 -3% -50% -40%
HDN - Steamboat Springs, CO 99,969 $190.34 $201.13 6% 1205 1150 -5% -33% -20%
SHV - Shreveport, LA 276,435 $228.95 $241.62 6% 932 952 2% -23% -15%
LAN - Lansing, MI 200,703 $180.02 $188.94 5% 996 793 -20% -16% -21%
BRW - Barrow, AK 43,673 $235.39 $246.77 5% 721 835 16% 14% 0%
BIS - Bismarck, ND 239,014 $229.48 $240.20 5% 1018 1023 0% 24% 6%
RDM - Redmond, OR 229,736 $164.18 $171.75 5% 933 1014 9% -34% -14%
ERI - Erie, PA 106,084 $178.04 $185.63 4% 881 960 9% -35% -30%
LWS - Lewiston, ID 62,197 $180.41 $187.80 4% 769 839 9% -44% -8%
ENA - Kenai, AK 99,814 $106.17 $110.19 4% 313 287 -8% 17% 5%
PUW - Pullman, WA 38,547 $156.09 $161.84 4% 527 637 21% -36% 31%
ANI - Aniak, AK 15,220 $115.67 $119.87 4% 225 241 7% -33% -25%
STS - Santa Rosa, CA 105,728 $125.52 $130.00 4% 525 543 3% 92% 97%
JBR - Jonesboro, AR 4,730 $143.38 $148.42 4% 335 852 154% 50% -26%
ADQ - Kodiak, AK 78,749 $200.27 $207.12 3% 722 784 9% 57% -4%
PLN - Pellston, MI 24,864 $254.25 $262.67 3% 917 996 9% -34% -19%
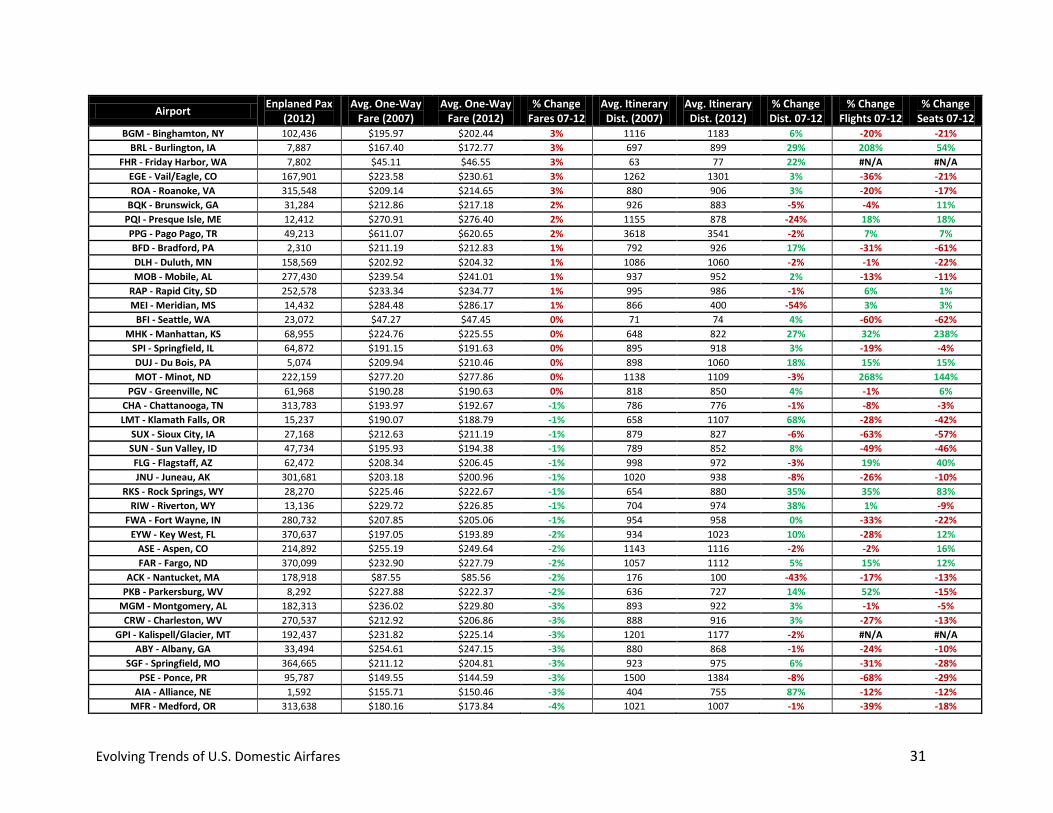
Evolving Trends of U.S. Domestic Airfares 31
Airport Enplaned Pax
(2012)
Avg. One-Way Fare (2007)
Avg. One-Way Fare (2012)
% Change Fares 07-12
Avg. Itinerary Dist. (2007)
Avg. Itinerary Dist. (2012)
% Change Dist. 07-12
% Change Flights 07-12
% Change Seats 07-12
BGM - Binghamton, NY 102,436 $195.97 $202.44 3% 1116 1183 6% -20% -21%
BRL - Burlington, IA 7,887 $167.40 $172.77 3% 697 899 29% 208% 54%
FHR - Friday Harbor, WA 7,802 $45.11 $46.55 3% 63 77 22% #N/A #N/A
EGE - Vail/Eagle, CO 167,901 $223.58 $230.61 3% 1262 1301 3% -36% -21%
ROA - Roanoke, VA 315,548 $209.14 $214.65 3% 880 906 3% -20% -17%
BQK - Brunswick, GA 31,284 $212.86 $217.18 2% 926 883 -5% -4% 11%
PQI - Presque Isle, ME 12,412 $270.91 $276.40 2% 1155 878 -24% 18% 18%
PPG - Pago Pago, TR 49,213 $611.07 $620.65 2% 3618 3541 -2% 7% 7%
BFD - Bradford, PA 2,310 $211.19 $212.83 1% 792 926 17% -31% -61%
DLH - Duluth, MN 158,569 $202.92 $204.32 1% 1086 1060 -2% -1% -22%
MOB - Mobile, AL 277,430 $239.54 $241.01 1% 937 952 2% -13% -11%
RAP - Rapid City, SD 252,578 $233.34 $234.77 1% 995 986 -1% 6% 1%
MEI - Meridian, MS 14,432 $284.48 $286.17 1% 866 400 -54% 3% 3%
BFI - Seattle, WA 23,072 $47.27 $47.45 0% 71 74 4% -60% -62%
MHK - Manhattan, KS 68,955 $224.76 $225.55 0% 648 822 27% 32% 238%
SPI - Springfield, IL 64,872 $191.15 $191.63 0% 895 918 3% -19% -4%
DUJ - Du Bois, PA 5,074 $209.94 $210.46 0% 898 1060 18% 15% 15%
MOT - Minot, ND 222,159 $277.20 $277.86 0% 1138 1109 -3% 268% 144%
PGV - Greenville, NC 61,968 $190.28 $190.63 0% 818 850 4% -1% 6%
CHA - Chattanooga, TN 313,783 $193.97 $192.67 -1% 786 776 -1% -8% -3%
LMT - Klamath Falls, OR 15,237 $190.07 $188.79 -1% 658 1107 68% -28% -42%
SUX - Sioux City, IA 27,168 $212.63 $211.19 -1% 879 827 -6% -63% -57%
SUN - Sun Valley, ID 47,734 $195.93 $194.38 -1% 789 852 8% -49% -46%
FLG - Flagstaff, AZ 62,472 $208.34 $206.45 -1% 998 972 -3% 19% 40%
JNU - Juneau, AK 301,681 $203.18 $200.96 -1% 1020 938 -8% -26% -10%
RKS - Rock Springs, WY 28,270 $225.46 $222.67 -1% 654 880 35% 35% 83%
RIW - Riverton, WY 13,136 $229.72 $226.85 -1% 704 974 38% 1% -9%
FWA - Fort Wayne, IN 280,732 $207.85 $205.06 -1% 954 958 0% -33% -22%
EYW - Key West, FL 370,637 $197.05 $193.89 -2% 934 1023 10% -28% 12%
ASE - Aspen, CO 214,892 $255.19 $249.64 -2% 1143 1116 -2% -2% 16%
FAR - Fargo, ND 370,099 $232.90 $227.79 -2% 1057 1112 5% 15% 12%
ACK - Nantucket, MA 178,918 $87.55 $85.56 -2% 176 100 -43% -17% -13%
PKB - Parkersburg, WV 8,292 $227.88 $222.37 -2% 636 727 14% 52% -15%
MGM - Montgomery, AL 182,313 $236.02 $229.80 -3% 893 922 3% -1% -5%
CRW - Charleston, WV 270,537 $212.92 $206.86 -3% 888 916 3% -27% -13%
GPI - Kalispell/Glacier, MT 192,437 $231.82 $225.14 -3% 1201 1177 -2% #N/A #N/A
ABY - Albany, GA 33,494 $254.61 $247.15 -3% 880 868 -1% -24% -10%
SGF - Springfield, MO 364,665 $211.12 $204.81 -3% 923 975 6% -31% -28%
PSE - Ponce, PR 95,787 $149.55 $144.59 -3% 1500 1384 -8% -68% -29%
AIA - Alliance, NE 1,592 $155.71 $150.46 -3% 404 755 87% -12% -12%
MFR - Medford, OR 313,638 $180.16 $173.84 -4% 1021 1007 -1% -39% -18%
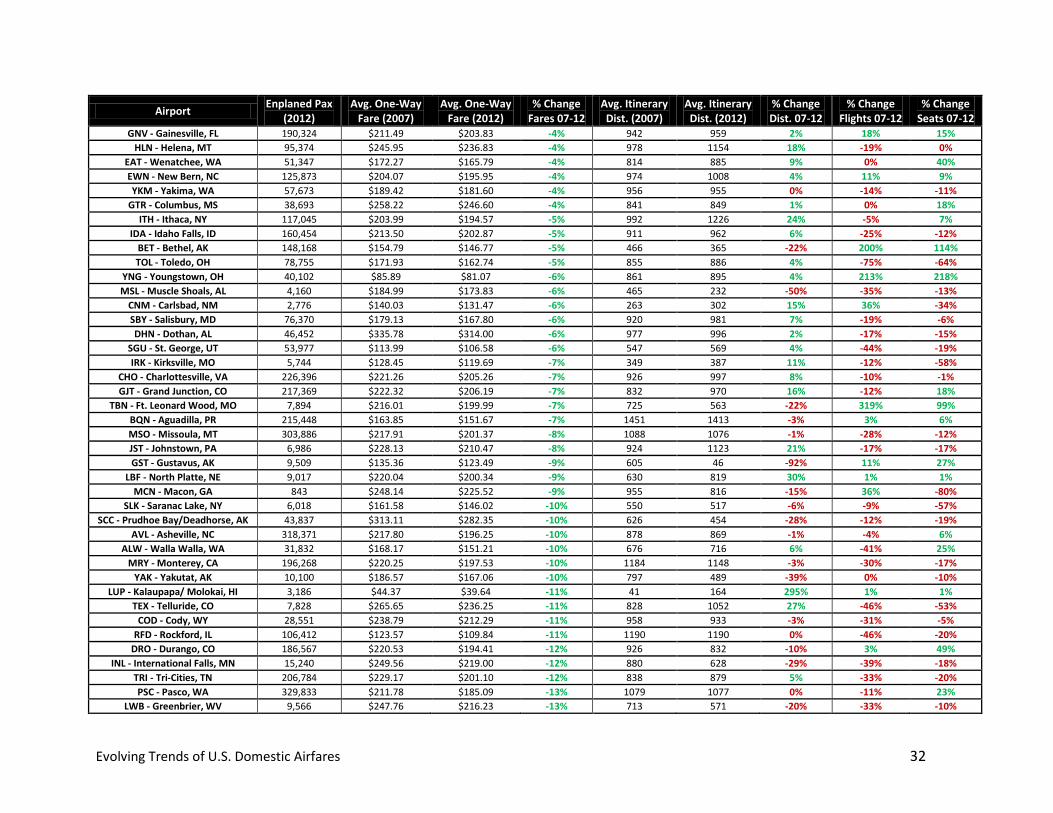
Evolving Trends of U.S. Domestic Airfares 32
Airport Enplaned Pax
(2012)
Avg. One-Way Fare (2007)
Avg. One-Way Fare (2012)
% Change Fares 07-12
Avg. Itinerary Dist. (2007)
Avg. Itinerary Dist. (2012)
% Change Dist. 07-12
% Change Flights 07-12
% Change Seats 07-12
GNV - Gainesville, FL 190,324 $211.49 $203.83 -4% 942 959 2% 18% 15%
HLN - Helena, MT 95,374 $245.95 $236.83 -4% 978 1154 18% -19% 0%
EAT - Wenatchee, WA 51,347 $172.27 $165.79 -4% 814 885 9% 0% 40%
EWN - New Bern, NC 125,873 $204.07 $195.95 -4% 974 1008 4% 11% 9%
YKM - Yakima, WA 57,673 $189.42 $181.60 -4% 956 955 0% -14% -11%
GTR - Columbus, MS 38,693 $258.22 $246.60 -4% 841 849 1% 0% 18%
ITH - Ithaca, NY 117,045 $203.99 $194.57 -5% 992 1226 24% -5% 7%
IDA - Idaho Falls, ID 160,454 $213.50 $202.87 -5% 911 962 6% -25% -12%
BET - Bethel, AK 148,168 $154.79 $146.77 -5% 466 365 -22% 200% 114%
TOL - Toledo, OH 78,755 $171.93 $162.74 -5% 855 886 4% -75% -64%
YNG - Youngstown, OH 40,102 $85.89 $81.07 -6% 861 895 4% 213% 218%
MSL - Muscle Shoals, AL 4,160 $184.99 $173.83 -6% 465 232 -50% -35% -13%
CNM - Carlsbad, NM 2,776 $140.03 $131.47 -6% 263 302 15% 36% -34%
SBY - Salisbury, MD 76,370 $179.13 $167.80 -6% 920 981 7% -19% -6%
DHN - Dothan, AL 46,452 $335.78 $314.00 -6% 977 996 2% -17% -15%
SGU - St. George, UT 53,977 $113.99 $106.58 -6% 547 569 4% -44% -19%
IRK - Kirksville, MO 5,744 $128.45 $119.69 -7% 349 387 11% -12% -58%
CHO - Charlottesville, VA 226,396 $221.26 $205.26 -7% 926 997 8% -10% -1%
GJT - Grand Junction, CO 217,369 $222.32 $206.19 -7% 832 970 16% -12% 18%
TBN - Ft. Leonard Wood, MO 7,894 $216.01 $199.99 -7% 725 563 -22% 319% 99%
BQN - Aguadilla, PR 215,448 $163.85 $151.67 -7% 1451 1413 -3% 3% 6%
MSO - Missoula, MT 303,886 $217.91 $201.37 -8% 1088 1076 -1% -28% -12%
JST - Johnstown, PA 6,986 $228.13 $210.47 -8% 924 1123 21% -17% -17%
GST - Gustavus, AK 9,509 $135.36 $123.49 -9% 605 46 -92% 11% 27%
LBF - North Platte, NE 9,017 $220.04 $200.34 -9% 630 819 30% 1% 1%
MCN - Macon, GA 843 $248.14 $225.52 -9% 955 816 -15% 36% -80%
SLK - Saranac Lake, NY 6,018 $161.58 $146.02 -10% 550 517 -6% -9% -57%
SCC - Prudhoe Bay/Deadhorse, AK 43,837 $313.11 $282.35 -10% 626 454 -28% -12% -19%
AVL - Asheville, NC 318,371 $217.80 $196.25 -10% 878 869 -1% -4% 6%
ALW - Walla Walla, WA 31,832 $168.17 $151.21 -10% 676 716 6% -41% 25%
MRY - Monterey, CA 196,268 $220.25 $197.53 -10% 1184 1148 -3% -30% -17%
YAK - Yakutat, AK 10,100 $186.57 $167.06 -10% 797 489 -39% 0% -10%
LUP - Kalaupapa/ Molokai, HI 3,186 $44.37 $39.64 -11% 41 164 295% 1% 1%
TEX - Telluride, CO 7,828 $265.65 $236.25 -11% 828 1052 27% -46% -53%
COD - Cody, WY 28,551 $238.79 $212.29 -11% 958 933 -3% -31% -5%
RFD - Rockford, IL 106,412 $123.57 $109.84 -11% 1190 1190 0% -46% -20%
DRO - Durango, CO 186,567 $220.53 $194.41 -12% 926 832 -10% 3% 49%
INL - International Falls, MN 15,240 $249.56 $219.00 -12% 880 628 -29% -39% -18%
TRI - Tri-Cities, TN 206,784 $229.17 $201.10 -12% 838 879 5% -33% -20%
PSC - Pasco, WA 329,833 $211.78 $185.09 -13% 1079 1077 0% -11% 23%
LWB - Greenbrier, WV 9,566 $247.76 $216.23 -13% 713 571 -20% -33% -10%
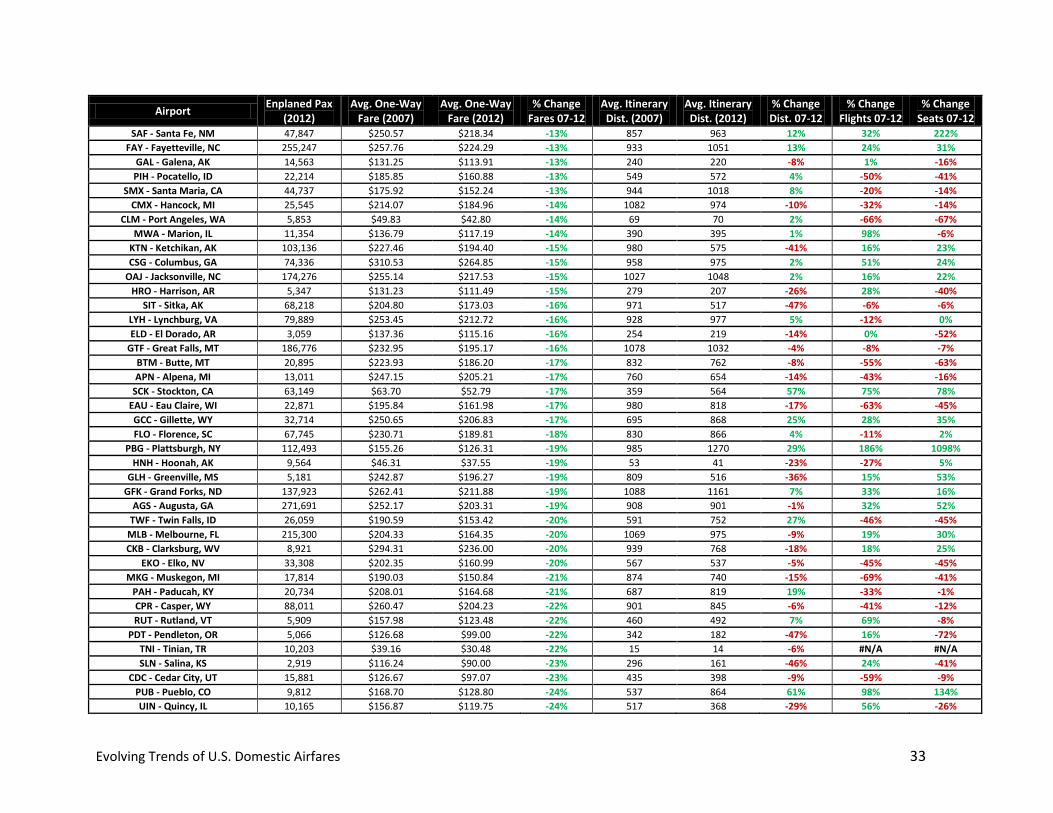
Evolving Trends of U.S. Domestic Airfares 33
Airport Enplaned Pax
(2012)
Avg. One-Way Fare (2007)
Avg. One-Way Fare (2012)
% Change Fares 07-12
Avg. Itinerary Dist. (2007)
Avg. Itinerary Dist. (2012)
% Change Dist. 07-12
% Change Flights 07-12
% Change Seats 07-12
SAF - Santa Fe, NM 47,847 $250.57 $218.34 -13% 857 963 12% 32% 222%
FAY - Fayetteville, NC 255,247 $257.76 $224.29 -13% 933 1051 13% 24% 31%
GAL - Galena, AK 14,563 $131.25 $113.91 -13% 240 220 -8% 1% -16%
PIH - Pocatello, ID 22,214 $185.85 $160.88 -13% 549 572 4% -50% -41%
SMX - Santa Maria, CA 44,737 $175.92 $152.24 -13% 944 1018 8% -20% -14%
CMX - Hancock, MI 25,545 $214.07 $184.96 -14% 1082 974 -10% -32% -14%
CLM - Port Angeles, WA 5,853 $49.83 $42.80 -14% 69 70 2% -66% -67%
MWA - Marion, IL 11,354 $136.79 $117.19 -14% 390 395 1% 98% -6%
KTN - Ketchikan, AK 103,136 $227.46 $194.40 -15% 980 575 -41% 16% 23%
CSG - Columbus, GA 74,336 $310.53 $264.85 -15% 958 975 2% 51% 24%
OAJ - Jacksonville, NC 174,276 $255.14 $217.53 -15% 1027 1048 2% 16% 22%
HRO - Harrison, AR 5,347 $131.23 $111.49 -15% 279 207 -26% 28% -40%
SIT - Sitka, AK 68,218 $204.80 $173.03 -16% 971 517 -47% -6% -6%
LYH - Lynchburg, VA 79,889 $253.45 $212.72 -16% 928 977 5% -12% 0%
ELD - El Dorado, AR 3,059 $137.36 $115.16 -16% 254 219 -14% 0% -52%
GTF - Great Falls, MT 186,776 $232.95 $195.17 -16% 1078 1032 -4% -8% -7%
BTM - Butte, MT 20,895 $223.93 $186.20 -17% 832 762 -8% -55% -63%
APN - Alpena, MI 13,011 $247.15 $205.21 -17% 760 654 -14% -43% -16%
SCK - Stockton, CA 63,149 $63.70 $52.79 -17% 359 564 57% 75% 78%
EAU - Eau Claire, WI 22,871 $195.84 $161.98 -17% 980 818 -17% -63% -45%
GCC - Gillette, WY 32,714 $250.65 $206.83 -17% 695 868 25% 28% 35%
FLO - Florence, SC 67,745 $230.71 $189.81 -18% 830 866 4% -11% 2%
PBG - Plattsburgh, NY 112,493 $155.26 $126.31 -19% 985 1270 29% 186% 1098%
HNH - Hoonah, AK 9,564 $46.31 $37.55 -19% 53 41 -23% -27% 5%
GLH - Greenville, MS 5,181 $242.87 $196.27 -19% 809 516 -36% 15% 53%
GFK - Grand Forks, ND 137,923 $262.41 $211.88 -19% 1088 1161 7% 33% 16%
AGS - Augusta, GA 271,691 $252.17 $203.31 -19% 908 901 -1% 32% 52%
TWF - Twin Falls, ID 26,059 $190.59 $153.42 -20% 591 752 27% -46% -45%
MLB - Melbourne, FL 215,300 $204.33 $164.35 -20% 1069 975 -9% 19% 30%
CKB - Clarksburg, WV 8,921 $294.31 $236.00 -20% 939 768 -18% 18% 25%
EKO - Elko, NV 33,308 $202.35 $160.99 -20% 567 537 -5% -45% -45%
MKG - Muskegon, MI 17,814 $190.03 $150.84 -21% 874 740 -15% -69% -41%
PAH - Paducah, KY 20,734 $208.01 $164.68 -21% 687 819 19% -33% -1%
CPR - Casper, WY 88,011 $260.47 $204.23 -22% 901 845 -6% -41% -12%
RUT - Rutland, VT 5,909 $157.98 $123.48 -22% 460 492 7% 69% -8%
PDT - Pendleton, OR 5,066 $126.68 $99.00 -22% 342 182 -47% 16% -72%
TNI - Tinian, TR 10,203 $39.16 $30.48 -22% 15 14 -6% #N/A #N/A
SLN - Salina, KS 2,919 $116.24 $90.00 -23% 296 161 -46% 24% -41%
CDC - Cedar City, UT 15,881 $126.67 $97.07 -23% 435 398 -9% -59% -9%
PUB - Pueblo, CO 9,812 $168.70 $128.80 -24% 537 864 61% 98% 134%
UIN - Quincy, IL 10,165 $156.87 $119.75 -24% 517 368 -29% 56% -26%
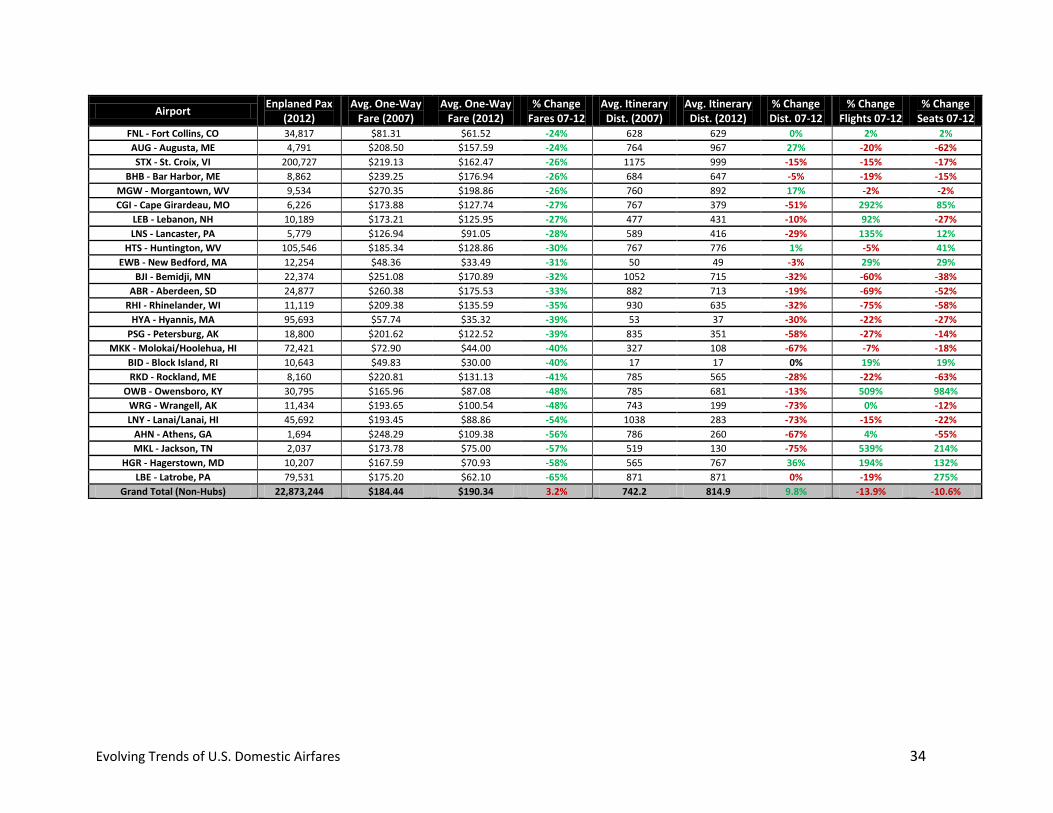
Evolving Trends of U.S. Domestic Airfares 34
Airport Enplaned Pax
(2012)
Avg. One-Way Fare (2007)
Avg. One-Way Fare (2012)
% Change Fares 07-12
Avg. Itinerary Dist. (2007)
Avg. Itinerary Dist. (2012)
% Change Dist. 07-12
% Change Flights 07-12
% Change Seats 07-12
FNL - Fort Collins, CO 34,817 $81.31 $61.52 -24% 628 629 0% 2% 2%
AUG - Augusta, ME 4,791 $208.50 $157.59 -24% 764 967 27% -20% -62%
STX - St. Croix, VI 200,727 $219.13 $162.47 -26% 1175 999 -15% -15% -17%
BHB - Bar Harbor, ME 8,862 $239.25 $176.94 -26% 684 647 -5% -19% -15%
MGW - Morgantown, WV 9,534 $270.35 $198.86 -26% 760 892 17% -2% -2%
CGI - Cape Girardeau, MO 6,226 $173.88 $127.74 -27% 767 379 -51% 292% 85%
LEB - Lebanon, NH 10,189 $173.21 $125.95 -27% 477 431 -10% 92% -27%
LNS - Lancaster, PA 5,779 $126.94 $91.05 -28% 589 416 -29% 135% 12%
HTS - Huntington, WV 105,546 $185.34 $128.86 -30% 767 776 1% -5% 41%
EWB - New Bedford, MA 12,254 $48.36 $33.49 -31% 50 49 -3% 29% 29%
BJI - Bemidji, MN 22,374 $251.08 $170.89 -32% 1052 715 -32% -60% -38%
ABR - Aberdeen, SD 24,877 $260.38 $175.53 -33% 882 713 -19% -69% -52%
RHI - Rhinelander, WI 11,119 $209.38 $135.59 -35% 930 635 -32% -75% -58%
HYA - Hyannis, MA 95,693 $57.74 $35.32 -39% 53 37 -30% -22% -27%
PSG - Petersburg, AK 18,800 $201.62 $122.52 -39% 835 351 -58% -27% -14%
MKK - Molokai/Hoolehua, HI 72,421 $72.90 $44.00 -40% 327 108 -67% -7% -18%
BID - Block Island, RI 10,643 $49.83 $30.00 -40% 17 17 0% 19% 19%
RKD - Rockland, ME 8,160 $220.81 $131.13 -41% 785 565 -28% -22% -63%
OWB - Owensboro, KY 30,795 $165.96 $87.08 -48% 785 681 -13% 509% 984%
WRG - Wrangell, AK 11,434 $193.65 $100.54 -48% 743 199 -73% 0% -12%
LNY - Lanai/Lanai, HI 45,692 $193.45 $88.86 -54% 1038 283 -73% -15% -22%
AHN - Athens, GA 1,694 $248.29 $109.38 -56% 786 260 -67% 4% -55%
MKL - Jackson, TN 2,037 $173.78 $75.00 -57% 519 130 -75% 539% 214%
HGR - Hagerstown, MD 10,207 $167.59 $70.93 -58% 565 767 36% 194% 132%
LBE - Latrobe, PA 79,531 $175.20 $62.10 -65% 871 871 0% -19% 275%
Grand Total (Non-Hubs) 22,873,244 $184.44 $190.34 3.2% 742.2 814.9 9.8% -13.9% -10.6%


![EVOLVING TRENDS OF US DOMESTIC AIRFARES - [email protected]](https://img.pdfslide.net/doc/110x75/6203a1b4da24ad121e4ba6f5/evolving-trends-of-us-domestic-airfares-emailprotected.jpg)