Embed Size (px)
Citation preview
Ex Vivo Biomechanical Testing to Examine the Etiology of
Low Back Pain as a Result of Whole Body Vibration
Lovenoor Singh Aulck
A thesis
submitted in partial fulfillment of the
requirements for the degree of
Master of Science in Bioengineering
University of Washington
2012
Committee:
Randal P. Ching, Ph.D.
Peter W. Johnson, Ph.D.
Joan E. Sanders, Ph.D.
Program Authorized to Offer Degree:
Department of Bioengineering

University of Washington
Abstract
Ex Vivo Biomechanical Testing to Examine the Etiology of Low Back Pain as a
Result of Whole Body Vibrations
Lovenoor Singh Aulck
Chair of the Supervisory Committee:
Research Associate Professor Randal Preston Ching
Mechanical Engineering
An association between occupational whole body vibration (WBV) exposure and the
development of lower back pain (LBP) has been established through numerous epidemiological
studies. However, the etiological and biomechanical mechanisms of how WBV contributes to
LBP and injury are not well understood. Using field-measured occupational WBV exposures in a
controlled laboratory setting, this study attempted to expose the human lumbar spine to
occupational WBV exposures to better understand the mechanisms of WBV-related low back
injury. The occupational exposures selected for this study were those encountered by bus drivers,
who are known to have a high prevalence of LBP. Continuous and impulsive WBV accelerations
collected at the floor of a bus traversing a standardized route in the Seattle metro area were
played into a six-degree of freedom hydraulic shaker platform. Twelve professional drivers sat
on an air suspension seat mounted to a six-degree of freedom hydraulic shaker platform. The
drivers’ response to the continuous and impulsive exposures at the seat and sternum were

recorded. The difference between seat- and sternum-measured accelerations were used to
calculate the displacement of the spine during the vibrations encountered during continuous and
impulsive exposures. Based on these two exposure patterns for the bus drivers, six human lumbar
functional spine units (FSUs) were placed in a servohydraulic testing system and continuously
exposed to one of the two vibration signatures. A unique staining technique was used to visually
differentiate preexisting intervertebral disc damage and damage brought on by cycling the FSU.
No discernible damage was found for discs exposed to the continuous WBV while exposing
FSUs to the impulsive WBV resulted in endplate fractures and damage to the annulus fibrosis of
the intervertebral disc. These findings indicate that, for equal drive times, a more impulsive and
intermittent loading signature is more likely to cause injury to components of the low back than a
relatively less impulsive and more continuous signature.

i
ACKNOWLEDGEMENTS
I would like to express my gratitude towards the University of Washington Department of
Bioengineering for their support throughout my undergraduate and graduate academic
endeavors. I would also like to thank Peter Johnson, Randal Ching, and their respective labs for
their continued trust, patience, and mentorship. I would also like to extend my appreciation to
Ryan Blood for his role in data collection. Lastly and most importantly, my deepest appreciation
goes towards my family and friends - this work would not have been completed without their
unwavering love and support.

ii
TABLE OF CONTENTS
List of Figures v
List of Tables vii
Chapter 1: Background and Introduction 1
1.1: Relationship between Whole Body Vibrations and Lower Back Disorders 1
1.2: Brief Overview of Spine Anatomy 2
1.3: Load Tolerance and Variability in the Spine 5
1.4: Previous Work 7
1.5: Problem Statement and Proposed Solution 10
1.6: Thesis Overview 12
Chapter 2: Vibration Data Collection and Processing 13
2.1: Vibration Data Collection and Processing Overview 13
2.2: Bus and Shaker Data Collection 14
2.3: Triple Filter, Double Integration Approach 19
2.3.1: Overview of Approach 19
2.3.2: Validation of Approach 21
2.4: Isolation of Road Features of Interest 24
2.5: Mathematical Model of Vibration Response 26
2.5.1: Description 26
2.5.2: Model Results 27

iii
2.6: Analytical Results 29
Chapter 3: Preliminary Study and Protocol Refinement 33
3.1: Preliminary Study Overview 33
3.2: Specimen Preparation 34
3.3: Stain Injection Protocol 37
3.3.1: Stain Selection 37
3.3.2: Stain Injections 39
3.4: Overall Testing Protocol 40
3.5: Preliminary Study Inputs, Results, and Refinements 41
3.5.1: Phase 1 of Preliminary Study 41
3.5.2: Phase 2 of Preliminary Study 50
3.5.3: Phase 3 of Preliminary Study 54
3.6: Preliminary Study Results 56
Chapter 4: Final Study and Results 59
4.1: Final Study Overview 59
4.2: Final Study Protocol 59
4.3: Final Test Results 62
4.3.1: Freeway Cycling Results 63
4.3.2: Expansion Joint Cycling Results 68
4.4: Summary of Results 73

iv
Chapter 5: Discussion 75
5.1: Revisiting Final Testing Aims 75
5.2: Study Limitations 76
5.3: Future Directions 78
5.4: Conclusions 79
References 83

v
LIST OF FIGURES
Figure Number Page
1.1 Overview of vertebral column structures. 3
1.2 Anatomy of intervertebral discs 4
1.3 Load-tolerance curves 6
2.1 Overview of data collection and processing 13
2.2 Standardized route used in data collection 14
2.3 Shaker table experiment setup 18
2.4 Overview of triple-filter-double-integration (TFDI) process 21
2.5 TFDI calculations and validation 23
2.6 Mass-spring-damper mechanical model 28
3.1 Embedded FSU as used in tests 36
3.2 Before and after images of intervertebral disc stained three times 38
3.3 Cycling waveforms for phase 1 of preliminary study 43
3.4 Results from first preliminary test 44
3.5 Results from second preliminary test 45

vi
3.6 Image from third preliminary test 47
3.7 Fissure found in fourth preliminary test 49
3.8 Cycling waveforms for phase 2 of preliminary study 51
3.9 Cycling waveforms for phase 3 of preliminary study 55
4.1 MTS actuator in contact with piston 61
4.2 Flowchart of final testing protocol 62
4.3 Diagram of picture grids used to display results 63
4.4 Diagram of FSU and picture grid 63
4.5 Results from first test specimen exposed to freeway signature 64
4.6 Results from second test specimen exposed to freeway signature 65
4.7 Results from third test specimen exposed to freeway signature 67
4.8 Results from first test specimen exposed to expansion joint signature 68
4.9 Results from second test specimen exposed to expansion joint signature 70
4.10 Results from third test specimen exposed to expansion joint signature 71
4.11 Demonstration of the extent of endplate fracture 72

vii
LIST OF TABLES
Table Number Page
2.1 GPS coordinates of road segments in standardized route 15
2.2 Input signals for shaker table 17
2.3 Shaker table subject information 18
2.4 Segments used in post-shaker table analysis 19
2.5 Results of TFDI validation calculations 22
2.6 Mathematical model parameters 28
2.7 Mathematical model results 29
2.8 Expansion joint seat to sternum signatures 30
2.9 Freeway seat to sternum signatures 31
2.10 Signatures used at start of preliminary tests 31
3.1 Specimens used in preliminary studies 36
3.2 Preliminary study protocols 58
3.3 Preliminary study results 58
4.1 Specimens used in final testing 60
4.2 Final testing results 74

1
CHAPTER 1: Background and Introduction
1.1 Relationship between Whole Body Vibrations and Lower Back Disorders
Excluding head injuries, back injuries are the most prevalent injury experienced by adults
in the United States (US) 1. Back injuries and lower back disorders (LBDs) are also the most
prevalent and costly non-lethal medical condition affecting the US workforce. The lifetime
prevalence rate of LBDs in US adults is nearly 80% and total annual costs of treatment exceed
100 billion dollars 2, 3
. Additionally, back injuries account for nearly one-third of all work-related
injuries in the United States and one-fifth of all US workers’ compensation claims, thus carrying
significant financial implications 3.
Workplace LBD etiology is believed to be multi-factorial in its origin and related to
physical and psychosocial occupational exposures 4-6
. Amongst sedentary workers and in
occupational settings requiring prolonged periods of sitting, both physiologic deconditioning and
continuous and prolonged static musculoskeletal loading are believed to play a role in the onset
and development of LBDs 4. Additionally, poor workstation ergonomics and awkward sitting
postures have been found to increase the likelihood of LBD onset amongst occupational groups
with prolonged sitting requirements 6, 7
.
Machine and vehicle operators have higher rates of LBD prevalence compared to similar
groups of office workers, despite the sedentary nature of both types of occupations 8-10
. It is
believed that exposure to whole body vibrations (WBV) such as those experienced during
vehicle operation are a major factor in this increased prevalence and a leading risk factor in the
onset and development of LBDs in the workplace 3, 11-14
. WBV in vehicles is primarily
transferred to the operator via contact surfaces supporting the body, such as the buttocks of the
seated individual. In regards to LBDs, WBV can be traumatic for individuals as vertebral

2
structures (muscles, ligaments, vertebral bodies, and intervertebral discs) act as springs and
dampers to dissipate vibration energy 11, 15
. This vibration energy dissipation is particularly
pronounced in the lumbar region of the spine, where both elevated and repetitive spinal loads
have been associated with vertebral disc thinning, bulging, and herniation 12, 16, 17
. Additionally,
cyclical torsion and bending has been found to lead to disc degeneration and micro-fractures in
the vertebral bodies of the lower back 18
. Because of this, degenerative lumbar discs are 150%
more likely in vibrating vehicle operators exposed to high levels of WBV than those that are less
exposed 3. It is believed that 4-7% of the US workforce is exposed to potentially harmful levels
of WBV, among which 41-83% of vibrating vehicle operators report lower back pain as a result
of their occupation 12, 15
. High levels of both WBV and LBDs have been reported in operators of
cars, buses, trucks, trains, forklifts, all-terrain vehicles, mine cars, tractors and other agricultural
equipment 13, 19-29
. Thus, vehicle operators are believed to not only be at risk for development of
LBDs due to the sedentary nature of their work, but also because of an increased exposure to
WBV.
1.2 Brief Overview of Spine Anatomy
As can be assumed from the word “back”, most LBDs are in some way related to the
vertebral (spinal) column and/or the surrounding musculature thereof. The spinal column
consists of 33 vertebra and 26 bones grouped into five sections/regions 30
. Figure 1.1 shows a
diagram of these structures and their groupings. From the superior (top) of the vertebral column,
there are 7 cervical vertebra, 12 thoracic vertebra, and 5 lumbar vertebra 30
. Each of these 24
vertebrae are composed of individual bones stacked one atop another along the cranial-caudal
axis with intervertebral discs between adjacent vertebrae. Twenty-three discs are contained in the

3
human spine – 22 between each adjacent vertebra and 1 immediately inferior to the lumbar spine
at the lumbo-sacral junction. The vertebra are situated to create four distinct, curved regions
with the sacral and thoracic curves present at birth and the lumbar and cervical curves developed
thereafter 30
. When classifying individual vertebrae, a single letter is used along with a number
representing the location of the vertebra of interest. These letters correspond to the first letter of
the region from which the vertebra originates while the numbers correspond to the individual
vertebra’s location from the superior for the particular region of interest. As examples, the
superior-most cervical vertebra would be C1, the 5th
-most superior thoracic vertebra from would
be labeled T5, and the 2nd
-most superior lumbar vertebra would be L2. When fused, the sacrum
is collectively referred to as S1.
Figure 1.1 Overview of vertebral column structures.
The vertebrae are the primary supporting structures of the vertebral column while the

4
intervertebral discs provide flexibility and shock absorption. Individual vertebrae are composed
of a hard cortical bone cortex and a cancellous (trabecular) bone interior. Stabilizing structures
are found protruding from the posterior regions of vertebrae. Meanwhile, intervertebral discs are
connected with vertebrae (above and below) at the vertebral “endplates.” The discs are composed
of an outer annulus fibrosis surrounding an inner nucleus pulposus. The layout of intervertebral
discs is outlined in Figure 1.2. The annulus fibrosis (annulus) is composed of collagen fibers and
keeps the nucleus pulpsous (nucleus) contained. The nucleus is composed of a protein-based
hydrogel functioning as a shock absorber.
Figure 1.2 Anatomy of intervertebral discs.
Injuries to the spine and back can take many forms. The nucleus is free to move within the
area confined by the inner annulus fibers – as loads are applied to the vertebral bodies adjacent to
the disc, a pressure gradient is created within the inner annulus which forces the nucleus away
from the location of the load. Loading vertebral structures along the cranial-caudal axis also
forces the annulus fibers to expand along the transverse plane and into the space between

5
vertebral bodies. Coupled with the movement of the nucleus towards this same region, this can
lead to disc bulging, herniation, or impinging of the nerves running along the posterior of the
vertebral bodies. In cases of extreme loading, endplate fractures can also occur. Laboratory tests
have shown that disc bulging, rupturing of the annulus, and endplate fractures can occur during
tasks which mimic occupational lifting situations 31
. However, it should be noted that in general,
back pain is often grouped nonspecifically when classifying workplace injury, thereby making it
difficult to determine the nature of occupational back injuries as brought on by WBV exposure
or otherwise 32
.
1.3 Load-tolerance and Variability Within the Spine
Biomechanically, LBDs are associated with the magnitude and frequency of lumbar spine
loading. Increased loading results in a decrease in the spine’s ability to tolerate applied loads.
The related load-tolerance relationship is graphically shown in Figure 1.3 1. Central to this
relationship is the hypothesis that if the load experienced by a region of the vertebral column
exceeds a physiologically-specific tolerance, the vertebral tissue of that region may be subject to
deterioration and/or damage. Figure 1.3A and 1.3B depict this relationship for a spinal load
significantly less than the tolerance level (as indicated by a “safety margin”) and for a load
magnitude greater than the tolerance level, respectively. Figure 1.3C depicts this relationship for
cumulative trauma disorders, where spinal load tolerance decreases with non-uniform, repetitive
loading over time 1, 33
. This gradual decrease of spinal load tolerance over time is representative
of the commonly held view that the development of WBV-induced LBDs are believed to
progress in a manner similar to cumulative trauma disorders – spinal tolerance decreases over
time and realization of injury can often be highlighted by a single event.

6
Figure 1.3 Load-tolerance curves (1). 1.3A: Tolerance greater than load. 1.3B: Load greater than tolerance.
1.3C: Cumulative trauma from decreased tolerance over time. Reproduced from source.
Even in light of this load tolerance-relationship, the etiological relationship between WBV
and LBDs is still relatively unknown 14
. This is largely due to both the complexity of the
biomechanically-relevant anatomy of the spine and the complexity of nociception and pain
response registered and regulated by the nervous system. In general, back pain has both
neurophysiological and neuroanatomical origins but the complexity and anatomic variation
within the spine make determining the underlying causes of low back pain difficult 1, 34, 35
. In the
spine, both the average height and average width of lumbar vertebrae are two to three times those
of thoracic and cervical vertebrae, respectively 36
. Also, the facet joints in the lumbar region of
the spine differ from other regions of the spine (particularly in relation to facet joint angle with
respect to midline), and within the inner/outer regions of an individual vertebra 1, 36, 37
. Due to
slight anatomical variations in the intervertebral discs and the increasing effects of body mass as
one goes down the spinal column, studies have indicated that WBV does not uniformly affect all
regions and structures of the spine 36
. Eccentric loading is the primary cause of disc herniation
and bulging, giving basis to the idea that facet joints (located on the posterior region of
vertebrae) and the posterior region of lumbar intervertebral discs, which are exposed to the
highest magnitudes of vibration, are at greatest risk for WBV-induced injury 36
. As such, only a

7
strong epidemiological association between WBV exposure and LBDs exists while etiological
evidence regarding the nature, progression, and location of injury remains lacking.
1.4 Previous Work
Previous WBV studies have focused on four broad areas: conducting epidemiological
surveys to establish an association between exposure and disease, collecting field data with
respect to established standards in hopes of developing engineering controls, modeling seat
suspension performance using laboratory shaker platforms, and performing laboratory
simulations using finite element (FE) or cadaveric models. Data for WBV studies is almost
always collected and analyzed in accordance with International Organization for Standardization
(ISO) guidelines using accelerometers and weighted acceleration-based parameters 38, 39
. These
parameters include, among others, a time-weighted average acceleration (Aw) used to measure
the continuous component of the vibration exposure; a fourth-order time-weighted acceleration
(VDV) to better account for the impulsive content of the vibration exposures; and a high fidelity,
continuous acceleration measure (Sed) to better evaluate and model the impulsive, compressive
stresses in the lumbar region of the spine 38, 39
. It should be noted, however, that some of these
parameters and the coefficients used in their calculations may be outdated, may not appropriately
identify harmful levels of WBV, and the calculations of the various parameters may be subject to
errors in interpretation 40-43
. Additionally, occupational WBV is poorly understood and regulated
in work settings as studies have recorded occupational WBV exposures significantly greater than
ISO and European Union Directive risk guidelines 12, 19, 25, 28, 44
.
Approaches to characterize the work-relatedness of WBV-induced injuries have focused
on establishing a relationship between WBV and LBDs. This has primarily been done via cross-

8
sectional, cohort, case-control, and community-based epidemiological studies of WBV-exposed
groups 12
. Crane, bus, tractor, and fork-lift operators have been frequently studied for both
vibration exposure and LBDs with control groups usually consisting of office workers 12
. In
general, such studies have shown that not only does daily WBV exposure in many industrial
vehicles exceed industry-standard exposure limits, but WBV is also a risk factor for LBD based
on the higher prevalence rates in the studied populations 12
. Even though the association between
WBV and LBD is believed to be based on some combination of mechanical overloading and
muscular fatigue, the exact biological etiology of WBV-induced LBD remains relatively
unknown 14
. Additionally, many variables can affect the level of WBV exposure including seat
design, hand position, driving posture, and vehicle design 11, 22, 29, 42, 45, 46
.
Computational simulations and analyses have been conducted to investigate potential
mechanisms of lower back injury relating to WBV. In particular, FE models have provided
researchers with a tool by which to accurately assess the biomechanics of the lumbar spine under
a range of conditions, albeit under the limitations posed by replacing cadaveric experimentation
with computational simulations 47-50
. One such FE analysis found that both static and dynamic
compressive and sheer forces acting on lumbar bodies during whole body vibrations were highly
dependent on upper body mass and posture 51
. A transfer function analysis of the sheer and
compressive forces, meanwhile, found these forces to be highest when the frequency of vibration
is under 10-12 Hz in the z-direction (caudal-cranial direction when subject is seated upright) 51
.
Another FE analysis found the resonant frequency of the lumbar spine under vibration to vary
greatly based on upper body mass but to be about 10 Hz in the z-direction 33
. However, the
health of intervertebral bodies, posture, and body mass was found by another FE analysis to have
a large influence on the resonant frequency of lumbar vertebral bodies 52
. Both a larger upper

9
body mass and a higher deterioration/removal of vertebral bodies were found to decrease the
resonant frequency of lumbar vertebral regions in a z-axis vibration 50, 52
. Static, peak
compressive forces acting on the lumbar spine, meanwhile, have been found by FE analyses to
range between about 350 N-700 N when the subject is seated in an ergonomically suitable
driving posture with a 40 kg upper body mass; when the subject is bent slightly forward, these
compressive forces have been found to increase to between about 650 N-1200 N 43, 51
. Thus, the
number of variables that have been found to influence WBV resonant frequencies and the forces
acting on vertebral bodies vary largely across occupational settings and are both vehicle- and
operator-dependent.
FE analyses have also been useful in determining which regions of the lumbar spine are
most susceptible to deterioration when exposed to WBV. Under cyclic, sinusoidal loading, it was
found that posterior regions of lumbar vertebral bodies are subjected to greater forces under
WBV than anterior regions 52
. Interestingly, this is in opposition to the widely-held view
regarding natural lumbar degeneration, which is believed to proceed from the anterior region
towards the posterior 53
. Additionally, FE analyses have indicated that facet joints on lumbar
vertebral bodies may be of increased risk of deterioration when dynamically exposed to vertical
WBV compared to static loading 52
. Facet contact forces were also found to increase with
increasing frequency as well as with intervertebral disc degeneration and/or removal 54
.
Cadaveric experiments have also been conducted to determine the effects of WBV on
vertebral segments. One such experiment determined individual lumbar segments to have
resonant frequencies near 5 Hz 55
. Intradiscal pressure was also found to be greatly dependent on
posture, increasing when leaning forward 56
. Seat to vertebrae vibration and pressure
transmission in these cadaveric experiments was found be highest at about 5-7 Hz 56, 57
. In

10
analyzing these cadaveric results, it must be noted that many biological functions, not the least of
which are muscle contraction and thermostasis, which could alter vibration characteristics are not
present 56, 57
.
1.5 Problem Statement and Proposed Solution
As discussed previously, LBDs are amongst the most common occupational health
hazards. A leading risk factor for the onset and development of LBDs in the workplace is WBV.
Though an exposure-response relationship between WBV and LBDs has been well established,
the exact causal pathway for onset of LBDs from WBV is not clearly understood. This is both
due to a wide array of ergonomic and occupational variables associated with vehicle-related
WBV and due to the anatomic complexity of the spine.
Based on previous work, the causal relationship between WBV and LBDs has been well
established; therefore, attempting to determine the etiological implications thereof is one logical,
next step in better understanding occupational WBV as a whole. Collecting occupational WBV
exposures from real-world settings, using this data to apply realistic, occupational vibration
signatures to human spinal segments, and attempting to analyze and characterize the impact of
the biomechanical loading on the tissues could be of great utility in understanding the
relationship between WBV and LBDs. The experiment upon which this thesis is based used
field-collected WBV signatures to impart occupational vibration exposures on cadaveric tissues.
Occupational vibration exposures were collected in King County Metro buses, processed, and
played into a vibration shaker platform upon which subjects were seated. Movement of the
subjects’ sternum relative to the seat was then calculated for these subjects and these calculated
displacements were then used to guide ex vivo loading experiments of intervertebral discs. By

11
relating WBV to true-to-life exposures, hopes are that these experiments will be used to better
understand the physiological and biomechanical implications of occupational WBV on LBDs,
particularly with respect to different types of vibration exposures.
This may be one of the first experiments to use occupationally collected WBV exposures
to impart biomechanical loads on human cadaveric functional spinal units in a controlled
laboratory setting. As such, no known protocols and procedures were in place prior to the start of
this project. Additionally, previous studies outlining disc injury as a result of repeated cycling
relied on radiography to determine the extent of disc injury or migration of nuclear material into
the annulus of the intervertebral disc 58-60
. This project sought to develop an alternative and more
cost-effective means to outline progression of disc deterioration and damage. As stated
previously, the nature of occupational disc injuries has not been well documented and the
progression thereof is not particularly well understood. Specifically, it is not known if
progression of injury as a result of WBV exposure extends from the exterior of the intervertebral
disc towards the interior or progresses from the interior of the disc towards the exterior. Prior
studies examining the loading responses of vertebral segments have identified an outwardly-
progressing disc pathology, however, the discs’ response to WBV signatures is of yet unknown
58, 59 For this project, a testing protocol was developed based on the assumption that injury
progresses away from the most-pressurized region of the disc, i.e. away from the location of
nucleus pulposus. As such, an attempt was made to verify that this assumption is in fact valid
without necessarily bringing the validity of the view that disc injury progresses inwardly into
question.
Based on the above, the objectives of this experiment were as follow:
1. Develop a protocol by which occupational WBV exposures can be translated into a

12
laboratory setting for testing on human cadaveric specimens.
2. Develop a non-radiographic protocol by which injuries induced during laboratory testing can
be traced.
3. Determine which of two exposures – one with a higher amplitude of vibration and one with a
more continuous cycle of vibrations – is comparatively more injurious to the lower back.
4. Determine what types of injuries and/or damage to the vertebral column can be seen as a
result of the different spinal loading protocols.
5. Determine the progression of disc related deterioration, if any is induced during cycling.
1.6 Thesis Overview
This thesis consists of 6 chapters and is organized as follows. Chapter 2 outlines the
process by which occupational exposure data was collected and analyzed. Chapter 3 details the
methods and results of preliminary ex vivo experimentation and revisions to the testing protocol.
Chapter 4 discusses results from ex vivo experimentation after finalizing a testing protocol from
the preliminary tests. Chapter 5 discusses major findings from Chapter 4, summarizes all
pervious chapters, and details limitations of the experiment as well as improvements to be
considered for a second-generation of experiments.

13
CHAPTER 2: Vibration Data Collection and Processing
2.1 Vibration Data Collection and Processing Overview
This chapter discusses the methods and protocols used in obtaining WBV signatures to be
used in subsequent laboratory testing on human cadaveric specimens. Occupational WBV data
was collected in King County Metro buses at the vehicle seat and floor by Ryan Blood, a Ph.D.
student in the University of Washington’s Department of Environmental and Occupational
Health Sciences (henceforth referred to as “Blood”). Because sternum vibration data was not
collected during this initial round of data collection, the data from the buses was to be used in
conjunction with a computational mathematical model to predict the response of the drivers’
sternums to vibrations. Blood later collected vibration data at drivers’ sternums using a hydraulic
shaker platform using the bus data as inputs. This data was processed to extract the displacement
response of individual intervertebral discs to vibrations and verified using the computational
mathematical model. This extracted data was used in the laboratory experiments detailed in later
chapters. An overview of the process described in this chapter is shown in Figure 2.1.
Figure 2.1 Overview of data collection and processing.
Collect WBV data on buses
Input WBV bus data into
shaker platform
Convert acceleration
data to displacements
Extract vibration
signatures of interest
Verify results using
mathematical model

14
2.2 Bus and Shaker Data Collection
Occupational WBV data was first collected in the field WBV data and then the WBV
data was inputted into a six-degree of freedom hydraulic shaker platform. This input data for the
shaker platform as well as the data from the shaker platform were collected by colleagues. What
follows is a description of the data collection process as outlined by Blood who helped
coordinate both cycles of data collection. Methods from the bus data collection have previously
been published 3.
Figure 2.2 Standardized route used in data collection.
WBV field data was collected on a bus (13.9m long bus; New Flyer; Winnipeg,
Manitoba, Canada) as a driver traversed a standardized route spanning the greater Seattle area
Map Legend
Start of route (heading NW)
End of route (heading SE)
City street segment
New freeway segment (I90)
Speed bump segment
Old freeway segment (I5)
15
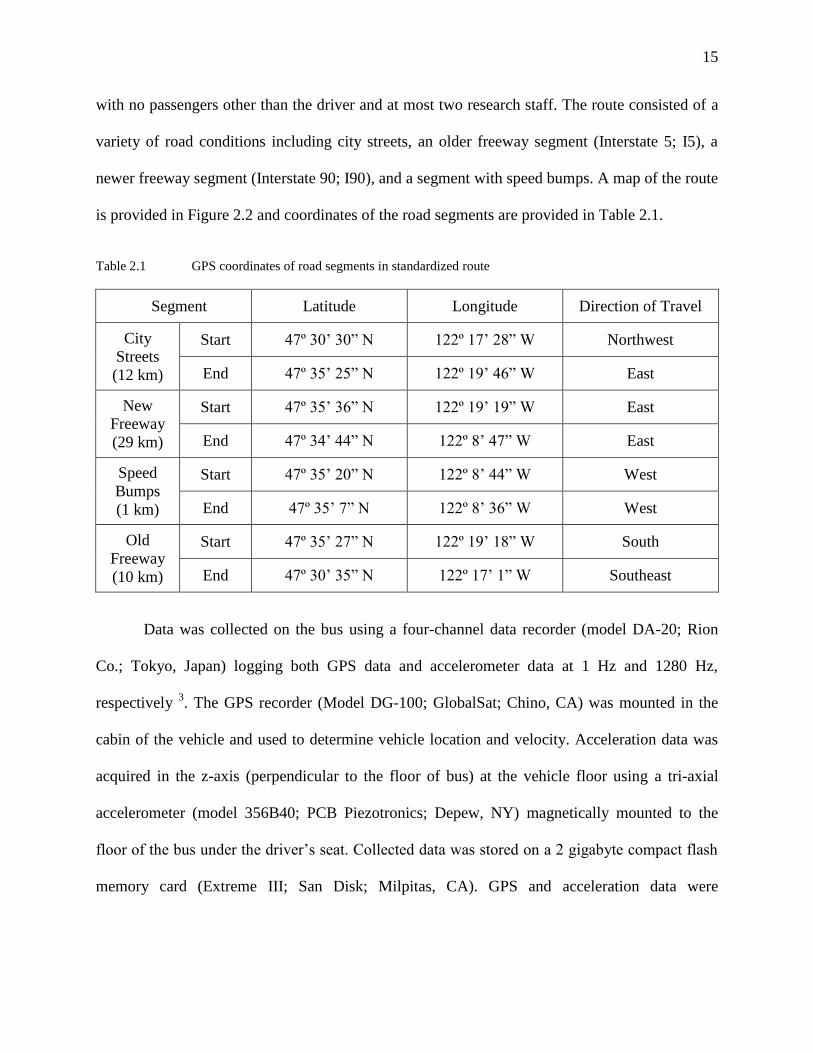
with no passengers other than the driver and at most two research staff. The route consisted of a
variety of road conditions including city streets, an older freeway segment (Interstate 5; I5), a
newer freeway segment (Interstate 90; I90), and a segment with speed bumps. A map of the route
is provided in Figure 2.2 and coordinates of the road segments are provided in Table 2.1.
Table 2.1 GPS coordinates of road segments in standardized route
Segment Latitude Longitude Direction of Travel
City
Streets
(12 km)
Start 47º 30’ 30” N 122º 17’ 28” W Northwest
End 47º 35’ 25” N 122º 19’ 46” W East
New
Freeway
(29 km)
Start 47º 35’ 36” N 122º 19’ 19” W East
End 47º 34’ 44” N 122º 8’ 47” W East
Speed
Bumps
(1 km)
Start 47º 35’ 20” N 122º 8’ 44” W West
End 47º 35’ 7” N 122º 8’ 36” W West
Old
Freeway
(10 km)
Start 47º 35’ 27” N 122º 19’ 18” W South
End 47º 30’ 35” N 122º 17’ 1” W Southeast
Data was collected on the bus using a four-channel data recorder (model DA-20; Rion
Co.; Tokyo, Japan) logging both GPS data and accelerometer data at 1 Hz and 1280 Hz,
respectively 3. The GPS recorder (Model DG-100; GlobalSat; Chino, CA) was mounted in the
cabin of the vehicle and used to determine vehicle location and velocity. Acceleration data was
acquired in the z-axis (perpendicular to the floor of bus) at the vehicle floor using a tri-axial
accelerometer (model 356B40; PCB Piezotronics; Depew, NY) magnetically mounted to the
floor of the bus under the driver’s seat. Collected data was stored on a 2 gigabyte compact flash
memory card (Extreme III; San Disk; Milpitas, CA). GPS and acceleration data were

16
synchronized during post-processing. The accelerometer was calibrated prior to data collection
and had a working bandwidth between 0.5 Hz and 1 kHz.
Initially, the experimental plan was to use the vibration data from the bus seat in
conjunction with a computational mathematical model to predict the response of the torso and
sternum to vibrations. This mathematical model is detailed in section 2.4 of this writing. The
mathematical model was to be relied upon because only vibration accelerations at the seat and
floor of buses had been collected – the driver was not instrumented with accelerometers or other
instrumentation that could measure and detect the spine’s response to vibrations. However, after
the seat vibration data was collected in the field setting, Blood subsequently collected WBV data
when subjects sat in the same seat used in the bus field data collection and were subjected to the
field-collected vibrations using a hydraulic shaker platform. In addition to measuring the floor
and seat measured accelerations while on the shaker platform, subjects were also outfitted with a
tri-axial accelerometer mounted over the sternum. This sternum-collected vibration data was
processed for the experimental cycling protocol and the results were compared with the
computational mathematical model. The processing of results from this data collection is detailed
in section 2.5 and the comparison with the mathematical model is described in detail in section
2.4. A brief description of Blood’s shaker collection protocol is provided below.
Blood used the floor accelerations from the bus as inputs into a six-degree of freedom
hydraulic shaker platform (model Standard; Moog Inc.; Kirkland, WA). In total, 13 different
vibration signatures were played into the shaker platform to simulate road and vehicle
conditions. Three of the inputs were from the collected bus vibration data. The 13 input signals
are detailed in Table 2.2. 12 male subjects were seated in an industry-standard mechanical seat
with an air suspension system (model Q91; USSC Seating; Exton, PA) which was securely fixed

17
to the top of the platform. The 13 input vibrations were generated while the drivers were seated
on top of the platform. Tri-axial accelerometers identical to those used in the bus data collection
were mounted to the base of the platform, the seat top, and to the chest of each subject, using a
magnet, an ICP seat pad, and an elastic band secured to the subject’s chest, respectively. The
floor accelerometers were used to validate the fidelity of the shaker platform. The experimental
setup is illustrated in Figure 2.3 on the next page. An eight-channel data recorder (model CoCo
80; Crystal Instruments; Santa Clara, CA) was used to log the acceleration at a rate of 1280 Hz.
Additional information regarding the subjects is provided in Table 2.3.
Table 2.2 Input signals for shaker table
Signal From Bus
Vibration Data?
Used for Data
Processing? Signal Description
Duration
(Seconds)
1 0.1 Hz, 100 mm amplitude sinusoid 40
2 No signal (break 1) 7
3 3 Hz, 3 mm amplitude sinusoid 40
4 No signal (break 2) 7
5 5.5 Hz, 1.5 mm amplitude sinusoid 40
6 No signal (break 3) 7
7 8 Hz, 0.5 mm amplitude sinusoid 40
8 No signal (break 4) 60
9 City streets input 180
10 No signal (break 5) 60
11 Smooth freeway input 180
12 No signal (break 6) 60
13 Rough freeway input 180
18
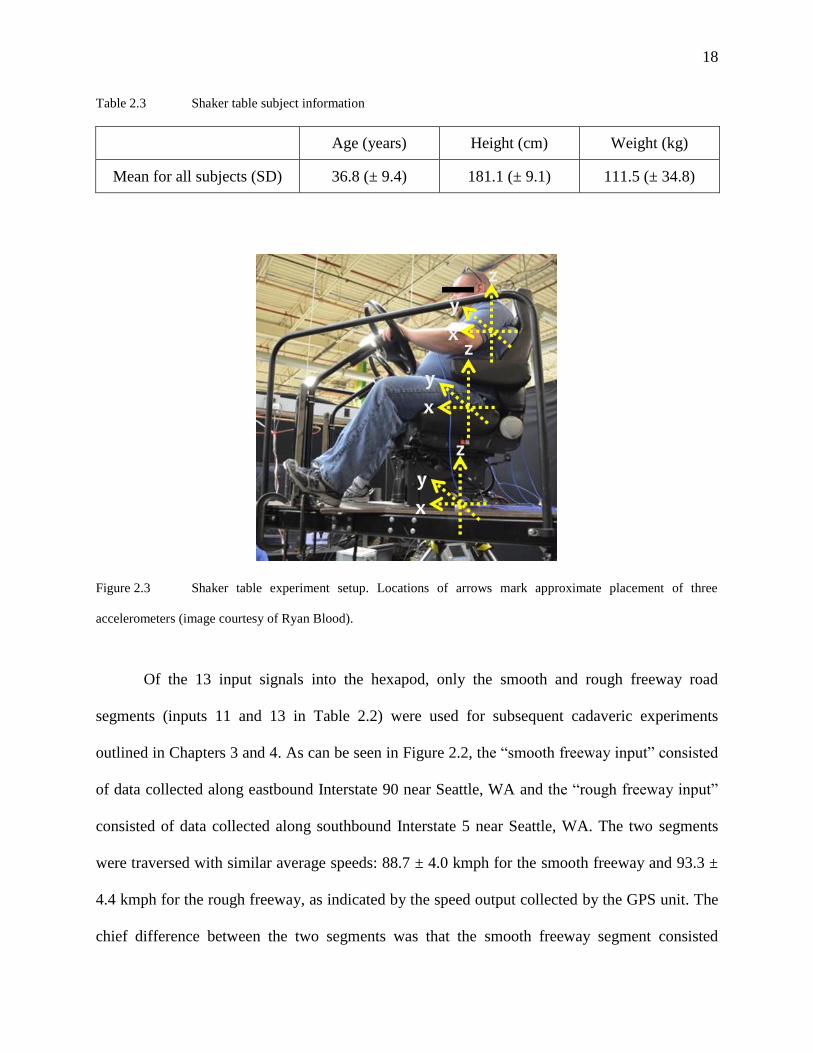
Table 2.3 Shaker table subject information
Age (years) Height (cm) Weight (kg)
Mean for all subjects (SD) 36.8 (± 9.4) 181.1 (± 9.1) 111.5 (± 34.8)
Figure 2.3 Shaker table experiment setup. Locations of arrows mark approximate placement of three
accelerometers (image courtesy of Ryan Blood).
Of the 13 input signals into the hexapod, only the smooth and rough freeway road
segments (inputs 11 and 13 in Table 2.2) were used for subsequent cadaveric experiments
outlined in Chapters 3 and 4. As can be seen in Figure 2.2, the “smooth freeway input” consisted
of data collected along eastbound Interstate 90 near Seattle, WA and the “rough freeway input”
consisted of data collected along southbound Interstate 5 near Seattle, WA. The two segments
were traversed with similar average speeds: 88.7 ± 4.0 kmph for the smooth freeway and 93.3 ±
4.4 kmph for the rough freeway, as indicated by the speed output collected by the GPS unit. The
chief difference between the two segments was that the smooth freeway segment consisted

19
mostly of even, unpatched road while the rough freeway segment consisted of a freeway with
expansion joints. These expansion joints, distanced about 50 m (about 2 seconds in driving time)
apart, imparted impulses to the driver that made the otherwise similar road signatures very
different. The two segments are further detailed in Table 2.4. The seat and chest acceleration data
from the hexapod subjects were converted to displacements and used to analyze vibration
signatures for the smooth and rough freeway inputs.
Table 2.4 Segments used in post-shaker table analysis
Hexapod
Input Signal Segment Latitude Longitude
Direction
of Travel
11 Smooth freeway
(12 km)
Start 47º 35’ 15” N 122º 13’ 55” W South
End 47º 34’ 40” N 122º 12’ 28” W South
13 Rough freeway
(29 km)
Start 47º 34’ 30” N 122º 19’ 12” W Southeast
End 47º 33’ 15” N 122º 19’ 7” W Southeast
2.3 Triple Filter, Double Integration Approach
2.3.1 Overview of Approach
Standards for WBV data collection are based on the acceleration encountered and not
displacement profiles 38, 39, 61
. For the inputs to be used in the proposed experimental cycling to
human cadaveric spinal segments, displacement values were needed as required for inputs to the
servohydraulic testing equipment used. Therefore, for the cycling experiments, a method was
needed to convert the experimental acceleration data to displacement data. Formulaically, the
velocity and displacement of a body can be determined from a single and double integration,
respectively, of its acceleration 62
:

20
( ) ( ) ∫ ( )
( )
( ) ( ) ∫ ( )
( )
Where the variables “a,” “v,” and “d” symbolize acceleration, velocity, and displacement,
respectively while “t” represents values in the time domain and “τ” represents a dummy
integration variable. Apparent from both eq. (1) and eq. (2) is that to accurately calculate velocity
and displacement from acceleration, initial values of velocity and displacement are needed 62
.
When working with discretely collected acceleration data, however, initial values for velocity
and displacement cannot be extracted from acceleration data – the acceleration only provides a
measure of change in regards to initial velocity which, in turn, only provides a measure of
change in regards to displacement. Additionally, formulas such as those in eq. (1) and eq. (2) are
extremely difficult to apply to discretely collected data with no formulaic basis (such as the data
collected from the buses and the hydraulic shaker platform). Therefore, the method of calculating
displacement from acceleration data discussed henceforth does not require knowledge of the
initial state of the accelerating body and does not rely on the application of formulas for the
conversion of acceleration data.
To calculate displacement from acceleration data, three stages of high-pass filtering were
used in conjunction with two stages of integration. First, the raw acceleration data was filtered
using a high-pass filter and the filtered acceleration data was integrated to calculate velocity.
This velocity data was then filtered using a high-pass filter and the filtered velocity data was
integrated to calculate displacement. Finally, the displacement data was filtered using a high-pass
filter to produce the desired result. The high-pass filters were used to account for accelerometer
drift, DC biases, and the lack of initial conditions. Accounting for DC bias was of particular
interest as any constant gain from a signal gets compounded during integration, thereby causing

21
miscalculations. A block diagram of the triple-filter-double-integration (TFDI) process is shown
in Figure 2.4. All integrals in the triple-filter-double-integration process were calculated using a
Riemann sum approximation via the trapezoidal rule across each data point. An 8th
order dual-
pass Butterworth high-pass filter (4th
order each pass) with a cutoff of 0.5 Hz was used in
filtering. A high filter order was chosen so filter settling time would be minimal and a
Butterworth filter was used to have zero gain or loss of signal in the passbands. A dual-pass filter
was used so filtering did not introduce a phase shift during any iteration of filtering. High-pass
filtering allowed for acceleration data to be integrated numerically without relying on formulas.
Figure 2.4 Overview of triple-filter-double-integration (TFDI) process.
2.3.2 Validation of Approach
To determine the effectiveness of the TFDI process in accurately converting acceleration
signals to displacement values, a servohydraulic testing system was used. A tri-axial
accelerometer identical to that used in prior data collection was magnetically mounted to the
actuator of a servohydraulic testing system (model 810; MTS; Eden Prarie, MN). Uniaxial (z-
axis) acceleration data was logged using a 8-channel data collection system (model DA-40; Rion
Co.; Tokyo, Japan) for about 1 min at 1280 Hz as the MTS’s actuator oscillated at two different
peak-to-peak amplitudes (0.2 mm and 2 mm) at each of three different frequencies (0.5 Hz, 1.5
Hz, and 3 Hz). This acceleration data was then processed using the TFDI process to extract the
High-pass filter on
acceleration data
Numerical integration
High-pass filter on
velocity data
Numerical integration
High-pass filter on
displacement data

22
displacement of the actuator. The results from this extraction are shown in Figure 2.5 on the next
page (please note that to account for filtering effects and filter roll-offs, the data shown is from
the 30 second mark in data collection onwards). For reference, also shown in Figure 2.5 are
computer-generated sinusoids of the expected amplitude and frequency.
The calculated displacement data was also processed using a computer software
algorithm to detect local minima and maxima of each of the six displacement signals by first
numerically finding the derivative of the signal and then finding zero crossings of this derivative.
This peak detection algorithm (henceforth referred to throughout this thesis thusly) was used to
determine both the peak-to-peak amplitude and the duration between each successive minima
and maxima of the calculated displacement data sets. To account for filtering settling effects
from roll-offs of the passband, the first 10 seconds of each data set were excluded in calculations
and 40 seconds thereafter (50 seconds into the data collection) were used as an end time. The
amplitude and time calculations from the peak detection algorithm were then used to determine
the accuracy of the TFDI approach, as detailed in Table 2.5.
Table 2.5 Results of TFDI validation calculations
Run Expected
Frequency
Expected
Amplitude
Calculated
Frequency
Percent Error
Frequency
Calculated
Amplitude
Percent Error
Amplitude
A 3 Hz 2 mm 3.00 Hz < 1% 2.00 mm < 1%
B 1.5 Hz 2 mm 1.50 Hz < 1% 1.96 mm 2.1%
C 0.5 Hz 2 mm 0.56 Hz 11.9% 0.15 mm 92.5%
D 0.5 Hz 0.2 mm 1.16 Hz 132.8% 0.03 mm 83.8%
E 1.5 Hz 0.2 mm 1.50 Hz < 1% 0.19 mm 3.1%
F 3 Hz 0.2 mm 3.00 Hz < 1% 0.20 mm < 1%

23
Figure 2.5 TFDI calculations and validation. A: 3 Hz, 2 mm amplitude; B: 1.5 Hz, 2 mm amplitude; C: 0.2
Hz, 2 mm amplitude; D: 0.2 Hz, 0.2 mm amplitude; E: 1.5 Hz, 0.2 mm amplitude; F: 3 Hz, 0.2 mm amplitude
0 0.5 1 1.5
-2
-1
0
1
time (secs)
am
plit
ude (
mm
)
AExpected waveform Calculated waveform
0 0.5 1 1.5 2 2.5 3
-2
-1
0
1
time (secs)
am
plit
ude (
mm
)
BExpected waveform Calculated waveform
0 0.5 1 1.5 2 2.5 3
-2
-1
0
1
time (secs)
am
plit
ude (
mm
)
CExpected waveform Calculated waveform
0 0.5 1 1.5 2 2.5 3
-0.2
-0.1
0
0.1
time (secs)
am
plit
ude (
mm
)
DExpected waveform Calculated waveform
0 0.5 1 1.5 2 2.5 3
-0.2
-0.1
0
0.1
time (secs)
am
plit
ude (
mm
)
EExpected waveform Calculated waveform
0 0.5 1 1.5
-0.2
-0.1
0
0.1
time (secs)
am
plit
ude (
mm
)
FExpected waveform Calculated waveform

24
Apparent from both Figure 2.5 and Table 2.5 is the accuracy of the TFDI approach in
determining displacement when frequencies are within the working range of the accelerometers
used (note that, as discussed previously, the working range for the accelerometers used was 0.5-
1000 Hz). For both data sets with a 0.5 Hz frequency, the TFDI approach was unsuccessful in
determining the amplitude of the vibrations. For only one of the two cases was the frequency
detected but only with moderate success (run C - 0.5 Hz and 2 mm amplitude). This emphasizes
the importance of understanding the working range for instruments used when employing the
TFDI. Meanwhile, the TFDI very accurately calculated both the displacement and frequency for
all other runs of data. It should be noted that the frequencies and amplitudes used in these
calculations are in a similar range to those used in ex vivo experiments discussed later. Based on
these results, it can be concluded that the TFDI approach allowed for an accurate calculation of
displacement values from acceleration data provided the frequency content of the data of interest
lies within the working range of the accelerometers used.
2.4 Isolation of Road Features of Interest
For the laboratory cycling experiments, two different road signatures of interest were
sought for comparison. As stated previously, the hexapod data collection process used three road
signatures from the occupational data collection – a smooth freeway segment, a rough freeway
segment, and a city street segment. Though other road segments from the occupational data
collection could have been used for the laboratory cycling experiments, determining the response
of the torso to simulations would have relied solely on a mathematical model without validation
from the sternum data from the hexapod data collection. Therefore, to allow for comparison with
collected data, it was decided that the two road segments for the laboratory experiments be

25
amongst the three used as inputs for the hexapod. Amongst the three occupational inputs into the
hexapod, the smooth and rough freeway segments (henceforth referred to as the “freeway” and
“expansion joint” inputs, respectively) were selected because of the relative similarities in the
speed at which the segments were traversed as well as the differences in the vibrations imparted
to the drivers as a result of the expansion joints. Therefore, the hexapod outputs for the freeway
and expansion joint segments were selected for processing for use in the subsequent laboratory
experiments with hopes of isolating a continuous exposure signature from the freeway segment
and a more impulsive exposure signature from the expansion joint segment.
The freeway segment and the expansion joint segment both provided 180 seconds of data
from which features and regions of interest needed to be selected for further processing. From
the GPS data of the floor accelerations, two regions from the smooth freeway data set (25 and
12.5 seconds in length) were isolated which were traversed at a fairly constant speed with a
consistent acceleration profile at the vehicle floor. The floor acceleration signals of these
segments were also checked to ensure no acceleration values greater than 5 m/s2
were present. In
addition to this, four expansion joints (at about 9, 18, 50, and 90 seconds into the route) were
isolated from the expansion joint data set. The location of these expansion joints were verified
based on GPS data collected during the occupational data collection and the acceleration profiles
of the expansion joints from the floor of the bus were checked to ensure no impulses greater than
5 m/s2 were present within 1.5 seconds before and after the expansion joint of interest. The
expansion joints were found to impart acceleration impulses greater than 5 m/s2 while the regions
of the freeway without expansion joints generally had acceleration values less than 5 m/s2
. The
selected expansion joints were chosen such that the impulse imparted to the vehicle from the
expansion joint and the subsequent oscillations reached pre-impulse levels prior to the vehicle

26
encountering the next expansion joint. The six time frames (2 regions of the smooth freeway and
4 expansion joints) were thus selected as the features of interest to be used in the data processing
for the laboratory experiments.
2.5 Mathematical Model of Vibration Response
2.5.1 Description
As stated previously, because sternum acceleration data of subjects exposed to WBV was
not initially available for use, a mathematical model was developed to allow for determining
sternum responses to seat accelerations. Although sternum data later became available for use,
the mathematical model was nevertheless developed to predict and verify the results that would
eventually be extracted from the shaker table data collection. The vibration response of the seat-
sternum system was mathematically modeled using a two-parameter mass-spring-damper
mechanical model consisting of two components – one component modeling the vibration of the
buttocks of the seated subjects and the other component to modeling the vibration of spine from
the sacrum to the sternum. Both components consisted of a parallel mass-spring-damper system
as shown in Figure 2.6 but with differing spring and damping coefficients, as determined from
literature 63, 64
. The mathematical derivation of the model follows.
Figure 2.6 Mass-spring-damper mechanical model. M, Z, F, d, and k represent the mass, vertical
displacement, input force, damping coefficient, and spring coefficient of the system, respectively.
M
d k
+Z
F

27
If the forces related to the mass, dashpot, and spring are Fm = Mz”, Fd = dz’, and Fs = kz,
respectively, where single and double apostrophes indicate first and second derivatives of the
position (z). Then, the sum of forces can be expressed as:
∑
∑
Dividing the above terms by mass to get F/M (acceleration) gives:
Substituting for damping ratio (ζ) and natural frequency (ω) with
√
and
√ then yields:
( )
2.5.2 Model Results
The differential equations associated with eq. 3 were then used with mathematical
computing software (Matlab R2009, Mathworks, Natick, MA) to predict the response of the
buttocks and the segment of the spine between the thighs and sternum to the floor accelerations.
Seat pan acceleration data from the two vibration signatures for each subject was inputted into a
differential equation solver which predicted the displacement response. This was performed to
model both the buttocks and the individual intervertebral disc response to the input acceleration.
Model parameters for the buttocks and spine model are given in Table 2.6. For the spine, the

28
natural frequency was calculated by summing the spring constant of the intervertebral discs
across 7 equivalent segments. 7 equivalent segments were used because from sacrum to the
sternum, 8-10 intervertebral discs are present, of which 5 are lumbar discs while the remainder
are from the thoracic region of the spine. Compared to the thoracic intervertebral discs, lumbar
discs are larger and better suited for bearing loads 30
. The larger size of the lumbar intervertebral
discs enables greater tensile and compressive displacement compared to the thoracic
intervertebral discs. Additionally, ribs are also present on all thoracic vertebrae, many of which
are connected to adjacent ribs via cartilage linkages. These ribs further decrease the mobility of
thoracic intervertebral discs. Therefore, to account for the decreasing mobility of intervertebral
discs as one moved up the spine, the displacement values were divided across 7 equal segments.
Displacement simulations were conducted for each of the 12 hexapod subjects for 180 seconds of
seat acceleration data from both the freeway and expansion joint road segments.
Table 2.6 Mathematical model parameters
Stiffness (k) Damping (d) Damping
Ratio (ζ)
Natural
Frequency (ω)
Buttocks 64
8500 N/m 35 Ns/m 0.01 0.624 rad/s
(3.92 Hz)
Intervertebral
Discs 63
50000 N/m Only ζ used 0.15
0.572 rad/s
(3.59 Hz)
Once displacement data had been calculated for both the buttocks and the intervertebral
discs from the simulations, the data needed to be processed to extract the amplitude of the
displacements. For each of the four expansion joints, the mean peak-to-peak was calculated
displacement for each subject and then an average displacement was calculated for the 12

29
subjects. For the freeway segments of interest, twice the root mean square displacement was
calculated and averaged across the 12 subjects. The results of these calculations for both the
buttocks and the intervertebral discs are presented in Table 2.7. Of note is the much larger
displacement amplitude seen for the expansion joints compared to the freeway segments.
Table 2.7 Mathematical model results
Freeway Segments (RMS) Expansion Joints (peak)
Buttocks 1.44 mm 1.58 cm
Intervertebral disc 0.25 mm 2.18 mm
2.6 Analytical Results
Once a mathematical model had been developed, the data from the hexapod was
processed to extract the response of the spine to the input vibrations. The acceleration data from
both the seat and the sternum was first converted to displacement data using the TFDI approach.
After this, the same 6 regions of interest (2 freeway segments and 4 expansion joints) discussed
in section 2.3 were isolated from the displacement data for the seat and sternum. Local minima
and maxima for the displacement data were then found using the peak detection algorithm
discussed in section 2.3.2 for each expansion joint and each driver at the sternum and seat (96
waveforms total – 48 at the sternum and 48 at the seat). Once the local minima and maxima
(peaks) of each of the four expansion joints had been detected for each subject, a composite
waveform was created for each of the expansion joints by averaging the time and amplitude of
the peaks at both the seat and the sternum across all 12 subjects. From four these composite
expansion joint waveforms for the seat and the sternum, the peak-to-peak amplitudes from each
local maxima to local minima and from each local minima to local maxima were determined.

30
Similarly, the duration in time from each local maxima to local minima and from each local
minima to local maxima were calculated. The average of these values at the seat and at the
sternum were then calculated across all subjects and used to calculate the expansion joint
vibration signatures for both the seat and the sternum presented in Table 2.8. Note the
similarities in the frequency response of the seat and sternum.
Table 2.8 Expansion joint seat to sternum signatures
Location Frequency Amplitude
Seat 2.73 Hz 9.4 mm
Sternum 2.71 Hz 36.3 mm
The vibration signatures for the freeway segments were calculated using a similar
protocol. First, the acceleration data at the seat and at the sternum for each subject and each of
the two freeway regions of interest was converted to displacement data using the TFDI approach.
The displacement data was then filtered using an 8th
order dual-pass Butterworth low-pass filter
(4th
order each pass) with a cutoff of 30 Hz to remove high frequency noise from subsequent
calculations. The 30 Hz cutoff was chosen based on ongoing spectral analysis work that has thus
far indicated that most energy from WBV vehicle signals is between 0-15 Hz with little above 30
Hz in the direction perpendicular to the vehicle floor. After filtering, the peak detection
algorithm discussed in section 2.3.2 was used to detect local minima and maxima at both the seat
and sternum for each of the subjects and for each of the two freeway regions (450 total seconds
of freeway data). The mean of twice the root mean square of the displacement amplitude values
and the average time between successive peaks in the signal were then used to find the frequency

31
and amplitude of the freeway vibration signatures. The results are detailed in Table 2.9. Note the
similar frequency and the smaller amplitude compared to the expansion joints.
Table 2.9 Freeway seat to sternum signatures
Location Frequency Amplitude
Seat 2.43 Hz 2.6 mm
Sternum 2.59 Hz 6.4 mm
Once the freeway and expansion joint signatures had been calculated, signatures to be
during the experimental cycling needed to be determined. First, the values of the displacement of
the glutes/buttocks from the mathematical model were subtracted from the analytical results for
the freeway and expansion joints. This calculation provided the displacement of the spine from
the sacrum to the sternum. These results were then divided by 7 to again account for the
anatomic variability of the spine and to give the displacement signatures of the intervertebral
discs. Because the freeway and expansion joint segments had relatively similar frequencies of the
two road types, a 2.5 Hz frequency was used for both signatures. The resulting values as well as
predictions from the mathematical model are provided in Table 2.10.
Table 2.10 Signatures used at start of preliminary tests
Location Model Frequency Amplitude
Freeway
Analytical 2.5 Hz 1.60 mm
Mathematical - 2.18 mm
Expansion Joints
Analytical 2.5 Hz 0.34 mm
Mathematical - 0.25 mm

32
In general, the mathematical model provided displacement amplitude values that were
similar to those extracted from the experimental model. Both indicated an amplification of the
seat accelerations at the sternum and both indicated much higher displacement values for the
expansion joints than the freeway segments. Due to the desire to use data that was as
representative of occupational exposures as possible, the analytical model results were used as
the input signatures for the experimental cycling. The degree to which these values were
modified/altered for the final round of experiments is discussed in the next chapter.

33
CHAPTER 3: Preliminary Study and Protocol Refinement
3.1 Preliminary Study Overview
A preliminary laboratory study was conducted prior to the final laboratory study. The
purpose of the preliminary study was to finalize a laboratory protocol for loading human cadaver
functional spine units (FSUs) with displacement signatures representative of continuous and
impulsive occupational WBV exposures. As stated previously, this project was the first of its
kind to use occupational WBV exposures in order to study spinal loading biomechanics in a
laboratory setting. As such, protocols and procedures for doing so were nonexistent at the start of
the project and needed to be developed. Prior to the start of the project, it was understood that
developing and perfecting these protocols would require multiple iterations of specimen testing.
Therefore, the purpose of the preliminary study was to use suboptimal human cadaver FSUs to
iteratively develop the testing protocol prior to conducting the final laboratory tests.
Within the realm of perfecting the final testing protocol, the preliminary study had five
main aims. These aims are as follow:
1. Outline final cycling signatures in terms of frequency, displacement, and number of
cycles. Although processing signals from the shaker table data collection did provide
frequencies and displacements of interest, the response of human tissues to these
signatures still needed to be tested. Also, the number of cycles for each signature had to
be determined.
2. Develop and test a method by which disc damage could be traced. One of the aims of
this project was to develop a method of outlining disc damage which did not rely on
radiography. This method needed to be tested prior to use in the final experiments.

34
3. Determine what types of damage occurs in the intervertebral discs and vertebral bodies
as a result of the cycling protocol. Prior studies examining disc loading and/or cycling
had reported migration of the nucleus, deterioration of the annulus, and/or endplate
fracture 31, 58, 59
. It was not known what types of damage, if any, would occur in the
intervertebral discs and vertebral bodies as a result of the extended cycling procedures.
4. Outline progression of disc damage. As stated previously, it was not known whether
damage to the disc, if present, progressed from the interior of the intervertebral disc
outward or from the exterior of the disc inward. The injury tracing protocol was
developed under the assumption that damage progressed from the region of highest to
lowest pressure (outward from the interior of the disc). It remained to be seen whether
disc damage could be traced when the FSUs were subjected to extended continuous and
impulsive cycling.
5. Determine whether FSUs from older human cadavers could be used. The cadaveric
disc specimens to be used came from a tissue bank. For the most part, these disc
specimens were from elderly donors and, as a result of gradual deterioration throughout
the donor’s lifetime, many of the vertebrae and intervertebral discs were not in their
healthiest state. The injury tracing technique relied on the disc being intact and able
maintain a nominal level of intradiscal pressure. The ability of the tracing technique to
outline damage in discs which did not maintain pressure needed to be examined.
3.2 Specimen Preparation
For both the preliminary tests and the final experiments, whole human lumbar spine
segments (T1-S5) were received frozen from a tissue bank (ScienceCare Inc; Phoenix, AZ) and
stored in a freezer at -20º C. Functional spinal units (FSUs) of interest were extracted from the
35
spine segments by cutting through the intervertebral discs superior and inferior to the FSU of
interest. All remnants of these sliced intervertebral discs were then removed from the endplates
of the FSU of interest. Additionally, all ligamentous soft tissue, musculature, and bony structures
posterior to the pedicles of the vertebral body were removed from the FSUs using a scalpel and
bone saw, respectively. All extracted FSUs were dried, wrapped in a cloth, and stored in a
freezer at -20º C at all times during which they were not being prepared or tested; FSUs were
thawed prior to use by setting in a warm water bath for approximately 30 minutes.
Seven FSUs from 5 different spines were harvested for the preliminary study and
refinement of the protocol for the final experiments. The integrity of each intervertebral disc was
assessed by injecting an aqueous saline solution of 0.90% mass concentration of sodium chloride
into the nucleus pulposus using a 10 ml pressure inflator (Model 710-111 Leveen; Boston
Scientific; Boston, MA) and a 20 gauge needle. The injection site of the needle was marked on
the exterior of the intervertebral disc using a semipermanent marker. A disc was deemed intact if
it maintained an intradiscal pressure above 90 PSI with an injection of at most 3 ml of solution.
The 90 PSI value is in line with the high-pressure endpoint of 100 PSI used during discography
65, 66. The intradiscal pressure of each disc was monitored using the pressure inflator gauge for 2-
3 minutes to determine if a drop in pressure of more than 10 PSI occurs. Henceforth, discs will
be described as being either “intact” or “not intact” based on their ability to sufficiently maintain
intradiscal pressure above 90 PSI in the test described. Donor details and information on the
integrity of intervertebral discs used are provided in Table 3.1 on the next page.
After checking disc integrity, three metal screws were inserted through the cranial half of
the superior-most vertebral body and the caudal half of the inferior-most vertebral body of each
FSU. The screws were used to help stabilize the FSU in the PMMA mold. Henceforth, the

36
cranial half of the superior-most vertebral body and the caudal half of the inferior-most vertebral
body of each FSU will be referred to as “the potted region” of the FSU. The potted regions of the
FSUs were then embedded in polymethylmethacrylate (PMMA) such that the top and bottom of
each PMMA mold was near-parallel with the superior- and inferior-most endplates of the FSU.
An image of an embedded FSU is shown in Figure 3.1.
Table 3.1 Specimens used in preliminary studies
Specimen ID# Gender Age at Death Segments Used Disc Intact?
180 Male 27 years T11-T12 Yes
180 Male 27 years L1-L2 Yes
500 Male 49 years T12-L1 Yes
907 Female 66 years T12-L1 Yes
056 Male 72 years L2-L3 No
056 Male 72 years L4-L5 No
044 Female 61 years L2-L3 No
Figure 3.1 Embedded FSU as used in tests. View shows anterior side of disc. Pink and blue colors on exterior
of disc are from staining protocol outlined in section 3.2. Metallic structure above FSU is actuator of servohydraulic
testing system.

37
3.3 Stain Injection Protocol
Prior to performing the preliminary experiments, a two-part ink staining technique
needed to be developed to trace disc damage. The stains served two distinct purposes; one to
establish the preexisting condition of the disc and the second to trace damage imparted by the
exposure protocols. The first staining protocol was specifically designed to highlight the
preexisting location of the intervertebral disc’s nucleus pulposus and the preexisting condition of
the inner annulus fibrosis. The second stain was selected such that it could elucidate any new
damage to the disc or endplates while not masking the initial stain. Note that, as stated
previously, an assumption was made that intervertebral disc damage would progress from the
interior of the discs towards the exterior. As such, the developed technique sought to target
features that were in the interior of the intervertebral disc. It did not highlight damage that may
have progressed from the exterior of the annulus towards the interior of the disc. The technique
developed does not rely upon radiography-based inks or stains and provides a more efficient and
potentially cost-effective alternative to x-ray-based detection of nuclear material, as used in
previous studies 58-60
.
3.3.1 Stain Selection
Many different possible stains were identified and tested for their ability to achieve the
desired experimental effects and a combination of two stains was found that met the testing
requirements. These two stains were a 1% aqueous alcian blue solution (Electron Microscopy
Sciences; Hatfield, PA) and a 2.5% aqueous safranin-O solution (Sigma-Aldrich Corporation;
Saint Louis, MO). The selection of these stains was based predominantly upon a literature review
of prior staining techniques used to highlight features of the intervertebral disc, but not the
migration of the nucleus pulposus 67, 68
. However the targets of each of the stains allowed for a

38
combination of the two to be used with great effect for highlighting the before- and after-state of
the intervertebral discs used in the experiment. Safranin-O has been shown as an effective stain
for highlighting both collagen (as found in the inner annulus) and glycoproteins (as found in the
nucleus pulposus), staining both a bright red/pink color 69, 70
. Conversely, the alcian blue stains
glycoproteins, but not collagen, a bright blue color 71
. However, when the two stains are used
sequentially, collagen remains a red color and proteoglycans turn deep purple in color. Figure 3.2
demonstrates the effect of these stains by showing the same intervertebral disc sliced in thirds
and then stained with the safranin-O stain, the alcian blue stain, and sequentially using first
safranin-O stain followed by alcian blue stain. Note how safranin-O stains collagen and nuclear
material a red/pink color, alcian blue only stains nuclear material a blue color, and using both
sequentially results in collagen remaining red and nuclear material turning deep purple in color.
Thus, using two different stains in a sequential manner allowed for the coloring of the inner
annulus of the disc red (via the safranin-O stain) to trace preexisting damage to the annulus
fibers. The nucleus pulposus is first colored red (via the safranin-O stain) and is then turned a
blue/purple color (via the alcian blue) after being stained by both stains. This blue/purple allows
for the nucleus to be contrasted with the red color of the annulus fibers.
Figure 3.2 Before (left) and after (right) images of intervertebral disc stained three times. On right, clockwise
from bottom: area stained with safranin-O stain, area stained with alcian blue stain, and area stained first with
safranin-O and then with alcian blue stain. Approximate area of nuclear pulposus circled in yellow.
39
3.3.2 Stain Injections
Based on the ability of the stains used to target specific components of the intervertebral
disc, the following staining protocol was developed for highlighting the pre- and post-experiment
condition of the interior of the intervertebral disc. All injections were performed using a standard
10 ml plastic syringe and a 20 gauge needle using solely thumb pressure. Provided the
intervertebral disc is able to sufficiently able to maintain intradiscal pressure during injections,
all volumes of stain injected are with maximal thumb pressure. If the disc was unable to maintain
sufficient intradiscal pressure during injections, the stain would follow the path of least
resistance and flow outwardly towards the outer annulus rather than into the inner annulus and
nucleus pulposus. If this is the case, the inner annulus will remain unstained and damage to the
disc brought on during cycling cannot be adequately detected. This idea that the intervertebral
discs must maintain sufficient intradiscal pressure during injections was tested by using not
intact (as determined by the disc’s inability to maintain intradiscal pressure above 90 PSI) discs
during the preliminary tests. An overview of the staining protocol and the anticipated results
from each step is provided below.
1. Inject safranin-O stain into nucleus of intervertebral disc. This will outline the location of the
inner annulus while also seeping into any preexisting fissures of the collagen fibers that may
be present. Additionally, the safranin-O stain will also stain the nucleus pulposus a
preliminary red/pink color. It is assumed the safranin-O will remain in the inner annulus for a
sufficient period to stain the targets.
2. Allow time for the safranin-O stain to settle while also exposing the disc to low forces to
allow for collagen fibers to stretch and the stain to permeate to maximally stain target areas.

40
This part of the staining protocol was introduced while testing the fourth of the preliminary
test specimens, as detailed later in this writing.
3. Inject alcian blue stain into nucleus of intervertebral disc prior to exposure of FSU to the
desired vibration signatures. This will target solely the nuclear material, leaving the collagen
fibers red/pink from the safranin-O stain. When the alcian blue stain mixes with pre-existing
safranin-O, the nuclear material will turn deep purple in color. If the volume of alcian blue is
less than that of the safranin-O, the nucleus pulposus will take a light purple color, an effect
which can be rectified in future steps by injection of more alcian blue stain. If the volume of
the alcian blue is greater than that of the safranin-O, the nucleus will appear much darker in
color. Once the nucleus has been saturated with stain, any excess stain from the injections
will remain in the inner annulus and follow a path of least resistance from there.
4. Periodically, throughout the experiment, inject additional volumes of alcian blue stain into
the intervertebral disc nucleus to account for degeneration of the disc and a resulting
increased capacity of the intervertebral disc to hold volume.
5. The staining procedure allows for the identification of components of interest in the
following manner: all collagen fibers of the inner annulus and all preexisting fissures will be
a red/pink color; the nuclear material will be a deep purple color; any damage to the inner
annulus and any migration of the nucleus pulposus will be highlighted by the presence of a
bright blue or deep purple color without any red/pink present.
3.4 Overall Testing Protocol
For both the preliminary tests and the final experiments, the same general procedure was
used with only variations in the disc loading procedures between the preliminary and final tests.

41
Frozen, potted FSUs were thawed and first injected with the safranin-O stain. FSUs were then
placed in a warm water bath for between 5-20 minutes after which they were dried and placed on
the servohydraulic testing system (henceforth referred to as the “MTS”). The FSUs were
centered under the actuator in both the sagittal and coronal plane. The specimen was placed on
the MTS such that the direction of the MTS actuator’s movement was perpendicular to the FSU
endplates and the actuator would first contact the superior-most of the two vertebral bodies. The
alcian blue was injected into the intervertebral disc prior to the start of cycling and midway
through the cycling protocol. After cycling, the intervertebral disc was dissected along the
superior-most endplate using a scapula. The disc was then sectioned into slices 1-2 mm in
thickness from the superior to the inferior region of the disc.
The vibration signatures used during the preliminary tests were under modification
throughout the preliminary study. As such, the preliminary study will be grouped into 3 phases,
each with variations in how specimens were cycled. Specifics of the cycling protocols and the
manner in which they were refined are detailed next.
3.5 Preliminary Study Inputs, Results, and Refinements
3.5.1 Phase 1 of Preliminary Study
For the first phase of the preliminary study, 4 specimens were used. 1 specimen was
exposed to the freeway cycling signature and the other 3 were exposed to the expansion joint
signature. All specimens were placed under a static preload of 400 N during cycling to
correspond approximately to the upper body mass of an average US adult 30, 72
. However, the
viscoelastic properties of the disc and the gradual relaxation of the disc annulus were not
accounted for by this preload. All 4 specimens were cycled for 14400 cycles of the signature of

42
interest. The number of cycles was determined by the median of cycles used to induce prolapse
in one disc cycling study and the maximum reported number of cycles for another disc cycling
study, both of which resulted in the same number 58, 60
. For this preliminary test, after injecting
the safranin-O stain, the FSU was not cycled prior to the addition of the first round of the alcian
blue stain. The safranin-O stain was injected, the specimen was placed in a warm water bath for
20 minutes, and the alcian blue stain was injected thereafter. The zero displacement position of
the MTS actuator was set to the location which induced the preload at the start of cycling. This
point was used as the zero displacement reference point for the remainder of the cycling and was
not readjusted. The FSU was then cycled for 7200 cycles after which it was re-injected with the
alcian blue stain. This reinjection was to allow for the stain to account for the increased ability of
the intervertebral disc to hold volume as its interior degraded. The specimen was then
repositioned on the MTS and the zero displacement position of the actuator was set to that which
had induced a 400 N preload at the start of cycling. The FSU was then cycled for an additional
7200 cycles and dissected. All dissections proceeded from the superior region of the
intervertebral disc towards the inferior region of the disc by slicing the disc into 1-2 mm thick
slices along the transverse plane.
The freeway and expansion joint cycling waveforms used for phase 1 of the preliminary
tests are shown across a 4-second window in Figure 3.3. Note that the negative displacement
refers to the distance travelled by the actuator in the downward direction after being in contact
with the FSU at its superior-most point. The 0 mm displacement point in these and subsequent
figures refers to the point at which the MTS actuator induces the desired preload to the specimen.
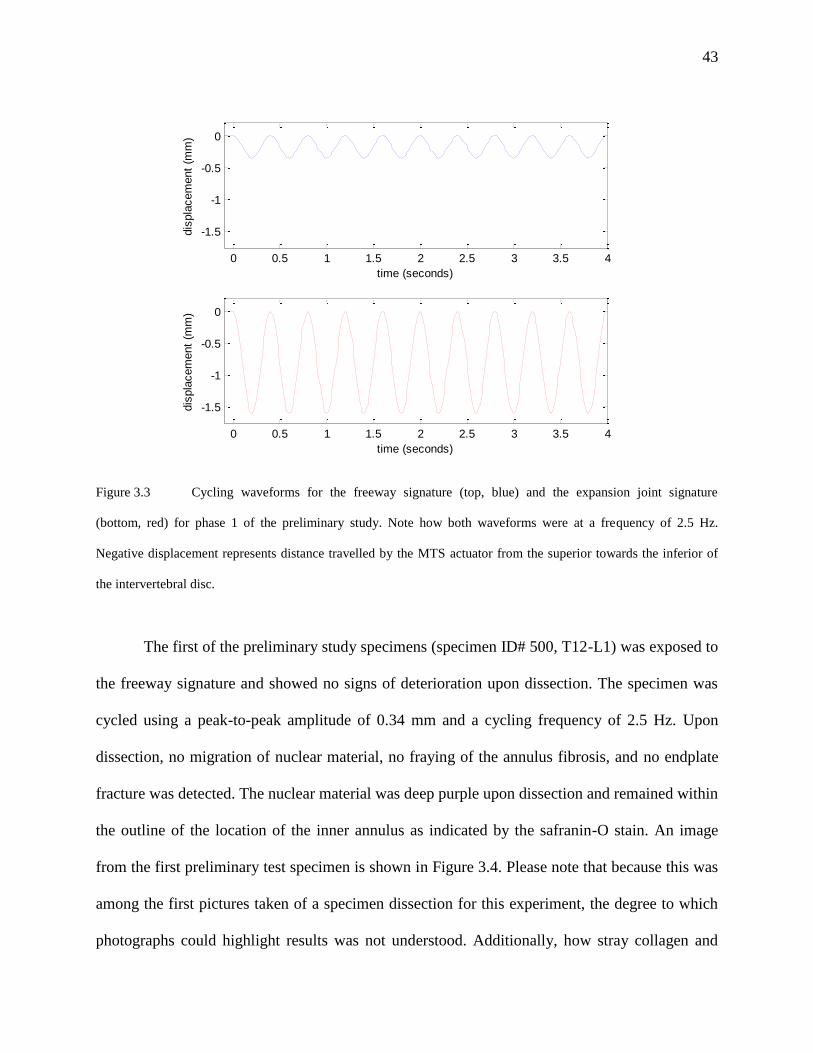
43
Figure 3.3 Cycling waveforms for the freeway signature (top, blue) and the expansion joint signature
(bottom, red) for phase 1 of the preliminary study. Note how both waveforms were at a frequency of 2.5 Hz.
Negative displacement represents distance travelled by the MTS actuator from the superior towards the inferior of
the intervertebral disc.
The first of the preliminary study specimens (specimen ID# 500, T12-L1) was exposed to
the freeway signature and showed no signs of deterioration upon dissection. The specimen was
cycled using a peak-to-peak amplitude of 0.34 mm and a cycling frequency of 2.5 Hz. Upon
dissection, no migration of nuclear material, no fraying of the annulus fibrosis, and no endplate
fracture was detected. The nuclear material was deep purple upon dissection and remained within
the outline of the location of the inner annulus as indicated by the safranin-O stain. An image
from the first preliminary test specimen is shown in Figure 3.4. Please note that because this was
among the first pictures taken of a specimen dissection for this experiment, the degree to which
photographs could highlight results was not understood. Additionally, how stray collagen and
0 0.5 1 1.5 2 2.5 3 3.5 4
-1.5
-1
-0.5
0
time (seconds)
dis
pla
cem
ent
(mm
)
0 0.5 1 1.5 2 2.5 3 3.5 4
-1.5
-1
-0.5
0
time (seconds)
dis
pla
cem
ent
(mm
)

44
nuclear material would impact the results indicated by the photographs was not well understood.
As such, the disc was not cleaned of stray collagen and nuclear material prior to taking
photographs. In the image shown, the red/pink region of the inner annulus is well defined for the
superior side of the disc (on left). On the inferior side of the disc (right), the nucleus was stained
a deep purple color and contained within the safranin-O outline. Stray collagen, nuclear material,
and dye remnants from the scalpel are seen as the brighter blue areas of the image.
Figure 3.4 Results from first preliminary test. Images show the central region of the disc in the transverse
plane. T12 shown on the left and L1 shown on the right.
The second preliminary test specimen (specimen ID# 907, T12-L1) was subjected to the
expansion joint vibration signatures with the peak-to-peak amplitude and frequency of the
vibrations being 1.5 mm and 2.5 Hz, respectively. 1.5 mm was used as the displacement instead
of the 1.6 mm calculated from the hexapod shaker data – a fact later corrected during the final
study upon review of the results from the data processing. A cycling protocol identical to that of
the first preliminary specimen was followed apart from the change of the amplitude of the
displacement (1.5 mm peak-to-peak instead of 0.34 mm). The disc was cycled for the same
number of cycles, at the same frequency, and followed the same injection protocol.

45
Upon dissection of the disc, damage was detected to both the intervertebral disc and one
of the vertebral bodies. Small amounts of migration of the nucleus pulposus beyond the outline
of the safranin-O outline were found. Additionally, an endplate fracture was found on the
superior endplate of L1 (inferior of the two endplates surrounding the intervertebral disc). The
idea that this fracture was brought on during cycling was supported by the fact that prior to
testing and upon injecting the safranin-O and the first round of alcian blue, the disc only took a
limited volume of fluid (approx. 0.4 ml total) via maximum thumb pressure. After the first 7200
cycles, however, the disc was freely accepting the alcian blue stain (approx. 1 ml was injected).
This lack of ability to maintain pressure is indicative of disc damage, as discussed in section 3.2.
The presence of the endplate fracture was verified by finding a region of the superior L1 endplate
having been pushed into the cancellous bone of the vertebral body. This was further verified by
cutting both of the FSU’s vertebrae in half transversely using a bone saw. This revealed a
brownish-red color to the inside of T12, as expected of cancellous vertebral bone. The inside of
L1, however, was a blue-green color as brought about by leaking of stain into the cancellous
bone. This contrast in color is shown in Figure 3.5.
Figure 3.5 Results from second preliminary test. Note the blue-green color of the cancellous bone on the
left. L1 shown on the left and T12 shown on the right. The difference in color is brought on by leaking of stain
from the intervertebral disc, through the endplate fracture, and into the cancellous bone of the vertebra.

46
The third preliminary test specimen (specimen ID# 180, L1-L2) was subjected to the
same vibration protocol as the second preliminary test specimen. The specimen was an intact
disc that maintained intradiscal pressure (as defined by the ability to only accept a limited
volume of fluid via injection with thumb pressure) during the safranin-O and initial alcian blue
injections. The specimen did not, however, maintain pressure after the first 7200 cycles.
Dissection of the disc revealed small amounts of nuclear material beyond the outlines of
the safranin-O stain, as can be expected of damage to the annulus fibers. Dissection of the FSU
also revealed cracks and an endplate fracture along the superior L2 endplate (inferior of the two
endplates adjacent to the intervertebral disc). The endplate fracture was verified by cutting the
vertebra in the transverse plane using a bone saw, as with the second preliminary test specimen.
The cracks were highlighted by alcian blue stain and radiated out from the center of the endplate.
The endplate fracture and cracks are shown in Figure 3.6.
The location and progression of the cracks along the endplate helped shed some light on
the validity of the assumption of outwardly progressing disc injury. The location of the cracks
and their progression away from the center of the endplate appear to suggest damage that
radiates away from the center of the disc. Because the damage in this case is along the hard-
boned endplate and not the intervertebral disc, the location and progression of these cracks
cannot necessarily indicate the progression of injury in the intervertebral disc. However, they do
indicate that the greatest forces and pressures along the endplate are experienced at the center of
the endplate, as evidenced by the fact that the endplate fractures encountered in both cases thus
far had been at the center of the disc. From this it seems reasonable that the greatest forces and
pressures experienced by the intervertebral disc which is between the source of the force (the
MTS actuator) and the endplate are also at or near the center of the disc. This is in accordance

47
with the assumption made for tracing disc injury – that progression of disc injury was from the
interior of the disc towards the exterior (outward from the region of greatest intradiscal pressure).
Figure 3.6 Image from third preliminary test. Image shows the anterior half of the superior L2 endplate. Note
the ability of the alcian blue stain to trace endplate cracks as indicated by the blue arrows. The cracks appear to
progress outwards from the center of the disc.
The fourth preliminary test specimen (specimen ID# 180, T11-T12) was subjected to the
same impulsive vibration exposure as the second and third preliminary test. The protocol used to
subject the FSU to the vibration exposures was identical to that used for the second and third
preliminary tests apart from one modification. Between the injection of the safranin-O stain and
the first round of alcian stain, the disc was cycled 10 times using the smooth freeway input (0.34
mm peak-to-peak displacement at 2.5 Hz) under a static preload of 400 N. This was to allow for
the annulus fibrosis to stretch and contract, thereby preconditioning the disc and allowing greater
penetration of the safranin-O stain as well as better highlighting of the preexisting condition of
the interior of the disc. After these 10 cycles, the disc was injected with alcian blue stain and an
identical procedure as that for the second and third preliminary test specimens was resumed.
The specimen used was again an intact disc that maintained intradiscal pressure during
the safranin-O and initial alcian blue injections. After the first 7200 cycles, the disc no longer

48
maintained pressure when injected with a large volume of alcian stain (over 1.0 ml). This is
indicative of damage induced by the cycling protocol. Dissection of the disc revealed a greater
initial inner annulus area than previously seen. This can be attributed to the cycling between the
safranin-O and first alcian blue injections. There was no migration of the nucleus pulposus or
fraying of the inner annulus. However, the nuclear material did seem to have sunk towards the
inferior of the intervertebral disc as shown by the image of disc in Figure 3.7 on the next page.
This sinking of the nuclear material along the cranial-caudal axis is likely attributable to the fact
that there was an endplate fracture on the superior endplate of the inferior vertebra, as
encountered with all previous preliminary specimens exposed to the rough freeway exposure.
This was again verified by observing the color of the cancellous bone after cutting the vertebrae
in half along the transverse plane.
Beyond the endplate fracture, the test specimen also highlighted the ability of the staining
protocol to identify preexisting fissures in the annulus of the disc. A large fissure was found
protruding from the center of the nucleus pulposus towards the anterior end of the disc. Alcian
blue was found to have seeped into the fissure. However, the fissure was determined to have
existed prior to cycling because of a bright red/pink outline surrounding the alcian blue stain.
This red outline was indicative of the safranin-O stain penetrating the fissure prior to the alcian
blue stain injections. It should be noted that despite the presence of this fissure, the disc was still
able to maintain sufficient intradiscal pressure to be deemed intact prior to cycling. This would
indicate that the fissure did not penetrate beyond the exterior of the annulus fibrosis and provide
support to the idea that WBV-related disc injuries do progress from the interior of the interior of
the intervertebral disc towards the exterior and not the reverse. Had the injury progressed in the
reverse direct, it is likely the exterior of the annulus would have been ruptured so as to allow

49
stain to escape. This ability to highlight preexisting damage to the inner annulus was also a
requirement of any staining technique that was to be used for the final cycling experiments.
Images of the fissure and the stain outlines are shown in Figure 3.7 on the next page.
Figure 3.7 Fissure found in fourth preliminary test. Image on left shows central region of intervertebral disc
above T12. Anterior end of the disc is towards the bottom of the image. Image on right is a magnified copy of the
area outlined in blue in image on left. Note the red/pink outline surrounding the blue ink in the fissure. Blue ink on
upper right of image on left indicates injection site.
Results from phase 1 of the preliminary study indicated that, with similar exposure
variables apart from displacement amplitude, the expansion joint signature was more likely to
induce damage to the discs than the freeway signature. The expansion joint exposure produced
signs of annulus deterioration and endplate fractures while the freeway exposure produced no
detected damage. The expansion joint signature causing more damage may be expected given the
fact that only displacement varied between the two exposure profiles used.
Beyond this, phase 1 of the preliminary study also found that the disc staining technique
capable of outlining intervertebral disc damage. The difference in color between the two stains
was distinct to the point that differences between the inner annulus and the nucleus pulposus
could be visibly recognized. That is, the contrast between the red safranin-O stain highlighting

50
the location of the inner annulus and the deep purple color of the mixture of the safranin-O and
alcian blue stains highlighting the location of the nucleus pulposus allowed for easy detection of
when the nuclear material extended beyond the area outlined by the initial safranin-O staining.
Additionally, the staining technique also proved successful in tracing highlighting preexisting
injury to the disc (as seen by the fissure in the fourth test specimen) as well as cracks along the
vertebral endplates (as seen in the third test specimen). These results provided confidence in the
ability of the staining technique to highlight damage of interest.
3.5.2 Phase 2 of Preliminary Study
Phase 2 of the pilot study sought to establish a framework to allow for a better
comparison of the two exposures. Because both the smooth and rough freeway exposures had
identical protocols outside of the amplitude of the vibrations, it was felt that the two exposures
were essentially comparing different amplitudes of vibration without accounting for driver
exposure to these different road conditions. It was decided to equate the two exposures based on
drive time. For the freeway exposure, the frequency of the impulses imparted to the driver were
no different than the rate at which the impulses were encountered (i.e. the road provided a
continuous exposure to vibrations). For the expansion joint exposure, though the vibrations
imparted an impulse at a frequency near 2.5 Hz, the expansion joints themselves were spaced
about 50m apart and encountered at a frequency near 0.5 Hz (once every 2 seconds when
travelling at a speed near 90 kmph). Thus, for an equivalent driving period, the number of
impulses encountered during expansion joint driving was about one-fifth that encountered during
the freeway exposure (0.5 Hz vs. 2.5 Hz). Therefore, it was decided that the rough freeway
exposure should be modified such that the frequency of oscillation be 0.5 Hz to better

51
approximate temporal occurrence of the vibration exposure. The freeway and expansion joint
cycling waveforms for phase 2 of the preliminary tests are shown in Figure 3.8. The 0 mm
displacement point again represents the location of the MTS actuator at induction of preload.
Figure 3.8 Cycling waveforms for the freeway signature (top, blue) and the expansion joint signature
(bottom, red) for phase 2 of the preliminary study. Note the difference in frequency between the two waveforms.
Negative displacement represents distance travelled by the MTS actuator from the superior towards the inferior of
the intervertebral disc.
For the second phase of the preliminary study, 2 specimens were used. 1 specimen was
exposed to the freeway cycling signature and the other was exposed to the expansion joint
signature. A few modifications were made to the cycling protocol from the first phase of the
preliminary study. First, after the injection of safranin-O, the specimen was placed under a static
300 N load for 10 minutes to better allow for the disc to stress relax, as done by another study
looking at migration of the nucleus pulposus 59
. All specimens were then placed under a static
0 0.5 1 1.5 2 2.5 3 3.5 4
-1.5
-1
-0.5
0
time (seconds)
dis
pla
cem
ent
(mm
)
0 0.5 1 1.5 2 2.5 3 3.5 4
-1.5
-1
-0.5
0
time (seconds)
dis
pla
cem
ent
(mm
)

52
preload of 200 N instead of 400 N because of the time allowed for the disc to stress relax. The
specimens were then cycled 10 times using the freeway exposure signature to better allow for the
safranin-O stain to highlight interior features of the intervertebral disc (this was identical to what
was done for the fourth specimen of the first phase of the preliminary study). Then, the
specimen was injected with the first round of alcian blue stain and the specimen was cycled for
one-half the desired number of cycles using the exposure signature of interest. As stated
previously, the number of cycles for the freeway exposure was 5 times that of the expansion joint
exposure (14400 vs. 2880, respectively) to equate the drive times between the two signatures.
After the first half of cycling, the specimen was then removed from the MTS, re-injected with
alcian blue stain, and reset on the MTS. The zero displacement point for the MTS actuator again
corresponded to the point at which the preload (in this case, 200 N) was induced during the
initial one-half of the target number of cycles. The specimen was then removed from the MTS
and dissected. It should be noted that both the specimens used for the second phase of the study
were deemed to be not intact based on the discs’ inability to sufficiently maintain intradiscal
pressure. The discs were used to examine whether discs that were not in a completely intact state
could be used during the cycling experiments. Because the specimens were unable to maintain a
high intradiscal pressure at the start of the experiment, the maximum volume injected during any
of single injection was 0.5 ml.
The fifth preliminary test specimen (specimen ID# 056, L2-L3) was exposed to the
freeway cycling signature. Upon dissection of the disc, a large pool of deep purple stain was
found in the posterior of the disc, behind the nucleus. This was a result of fraying of the inner
annulus and deterioration of the annulus fibers. However, due to the large volume of stain
injected into the disc and the fact that the disc was not intact at the start of the test, determining

53
whether this deterioration was the result of the cycling protocol was inconclusive. This was
because the safranin-O stain did not adequately outline the location of the inner annulus during
the initial injections. Due to the health of the disc and its inability to sufficiently maintain
intradiscal pressure, the safranin-O stain did not localize at the nucleus pulposus but instead
followed a path of least resistance away from the center of the disc. The alcian stain is believed
to have then followed a similar path, thereby causing the pool of stain found upon dissection. No
endplate fracture and no cracks were found along either of the endplates adjacent to the
intervertebral disc.
The sixth preliminary test specimen (specimen ID# 044, L4-L5) was subjected to the
modified expansion joint vibration protocol. The frequency of oscillation was set to 0.5 Hz and
the number of cycles was set to one-fifth their previous value. The displacement amplitude was
1.5 mm peak-to-peak, as it had been for phase 1 of the preliminary study. Upon dissection of
the disc, a large pool of deep purple stain was again found in the posterior region of disc. As was
the case previously, determining whether this pool of stain was a result of the cycling procedure
was inconclusive. No endplate fracture was detected on either of the endplates surrounding the
disc and no fissures were found in the disc.
Though the modified expansion joint exposure better accounted for the road exposure
time, the rate at which the vibrations occurred (2 seconds to compress and decompress the disc),
was not like those encountered by bus drivers. The rate at which the impulses were encountered
was correct at 0.5 Hz but the vibration signature of the impulses at 2.5 Hz was unaccounted for.
As such, this loading protocol appeared to give the annulus fibers too much time between periods
of contraction and relaxation for damage to the intervertebral disc to occur. A modification was
made during phase 3 of the preliminary study to better account for the frequency differences.

54
The second phase of the pilot study highlighted the necessity to use intact discs when
using the devised staining protocol. Both discs in this phase of the study were unable to
sufficiently maintain intradiscal pressure and, as such, highlighting damage within the disc was
unsuccessful. Both discs showed signs of deterioration to the inner annulus upon dissection but
because no pressure existed to drive the stain towards the nucleus pulposus, the preexisting state
of the inner annulus was not highlighted. Instead, the safranin-O stain pooled at a location
outside the inner annulus and the alcian blue followed the same path during injections. As such,
differentiating between preexisting damage to the discs and damage induced during disc cycling
was without conclusive results.
3.5.3 Phase 3 of Preliminary Study
The vibration signature of the expansion joints was modified to account for both the
frequency of the oscillations imparted by the impulses encountered by the bus drivers (2.5 Hz) as
well as the rate at which these impulses were encountered (0.5 Hz). It was decided to maintain
the vibration signatures at 2.5 Hz but introduce a delay between each cycle to account for the rate
at which the impulsive exposures associated with the expansion joints were encountered (0.5
Hz). Additionally, to better account for the fact that the impulses imparted by the expansion
joints were a decaying sinusoid, a second impulse of one-half magnitude of the first (0.75 mm)
was introduced immediately after the first. Therefore, the cycling protocol for the expansion joint
was modified such that each cycle contained three distinct phases: a 1.5 mm peak which
occurred over 0.4 seconds, a 0.75 mm peak which occurred over 0.4 seconds, and a delay of 1.2
seconds. Note that cycle occurring in a time of 0.4 seconds corresponds to a frequency of 2.5 Hz.
With this three-part waveform, the rate at which the expansion joint exposures were encountered
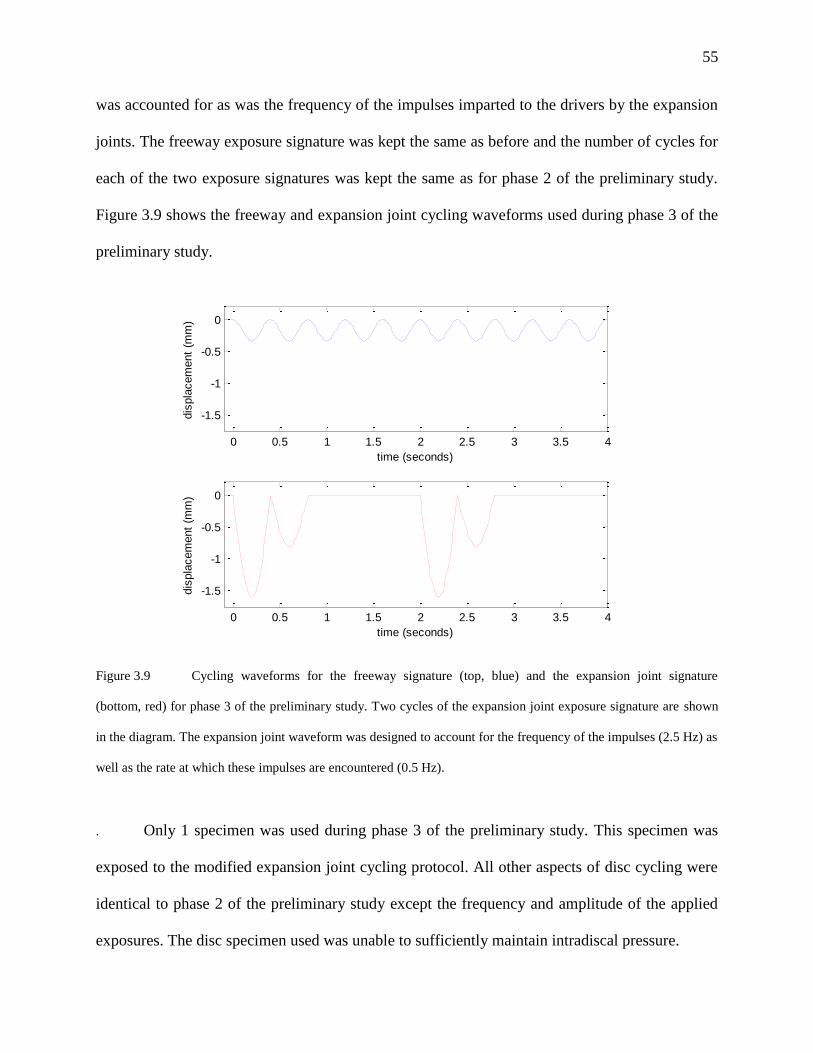
55
was accounted for as was the frequency of the impulses imparted to the drivers by the expansion
joints. The freeway exposure signature was kept the same as before and the number of cycles for
each of the two exposure signatures was kept the same as for phase 2 of the preliminary study.
Figure 3.9 shows the freeway and expansion joint cycling waveforms used during phase 3 of the
preliminary study.
Figure 3.9 Cycling waveforms for the freeway signature (top, blue) and the expansion joint signature
(bottom, red) for phase 3 of the preliminary study. Two cycles of the expansion joint exposure signature are shown
in the diagram. The expansion joint waveform was designed to account for the frequency of the impulses (2.5 Hz) as
well as the rate at which these impulses are encountered (0.5 Hz).
. Only 1 specimen was used during phase 3 of the preliminary study. This specimen was
exposed to the modified expansion joint cycling protocol. All other aspects of disc cycling were
identical to phase 2 of the preliminary study except the frequency and amplitude of the applied
exposures. The disc specimen used was unable to sufficiently maintain intradiscal pressure.
0 0.5 1 1.5 2 2.5 3 3.5 4
-1.5
-1
-0.5
0
time (seconds)
dis
pla
cem
ent
(mm
)
0 0.5 1 1.5 2 2.5 3 3.5 4
-1.5
-1
-0.5
0
time (seconds)
dis
pla
cem
ent
(mm
)

56
The seventh preliminary test specimen (specimen ID# 056, L4-L5) was subjected to the
modified expansion joint exposure signature. After dissecting the disc, a large pool of deep
purple stain was again found in the posterior region of the disc. Determining whether this
reservoir of stain was a result of cycling was inconclusive again due to the inability of the disc to
maintain sufficient intradiscal pressure. Endplate fractures were, however, observed on both
endplates adjacent to the intervertebral disc. Because the disc was unable to sufficiently maintain
pressure at the start of the experiment, it could not be conclusively determined that the endplate
fracture was brought on by testing. That said, it was felt that, amongst the expansion joint
exposures used in the preliminary tests, this modified expansion joint signature most closely
represented the occupational expansion joint exposure and the expansion joint signature devised
for phase 3 of testing was used for the final cycling tests.
3.6 Preliminary Study Results
In all, the preliminary study provided answers to many of the questions posed at the start
of phase 1 of the study. A review of some of the goals for the preliminary study as framed in
section 3.1 follows.
1. Outline final cycling signatures in terms of frequency, displacement, and number of
cycles. Each phase of the preliminary study outlined potential modifications to the
cycling protocols. By the end of phase 3 of the preliminary study, cycling protocols for
both the freeway and expansion joint exposures had been established.
2. Develop and test a method by which disc damage could be traced. The double-staining
protocol using safranin-O and alcian blue stains was found to effectively trace and outline
disc damage as brought on by cycling.

57
3. Determine what types of damage occurs in the intervertebral discs and vertebral bodies
as a result of the cycling protocol. During the cycling tests, deterioration of the inner
annulus, migration of the nuclear material, and endplate fractures were all encountered.
4. Outline progression of disc damage. This aspect of the preliminary testing goals
remained inconclusive for the unhealthy discs used. For the healthy discs, not enough
detectable damage was present to derive any conclusive results. Some evidence, however,
did exist to indicate the location of greatest pressure during cycling is indeed at the center
of the intervertebral disc (as assumed). Top increase chances of disc damage, the number
of cycles used for the final tests were increased by a factor of 150%.
5. Determine whether FSUs from older human cadavers could be used. Based on the
inability to determine the presence of disc-related injury in phases 2 and 3 of the
preliminary study, it can be concluded that discs must sufficiently maintain intradiscal
pressure to be used with the staining procedure. This is required for the safranin-O stain
to reach the inner annulus and settle therein. When the disc could not maintain sufficient
intradiscal pressure, pools of stain were found away from the center of disc.
An overview of the preliminary testing protocols is detailed in Table 3.2 and an overview of the
results of the preliminary study is given in Table 3.3. Both Tables are on the next page.
Evident from the results of preliminary testing was that endplate fractures were only
encountered in instances where the exposure was that of the expansion joints at frequencies of
oscillation at 2.5 Hz. Also, apparent from the preliminary studies was the need to use healthy
discs to effectively outline the state of the inner annulus prior to testing and prevent pooling of
stain. Healthy discs were also required to effectively determine the extent of damage caused by
the cycling protocol and whether endplate fractures were induced during testing or had existed

58
prior to. The next chapter will detail the final round of experiments performed across six subjects
using two standardized protocols.
Table 3.2 Preliminary study protocols
Specimen Segment Exposure Preload Frequency Amplitude Cycles
500 T12-L1 Freeway 400 N 2.5 Hz 0.34 mm 14400
907 T12-L1 Exp. Joint 400 N 2.5 Hz 1.5 mm 14400
180 L1-L2 Exp. Joint 400 N 2.5 Hz 1.5 mm 14400
180 T11-T12 Exp. Joint 400 N 2.5 Hz 1.5 mm 14400
056 L2-L3 Freeway 200 N 2.5 Hz 0.34 mm 14400
044 L4-L5 Exp. Joint 200 N 0.5 Hz 1.5 mm 2880
056 L4-L5 Exp. Joint 200 N 2.5 / 0.5 Hz 1.5 / 0.75 mm 2880
Table 3.3 Preliminary study results
Phase Specimen Segment Intact? Exposure Annulus
Damage?
Endplate
Fracture?
1 500 T12-L1 Freeway
1 907 T12-L1 Exp. Joint
1 180 L1-L2 Exp. Joint
1 180 T11-T12 Exp. Joint
2 056 L2-L3 Freeway ?
2 044 L4-L5 Exp. Joint ?
3 056 L4-L5 Exp. Joint ?

59
CHAPTER 4: Final Study and Results
4.1 Final Study Overview
The final round of tests had three primary objectives. These were as follow:
1. Determine whether either of the two vibration signatures was injurious to the spine.
The preliminary tests were successful in outlining a protocol whereby occupational
vibration exposures could be translated into a laboratory setting. What remained to be
done was to compare the two exposures of interest and determine if either causes damage
to the FSUs under the final protocol loading conditions.
2. Determine whether the same trends of disc and lumbar body degeneration observed in
the preliminary study occurred under the final protocol loading conditions. In the
preliminary study, the most definitive type of damage seen was endplate fractures. These
endplate fractures were seen only amongst specimens exposed to the expansion joint
signatures with impulses at 2.5 Hz. It remained to be seen if this was a consistent trend.
3. Outline the progression of disc damage. Due to not using all intact discs, the preliminary
study provided little evidence as to whether disc damage progresses from the interior of
the disc towards the exterior or in some other fashion. The final tests sought to provide a
stronger understanding of this damage progression.
4.2 Final Study Protocol
For the final tests, 6 FSUs with healthy intervertebral discs were used. Initially, the intent
was to use 12 intervertebral discs for the final tests but, after initial pressure tests, only 6 were
deemed to be intact and could sufficiently maintain intradiscal pressure. As discussed during the

60
preliminary tests, the staining protocol relied on intervertebral discs maintaining intradiscal
pressure in order to indicate if disc damage was brought on as a result of cycling. As with the
preliminary tests, discs were deemed intact if they were able to maintain an intradiscal pressure
of 90 PSI with an injection of at most 3 ml of saline solution. Three of the 6 FSUs consisted of
L2-L3 segments and three consisted of L4-L5 segments. Additionally, two pairs of FSUs were
from the same donors. For the paired specimens, each of the two specimens was cycled using
different exposures. Additionally, each segment for the one pair (be it L2-L3 or L4-L5) was
cycled using a different exposure than the same segment for the other pair. Additional
information on the specimens used is provided in Table 4.1.
Table 4.1 Specimens used in final testing
Specimen ID# Gender Age at Death Segments Used Exposure
033 Male 65 years L4-L5 Exp. Joint
044 Female 61 years L2-L3 Freeway
067 Female 21 years L2-L3 Exp. Joint
067 Female 21 years L4-L5 Freeway
073 Male 54 years L2-L3 Freeway
073 Male 54 years L4-L5 Exp. Joint
The potting of specimens in PMMA and the storage thereof was identical to that of the
preliminary tests. Each specimen was thawed in a warm water bath for approximately 30 minutes
after which safranin-O was injected into the nucleus pulposus of the disc using a standard 10 ml
syringe and a 20 gauge needle to elucidate the preexisting condition of the disc. As in the
preliminary tests, all injections were performed by applying thumb pressure until maximum
resistance was reached. At most 1.5 ml of stain was injected during a single injection.

61
As in the preliminary studies, the FSU was placed on the MTS and centered with the
MTS actuator in both the sagittal and coronal planes. The FSU was placed on the MTS with the
direction of the MTS actuator’s movement perpendicular to the FSU endplates. Also, the FSU
was set so the actuator would first contact the superior of the two vertebral bodies, as shown in
Figure 4.1. The potted FSU was then placed under a 300 N static load using the MTS for 10
minutes to allow for stress relaxation of the annulus fibers. Then, the 300 N preload was reset
and the disc was preconditioned by cycling10 times under the smooth freeway input signature
(0.34 mm peak-to-peak displacement at 2.5 Hz). Following preconditioning, the specimen was
removed from the MTS and the disc was injected with the alcian blue stain and repositioned in
the MTS. The 300 N preload was reestablished and the position of the MTS actuator was set as
the zero displacement position for the remainder of the test. The FSU then underwent three
rounds of cycling using either the freeway input signature or the expansion joint input signature.
The number of cycles for each round of cycling varied by input signature with FSUs exposed to
the freeway input cycled 7200 times per round of cycling and those exposed to the expansion
joint input cycled 1440 times per round of cycling. A flowchart of the cycling protocol is
provided in Figure 4.2
.
Figure 4.1 MTS actuator in contact with specimen. MTS actuator is in contact with superior of the two
vertebrae of the FSU

62
Figure 4.2 Flowchart of final testing protocol
After each round of cycling, the FSU was removed from the MTS and injected with
another round of alcian blue stain. The FSU was then repositioned as before on the MTS and
subjected to the next round of cycling. The zero displacement point of the MTS actuator was
defined as the point where the preload was applied to the FSU at the start of cycling. This zero
displacement point was not adjusted for any subsequent round of cycling. After three rounds of
cycling and subsequent injections of alcian blue, the FSU was removed from the MTS and the
intervertebral was dissected from the superior endplate towards the inferior using a scalpel by
making slices 1-2 mm thick.
4.3 Final Test Results
Images from the dissection of each FSU are presented as a grid. The upper-left image of
this grid shows the superior of the two endplates surrounding the intervertebral disc. The upper-
right image shows the superior region of the intervertebral disc as viewed from the superior
Thaw specimen Inject safranin-
O stain
Apply 300N load for 10
minutes
Cycle 10 times using freeway
signature
Inject round 1 of alcian stain
Apply 300N preload and
mark zero point
Cycle for 1/3 of total cycles
(48 mins)
Inject round 2 of alcian stain
Cycle for 1/3 of total cycles
(48 mins)
Inject round 3 of alcian stain
Cycle for 1/3 of total cycles
(48 mins)
Dissect specimen

63
towards the inferior. The bottom-left image shows the transverse center of the intervertebral disc
as viewed from the superior towards the inferior. The bottom-right image shows the inferior of
the two endplates adjacent to the intervertebral disc. Figures 4.3 and 4.4 outline this image grid
and the locations/views of each of the sections shown in the image grid.
Figure 4.3 Diagram of picture grids used to display results
Figure 4.4 Diagram of FSU (left) and picture grid (right). Lines through intervertebral disc on FSU
correspond to location of images detailed in diagram of picture grid. Views shown in picture grids correspond to
those written in each section of the diagram of grid.
4.3.1 Freeway Vibration Cycling Results
Viewed from inferior
towards the superior
Viewed from superior
towards the inferior
Viewed from superior
towards the inferior
Viewed from superior
towards the inferior
Superior Endplate
Adjacent to Disc
Superior Region of
Intervertebral Disc
Center of
Intervertebral Disc
Inferior Endplate
Adjacent to Disc
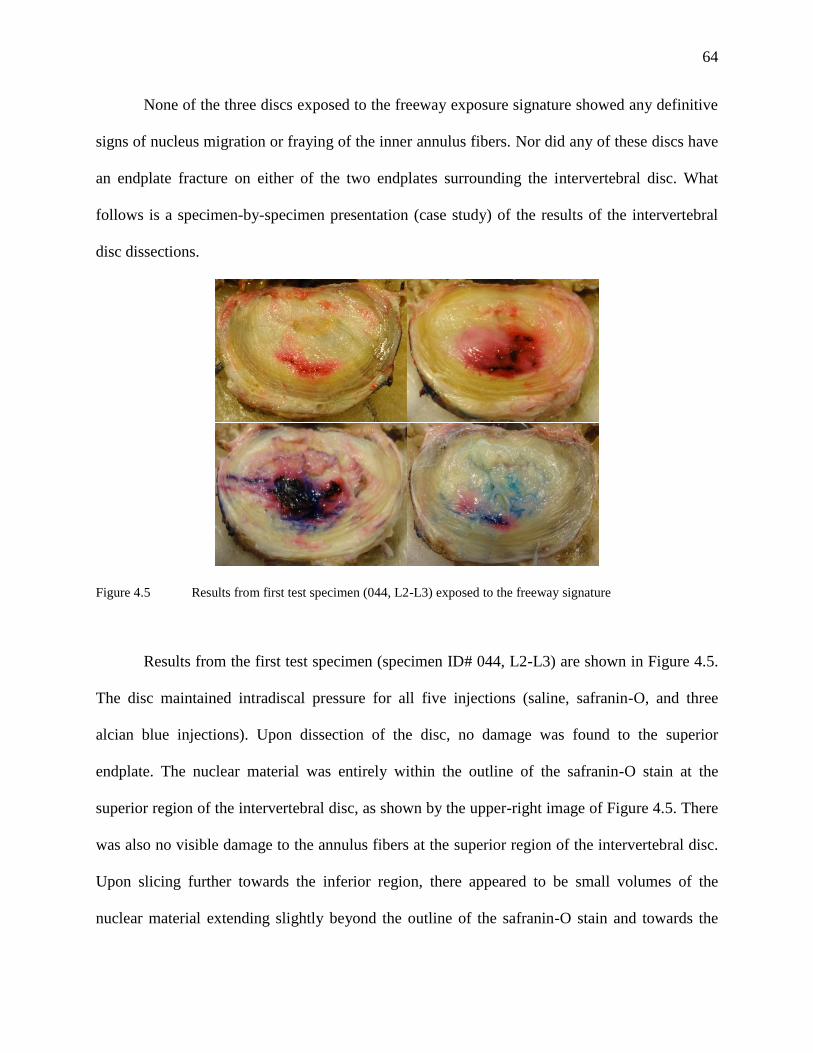
64
None of the three discs exposed to the freeway exposure signature showed any definitive
signs of nucleus migration or fraying of the inner annulus fibers. Nor did any of these discs have
an endplate fracture on either of the two endplates surrounding the intervertebral disc. What
follows is a specimen-by-specimen presentation (case study) of the results of the intervertebral
disc dissections.
Figure 4.5 Results from first test specimen (044, L2-L3) exposed to the freeway signature
Results from the first test specimen (specimen ID# 044, L2-L3) are shown in Figure 4.5.
The disc maintained intradiscal pressure for all five injections (saline, safranin-O, and three
alcian blue injections). Upon dissection of the disc, no damage was found to the superior
endplate. The nuclear material was entirely within the outline of the safranin-O stain at the
superior region of the intervertebral disc, as shown by the upper-right image of Figure 4.5. There
was also no visible damage to the annulus fibers at the superior region of the intervertebral disc.
Upon slicing further towards the inferior region, there appeared to be small volumes of the
nuclear material extending slightly beyond the outline of the safranin-O stain and towards the

65
anterior region of the disc, however, the degree to which this nuclear material penetrated the
boundary of the safranin-O stain was difficult to determine visually. The bottom-right image of
Figure 4.5 demonstrates shows the degree to which the safranin-O stain outlined the location of
the nucleus pulposus upon dissection. To the left of this image is the injection site of the disc,
which is highlighted by parallel lines of stain extending from the exterior of the disc towards the
nucleus pulposus. Upon reaching the inferior endplate, small amounts of both stains was found
on tissues above the endplate. No endplate fracture was found on the inferior endplate.
Figure 4.6 Results from second test specimen (067, L4-L5) exposed to the freeway signature
The second test specimen (specimen ID# 067, L4-L5) exposed to the smooth freeway
exposure was from very young donor (21 years old at death) and was therefore in very good
condition at the start of the experiment. A specimen from the same donor was used as the second
test specimen for the rough freeway exposure. This specimen also maintained intradiscal
pressure during all five injections. Pictures from the dissection of this specimen are shown in
Figure 4.6 in a manner and layout consistent with the diagram shown in Figure 4.3.

66
No discernible damage was found upon dissection of the disc. The upper-left image of
Figure 4.6 shows the superior endplate adjacent to the intervertebral disc. No damage or
deterioration of the endplate was found during dissection. The upper-right image shows the
superior region of the intervertebral disc. Again, no damage was found during dissection and the
nuclear material was found to be contained within the outline of the safranin-O stain. Slicing
through the intervertebral disc towards the center of the disc also found no visible damage to the
annulus fibers or migration of the nuclear material away from the center. Interestingly, the
safranin-O stain indicated the disc had a rather non-symmetric inner annulus. As evidence of
this, note the area stained by safranin-O in the upper-right image of Figure 4.6 versus that in the
lower-left image of Figure 4.6. In both cases, the area of safranin-O stain is slightly to the left of
the center of the intervertebral disc. However, going from the superior of the intervertebral disc
towards the inferior of the intervertebral disc, the location of the inner annulus appears to shift
from the posterior region of the disc towards the anterior. Despite this shift, the nuclear material
was found to have been contained within the outlines of the safranin-O stain throughout the disc.
Upon reaching the inferior of the two endplates, no damage or endplate fractures were detected.
The third specimen exposed to the freeway cycling protocol (specimen ID# 073, L2-L3)
also showed no signs of deterioration as brought on by the cycling protocol. Results from this
specimen are shown in Figure 4.7. The intervertebral disc again maintained intradiscal pressure
during all five injections. Upon dissection, no damage was found to the superior of the two
endplates, as shown in the upper-left image of Figure 4.7. The superior region of the
intervertebral showed a very large area of inner annulus stained by the safranin-O stain relative
to the amount of nuclear material present. This is shown in the upper-right image of Figure 4.7,
particularly by the lack of nuclear material present towards the posterior region of the disc. In

67
previous dissections, this had been indicative of nuclear material sinking towards the inferior
region of the disc. Slicing the intervertebral disc towards the inferior region revealed how much
of the nuclear material appeared to have sunk towards the inferior region of the disc, as shown by
the lower-left image of Figure 4.7. Whether this was a result of the testing or preexisting for this
disc was inconclusive as the nuclear material remained within the outline of the safranin-O stain
throughout the disc. Upon reaching the inferior of the two endplates, no endplate fracture was
found. That said, the top of the endplate was chipped by the scalpel during dissection, thus
introducing the cracks visible in the bottom-right image of Figure 4.7.
Figure 4.7 Results from third test specimen (073, L2-L3) exposed to the freeway signature
In all, the smooth freeway exposure resulted in no detectable damage to the intervertebral
disc and no endplate fractures as a result of cycling. Considering the experiment mimicked about
2.4 hours (21600 cycles at 2.5 Hz) of driving exposure on a fairly smooth freeway surface at a
relatively constant and attainable speed, the lack of damage to the intervertebral disc may not be
all that surprising given the relatively short exposure duration. It should be noted that the model

68
used was a disc-body-disc model and therefore varies from anatomic exactness due to the lack of
posterior vertebral structures and the lack of muscles and ligaments to support the FSU.
Interpretation of the results from this disc-body-disc model are given later in this discussion but
must be made with the caveat that variations from in vivo conditions are inevitable.
4.3.2 Expansion Joint Vibration Cycling Results
Each of the three intervertebral discs exposed to the rough freeway cycling signature had
an endplate fracture along the inferior of the two endplates adjacent to the disc. Additionally, two
of the three discs also showed a deterioration of the inner annulus and/or migration of nuclear
material beyond the outlines of the inner annulus, as colored by the safranin-O stain. What
follows is a specimen-by-specimen analysis of the dissections of the disc specimens.
Figure 4.8 Results from first test specimen (033, L4-L5) exposed to the expansion joint signature
The first specimen (specimen ID# 033, L4-L5) exposed to the expansion joint signature
had considerable preexisting and induced damage to the inner annulus. This is shown in the
upper-right image of Figure 4.8. The safranin-O stain was able to outline an area towards the

69
anterior region of the disc where stain accumulated after entering at the injection site, which was
at the posterior-right region of the image. Nevertheless, the disc did maintain intradiscal pressure
during the saline injections, safranin-O injection, and the first of the alcian blue injections. The
superior region of the intervertebral disc had alcian blue stain towards the posterior of the disc
from the nucleus pulposus. Due to the color of the stain (blue, not deep purple) and the lack of an
outline of safranin-O, the presence of the stain was indicative of damage induced by cycling
procedure. The nucleus was located right of center and towards the posterior region of the disc.
Additionally, some alcian blue stain gathered near the injection site at the superior of the disc
and decreasing amounts were found in the same area as one moved towards the inferior region of
the disc. The central region of the disc had more migration of alcian blue stain, only this time
towards the anterior-left of the disc. This is shown in both the upper-right and lower-left images
of Figure 4.8. The streaks of ink to the anterior left of the nucleus pulposus in the upper-right
image is the same pool of ink seen in the anterior left of the lower-left image seeping through
annulus fibers.
The inferior endplate of the specimen had a very large endplate fracture apparently
brought about by the endplate caving at multiple sites near the center of the disc. The hard bone
of the endplate was found to have been pushed about 1.5 mm into the cancellous bone of the
vertebra. This is shown in the bottom-right image of Figure 4.8 with the large blue/purple region
in the center of the vertebral body being the site of the endplate fracture. Additionally, cracks
were also found along the inferior endplate, radiating towards the anterior region of the disc from
the center. This is evidenced in the lower-right image of Figure 4.8 by the fissure radiating
towards the anterior right of the disc from the center.

70
The second of the three specimens (specimen ID# 067, L2-L3) exposed to the expansion
joint cycling protocol was from the same donor as the second specimen exposed to the freeway
cycling protocol. The disc was from a relatively young donor and in good condition. The nuclear
material remained within the outlines of the safranin-O stain throughout the disc, as evidenced
by the upper-right and lower-left images of Figure 4.9. The injection site was at the left of the
disc and stain remnants from injections can be seen in the lower-left image of Figure 4.9.
Figure 4.9 Results from second test (067, L2-L3) specimen exposed to the rough freeway signature
Despite the lack of any detectable damage to the inner annulus, an endplate fracture was
found on the inferior endplate. This is visible on the lower-right image of Figure 4.9. Whereas
endplate fractures in other specimens were characterized by a cracking of the vertebra’s hard
bone and its caving into the cancellous bone of the vertebra, the endplate fracture for this
particular specimen showed no other signs of cracking or deterioration other than the fracture
(visible as the deep blue line through the center of the vertebral body in the lower-right image of
Figure 4.9). The fracture itself was slightly over a millimeter wide at its widest point and large
enough to allow for ink to seep into the vertebral body. Interestingly, the disc maintained

71
pressure for four of the five rounds of injections but did not hold pressure during the final alcian
injection. This pattern of maintaining intradiscal pressure appears indicative of a gradual
deterioration of the endplate whereas the fracture itself seems much more characteristic of what
would be expected of a single event which did not impact other regions of the vertebral endplate.
Figure 4.10 Results from third test specimen (073, L4-L5) exposed to the expansion joint signature
The final test specimen (specimen ID# 073, L4-L5) exposed to the expansion joint
cycling protocol was from the same donor as the third test specimen exposed to the smooth
freeway cycling protocol. As was the case with the third specimen exposed to the freeway
cycling protocol, considerable preexisting damage was outlined by the safranin-O stain, as can
be seen throughout the images in Figure 4.10 (five images are shown as part of Figure: upper-left
image shows the superior of the two endplates, upper-middle image shows the superior region of
the intervertebral disc, upper-right image shows a more inferior region of the disc than the upper-
middle image, lower-left image shows a more inferior region of the disc than the upper-right
image, and the lower-right image shows the inferior of the two endplates). The preexisting
damage to the disc is most evident in the upper-right and lower-left images of Figure 4.10, as

72
there was a pooling of safranin-O stain in the left of the intervertebral disc. This is near the
injection site, which was on the posterior-left region of the disc. That said, there was also a large
amount of alcian blue stain which had migrated to the posterior-right region of the disc, as shown
in the upper-middle and upper-right images of Figure 4.10. This was indicative of post-cycling
damage to the disc as safranin-O stain was not found to have penetrated into the same area
despite the intervertebral disc initially maintaining intradiscal pressure during the saline
injection, the safranin-O injection, and the first of the alcian blue injections. Further alcian blue
migration was found in the central region of the disc, where the stain migrated from the nucleus
towards the anterior region of the disc, pooling in a crescent-like shape seen in the lower-left
image of Figure 4.10. This same pool of ink can be seen seeping through the annulus fibers
slightly anterior to the nucleus pulposus in the upper-right image of Figure 4.10.
The inferior endplate of the two endplates adjacent to the intervertebral disc had a large
fracture very similar to those seen in other specimens, where a region of the hard bone of the
vertebrae was found to have caved in. To demonstrate the degree to which this happened in this
particular specimen, a ruler was used to help create the images shown in Figure 4.11. The ruler
was inserted beneath the region of bone which had not been damaged and pushed towards the
posterior region of the vertebra. As can be seen in the images, there is a space beneath the
endplate of a few millimeters which is not readily visible in two-dimensional images.
Figure 4.11 Demonstration of the extent of endplate fracture

73
4.4 Summary of Results
None of the specimens exposed to the smooth freeway cycling protocol demonstrated any
visible damage to the intervertebral disc as brought on by the induced vibrations. All 15
injections (5 for each of the 3 discs) resulted in the disc being able to maintain intradiscal
pressure (injections were made using thumb pressure applied against maximal resistance).
Additionally, the nucleus pulposus remained within the area outlined by the safranin-O stain and
no visible deterioration of the annulus fibers was detected upon dissection of the discs. The
specimens did not have an endplate fracture on either the superior or inferior endplates adjacent
to the intervertebral disc upon dissection. These results are in line with the preliminary study,
where the two specimens exposed to the freeway cycling protocol showed no visible signs of
damage to the intervertebral disc or any signs of endplate fracture upon dissection.
All three of the specimens exposed to the rough freeway cycling protocol demonstrated at
least some signs of damage induced by cycling. Endplate fractures were found on the inferior of
the two endplates adjacent to the intervertebral disc for all three specimens. All three specimens
were unable to maintain intradiscal pressure during or before the third of the alcian blue
injections (fifth injection overall). Two of the three intervertebral discs also showed signs of
deterioration of the inner annulus and migration of either/both alcian blue stain and nuclear
material beyond the inner annulus. The disc that did not demonstrate any damage to the annulus
fibrosis was from a relatively young donor and was therefore of very good health. It should also
be noted that all of the specimens exposed to the expansion joint cycling protocol during
preliminary testing also had an endplate fracture along the inferior-most of the endplates adjacent
to the intervertebral disc except the lone specimen exposed to loads at 0.5 Hz. The results for all

74
6 of the specimens used during final testing are summarized in Table 4.2, found below. Of
particular interest is the consistency seen in the results within the two cycling protocols.
Table 4.2 Final testing results
Specimen Segment Exposure Annulus
Damage?
Endplate
Fracture?
When innerdiscal
pressure was lost
044 L2-L3 Freeway Never
067 L4-L5 Freeway Never
073 L2-L3 Freeway Never
033 L4-L5 Exp. Joint 2nd alcian injection
067 L2-L3 Exp. Joint 3rd alcian injection
073 L4-L5 Exp. Joint 2nd alcian injection
75
CHAPTER 5: Discussion
5.1 Revisiting Final Testing Aims
Three goals were established for the final series of tests in section 4.1. These aims are
discussed below in the context of experiment results.
1. Determine whether either of the two vibration signatures was injurious to the spine.
Based on the results of the final round of tests, evidence supports the idea that the
expansion joint exposure is more detrimental compared to the freeway exposure. Beyond
this comparison, it is difficult to relate the exposures induced during cycling with what
are seen in occupational settings because of the ex vivo nature of this study. The
experimental model used was a body-disc-body model that was specifically chosen to
reduce the number of variables and accentuate damage to the disc under cyclical loading.
However, elimination of the posterior structures of the vertebrae (facet joints) as well as
ligaments and muscles may have altered the effects of the vibrations. Additionally, the
experiment relied on accelerating exposures into condensed periods of time – according
to a spokesperson for King County Metro, a driver is not likely to drive on a freeway for
more than 40 minutes at a given time and would encounter no more than 40-50 expansion
joints on such a route. This very compressed duty cycle of the exposures also did not
allow for any relaxation or healing the spine may undergo in vivo between exposures.
Nonetheless, what can be said with confidence is, given the same conditions, evidence
exists that the expansion joint exposure is more likely to induce damage to the human
spine than the freeway exposure. A more definitive conclusion could be made by
increasing the number of samples studied.
76
2. Determine whether the same trends of disc and lumbar body degeneration observed in
the preliminary study occurred under the final protocol loading conditions. For the
most part, the results of the dissection pointed to two distinct trends. Firstly, the
specimens exposed to the freeway exposure showed no definitive signs of deterioration.
Secondly, those FSUs exposed to the expansion joint segment developed endplate
fractures on the inferior endplate adjacent to the intervertebral disc in addition to showing
signs of damage to the annulus of the intervertebral disc. These results are consistent with
what was seen in the preliminary tests.
3. Outline the progression of disc damage. Much of the deterioration observed within the
annulus of the disc was found to occur in a non-specific direction with respect to the
location of the nucleus. However, progression of injury could be detected to occur toward
the exterior of the disc from the nucleus pulposus. This agrees with expectations based on
the assumption (made during development of the staining technique) that damage would
begin in the interior region of the disc and progress towards the exterior. The alternative
means of injury progression (exterior of the intervertebral disc towards the interior) was
not explored with this study protocol and is addressed in the study limitations section
presented below.
5.2 Study Limitations
The most obvious limitation of this study is the small sample size used. This is mostly
due to the relatively limited availability of human specimens for laboratory testing and the
necessarily strict requirement that the intervertebral disc be able to maintain intradiscal pressure.
Unfortunately, the latter requirement eliminated half of the planned test specimens. Ideally, the

77
same experiment could be performed with an increased sample size with paired specimens from
the same donor. Putting each of the specimens from the same donor under differing exposures
(as was done for two pairs of the final specimens) would strengthen this study. Additionally, if
the specimens are not from the same level of the spine, similarly alternating FSUs from differing
regions of the spine would also increase the validity of results since disc injuries occur
throughout the lumbar region. As it stands, the rather small sample size prevents more definitive
conclusions from being drawn with respect to study results.
An additional limitation with using human specimens is the age of the specimens. As can
be seen from the results from specimen ID# 067, age can have a great impact on the health and
overall quality of the disc. Because the supply of donor specimens is most always from older
individuals, some preexisting deterioration of the intervertebral disc is unavoidable. Not only
this, but bone quality could greatly impact whether or not an endplate fracture is encountered
during testing. Specimens from elderly donors are more likely to have a decreased bone quality
and may thus be more susceptible to the endplate fractures seen during testing.
A possible solution to the limitations surrounding the use of human tissues is to use an
animal model. Though this could very well work for the validation of the staining techniques and
the detection of damage to the hard bones of the vertebral bodies, the translation of displacement
data collected on humans to animals, be they porcine or primate tissues, could pose issues related
to the morphology of the spine of the groups studied. In particular, because quadrupedal animals
do not axially load their spines, may have intervertebral discs which differ from humans in both
shape and health. Additionally, bone strength may differ between the species as a difference in
animal sizes would likely result in a difference in vertebral body size and specimens would

78
therefore have to be subjected to a proportionately different loading displacement for a fair
comparison.
Another limitation of this particular study is that it only examines disc injuries which
progress from the interior of the intervertebral disc towards the exterior. As previously stated,
assuming disc injury progressed in one direction or the reverse was necessary for developing a
practical staining protocol. The reverse means of disc injury progression (from the exterior of the
disc towards the interior) was not tested in this study but could potentially be explored by
immersing the FSU in a reservoir of stain during testing and then dissecting to determine if any
stain was found to have penetrated the exterior of the annulus fibrosis. Such a test would not only
involve large volumes of stain, but also require care to ensure that the equipment used in testing
is remains undamaged from the cycling protocol. Also, it would be limited only to examining
damage/degradation of the outer annulus. Endplate fractures induced by the cycling protocol (or
that were preexisting) would be impossible to ascertain with this alternative staining technique.
The initial angle at which the FSUs are potted in the PMMA mold and subsequently
loaded presents another limitation. Spine curvature and the angle at which individual vertebrae
are at during rest vary greatly not only by region of the spine, but also between sitting and
standing 73-76
. For this study, the specimens were potted at near-zero angles relative to the normal
of the movement of the MTS actuator which mimics the angle of the intervertebral discs at the
thoracolumbar junction when sitting. During sitting, however, lower lumbar segments tend to
flex and bend relative to one another, thereby creating a nonparallel, angled alignment between
adjacent vertebral bodies 75, 76
. Positioning FSUs at non-neutral angles greatly decreases the
ability of the disc-body-disc segment to withstand applied forces without failure during loading
cycles while better representing the position of the lower lumbar region of the spine when in a
79
seated position 17, 77
.
A final limitation of this study relates to the fact the displacement values used were
derived from occupational exposures and not directly collected therefrom. For this project, the
occupational displacements were collected in a vehicle, played into a hydraulic shaker, and then
derived using, in part, a mathematical model. Additionally, the data collected also looked at the
vibration across a very large region of the spine, rather than a single intervertebral disc. Using a
more direct way of obtaining the occupational displacement of individual vertebral discs would
be of interest in improving the accuracy of displacements of intervertebral discs as used within
this study.
5.3 Future Directions
A potential improvement to the study would be to increase the number of road conditions
analyzed. As this was a first-pass at developing techniques for conducting future studies of this
sort, only two, very different road conditions were studied. Looking at roads traversed at lower
speeds and with differing impulse signatures such as city streets and streets with pot holes or
speed bumps may be of great future interest to better understand the development of LBDs
across a range of WBV exposure signatures.
Another improvement that could be made to a follow-on study is the manner in which the
intervertebral discs are sliced during dissection. Using a scalpel by hand tends to result in uneven
cuts of the intervertebral disc and, in some cases, smearing of dye. Using a sharper tool with a
longer blade to allow for single cuts would be of great help. Although efforts were made to
identify such a tool, none were found that have been previously used in intervertebral disc
dissections. A microtome could potentially solve this issue but because the discs contain liquid

80
stains, any freezing that may be required for proper slicing with the microtome may alter results.
Additionally, pooling of stains may be liable to damage the microtome equipment.
Another potential improvement relates to the degree to which the results can be
quantified. In this study, most results were based on qualitative visual inspection of the discs and
dyes. Quantifying these observations for non-visual comparison across specimens is a desired
but missing feature. Alternate studies following dye migration have relied on using digital image
analysis computer programs to detail and compare images of intervertebral discs based pixels of
stain in the annulus and of stain in the nucleus pulposus 59
. Such a method, however, is
dependent upon the slice plane used during imaging and the image quality. As has been shown in
results from this study, the concentration of stain tends to vary greatly at different levels of the
intervertebral disc. As such, it seems an alternative method that takes this into account in some
way must be developed.
A final direction towards which to take this project relates to comparing the vibration
signatures applied working limits and/or industry standards. As previously stated, ISO standards
exist regarding the limits of WBV exposure in a workplace. Determining how the induced
cycling protocols compare to these WBV exposure limits would be of interest. Because these
standards and limits often rely on the acceleration data from WBV sites, displacement
waveforms could be doubly differentiated to obtain accelerations. Alternatively, accelerometers
could be affixed to the actuator of the MTS as it oscillates for each of the two exposure
signatures without applying a load to a FSU. This accelerometer data could then be processed
and analyzed for comparison with working limits and standards.
5.4 Conclusions

81
This thesis introduces methods which can be used as a basis for conducting more
complete investigations into the effects of WBV on the development of LBDs. Based on a
review of literature, this project was the first known to translate vibrations collected in an
occupational setting into a laboratory setting to test on human spine specimens. Moreover, the
study also introduced a novel staining protocol which employing readily available histological
stains to outline the preexisting condition of the intervertebral disc and trace any induced by
cycling the disc. Previous studies relied on radiography to establish the preexisting state of the
intervertebral disc. Based on these two methodological innovations alone, this study stands to
help advance knowledge regarding the etiology of LBDs as a result of WBV.
Based on the presented results, it can be said that evidence now exists that for an equal
driving-time exposure, higher impulses from features of freeways such as expansion joints are
much more likely to induce injury than the vibration induced from driving on a more even
(smooth) driving surface. These injuries can be manifested as both endplate fractures as well as
deterioration of the annulus of the intervertebral disc, which can lead to disc prolapse and/or
herniation. However, the low sample number (n = 6) prevents more conclusive determinations
from being made based on the results of this study.
Additionally, the presented results also provide evidence that progression of disc-related
injury can proceed from the interior of the disc towards the exterior. Testing the alternative
(“out-to-in”) hypothesis could be done, as discussed in the study limitations. It should also be
stated that these two modes of progression are not mutually exclusive – disc injury progression
could very well progress simultaneously in both directions. For this experiment, increasing the
number of samples would again allow for more definitive conclusions to be drawn.

82
Overall, this study demonstrates merit in terms of its methods and points towards
conclusions that can be drawn with more extensive results. It can, in many ways, be considered a
strong first step towards translating occupational exposures into a laboratory setting while also
providing results that hint at the etiology and development of LBDs as a result of WBV.
83
REFERNCES
1. Herkowitz, H. N., The Lumbar Spine. Lippincott, Williams, & Wilkins: Philadelphia,
2004.
2. Marras, W. S., Occupational low back disorder causation and control. Ergonomics 2000,
43, 880-902.
3. Blood, R. P.; Ploger, J. D.; Yost, M. G.; Ching, R. P.; Johnson, P. W., Whole body
vibration exposures in metropolitan bus drivers: A comparison of three seats. Journal of Sound
and Vibration 2010, 329, 109-120.
4. Janwantanakul, P.; Sitthipornvorakul, E.; Paksaichol, A., Risk factors for the onset of
nonspecific low back pain in office workers: A systematic review of prospective cohort studies.
Journal of Manipulative and Physiological Therapeutics 2012, 35, 568-577.
5. Manchikanti, L., Epidemiology of Low Back Pain. Pain Physician 2000, 3.
6. Dankaerts, W.; O'Sullivan, P.; Burnett, A.; Straker, L.; Davey, P.; Gupta, R.,
Discriminating Healthy Controls and Two Clinical Subgroups of Nonspecific Chronic Low Back
Pain Patients Using Trunk Muscle Activation and Lumbosacral Kinematics of Postures and
Movements A Statistical Classification Model. Spine 2009, 34, 1610-1618.
7. O'Sullivan, K.; O'Sullivan, P.; O'Sullivan, L.; Dankaerts, W., What do physiotherapists
consider to be the best sitting spinal posture? Manual Therapy 2012, 17, 432-437.
8. Pope, M. H.; Magnusson, M.; Wilder, D. G., Low back pain and whole body vibration.
Clinical Orthopaedics and Related Research 1998, 241-248.
9. Riihimaki, H.; Viikarijuntura, E.; Moneta, G.; Kuha, J.; Videman, T.; Tola, S., Incidence
of sciatic pain among men in machine operating, dynamic physical work, and sedentary work –
A 3-year follow-up. Spine 1994, 19, 138-142.
10. Riihimaki, H.; Tola, S.; Videman, T.; Hanninen, K., Low-back-pain and occupation – A
cross-sectional questionnaire study of men in machine operating, dynamic physical work, and
sedentary work. Spine 1989, 14, 204-209.
11. Nawayseh, N.; Griffin, M. J., Power absorbed during whole-body vertical vibration:
Effects of sitting posture, backrest, and footrest. Journal of Sound and Vibration 2010, 329,
2928-2938.
12. Bovenzi, M.; Hulshof, C. T. J., An updated review of epidemiologic studies on the
relationship between exposure to whole-body vibration and low back pain (1986-1997).
International Archives of Occupational and Environmental Health 1999, 72, 351-365.
13. Bovenzi, M., Metrics of whole-body vibration and exposure-response relationship for
low back pain in professional drivers: a prospective cohort study. International archives of
occupational and environmental health 2009, 82, 893-917.
14. Wilder, D. G.; Pope, M. H., Epidemiological and aetiological aspects of low back pain in
vibration environments - An update. Clinical Biomechanics 1996, 11, 61-73.
15. Smith, R. D.; Leggat, P. A., Whole-body vibration: health effects, measurement and
minimization. Professional Safety 2005, 50, 6.
16. Yates, J. P.; Giangregorio, L.; McGill, S. M., The Influence of Intervertebral Disc Shape
on the Pathway of Posterior/Posterolateral Partial Herniation. Spine 2010, 35, 734-739.
17. Callaghan, J. P.; McGill, S. M., Intervertebral disc herniation: studies on a porcine model
exposed to highly repetitive flexion/extension motion with compressive force. Clinical
Biomechanics 2001, 16, 28-37.
18. Sandover, J., Dynamic loading as a possible source of low back disorders. Spine 1983, 8,
652-658.
84
19. Birlik, G., Occupational Exposure to Whole Body Vibration-Train Drivers. Ind. Health
2009, 47, 5-10.
20. Chen, J. C.; Chang, W. R.; Shih, T. S.; Chen, C. J.; Chang, W. P.; Dennerlein, J. T.;
Ryan, L. M.; Christiani, D. C., Predictors of whole-body vibration levels among urban taxi
drivers. Ergonomics 2003, 46, 1075-90.
21. Milosavljevic, S.; Bergman, F.; Rehn, B.; Carman, A. B., All-terrain vehicle use in
agriculture: exposure to whole body vibration and mechanical shock. Appl. Ergon. 2010, 41,
530-535.
22. Blood, R. P.; Ploger, J. D.; Yost, M. G.; Ching, R. P.; Johnson, P. W., Whole body
vibration exposures in metropolitan bus drivers: A comparison of three seats. Journal of Sound
& Vibration 2010, 329, 109-120.
23. Vanerkar, A. P.; Kulkarni, N. P.; Zade, P. D.; Kamavisdar, A. S., Whole body vibration
exposure in heavy earth moving machinery operators of metalliferrous mines. Environ. Monit.
Assess. 2008, 143, 239-245.
24. Waters, T.; Genaidy, A.; Barriera Viruet, H.; Makola, M., The impact of operating heavy
equipment vehicles on lower back disorders. Ergonomics 2008, 51, 602-36.
25. Howard, B.; Sesek, R.; Bloswick, D., Typical whole body vibration exposure magnitudes
encountered in the open pit mining industry. Work 2009, 34, 297-303.
26. Bovenzi, M.; Rui, F.; Negro, C.; D'Agostin, F.; Angotzi, G.; Bianchi, S.; Bramanti, L.;
Festa, G.; Gatti, S.; Pinto, I.; rd, An epidemiological study of low back pain in professional
drivers. Journal of Sound and Vibration 2006.
27. Zimmermann, C. L.; Cook, T. M., Effects of vibration frequency and postural changes on
human responses to seated whole-body vibration exposure. International archives of
occupational and environmental health 1997, 69, 165-79.
28. Eger, T.; Stevenson, J.; Boileau, P. E.; Salmoni, A.; VibRg, Predictions of health risks
associated with the operation of load-haul-dump mining vehicles: part 1 - analysis of whole-body
vibration exposure using ISO 2631-1 and ISO-2631-5 standards. Int. J. Ind. Ergon. 2008, 38,
726-738.
29. Blood, R. P.; Ploger, J. D.; Johnson, P. W., Whole body vibration exposures in forklift
operators: comparison of a mechanical and air suspension seat. Ergonomics 2010, 53, 1385-
1394.
30. Irving, H. P., Physics of the Human Body. 1st ed.; Springer-Verlag: Berlin, 2007.
31. Gallagher, S.; Marras, W. S.; Litsky, A. S.; Burr, D., Torso flexion loads and the fatigue
failure of human lumbosacral motion segments. Spine 2005, 30, 2265-2273.
32. Mital, A.; Pennathur, A.; Kansal, A., Nonfatal occupational injuries in the United States
Part II - back injuries. International Journal of Industrial Ergonomics 1999, 25, 131-150.
33. Ayari, H.; Thomas, M.; Dore, S.; Serrus, O., Evaluation of lumbar vertebra injury risk to
the seated human body when exposed to vertical vibration. Journal of Sound and Vibration 2009,
321, 454-470.
34. Cavanaugh, J. M.; Ozaktay, A. C.; Yamashita, T.; Avramov, A.; Getchell, T. V.; King, A.
I., Mechanisms of low back pain - Neurophysiologic and neuroanatomic study. Clinical
Orthopaedics and Related Research 1997, 166-180.
35. Cavanaugh, J. M., Neural mechanisms of lumbar pain. Spine 1995, 20, 1804-1809.
36. Benzel, E. C., Biomechanics of Spine Stabilization. American Association of
Neurological Surgeons: Rolling Meadows, 2001.

85
37. Yamashita, T.; Minaki, Y.; Ozaktay, A. C.; Cavanaugh, J. M.; King, A. I., A
morphological study of the fibrous capsule of the human lumbar facet joint. Spine 1996, 21, 538-
43.
38. ISO, Mechanical vibration and shock - evaluation of human exposure to whole-body
vibration. Part 1: General requirements. In ISO 2631-1, International Standard Organization:
1997.
39. ISO, Mechanical vibration and shock - evaluation of human exposure to whole-body
vibration. Part 5: Method for evaluation of vibration containing multiple shocks. In ISO 2631-5,
International Standard Organization: 2004.
40. Maeda, S.; Mansfield, N. J.; Shibata, N., Evaluation of subjective responses to whole-
body vibration exposure: Effect of frequency content. International Journal of Industrial
Ergonomics 2008, 38, 509-515.
41. Dong, R. G.; Welcome, D. E.; McDowell, T. W., Some important oversights in the
assessment of whole-body vibration exposure based on ISO-2631-1. Applied Ergonomics 2012,
43, 268-269.
42. Paddan, G. S.; Griffin, M. J., Evaluation of whole-body vibration in vehicles. Journal of
Sound and Vibration 2002, 253, 195-213.
43. Seidel, H.; Hinz, B.; Hofmann, J.; Menzel, G., Intraspinal forces and health risk caused
by whole-body vibration-Predictions for European drivers and different field conditions.
International Journal of Industrial Ergonomics 2008, 38, 856-867.
44. Paschold, H. W.; Sergeev, A. V., Whole-body vibration knowledge survey of US
occupational safety and health professionals. Journal of Safety Research 2009, 40, 171-176.
45. Paddan, G. S.; Griffin, M. J., Effect of seating on exposures to whole-body vibration in
vehicles. Journal of Sound and Vibration 2002, 253, 215-241.
46. Toward, M. G. R.; Griffin, M. J., Apparent mass of the human body in the vertical
direction: effect of a footrest and a steering wheel. Journal of Sound and Vibration 2010, 329,
1586-1596.
47. Pitzen, T.; Geisler, F.; Matthis, D.; Muller-Storz, H.; Barbier, D.; Steudel, W. I.; Feldges,
A., A finite element model for predicting the biomechanical behaviour of the human lumbar
spine. Control Engineering Practice 2002, 10, 83-90.
48. Fagan, M. J.; Julian, S.; Mohsen, A. M., Finite element analysis in spine research.
Proceedings of the Institution of Mechanical Engineers Part H-Journal of Engineering in
Medicine 2002, 216, 281-298.
49. Wang, J. L.; Parnianpour, M.; Shirazi-Adl, A.; Engin, A. E.; Li, S.; Patwardhan, A.,
Development and validation of a viscoelastic finite element model of an L2/L3 motion segment.
Theoretical and Applied Fracture Mechanics 1997, 28, 81-93.
50. Kasra, M.; Shiraziadl, A.; Drouin, G., Dynamics of human lumbar intervertebral joints –
Experimental and finite-element investigations. Spine 1992, 17, 93-102.
51. Seidel, H.; Bluthner, R.; Hinz, B., Application of finite-element models to predict forces
acting on the lumbar spine during whole-body vibration. Clinical Biomechanics 2001, 16, S57-
S63.
52. Guo, L. X.; Teo, E. C.; Lee, K. K.; Zhang, Q. H., Vibration characteristics of the human
spine under axial cyclic loads: Effect of frequency and damping. Spine 2005, 30, 631-637.
53. Suri, P.; Miyakoshi, A.; Hunter, D.; Jarvik, J.; Rainville, J.; Guermazi, A.; Li, L.; Katz, J.,
Does lumbar spinal degeneration begin with the anterior structures? A study of the observed
epidemiology in a community-based population. BMC Musculoskeletal Disorders 2011, 12, 202.

86
54. Guo, L. X.; Zhang, M.; Teo, E. C., Influences of denucleation on contact force of facet
joints under whole body vibration. Ergonomics 2007, 50, 967-978.
55. Panjabi, M. M., In vivo measurements of spinal column vibrations. Journal of Bone
Surgery 1986, 5, 695-702.
56. El-Khatib, A.; Guillon, F., Lumbar intradiscal pressure and whole-body vibration - first
results. Clinical Biomechanics 2001, 16, S127-S134.
57. El-Khatib, A.; Guillon, F.; Domont, A., Vertical vibration transmission through the
lumbar spine of the seated subject - First results. Journal of Sound and Vibration 1998, 215, 763-
773.
58. Adams, M.; Hutton, W., Gradual Disc Prolapse. Spine 1985, 10, 8.
59. Balkovec, C.; McGill, S., Extent of nucleus pulposus migration in the annulus of porcine
intervertebral discs exposed to cyclic flexion only versus cyclic flexion and extension. Clinical
Biomechanics 2012, 27, 766-770.
60. Tampier, C.; Drake, J. D. M.; Callaghan, J. P.; McGill, S. M., Progressive disc herniation
- An investigation of the mechanism using radiologic, histochemical, and microscopic dissection
techniques on a porcine model. Spine 2007, 32, 2869-2874.
61. ISO, Mechanical vibration and shock - Evaluation of human exposure to whole-body
vibration. International Organization for Standardization: 1997-2004; Vol. ISO 2631.
62. Stewart, J., Calculus – Early Transcendentals. Thomson Brooks/Cole.: Belmont, 2003.
63. Keller, T. S.; Colloca, C. J., A rigid body model of the dynamic posteroanterior motion
response of the human lumbar spine. Journal of Manipulative and Physiological Therapeutics
2002, 25, 485-496.
64. Aimedieu, P.; Mitton, D.; Faure, J. P.; Denninger, L.; Lavaste, F., Dynamic stiffness and
damping of porcine muscle specimens. Medical Engineering & Physics 2003, 25, 795-799.
65. Carragee, E. J.; Alamin, T. F.; Carragee, J. M., Low-pressure positive discography in
subjects asymptomatic of significant low back pain illness. Spine 2006, 31, 505-509.
66. Cohen, S. P.; Larkin, T. M.; Barna, S. A.; Palmer, W. E.; Hecht, A. C.; Stojanovic, M. P.,
Lumbar discography: A comprehensive review of outcome studies, diagnostic accuracy, and
principles. Regional Anesthesia and Pain Medicine 2005, 30, 163-183.
67. Gruber, H. E.; Ingram, J.; Hanley, E. N., An improved staining method for intervertebral
disc tissue. Biotechnic & Histochemistry 2002, 77, 81-83.
68. Leung, V. Y. L.; Chan, W. C. W.; Hung, S. C.; Cheung, K. M. C.; Chan, D., Matrix
Remodeling During Intervertebral Disc Growth and Degeneration Detected by Multichromatic
FAST Staining. Journal of Histochemistry & Cytochemistry 2009, 57, 249-256.
69. Cancel, M.; Grimard, G.; Thuillard-Crisinel, D.; Moldovan, F.; Villemure, I., Effects of
in vivo static compressive loading on aggrecan and type II and X collagens in the rat growth
plate extracellular matrix. Bone 2009, 44, 306-315.
70. Rosenber.L, Chemical basis for histological use of safranin-O in study of articular
cartilage. Journal of Bone and Joint Surgery-American Volume 1971, A 53, 69-&.
71. Scott, J. E.; Dorling, J., Differential staining of acid glycosaminoglycans
(mucopolysaccharides) by alcian blue in salt solutions. Histochemie 1965, 5, 221-&.
72. McDowell, M. A.; Fryar, C. D.; Ogden, C. L.; Flegal, K. M. National Health Statistics
Report: Anthropometric Reference Data for Children and Adults: United States, 2003–
2006 Center for Disease Control and Prevention: 2008.
73. Lord, M. J.; Small, J. M.; Dinsay, J. M.; Watkins, R. G., Lumbar lordosis - Effects of
sitting and standing. Spine 1997, 22, 2571-2574.

87
74. Black, K. M.; McClure, P.; Polansky, M., The influence of different sitting positions on
cervical and lumbar posture. Spine 1996, 21, 65-70.
75. De Carvalho, D. E.; Soave, D.; Ross, K.; Callaghan, J. P., Lumbar spine and the pelvic
posture between standing and sitting: A radiologic investigation including reliatbility and
repeatablity of the lumbar lordosis measure. Journal of Manipulative and Physiological
Therapeutics 2010, 33, 48-55.
76. Bae, J. S.; Jang, J. S.; Lee, S. H.; Kim, J. U., A Comparison Study on the Change in
Lumbar Lordosis When Standing, Sitting on a Chair, and Sitting on the Floor in Normal
Individuals. Journal of Korean Neurosurgical Society 2012, 51, 20-23.
77. Adams, M. A.; Hutton, W. C., The effect of posture on the lumbar spine. Journal of Bone
and Joint Surgery-British Volume 1985, 67, 625-629.