Embed Size (px)
Citation preview

AGM2014Wacker Neuson SEMunich, May 27, 2014
Executive Board Report
Cem Peksaglam (CEO)Martin Lehner (CTO)Günther Binder (CFO)
1
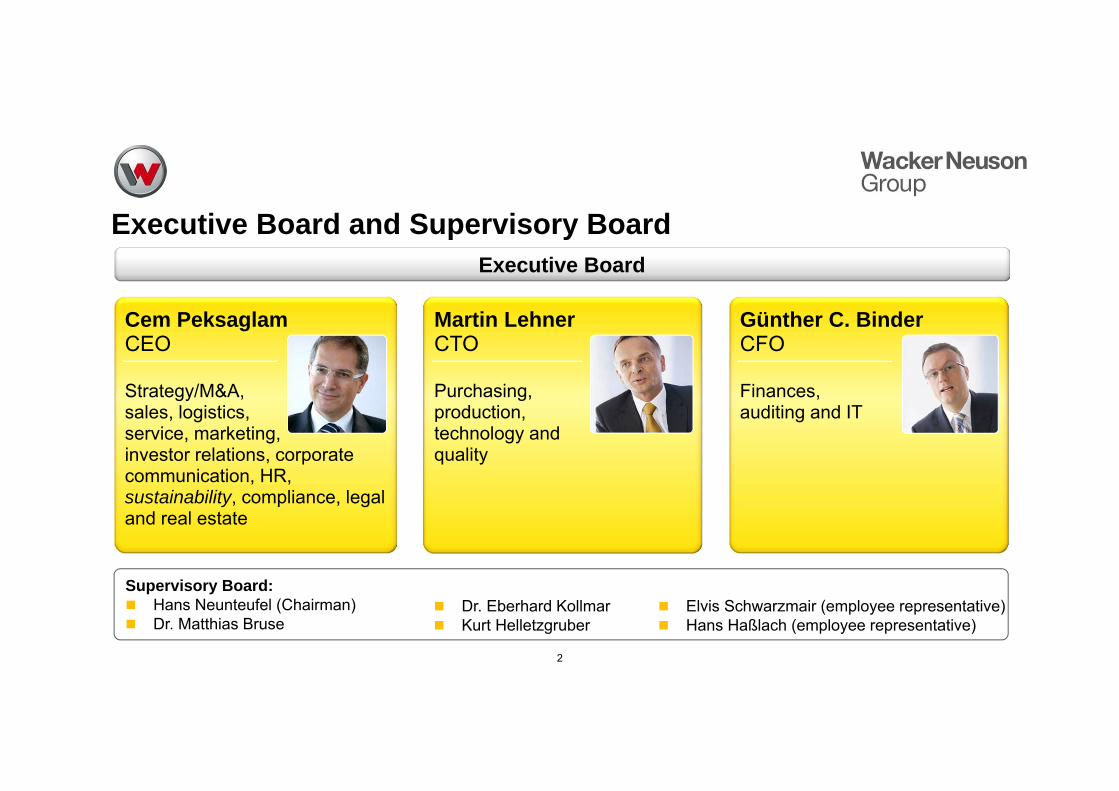
Executive Board and Supervisory Board
2
Executive Board
Supervisory Board: Hans Neunteufel (Chairman) Dr. Matthias Bruse
Dr. Eberhard Kollmar Kurt Helletzgruber
Elvis Schwarzmair (employee representative) Hans Haßlach (employee representative)
Cem PeksaglamCEO
Strategy/M&A,sales, logistics,service, marketing,investor relations, corporate communication, HR,sustainability, compliance, legal and real estate
Günther C. Binder CFO
Finances,auditing and IT
Martin LehnerCTO
Purchasing,production,technology andquality
Contents
3
Fiscal 2013
AGM
Markets - Vision -Strategy
Financial indicators and share news
Q1 2014 Technology and innovation
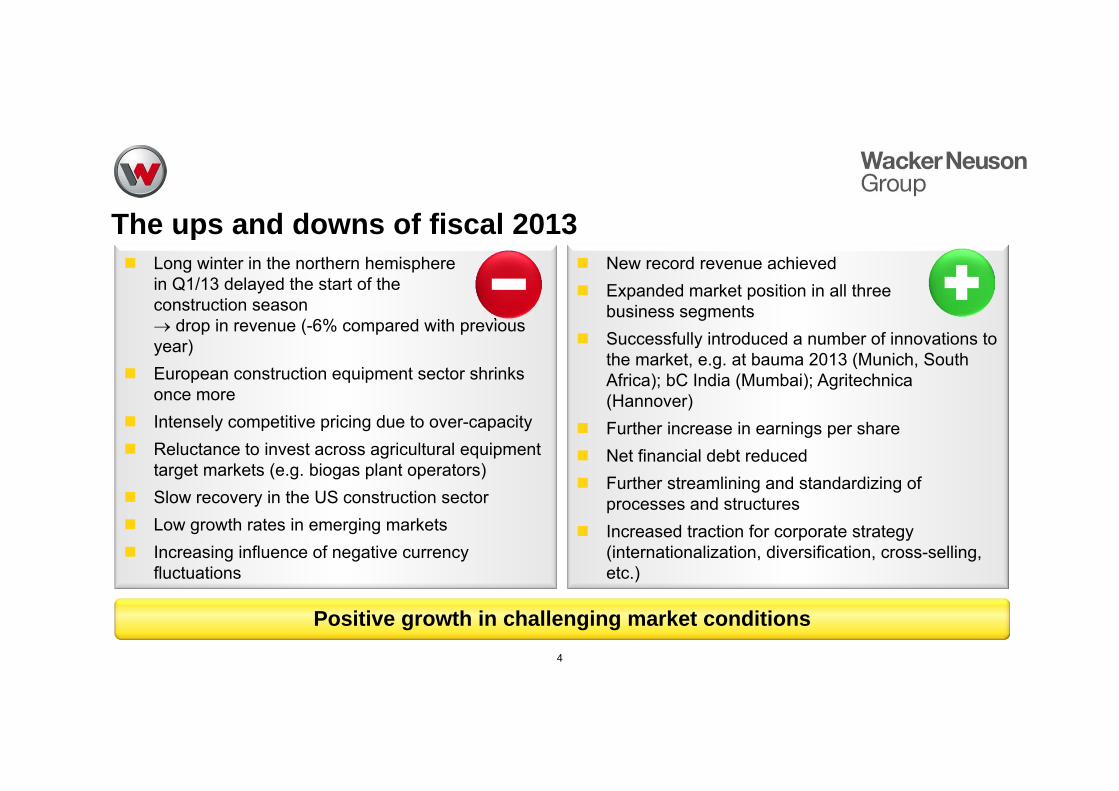
The ups and downs of fiscal 2013
4
Long winter in the northern hemispherein Q1/13 delayed the start of the construction season drop in revenue (-6% compared with previous year)
European construction equipment sector shrinks once more
Intensely competitive pricing due to over-capacity Reluctance to invest across agricultural equipment
target markets (e.g. biogas plant operators) Slow recovery in the US construction sector Low growth rates in emerging markets Increasing influence of negative currency
fluctuations
Positive growth in challenging market conditions
New record revenue achieved Expanded market position in all three
business segments Successfully introduced a number of innovations to
the market, e.g. at bauma 2013 (Munich, South Africa); bC India (Mumbai); Agritechnica(Hannover)
Further increase in earnings per share Net financial debt reduced Further streamlining and standardizing of
processes and structures Increased traction for corporate strategy
(internationalization, diversification, cross-selling, etc.)
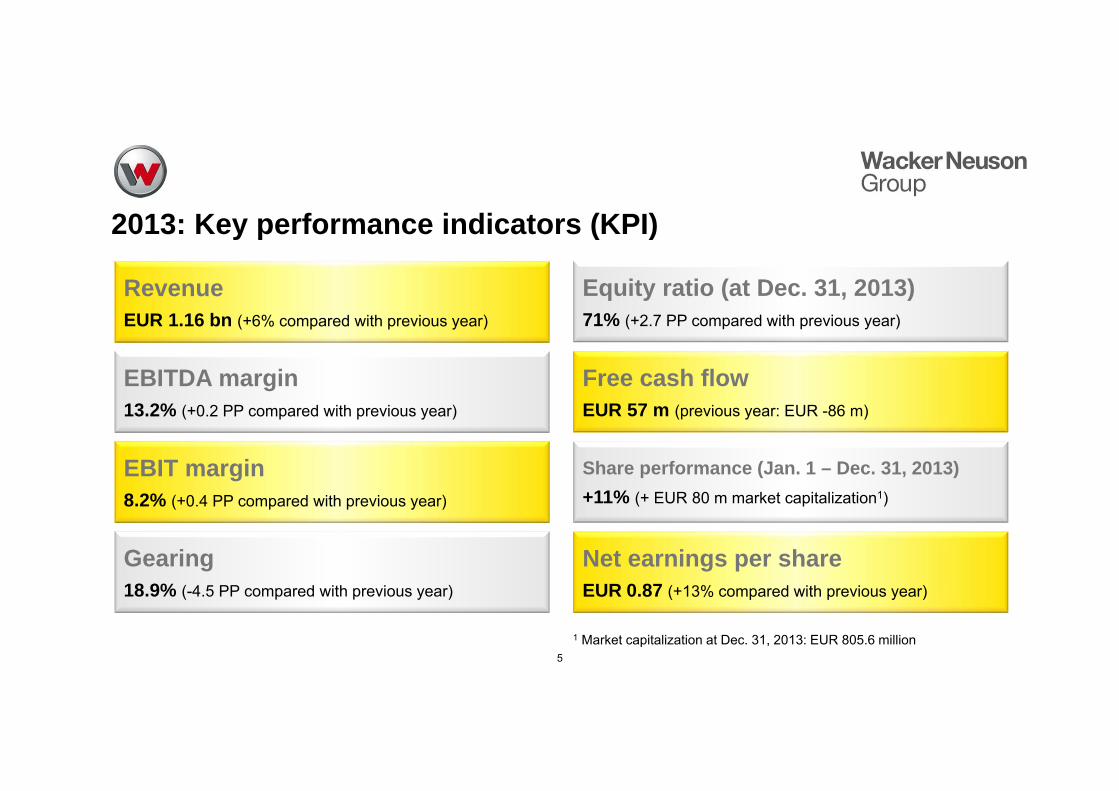
2013: Key performance indicators (KPI)
5
RevenueEUR 1.16 bn (+6% compared with previous year)
EBITDA margin13.2% (+0.2 PP compared with previous year)
EBIT margin8.2% (+0.4 PP compared with previous year)
Equity ratio (at Dec. 31, 2013)71% (+2.7 PP compared with previous year)
Free cash flowEUR 57 m (previous year: EUR -86 m)
Share performance (Jan. 1 – Dec. 31, 2013)+11% (+ EUR 80 m market capitalization1)
Gearing18.9% (-4.5 PP compared with previous year)
Net earnings per shareEUR 0.87 (+13% compared with previous year)
1 Market capitalization at Dec. 31, 2013: EUR 805.6 million
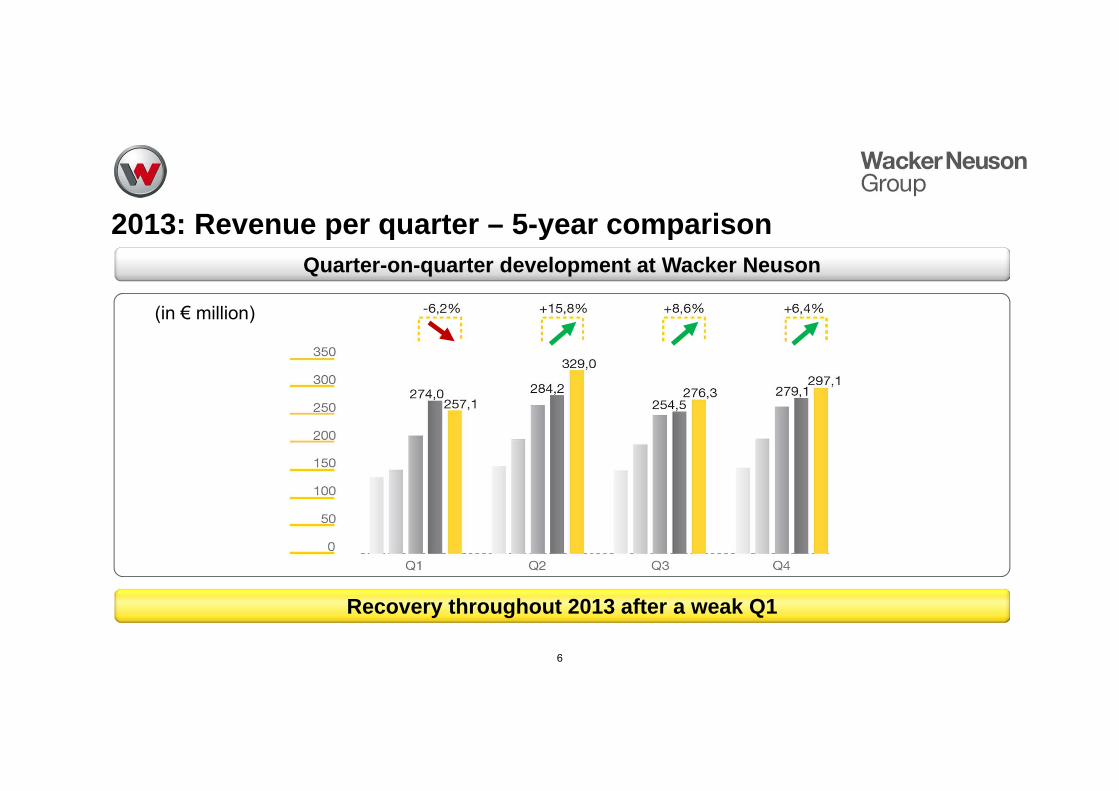
2013: Revenue per quarter – 5-year comparison
6
(in € million)
Quarter-on-quarter development at Wacker Neuson
Recovery throughout 2013 after a weak Q1
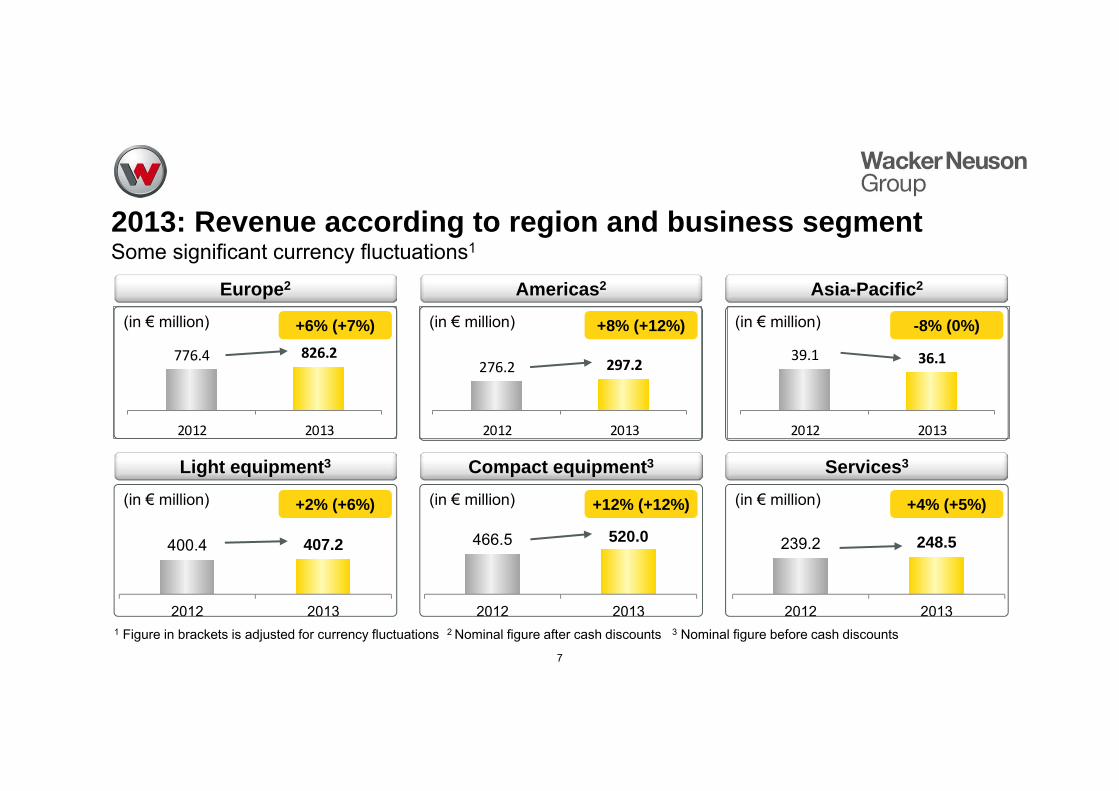
776.4 826.2
2012 2013
276.2 297.2
2012 2013
39.1 36.1
2012 2013
400.4 407.2
2012 2013
466.5 520.0
2012 2013
239.2 248.5
2012 2013
Europe2
(in € million)
Americas2
(in € million)
Asia-Pacific2
(in € million)
Light equipment3 Compact equipment3
(in € million)
Services3
(in € million)(in € million)
2013: Revenue according to region and business segmentSome significant currency fluctuations1
7
1 Figure in brackets is adjusted for currency fluctuations
-8% (0%)+6% (+7%) +8% (+12%)
+2% (+6%) +12% (+12%) +4% (+5%)
2 Nominal figure after cash discounts 3 Nominal figure before cash discounts
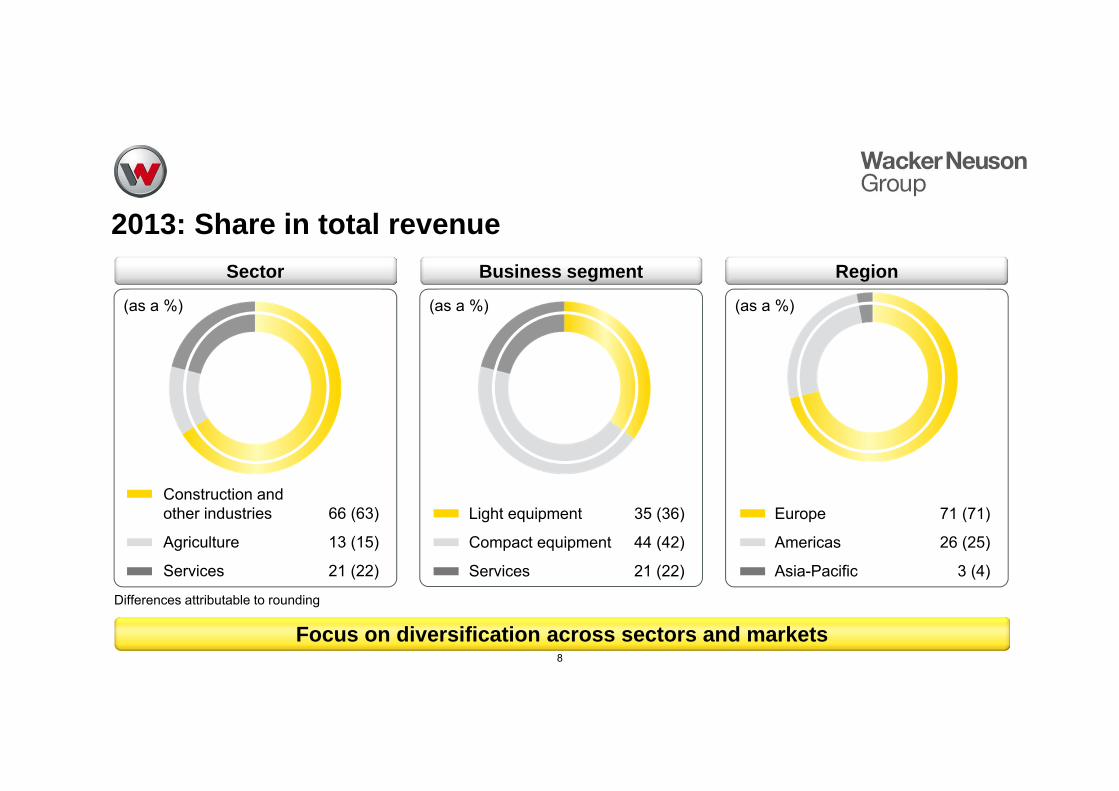
2013: Share in total revenue
8
Focus on diversification across sectors and markets
Sector Business segment Region
Differences attributable to rounding
(as a %)
Construction and other industries 66 (63)
Agriculture 13 (15)
Services 21 (22)
(as a %) (as a %)
Light equipment 35 (36)
Compact equipment 44 (42)
Services 21 (22)
Europe 71 (71)
Americas 26 (25)
Asia-Pacific 3 (4)
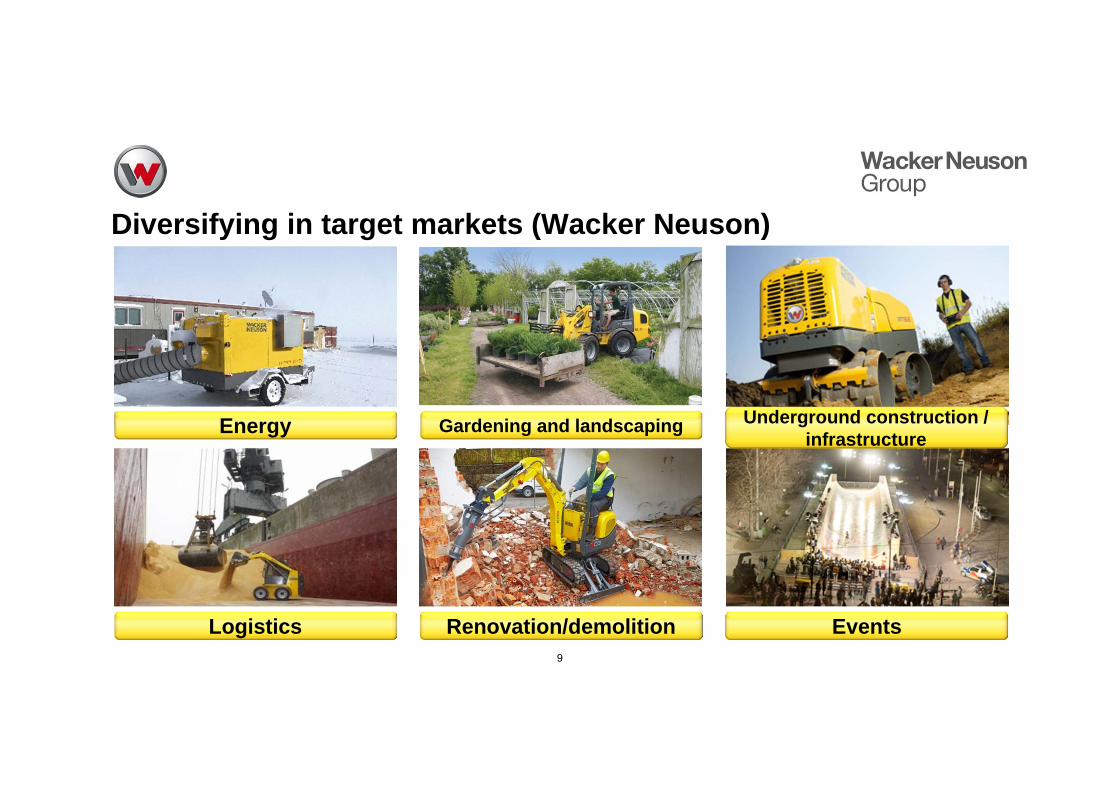
Diversifying in target markets (Wacker Neuson)
9
Gardening and landscaping
Logistics Renovation/demolition Events
Underground construction / infrastructureEnergy
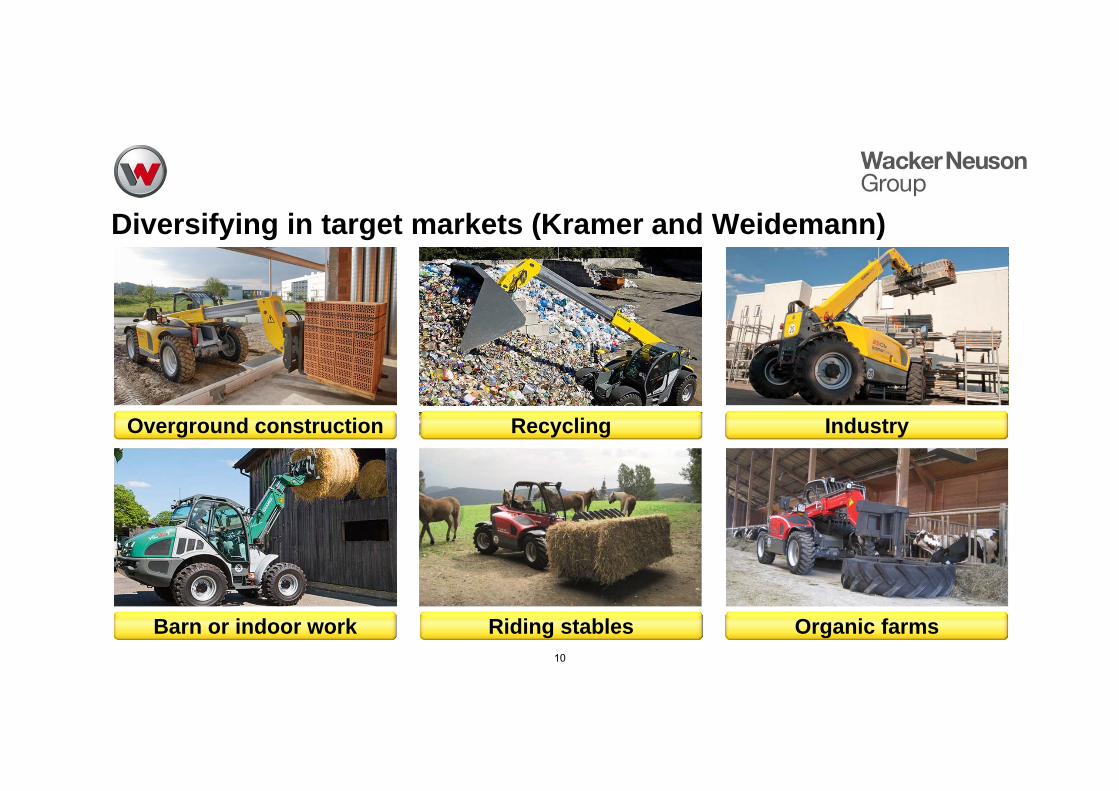
Diversifying in target markets (Kramer and Weidemann)
10
Overground construction Industry
Barn or indoor work Riding stables Organic farms
Recycling
Contents
11
Fiscal 2013
AGM
Markets - Vision -Strategy
Financial indicators and share news
Q1 2014 Technology and innovation
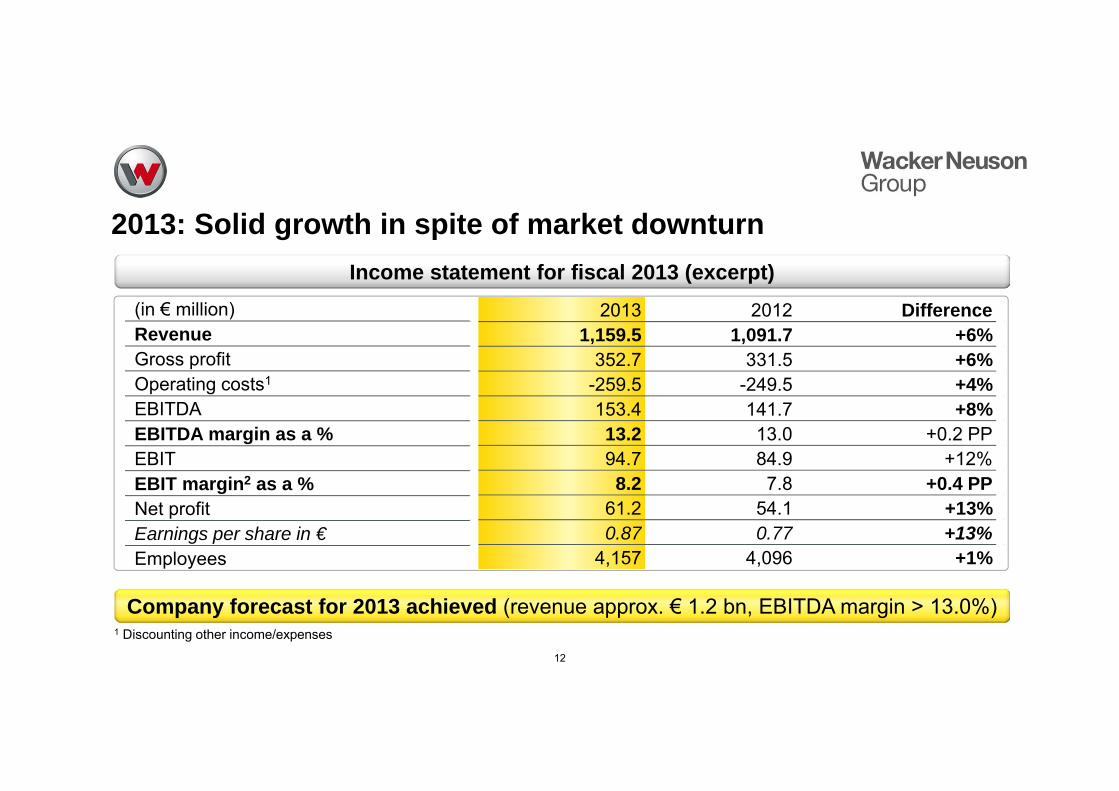
2013: Solid growth in spite of market downturn
(in € million)RevenueGross profitOperating costs1
EBITDAEBITDA margin as a %EBITEBIT margin2 as a %Net profitEarnings per share in €Employees
2013 2012 Difference1,159.5 1,091.7 +6%
352.7 331.5 +6%-259.5 -249.5 +4%153.4 141.7 +8%13.2 13.0 +0.2 PP94.7 84.9 +12%
8.2 7.8 +0.4 PP61.2 54.1 +13%0.87 0.77 +13%
4,157 4,096 +1%
12
1 Discounting other income/expenses
Income statement for fiscal 2013 (excerpt)
Company forecast for 2013 achieved (revenue approx. € 1.2 bn, EBITDA margin > 13.0%)
0%5%10%15%20%25%30%35%40%
0
50
100
150
200
250
300
2009 2010 2011 2012 2013
Cost of sales, R&Dand administration
as a % of revenue
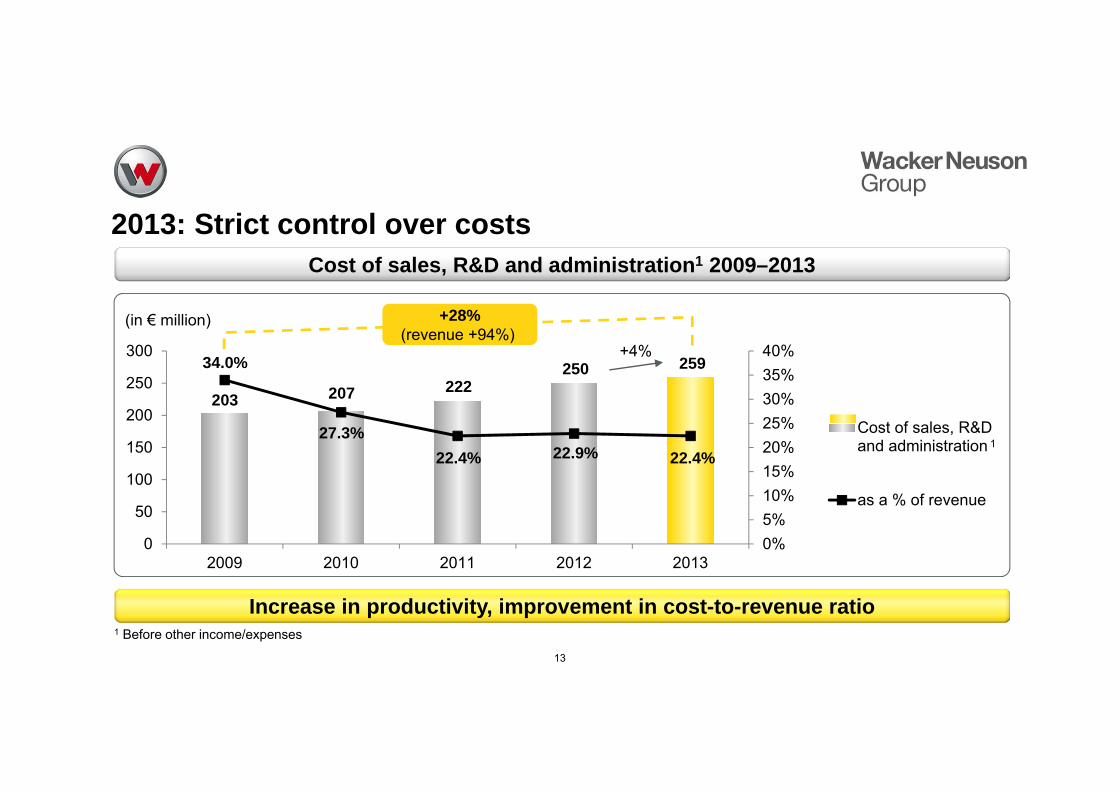
2013: Strict control over costs
34.0%
27.3%
(in € million)
22.9%
203 207 222250
+28%(revenue +94%)
259
22.4%
+4%
22.4%
13
1
1 Before other income/expenses
Cost of sales, R&D and administration1 2009–2013
Increase in productivity, improvement in cost-to-revenue ratio
Capital expenditure1
and depreciation/amortization
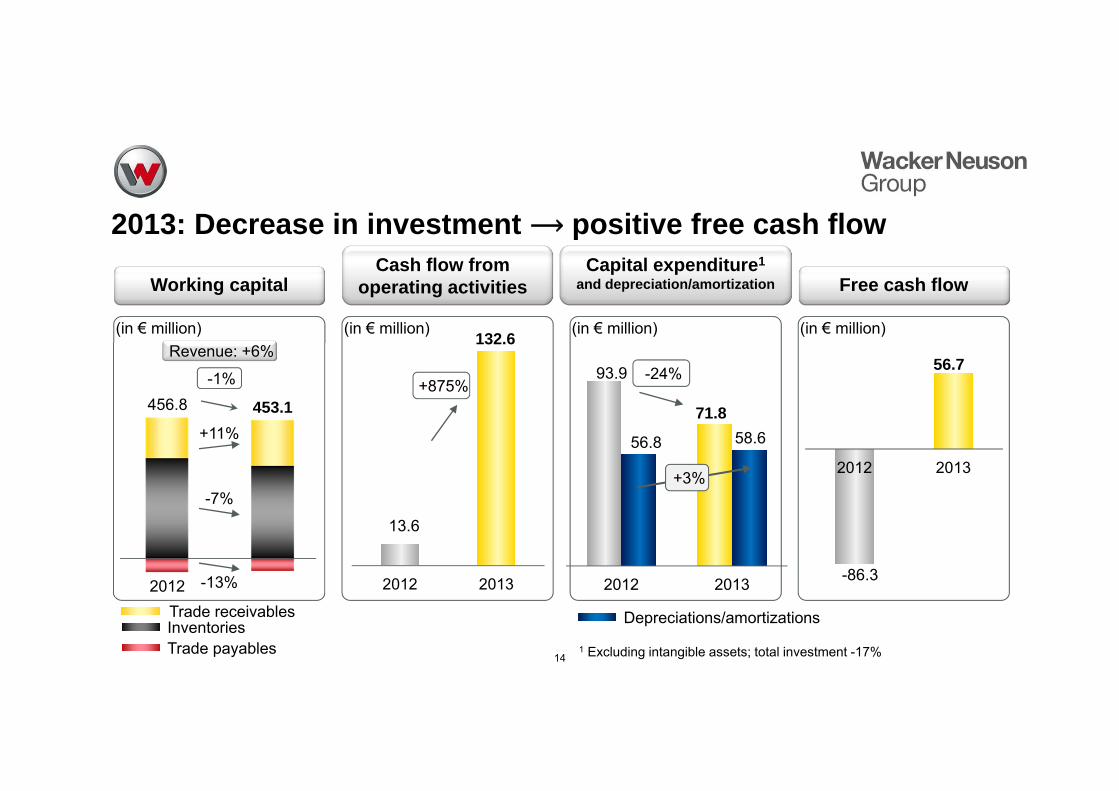
2013: Decrease in investment ⟶ positive free cash flow
14
Working capitalCash flow from
operating activities Free cash flow
Trade receivablesInventoriesTrade payables 1 Excluding intangible assets; total investment -17%
(in € million)
456.8 453.1
-1%
+11%
-7%
-13%2012
Revenue: +6%
2012 2013 2012 2013
2012 2013
71.8
93.9 -24%
132.6
13.6
+875%56.7
-86.3
(in € million) (in € million) (in € million)
+3%
56.8 58.6
Depreciations/amortizations
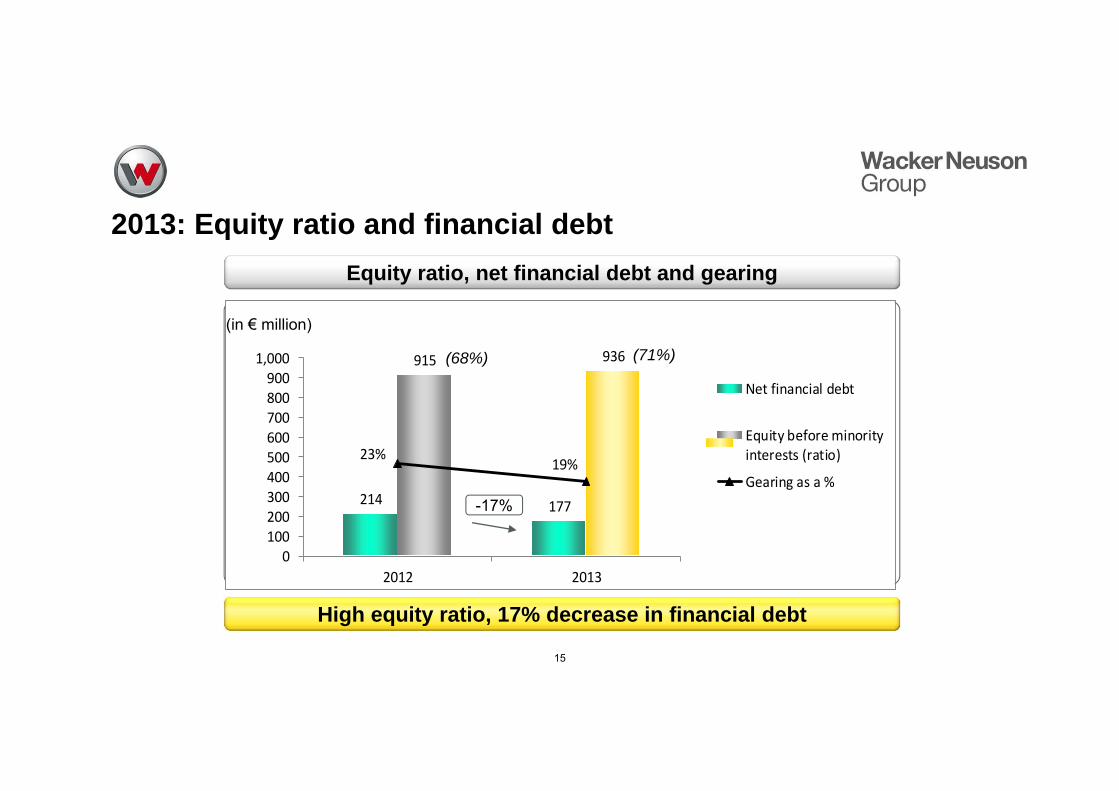
2013: Equity ratio and financial debt
15
Equity ratio, net financial debt and gearing
High equity ratio, 17% decrease in financial debt
214 177
915 936
23%19%
0.0%5.0%10.0%15.0%20.0%25.0%30.0%35.0%40.0%45.0%50.0%
0100200300400500600700800900
1,000
2012 2013
Net financial debt
Equity before minorityinterests (ratio)
Gearing as a %
(68%)
-17%
(71%)
(in € million)
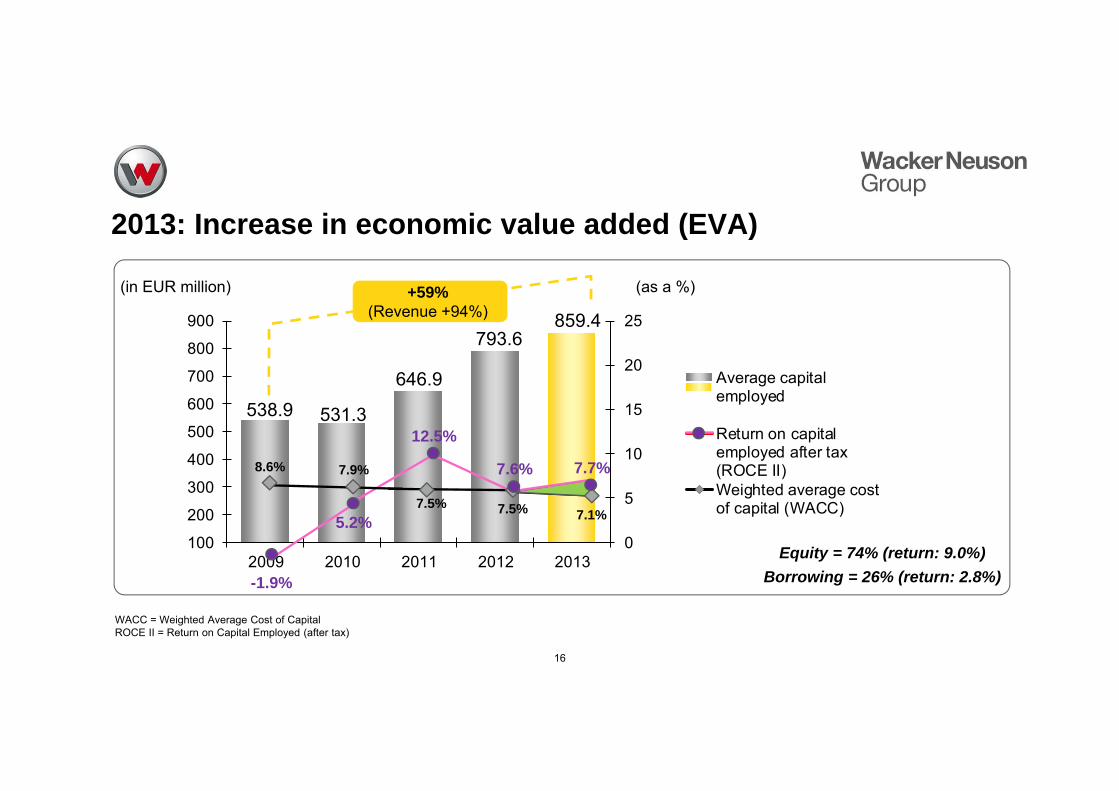
2013: Increase in economic value added (EVA)
0
5
10
15
20
25
100
200
300
400
500
600
700
800
900
2009 2010 2011 2012 2013
Average capitalemployed
Return on capitalemployed after tax(ROCE II)Weighted average costof capital (WACC)
(in EUR million) (as a %)
646.9
531.3538.9
WACC = Weighted Average Cost of CapitalROCE II = Return on Capital Employed (after tax)
-1.9%
12.5%
8.6% 7.9%
7.5%
793.6859.4
5.2%
7.6%
7.5%
7.7%
7.1%
16
Equity = 74% (return: 9.0%)Borrowing = 26% (return: 2.8%)
+59% (Revenue +94%)
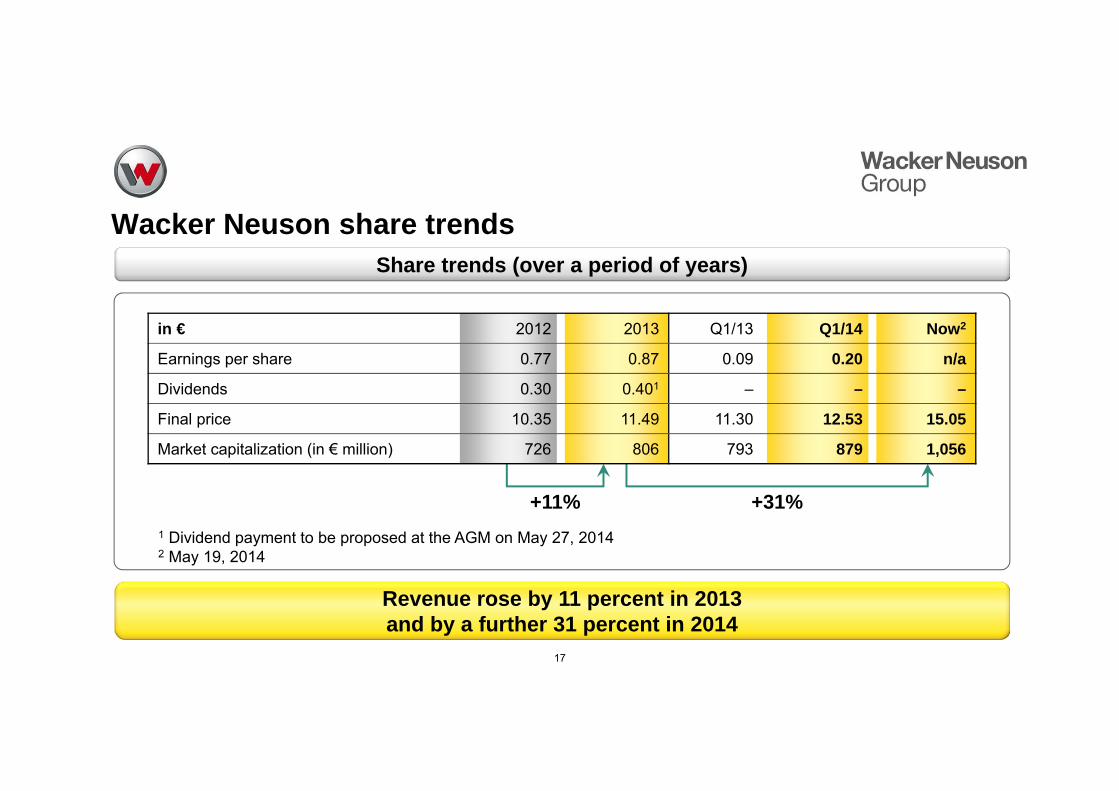
Wacker Neuson share trends
in € 2012 2013 Q1/13 Q1/14 Now2
Earnings per share 0.77 0.87 0.09 0.20 n/a
Dividends 0.30 0.401 – – –
Final price 10.35 11.49 11.30 12.53 15.05
Market capitalization (in € million) 726 806 793 879 1,056
1 Dividend payment to be proposed at the AGM on May 27, 20142 May 19, 2014
17
+31%+11%
Share trends (over a period of years)
Revenue rose by 11 percent in 2013and by a further 31 percent in 2014
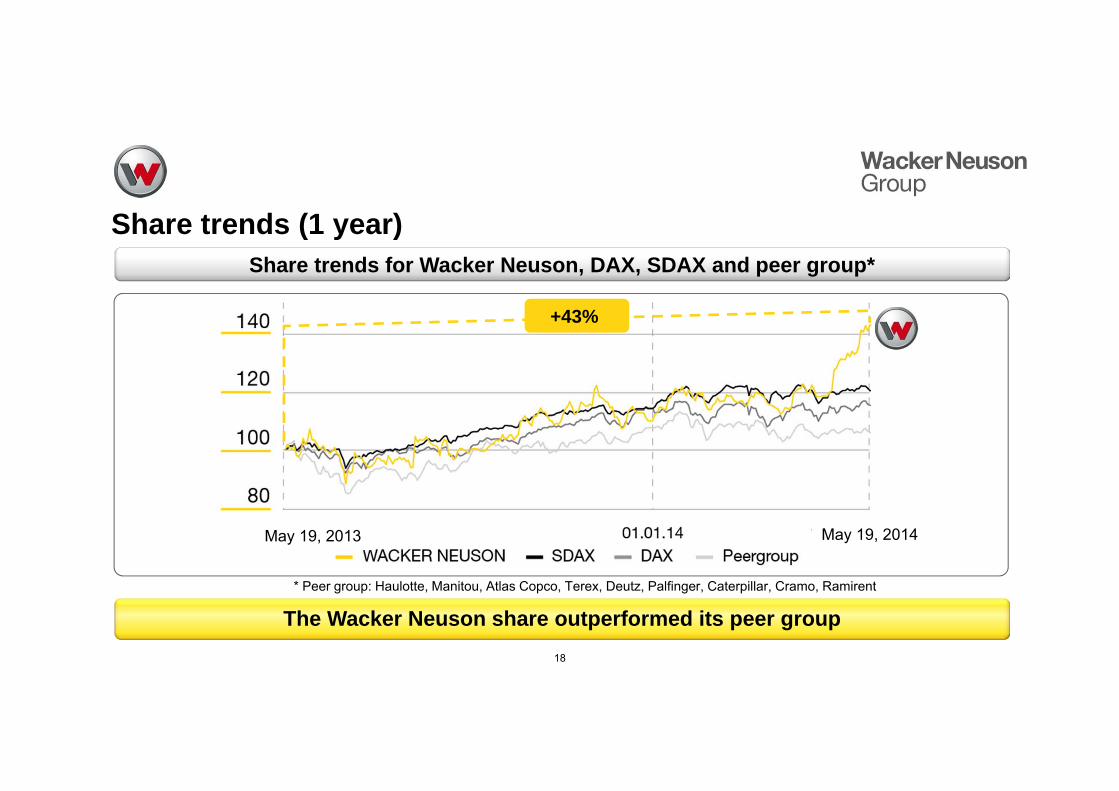
Share trends (1 year)
18
Share trends for Wacker Neuson, DAX, SDAX and peer group*
The Wacker Neuson share outperformed its peer group
+43%
May 19, 2014May 19, 2013
* Peer group: Haulotte, Manitou, Atlas Copco, Terex, Deutz, Palfinger, Caterpillar, Cramo, Ramirent
Contents
19
Fiscal 2013
AGM
Markets - Vision -Strategy
Financial indicators and share news
Q1 2014 Technology and innovation
Reference (apr02) 20
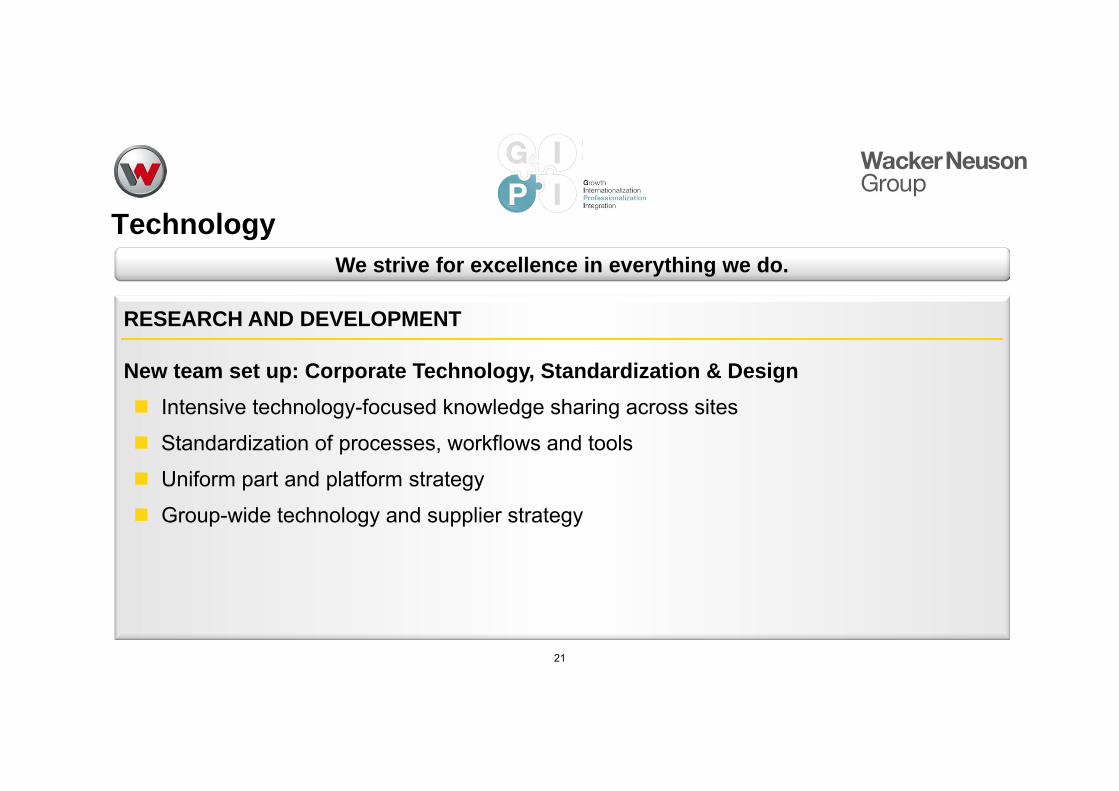
Technology
21
We strive for excellence in everything we do.
RESEARCH AND DEVELOPMENT
New team set up: Corporate Technology, Standardization & Design Intensive technology-focused knowledge sharing across sites
Standardization of processes, workflows and tools
Uniform part and platform strategy
Group-wide technology and supplier strategy
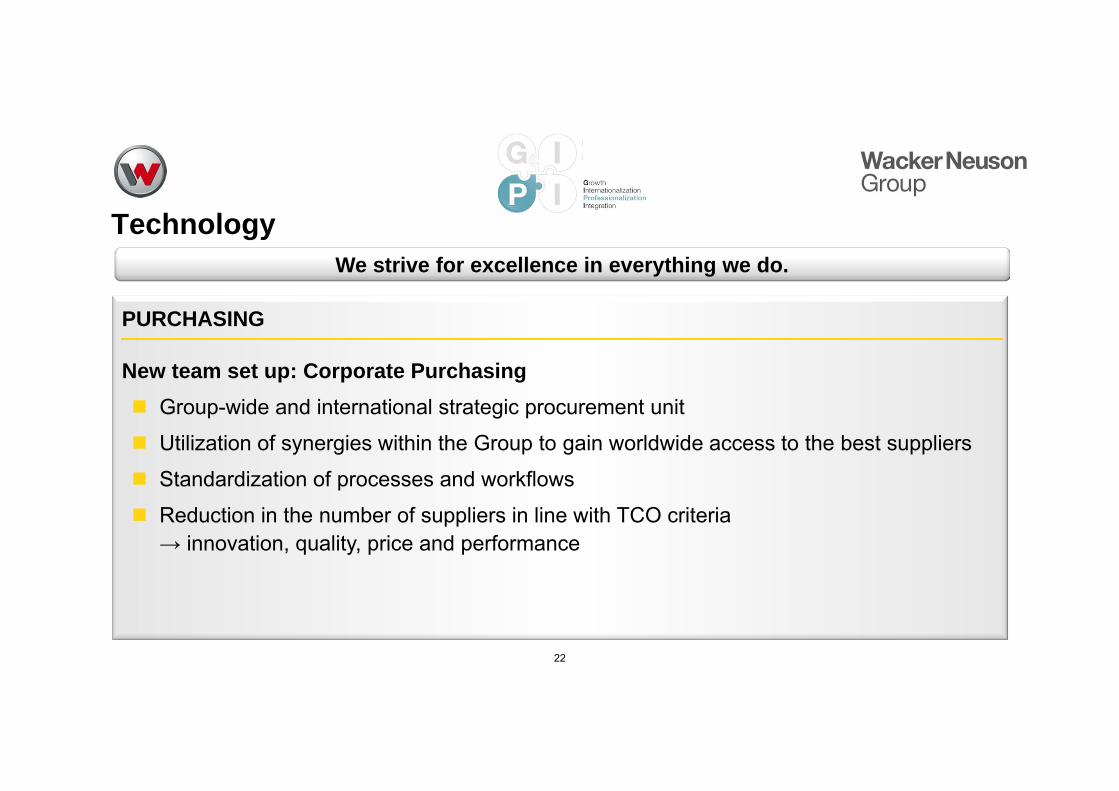
Technology
22
We strive for excellence in everything we do.
PURCHASING
New team set up: Corporate Purchasing Group-wide and international strategic procurement unit
Utilization of synergies within the Group to gain worldwide access to the best suppliers
Standardization of processes and workflows
Reduction in the number of suppliers in line with TCO criteria→ innovation, quality, price and performance
Technology
23
QUALITY
New team set up: Corporate Quality Quality planning is an integral part of our product development process
Continuous improvement in quality and cost
Standardization of processes and workflows
Steering and benchmarking of plants and suppliers using Group-wide KPIs
Preemptive qualification of suppliers and targeted focus on strategic suppliers
We strive for excellence in everything we do.
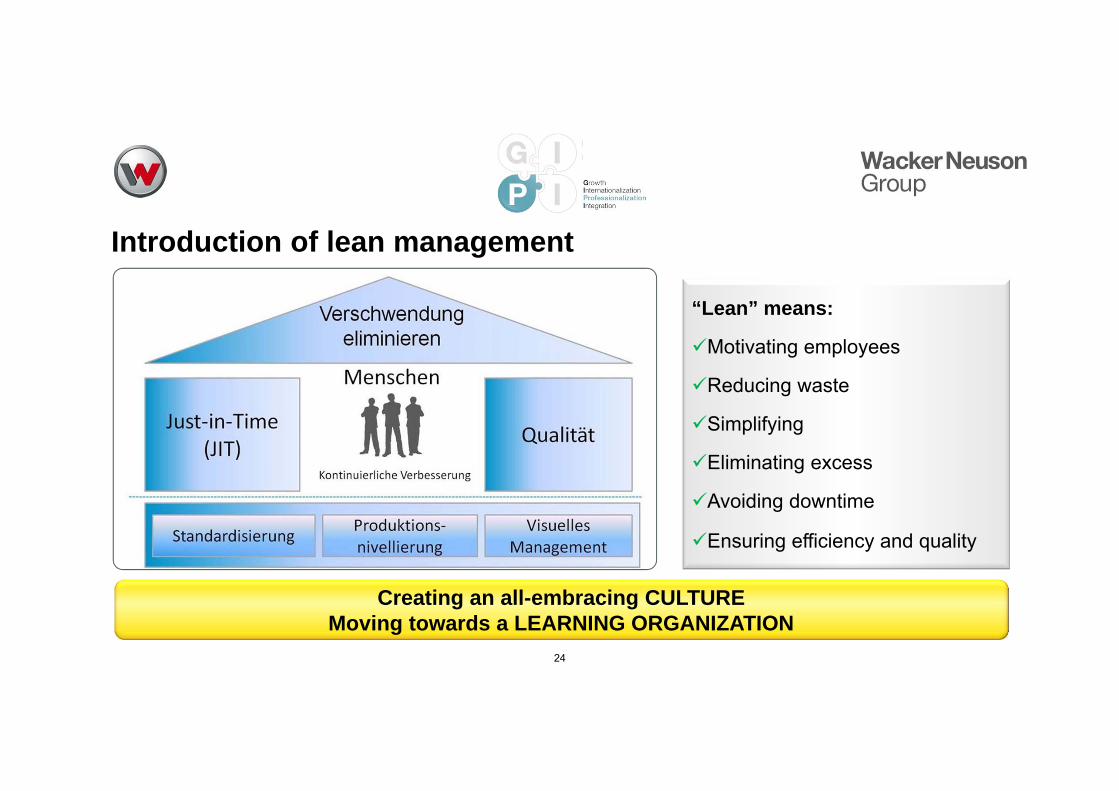
Introduction of lean management
24
“Lean” means:
Motivating employees
Reducing waste
Simplifying
Eliminating excess
Avoiding downtime
Ensuring efficiency and quality
Creating an all-embracing CULTURE Moving towards a LEARNING ORGANIZATION
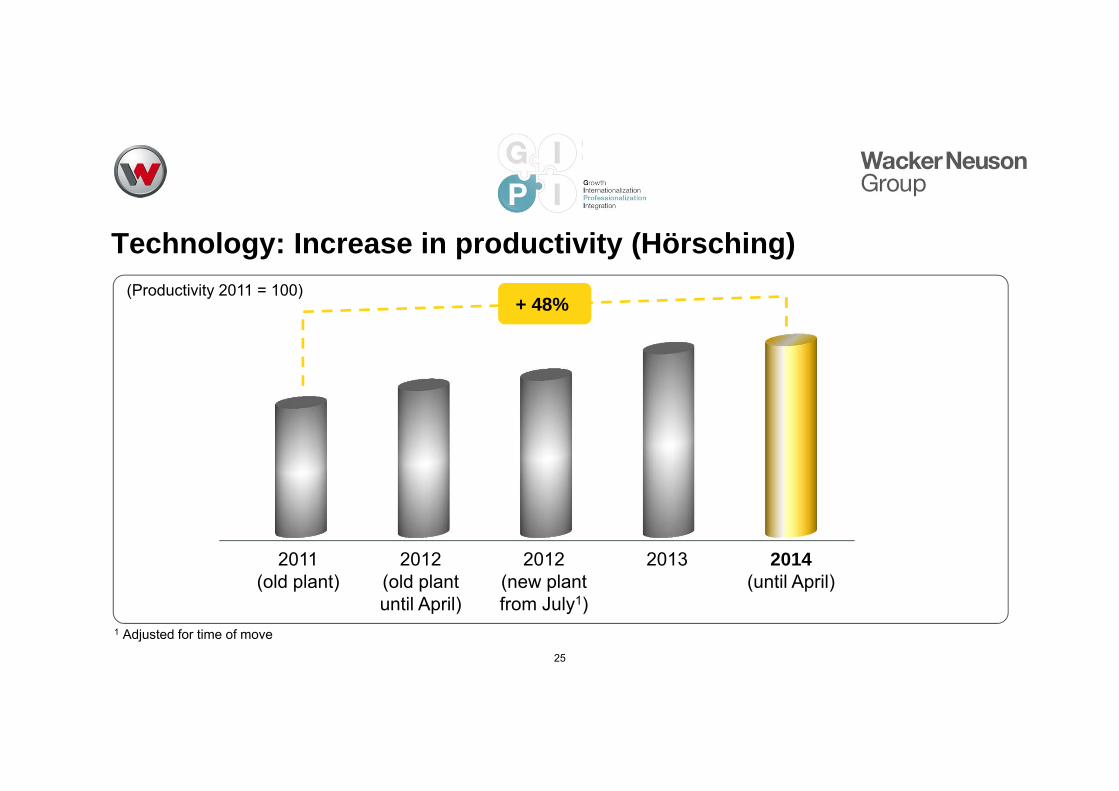
Technology: Increase in productivity (Hörsching)
25
Datenbasis BW
(Productivity 2011 = 100)
2011 (old plant)
2012 (old plant until April)
2012 (new plant from July1)
2013 2014(until April)
+ 48%
1 Adjusted for time of move
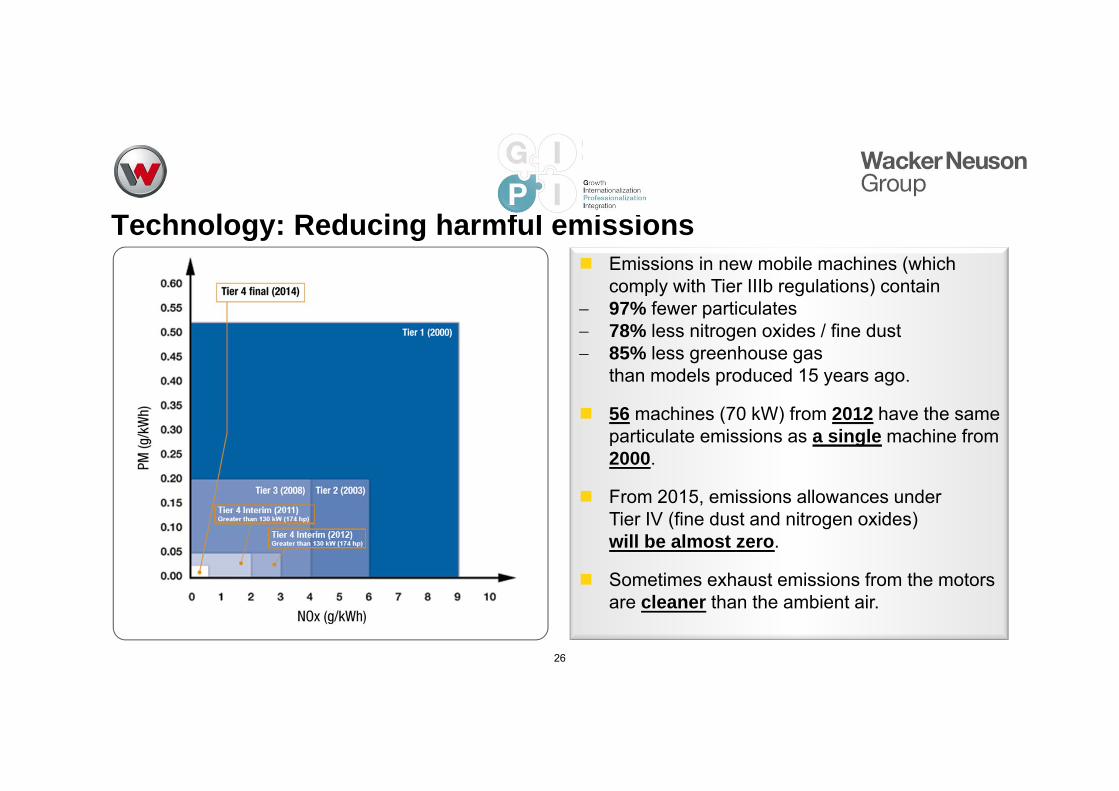
Technology: Reducing harmful emissions
26
Emissions in new mobile machines (which comply with Tier IIIb regulations) contain
97% fewer particulates 78% less nitrogen oxides / fine dust 85% less greenhouse gas
than models produced 15 years ago.
56 machines (70 kW) from 2012 have the same particulate emissions as a single machine from 2000.
From 2015, emissions allowances underTier IV (fine dust and nitrogen oxides)will be almost zero.
Sometimes exhaust emissions from the motors are cleaner than the ambient air.
Introduction of green ECO seal
27
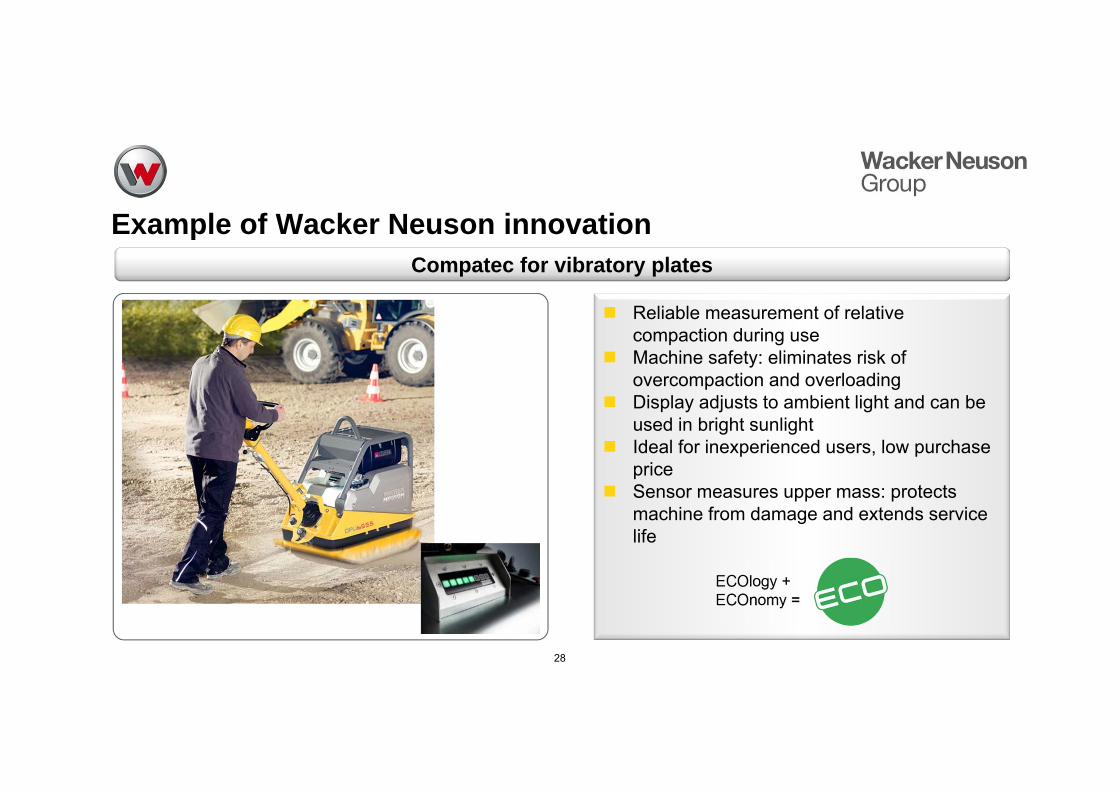
Example of Wacker Neuson innovation
28
Compatec for vibratory plates
Reliable measurement of relative compaction during use
Machine safety: eliminates risk of overcompaction and overloading
Display adjusts to ambient light and can be used in bright sunlight
Ideal for inexperienced users, low purchase price
Sensor measures upper mass: protects machine from damage and extends service life
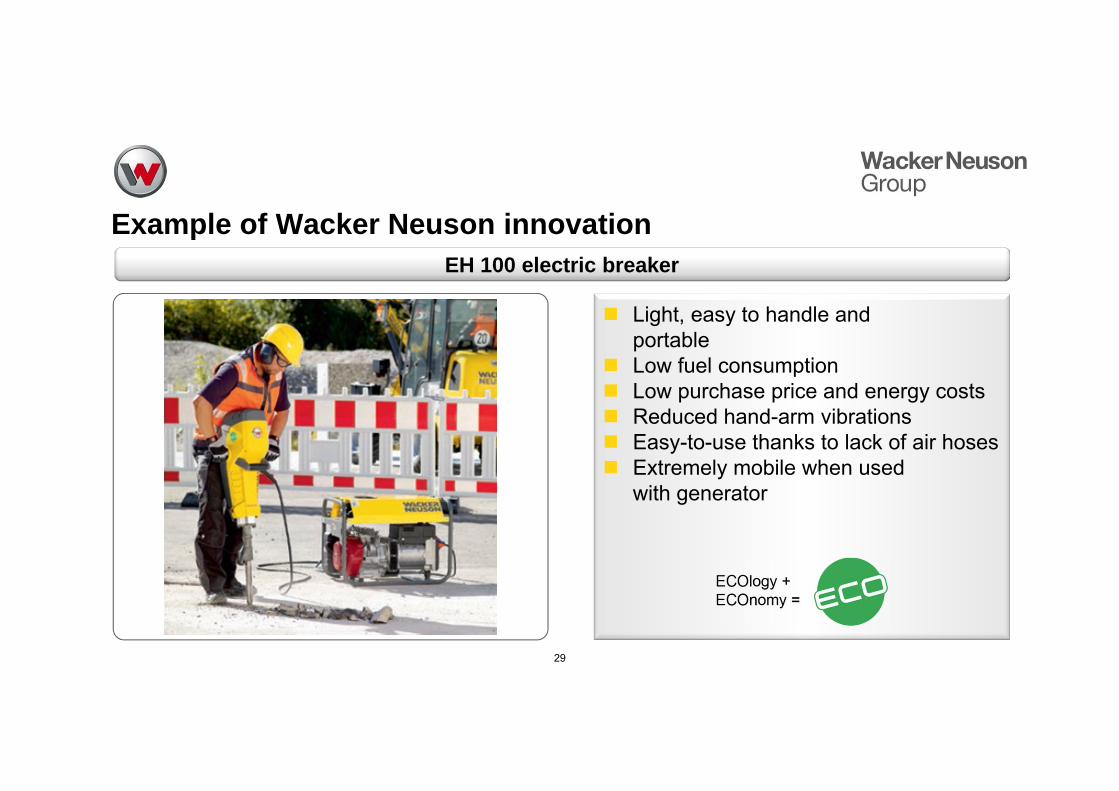
Light, easy to handle andportable
Low fuel consumption Low purchase price and energy costs Reduced hand-arm vibrations Easy-to-use thanks to lack of air hoses Extremely mobile when used
with generator
Example of Wacker Neuson innovation
29
EH 100 electric breaker
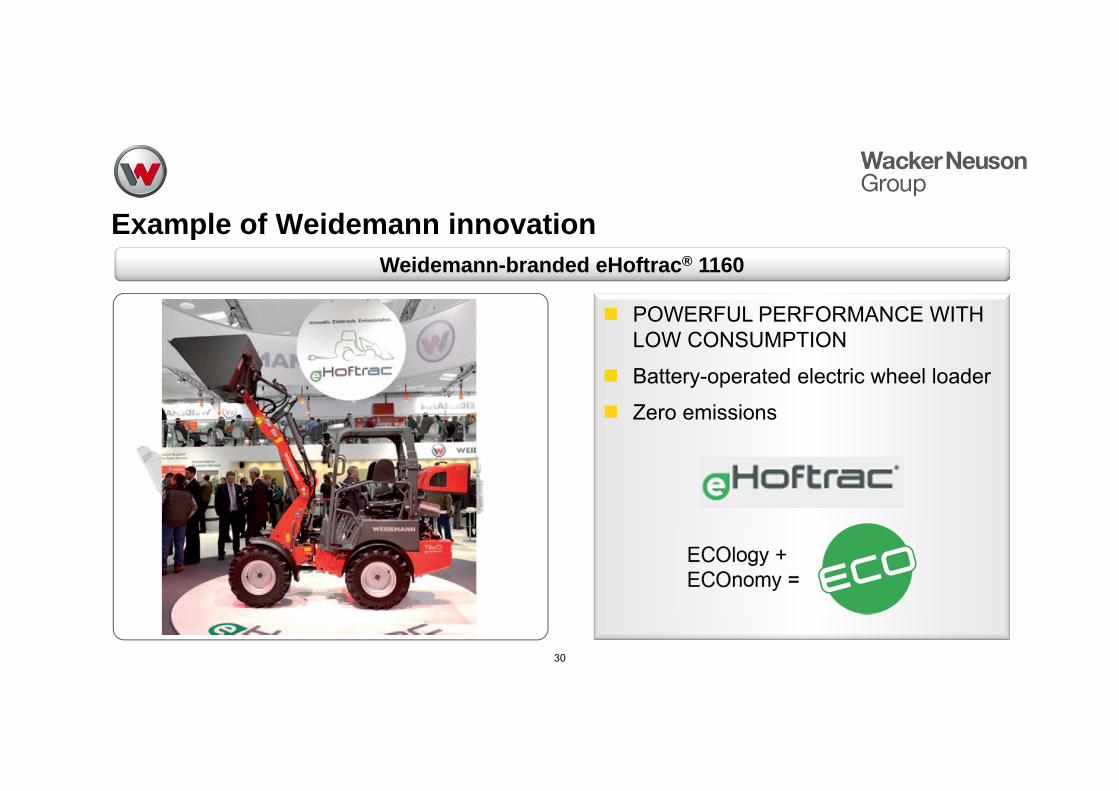
POWERFUL PERFORMANCE WITH LOW CONSUMPTION
Battery-operated electric wheel loader
Zero emissions
Example of Weidemann innovation
30
Weidemann-branded eHoftrac® 1160
Example of Wacker Neuson innovation
31
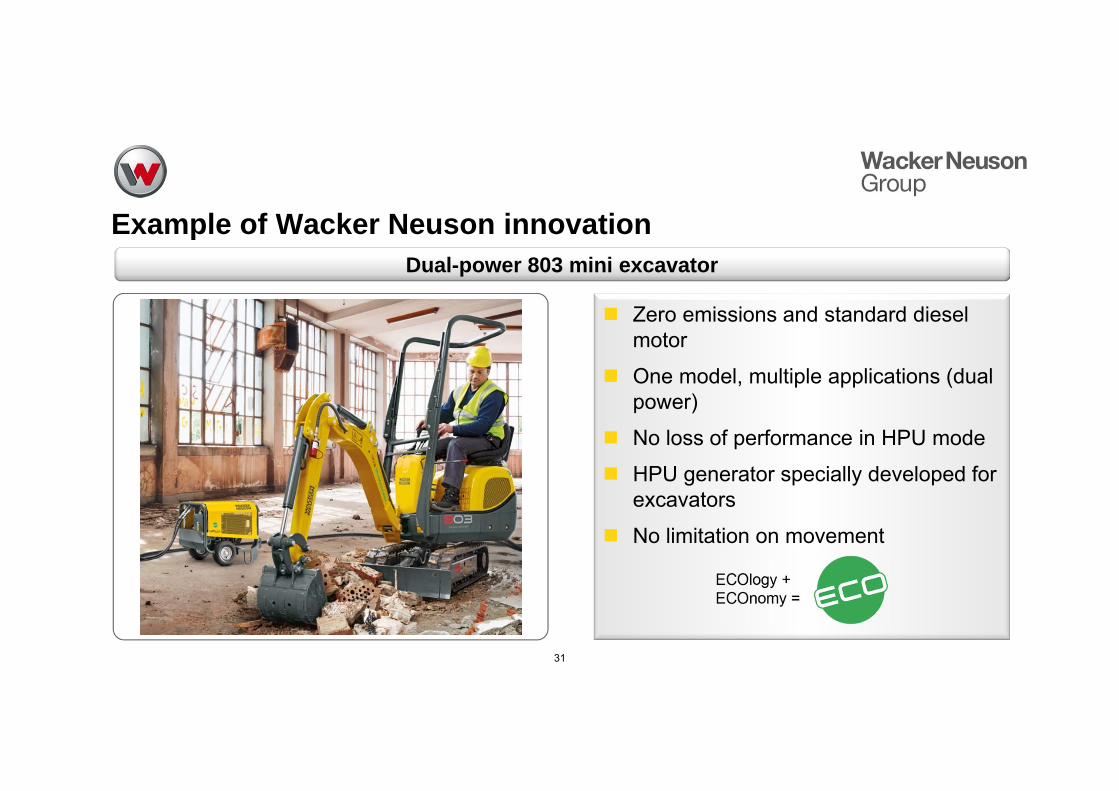
Dual-power 803 mini excavator
Zero emissions and standard diesel motor
One model, multiple applications (dual power)
No loss of performance in HPU mode
HPU generator specially developed for excavators
No limitation on movement
Contents
32
Fiscal 2013
AGM
Markets - Vision -Strategy
Financial indicators and share news
Q1 2014 Technology and innovation
33
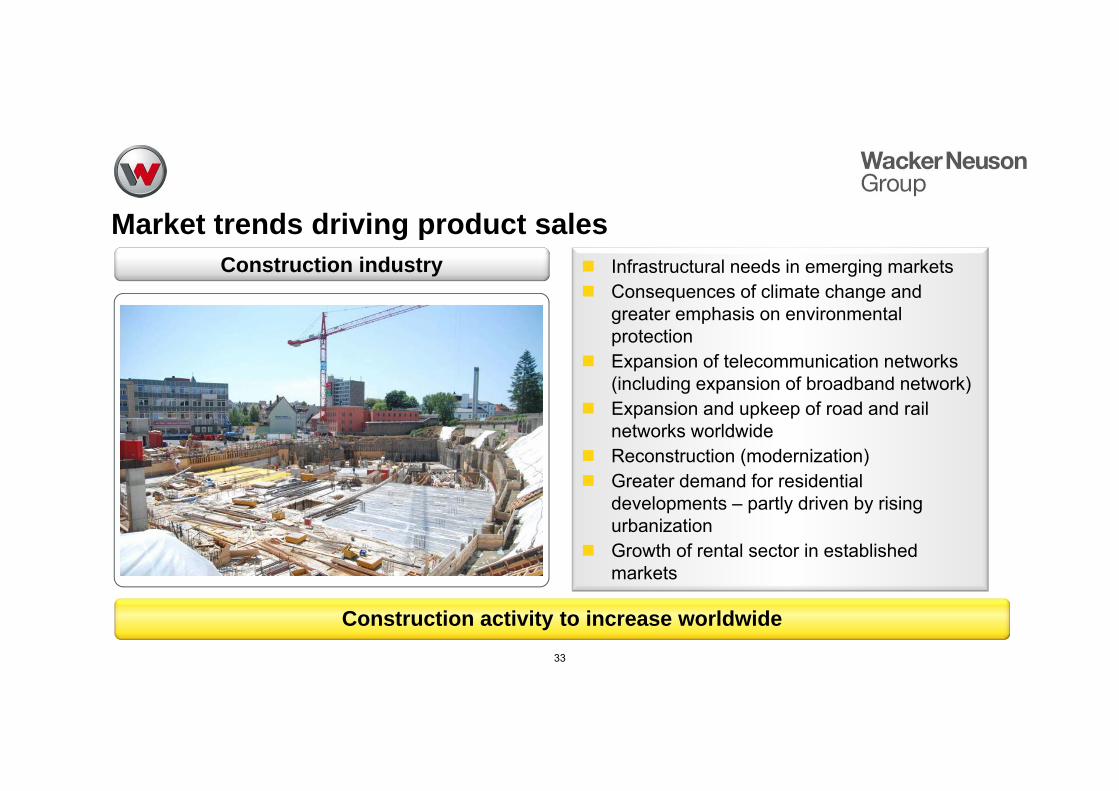
Market trends driving product sales
Construction activity to increase worldwide
Construction industry Infrastructural needs in emerging markets Consequences of climate change and
greater emphasis on environmental protection
Expansion of telecommunication networks (including expansion of broadband network)
Expansion and upkeep of road and rail networks worldwide
Reconstruction (modernization) Greater demand for residential
developments – partly driven by rising urbanization
Growth of rental sector in established markets
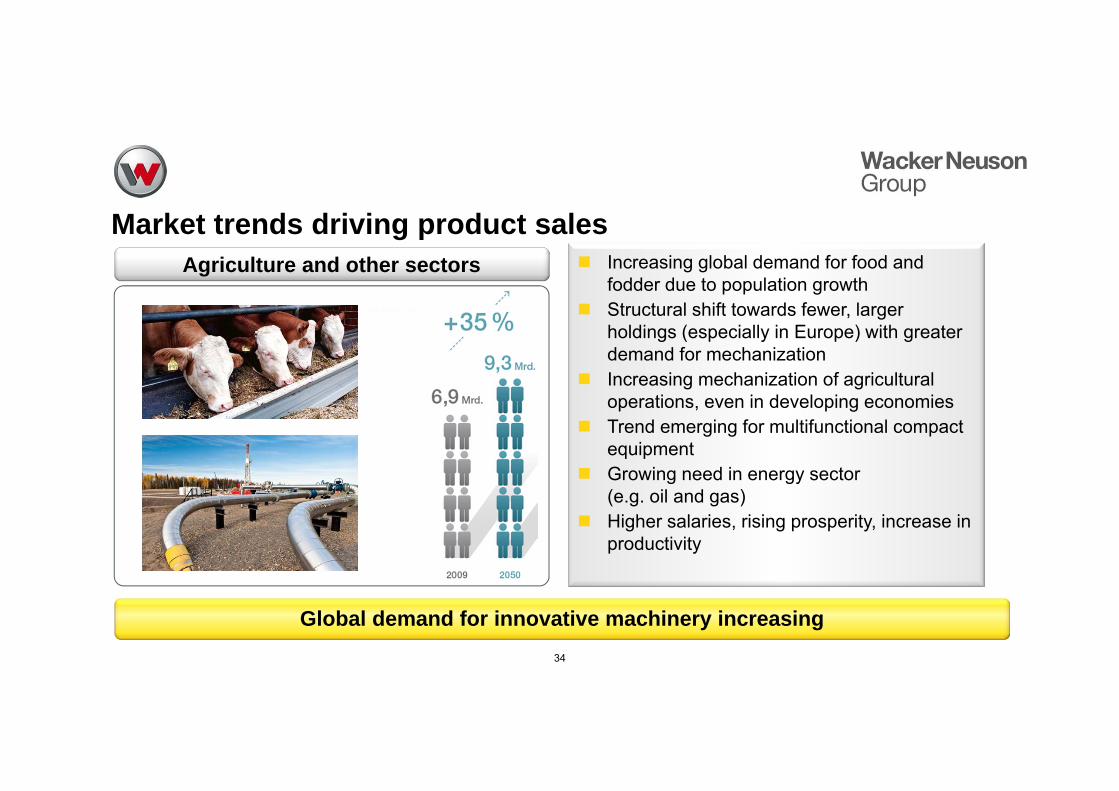
Market trends driving product sales
34
Global demand for innovative machinery increasing
Agriculture and other sectors Increasing global demand for food and fodder due to population growth
Structural shift towards fewer, larger holdings (especially in Europe) with greater demand for mechanization
Increasing mechanization of agricultural operations, even in developing economies
Trend emerging for multifunctional compact equipment
Growing need in energy sector(e.g. oil and gas)
Higher salaries, rising prosperity, increase in productivity
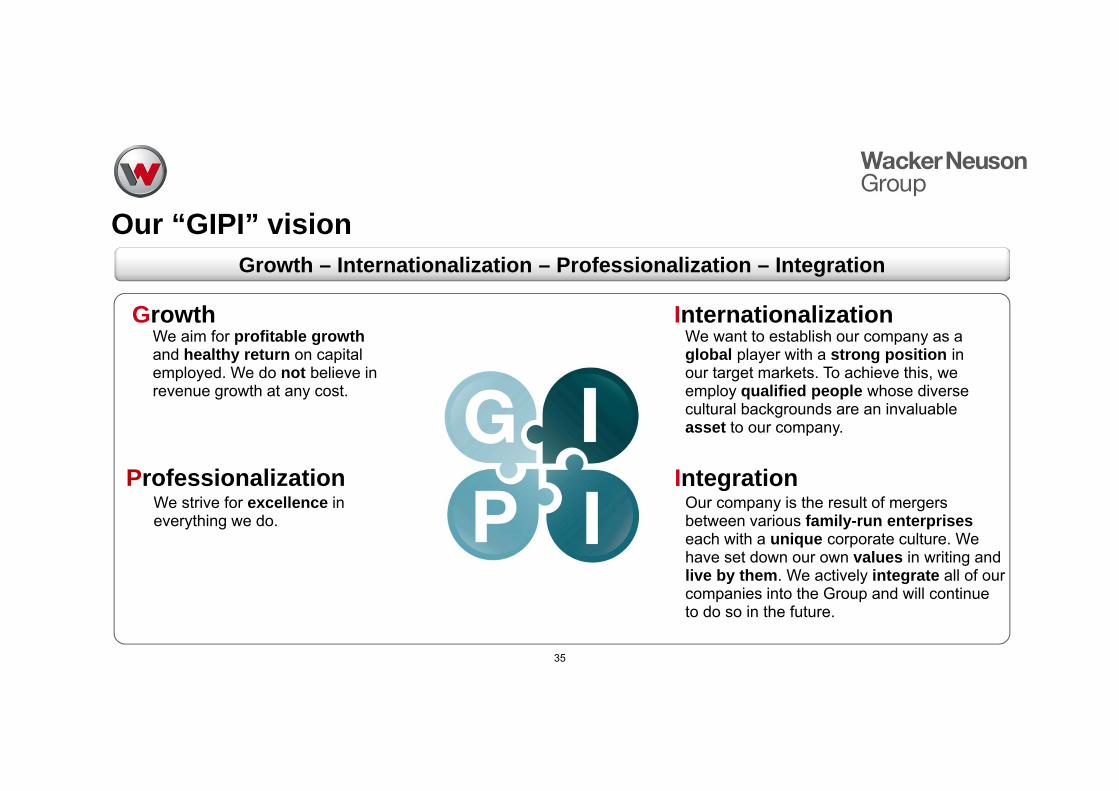
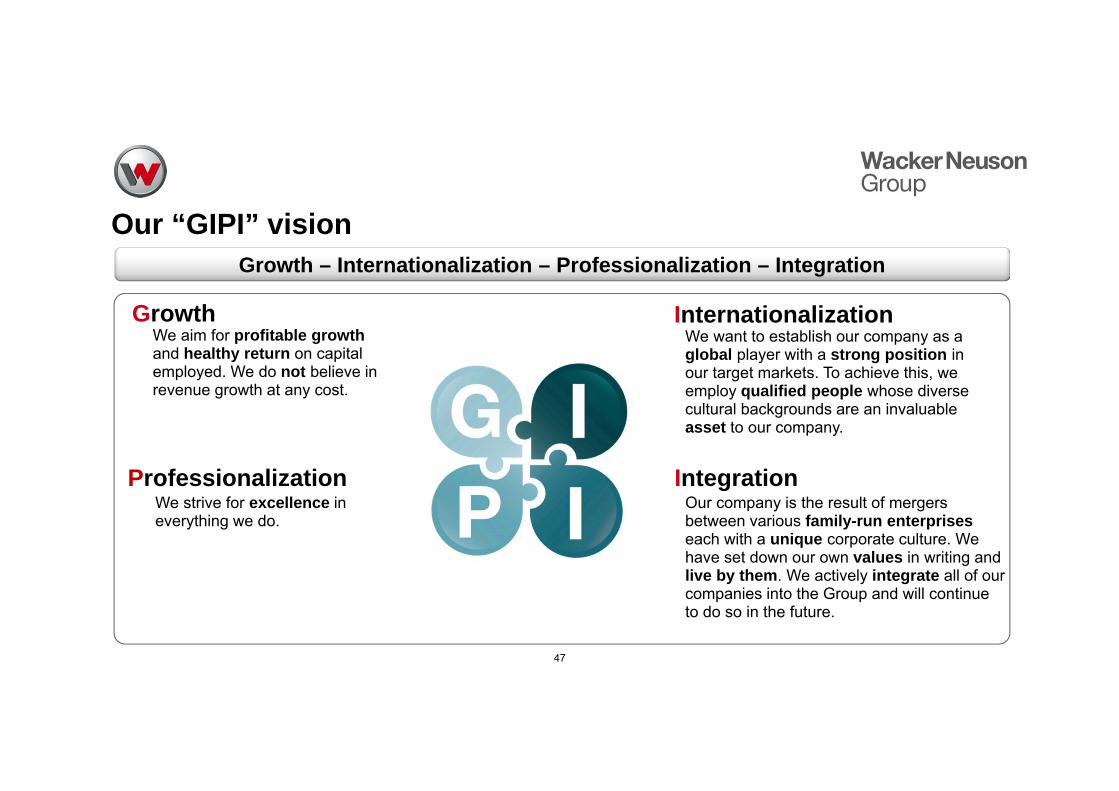
Our “GIPI” vision
35
Growth – Internationalization – Professionalization – Integration
Our company is the result of mergers between various family-run enterpriseseach with a unique corporate culture. We have set down our own values in writing and live by them. We actively integrate all of our companies into the Group and will continue to do so in the future.
Integration
We want to establish our company as a global player with a strong position in our target markets. To achieve this, we employ qualified people whose diverse cultural backgrounds are an invaluable asset to our company.
InternationalizationGrowthWe aim for profitable growthand healthy return on capital employed. We do not believe in revenue growth at any cost.
ProfessionalizationWe strive for excellence in everything we do.
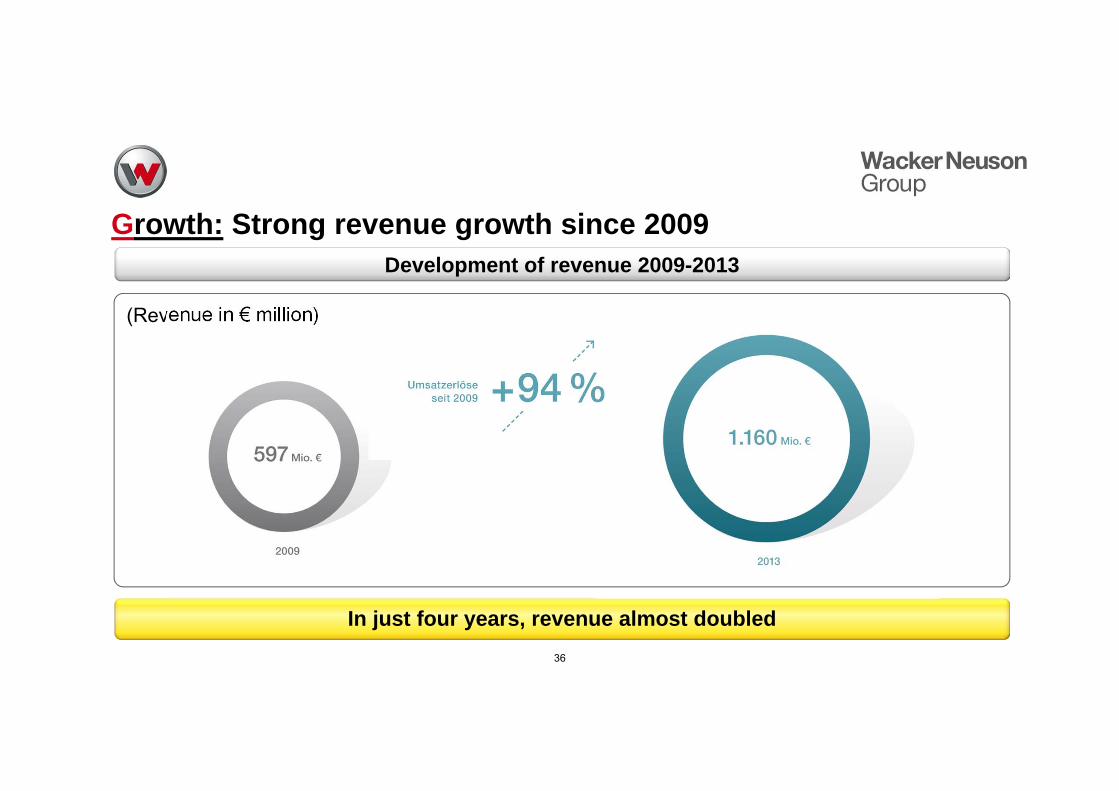
Growth: Strong revenue growth since 2009
36
(Revenue in € million)
Development of revenue 2009-2013
In just four years, revenue almost doubled
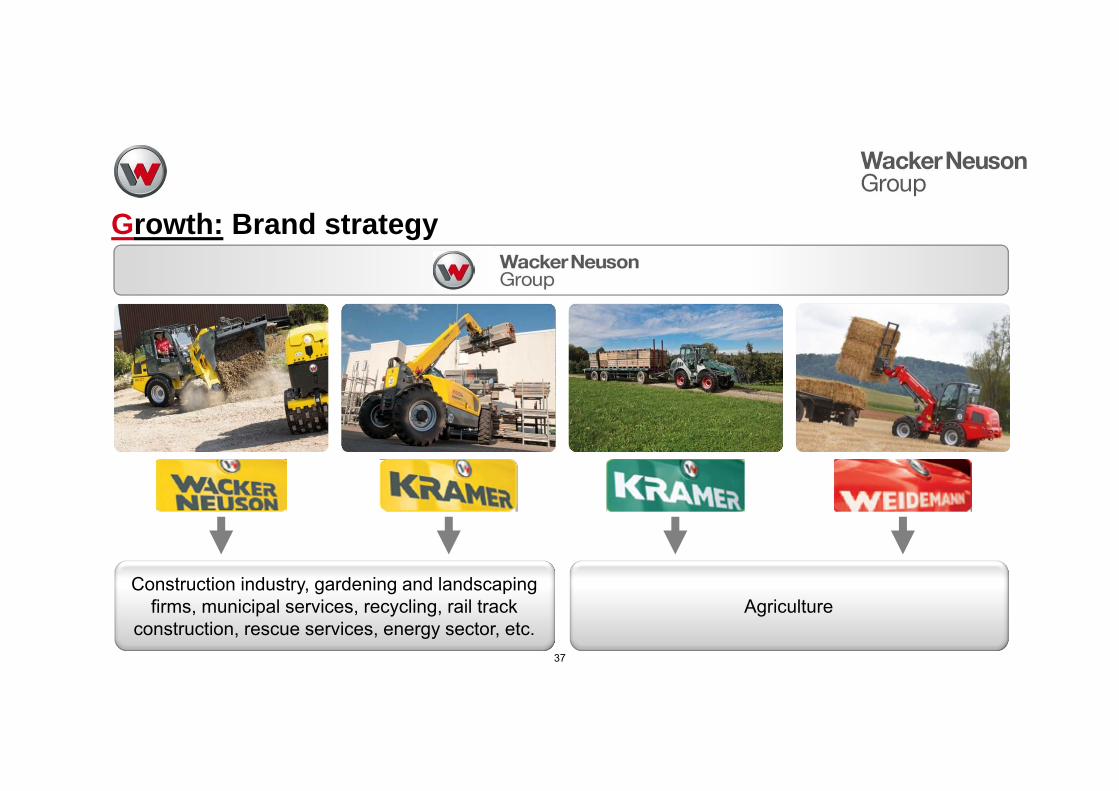
Construction industry, gardening and landscaping firms, municipal services, recycling, rail track
construction, rescue services, energy sector, etc.Agriculture
Growth: Brand strategy
37
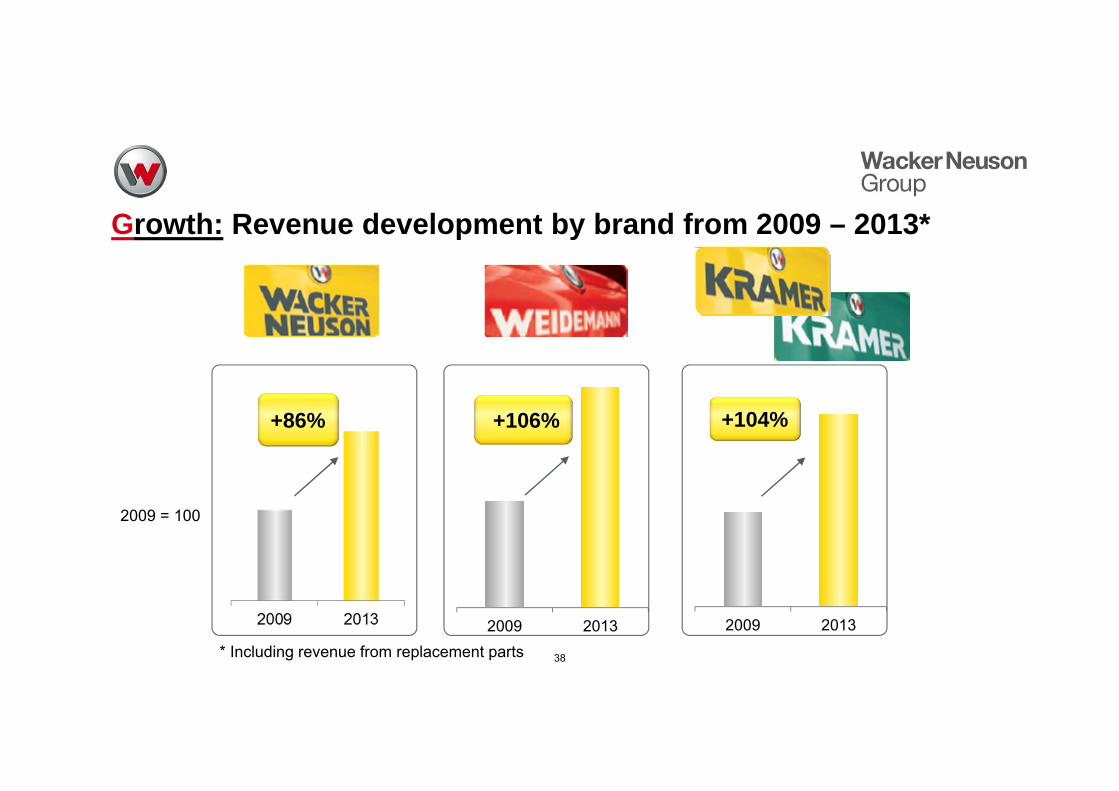
Growth: Revenue development by brand from 2009 – 2013*
38
+86%
2009 2013
+106%
2009 2013
+104%
* Including revenue from replacement parts
2009 = 100
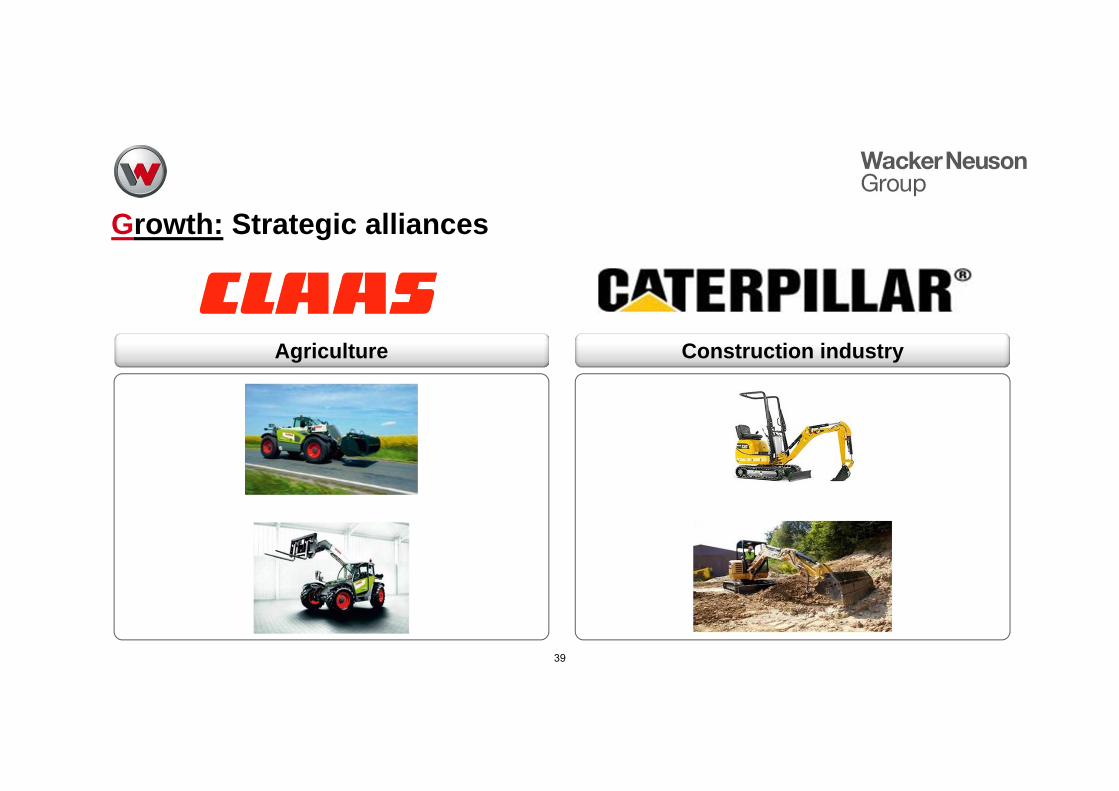
Growth: Strategic alliances
39
Agriculture Construction industry
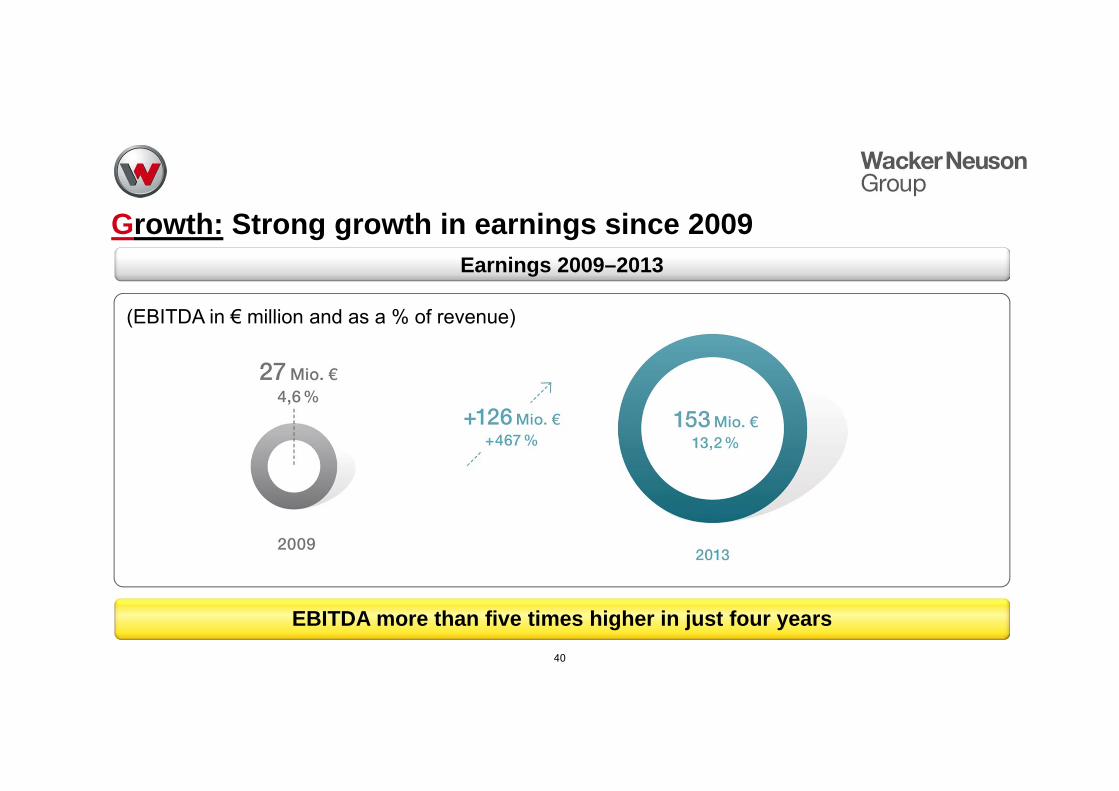
Growth: Strong growth in earnings since 2009
40
Earnings 2009–2013
EBITDA more than five times higher in just four years
(EBITDA in € million and as a % of revenue)
41
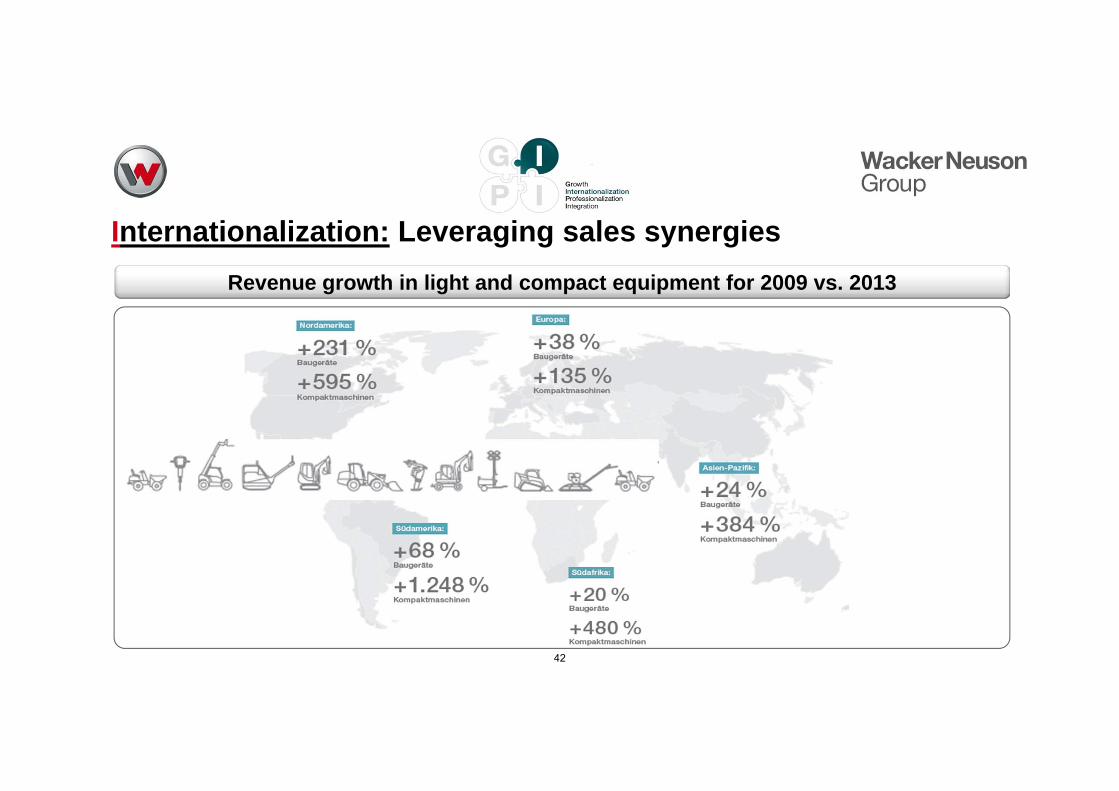
Internationalization: Leveraging sales synergies
42
Revenue growth in light and compact equipment for 2009 vs. 2013
43
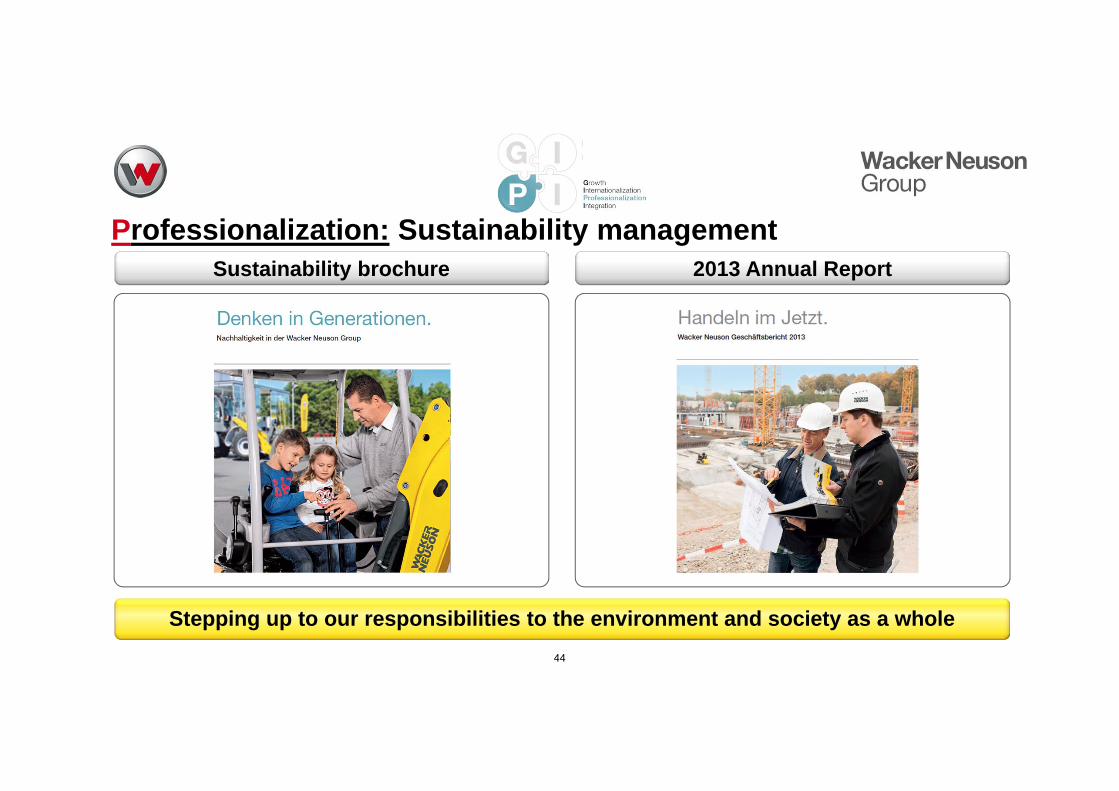
Sustainability brochureProfessionalization: Sustainability management
44
Stepping up to our responsibilities to the environment and society as a whole
2013 Annual Report
45
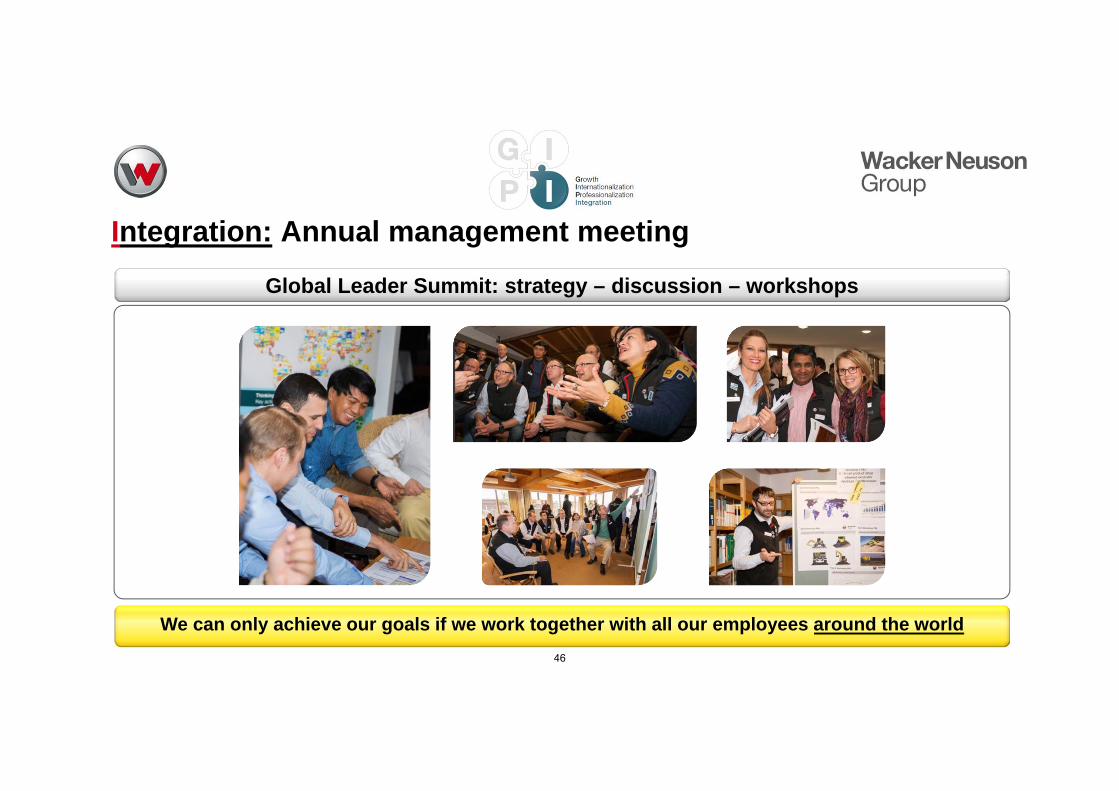
Integration: Annual management meeting
46
Global Leader Summit: strategy – discussion – workshops
We can only achieve our goals if we work together with all our employees around the world
We want to establish our company as a global player with a strong position in our target markets. To achieve this, we employ qualified people whose diverse cultural backgrounds are an invaluable asset to our company.
InternationalizationGrowthWe aim for profitable growthand healthy return on capital employed. We do not believe in revenue growth at any cost.
Our company is the result of mergers between various family-run enterpriseseach with a unique corporate culture. We have set down our own values in writing and live by them. We actively integrate all of our companies into the Group and will continue to do so in the future.
IntegrationProfessionalizationWe strive for excellence in everything we do.
Our “GIPI” vision
47
Growth – Internationalization – Professionalization – Integration
Contents
48
Fiscal 2013
AGM
Markets - Vision -Strategy
Financial indicators and share news
Q1 2014 Technology and innovation
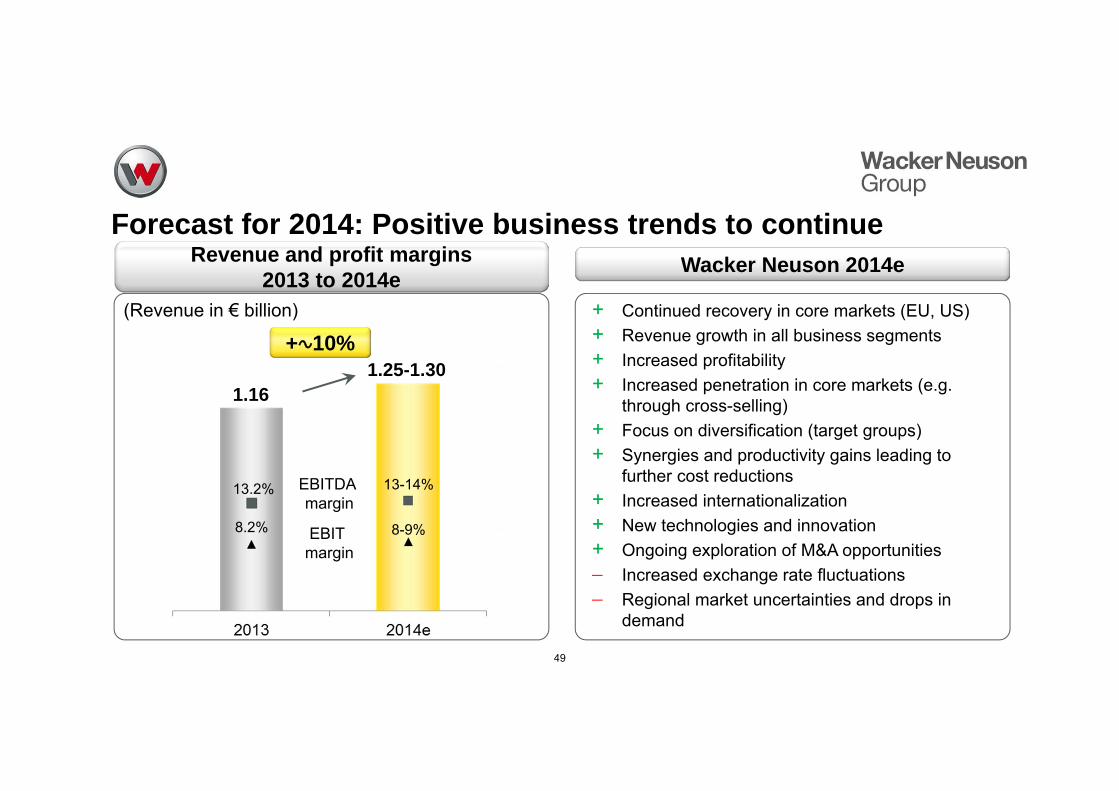
Forecast for 2014: Positive business trends to continue
(Revenue in € billion)
1.16
13-14%13.2%
+∿10%1.25-1.30
8-9%8.2%
49
Revenue and profit margins 2013 to 2014e
Wacker Neuson 2014e
EBITDA margin
EBIT margin
+ Continued recovery in core markets (EU, US)+ Revenue growth in all business segments+ Increased profitability+ Increased penetration in core markets (e.g.
through cross-selling)+ Focus on diversification (target groups)+ Synergies and productivity gains leading to
further cost reductions+ Increased internationalization+ New technologies and innovation+ Ongoing exploration of M&A opportunities Increased exchange rate fluctuations Regional market uncertainties and drops in
demand
25
36
9.7%
12.4%
789101112131415
05
10152025303540
Q1/13 Q1/14
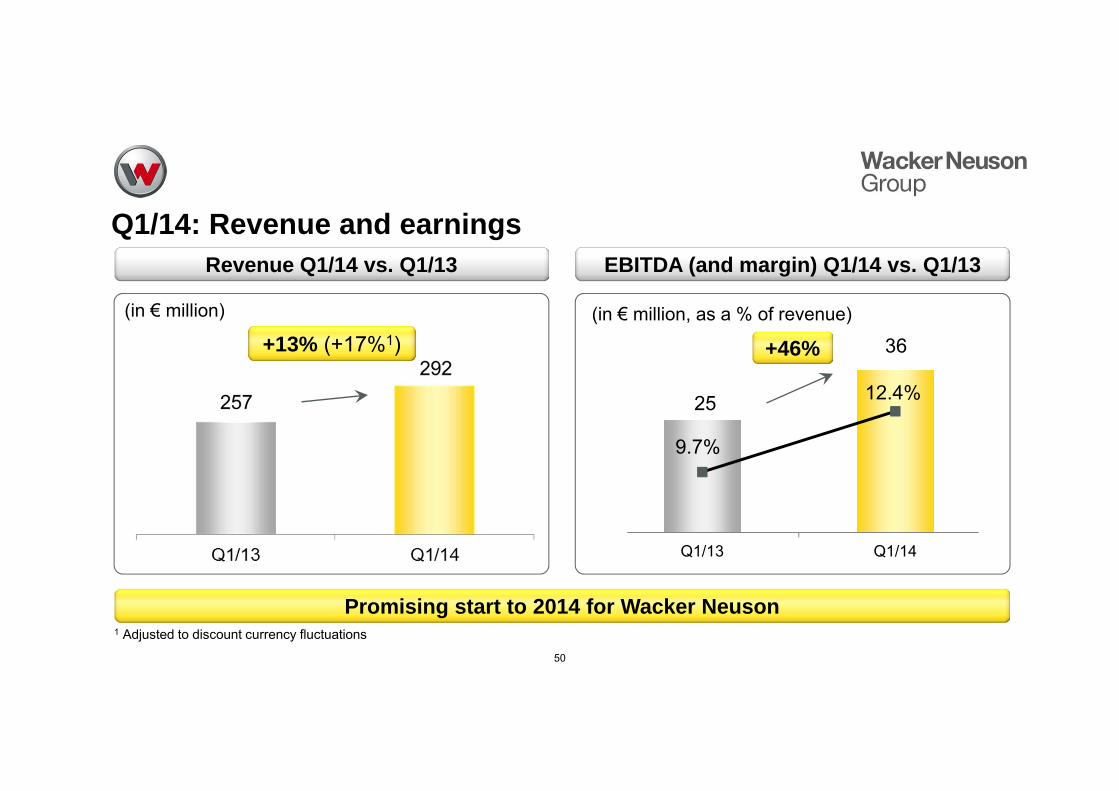
Q1/14: Revenue and earnings
50
(in € million) (in € million, as a % of revenue)
+13% (+17%1) +46%
Revenue Q1/14 vs. Q1/13 EBITDA (and margin) Q1/14 vs. Q1/13
1 Adjusted to discount currency fluctuations
Promising start to 2014 for Wacker Neuson
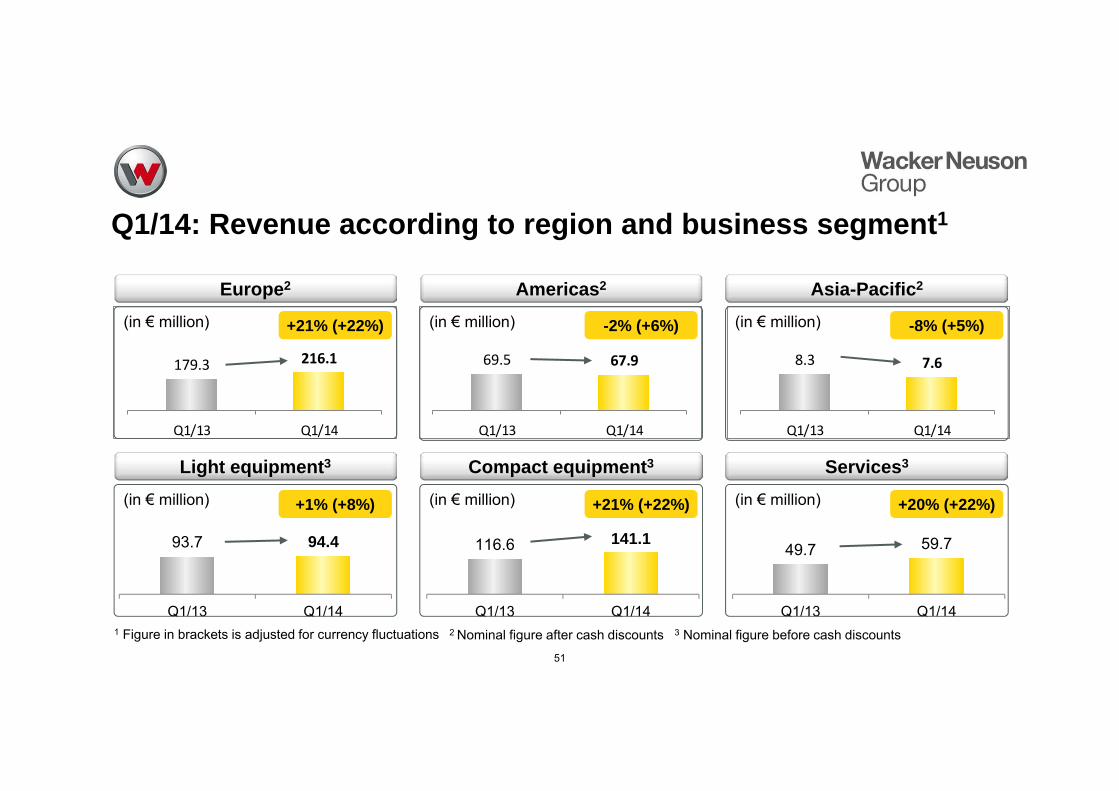
179.3 216.1
Q1/13 Q1/14
69.5 67.9
Q1/13 Q1/14
8.3 7.6
Q1/13 Q1/14
93.7 94.4
Q1/13 Q1/14
116.6 141.1
Q1/13 Q1/14
49.7 59.7
Q1/13 Q1/14
-8% (+5%)
Europe2
(in € million)
Americas2
(in € million)
Asia-Pacific2
(in € million)
Light equipment3 Compact equipment3
(in € million)
Services3
+21% (+22%) -2% (+6%)
(in € million)+1% (+8%) +21% (+22%) +20% (+22%)(in € million)
Q1/14: Revenue according to region and business segment1
51
1 Figure in brackets is adjusted for currency fluctuations 2 Nominal figure after cash discounts 3 Nominal figure before cash discounts
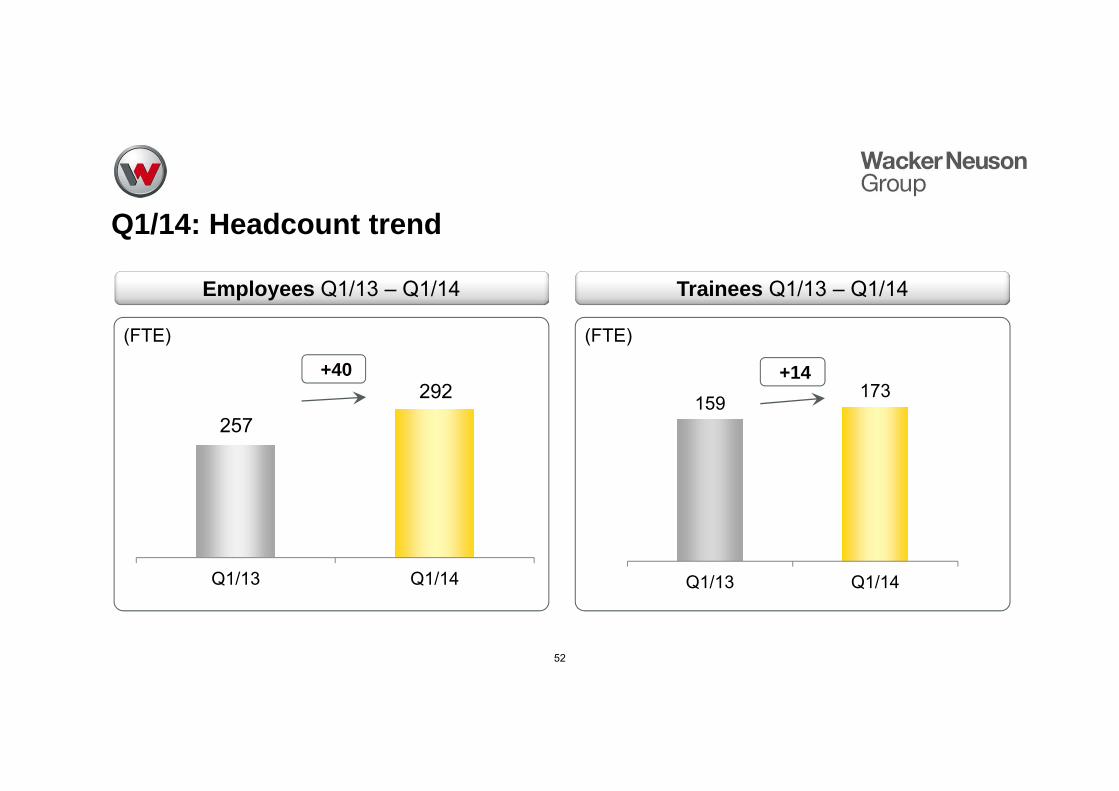
Q1/14: Headcount trend
52
(FTE)
+40
159173
Q1/13 Q1/14
(FTE)
+14
Employees Q1/13 – Q1/14 Trainees Q1/13 – Q1/14
257
292
Q1/13 Q1/14
Contents
53
Fiscal 2013
AGM
Markets - Vision -Strategy
Financial indicators and share news
Q1 2014 Technology and innovation
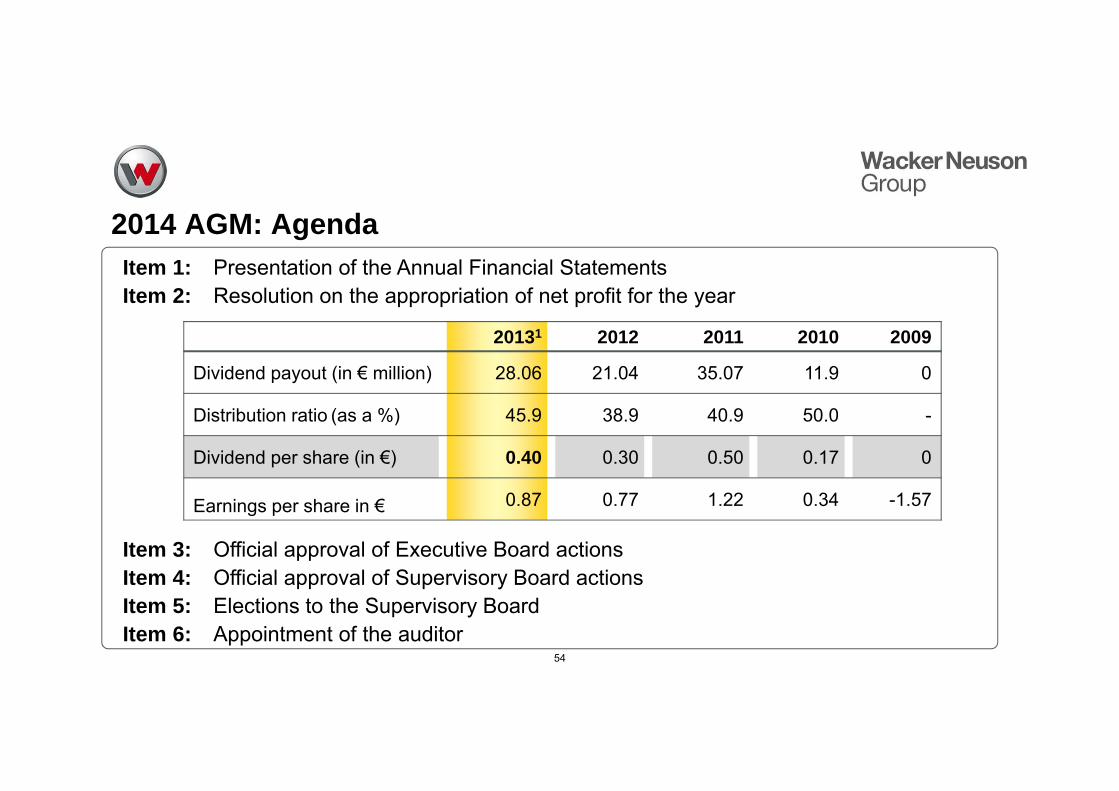
2014 AGM: AgendaItem 1: Presentation of the Annual Financial StatementsItem 2: Resolution on the appropriation of net profit for the year
Item 3: Official approval of Executive Board actionsItem 4: Official approval of Supervisory Board actionsItem 5: Elections to the Supervisory BoardItem 6: Appointment of the auditor
54
20131 2012 2011 2010 2009
Dividend payout (in € million) 28.06 21.04 35.07 11.9 0
Distribution ratio (as a %) 45.9 38.9 40.9 50.0 -
Dividend per share (in €) 0.40 0.30 0.50 0.17 0
Earnings per share in € 0.87 0.77 1.22 0.34 -1.57
AGM2014Wacker Neuson SEMunich, May 27, 2014
Executive Board Report
Cem Peksaglam (CEO)Martin Lehner (CTO)Günther Binder (CFO)
55


![Download [1.16 MB]](https://img.pdfslide.net/doc/110x75/586689df1a28ab20408b6d59/download-116-mb.jpg)