Embed Size (px)
Citation preview
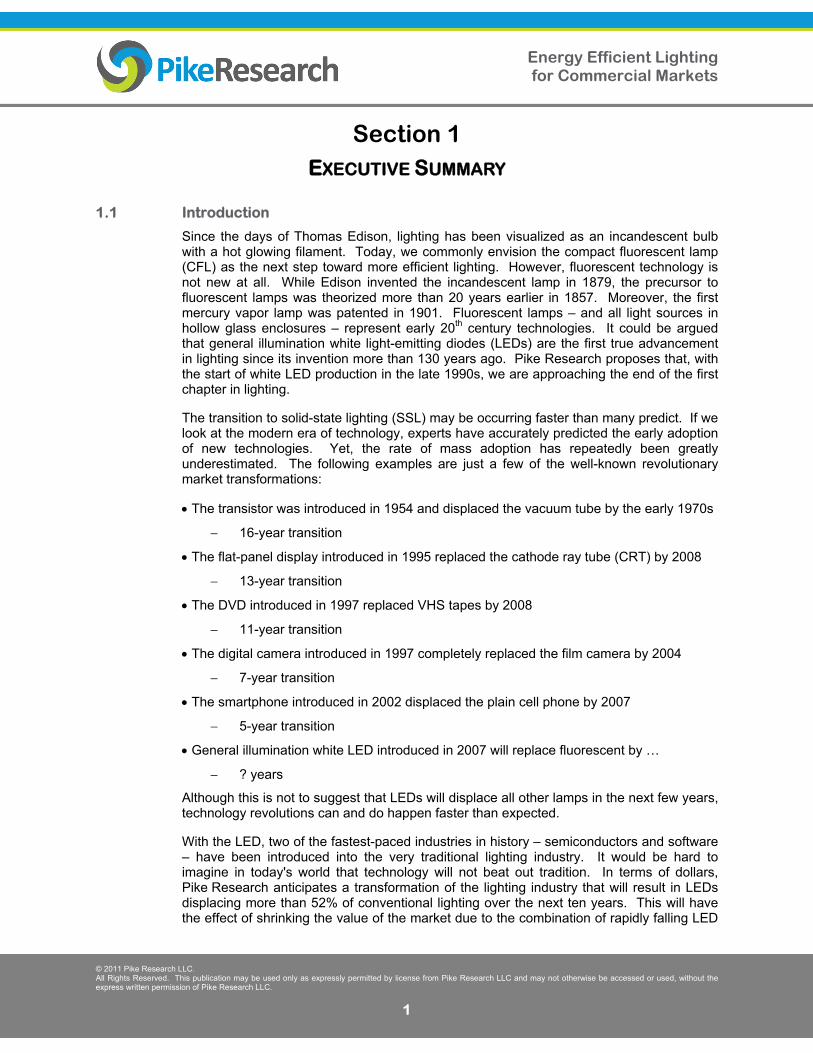
David EmmerichIndustry Analyst
Eric BloomResearch Analyst
EXECUTIVE SUMMARY: Energy Efficient Lighting for Commercial Markets Global Outlook for LED Solid State and Other High-Efficiency Lighting Technologies in Commercial Buildings: Market Analysis and Forecasts
NOTE: This document is a free excerpt of a larger report. If you are interested in purchasing the full report, please contact Pike Research at [email protected].
Published 4Q 2011
Energy Efficient Lighting for Commercial Markets
© 2011 Pike Research LLC. All Rights Reserved. This publication may be used only as expressly permitted by license from Pike Research LLC and may not otherwise be accessed or used, without the express written permission of Pike Research LLC.
1
Section 1 EXECUTIVE SUMMARY
1.1 Introduction
Since the days of Thomas Edison, lighting has been visualized as an incandescent bulb with a hot glowing filament. Today, we commonly envision the compact fluorescent lamp (CFL) as the next step toward more efficient lighting. However, fluorescent technology is not new at all. While Edison invented the incandescent lamp in 1879, the precursor to fluorescent lamps was theorized more than 20 years earlier in 1857. Moreover, the first mercury vapor lamp was patented in 1901. Fluorescent lamps – and all light sources in hollow glass enclosures – represent early 20th century technologies. It could be argued that general illumination white light-emitting diodes (LEDs) are the first true advancement in lighting since its invention more than 130 years ago. Pike Research proposes that, with the start of white LED production in the late 1990s, we are approaching the end of the first chapter in lighting.
The transition to solid-state lighting (SSL) may be occurring faster than many predict. If we look at the modern era of technology, experts have accurately predicted the early adoption of new technologies. Yet, the rate of mass adoption has repeatedly been greatly underestimated. The following examples are just a few of the well-known revolutionary market transformations:
The transistor was introduced in 1954 and displaced the vacuum tube by the early 1970s
16-year transition
The flat-panel display introduced in 1995 replaced the cathode ray tube (CRT) by 2008
13-year transition
The DVD introduced in 1997 replaced VHS tapes by 2008
11-year transition
The digital camera introduced in 1997 completely replaced the film camera by 2004
7-year transition
The smartphone introduced in 2002 displaced the plain cell phone by 2007
5-year transition
General illumination white LED introduced in 2007 will replace fluorescent by …
? years
Although this is not to suggest that LEDs will displace all other lamps in the next few years, technology revolutions can and do happen faster than expected.
With the LED, two of the fastest-paced industries in history – semiconductors and software – have been introduced into the very traditional lighting industry. It would be hard to imagine in today's world that technology will not beat out tradition. In terms of dollars, Pike Research anticipates a transformation of the lighting industry that will result in LEDs displacing more than 52% of conventional lighting over the next ten years. This will have the effect of shrinking the value of the market due to the combination of rapidly falling LED
Energy Efficient Lighting for Commercial Markets
© 2011 Pike Research LLC. All Rights Reserved. This publication may be used only as expressly permitted by license from Pike Research LLC and may not otherwise be accessed or used, without the express written permission of Pike Research LLC.
2
prices and the accompanying extended lamp lifetimes. Lamp and luminaire manufactures and others in the value chain will grow to rely on lighting controls and services to offset the revenue and profit lost in this process.
1.2 Market Influences
According to the U.S. Energy Information Administration (EIA), global commercial lighting consumes approximately 1,500 TWh of electricity. Add industrial and outdoor stationary lighting, and that number grows to almost 3,500 TWh. To put that in perspective, 3,500 TWh represents more than the total electrical consumption of Africa, the Middle East, South and Central America, and all of Eastern Europe combined. An opportunity to conserve even a small portion of that will have enormous benefits.
Improving lighting efficiency is an investment in the future. Like any investment, the upfront cost and the predictability of future benefits are the primary drivers in the decision process. Today, cost is a barrier to the adoption of more efficient lighting – especially for LED lighting.
Policy makers are playing a significant role in the cost of efficiency, both positively and negatively. Public funds are being used for rebates and subsidies to reduce the initial cost of installation. In many countries, the price of electricity is manipulated to either discourage consumption or encourage the adoption of new technology. Recently, supply policies in Asia have had a significant effect on the availability of fluorescent ballast components. As of this writing, China has restricted the export of rare earth elements, which has caused the price of phosphor to rise tenfold – it now comprises 50% of the total cost of a fluorescent lamp.
Uncertain economic and political situations have not slowed the private sector from investing heavily in the R&D of LED lighting. Pike Research projects that between 85% and 95% of development resources in the lighting industry are now focused on SSL products. LED technology is benefiting from this focus and costs are dropping quickly. In fact, costs are expected to drop at least 90% over Pike Research’s 10-year forecast period.
Demand for efficient lighting is being driven primarily by the adoption of strict energy codes. Reduced watts per square foot requirements are effectively banning less efficient incandescent and high-intensity discharge (HID) lamps. The green movement, despite flat electric rates, is strong. Energy certifications such as Leadership in Energy and Environmental Design (LEED) and BRE Environmental Assessment Method (BREEAM) are pulling better technology into the marketplace. Public projects at the local, state, and federal levels are also generating demand for cutting-edge products.
However, more efficient and expensive lighting is not popular in every application. The highest volume segments (e.g., general office lighting) also typically include commodity lighting, where 2% to 3% profit margins are considered generous. These same areas have already been provided with relatively high-efficiency fluorescent products for the last ten years, so there is little incentive to spend more. Until LED prices come down to parity with commodity lighting, the smaller niche markets will be most attractive. Such markets include retail display, signage, low temperature applications, high-end specification, and theatrical markets, to name a few.
Internationally, the trend toward efficiency is highly correlated to economic and infrastructure conditions. Europe and Asia are conservation-minded and open to government programs to limit consumption. The United States is highly segmented due to
Energy Efficient Lighting for Commercial Markets
© 2011 Pike Research LLC. All Rights Reserved. This publication may be used only as expressly permitted by license from Pike Research LLC and may not otherwise be accessed or used, without the express written permission of Pike Research LLC.
3
state-driven codes and regional electric rate variations, and is comparatively new to the concept of conservation. Much, but not all of Africa, the Middle East, Latin America, and parts of Asia are working toward developing adequate infrastructure and are lagging behind in commercial lighting efficiency.
1.3 Technology Issues
Efficacy, measured in lumens per watt (lm/W), and lamp life are the two most influential factors in determining the operating cost of lighting. But many other technical measures contribute to the overall quality of light, which cannot be sacrificed purely for cost savings. The ability of the lamp to render color accurately (color rendering index, or CRI) is important in most commercial applications involving retail and displays. The color temperature and spectrum given off by the lamp influences the occupant's mood and productivity, as well as the eye's perception of the light level. A dim but high quality light can yield a higher perceived illumination than a bright, low quality light.
Compact fluorescents have efficiency advantages over incandescent, but have suffered in their early sales due to poor color and lifetime, as well as high costs. More recently, focus on the mercury content and disposal requirement has further diminished their appeal. Nevertheless, CFLs have overcome many technical issues and will be popular in the commercial market while LED development continues.
LEDs are advancing rapidly in the area of heat dissipation and lumen output. The early issues with color have been overcome. More attention is on the design of the LED and luminaire into a single system rather than independent components. This will open the door to more creative and efficient use of the LED form factor.
Ambient temperature is an important consideration for many fluorescent and LED applications. Fluorescent performance suffers at low temperature where LEDs thrive. Meanwhile, LEDs have color and lamp life issues at higher temperatures. Other factors that are explored in this report are the advantages of low-voltage DC current, the influence of AC voltage and inrush current, and finally the importance of lighting controls.
Energy Efficient Lighting for Commercial Markets
© 2011 Pike Research LLC. All Rights Reserved. This publication may be used only as expressly permitted by license from Pike Research LLC and may not otherwise be accessed or used, without the express written permission of Pike Research LLC.
4
1.4 Market Forecast
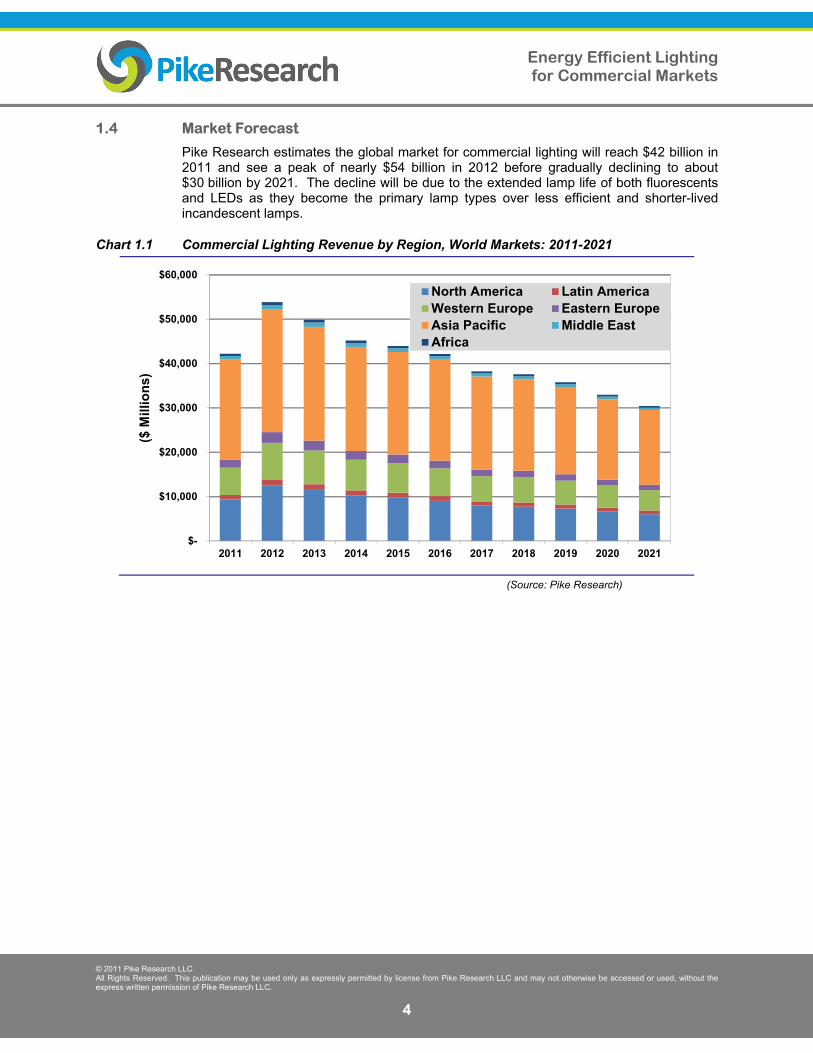
Pike Research estimates the global market for commercial lighting will reach $42 billion in 2011 and see a peak of nearly $54 billion in 2012 before gradually declining to about $30 billion by 2021. The decline will be due to the extended lamp life of both fluorescents and LEDs as they become the primary lamp types over less efficient and shorter-lived incandescent lamps.
Chart 1.1 Commercial Lighting Revenue by Region, World Markets: 2011-2021
(Source: Pike Research)
$-
$10,000
$20,000
$30,000
$40,000
$50,000
$60,000
2011 2012 2013 2014 2015 2016 2017 2018 2019 2020 2021
($ M
illio
ns)
North America Latin AmericaWestern Europe Eastern EuropeAsia Pacific Middle EastAfrica
Energy Efficient Lighting for Commercial Markets
© 2011 Pike Research LLC. All Rights Reserved. This publication may be used only as expressly permitted by license from Pike Research LLC and may not otherwise be accessed or used, without the express written permission of Pike Research LLC.
5
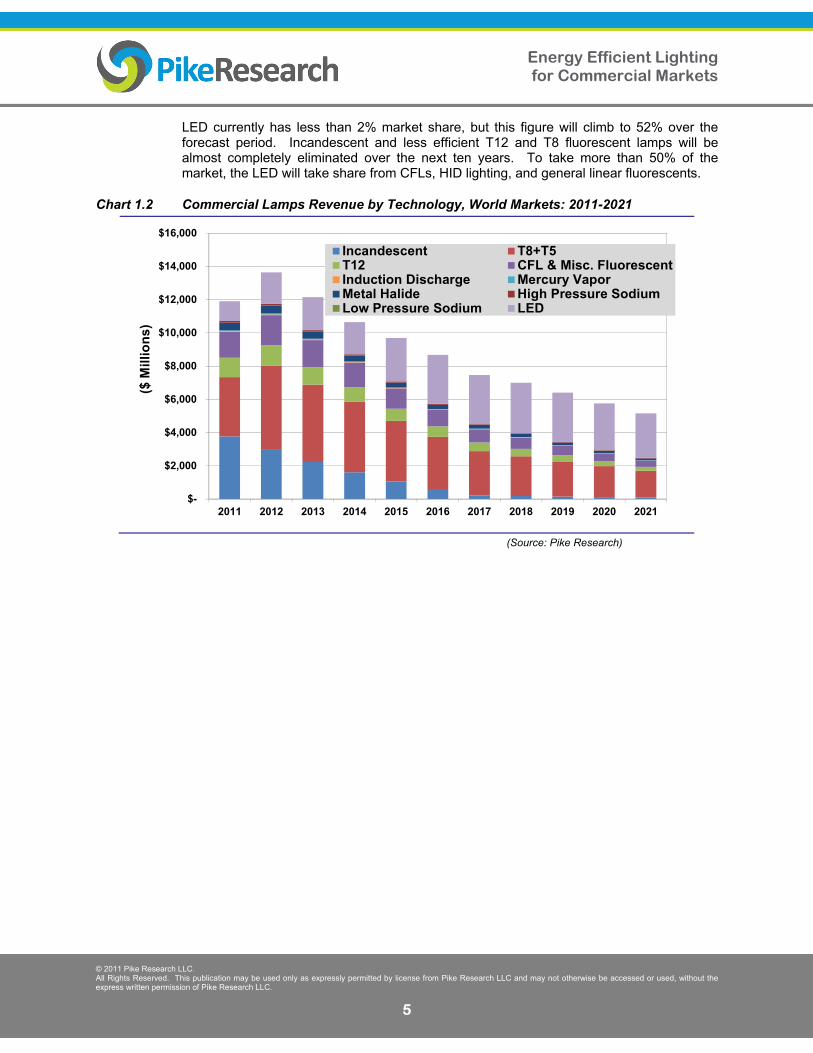
LED currently has less than 2% market share, but this figure will climb to 52% over the forecast period. Incandescent and less efficient T12 and T8 fluorescent lamps will be almost completely eliminated over the next ten years. To take more than 50% of the market, the LED will take share from CFLs, HID lighting, and general linear fluorescents.
Chart 1.2 Commercial Lamps Revenue by Technology, World Markets: 2011-2021
(Source: Pike Research)
$-
$2,000
$4,000
$6,000
$8,000
$10,000
$12,000
$14,000
$16,000
2011 2012 2013 2014 2015 2016 2017 2018 2019 2020 2021
($ M
illio
ns)
Incandescent T8+T5T12 CFL & Misc. FluorescentInduction Discharge Mercury VaporMetal Halide High Pressure SodiumLow Pressure Sodium LED
Energy Efficient Lighting for Commercial Markets
© 2011 Pike Research LLC. All Rights Reserved. This publication may be used only as expressly permitted by license from Pike Research LLC and may not otherwise be accessed or used, without the express written permission of Pike Research LLC.
83
Section 8 TABLE OF CONTENTS
Section 1 ...................................................................................................................................................... 1 Executive Summary .................................................................................................................................... 1
1.1 Introduction .................................................................................................................................... 1 1.2 Market Influences .......................................................................................................................... 2 1.3 Technology Issues ........................................................................................................................ 3 1.4 Market Forecast ............................................................................................................................ 4
Section 2 ...................................................................................................................................................... 6 Market Issues .............................................................................................................................................. 6
2.1 Market Drivers ............................................................................................................................... 6 2.1.1 Codes and Regulations ........................................................................................................... 6 2.1.2 Incandescent Phase Out ......................................................................................................... 9 2.1.3 Rebates and Incentives ......................................................................................................... 10 2.1.4 Global Sustainability and Green Certifications ...................................................................... 11 2.1.5 Public/Cultural Opinion .......................................................................................................... 12
2.2 Defining and Measuring Economic Efficiency ............................................................................. 12 2.2.1 Cost Drivers ........................................................................................................................... 12
2.2.1.1 Policy Influences ........................................................................................................... 12 2.2.1.2 Supply Influences ......................................................................................................... 14 2.2.1.3 LED Cost Reductions ................................................................................................... 14 2.2.1.4 LED Price Reductions ................................................................................................... 15
2.2.2 Operating Costs..................................................................................................................... 16 2.2.3 Electric Rates ........................................................................................................................ 17 2.2.4 Total Lifecycle Cost ............................................................................................................... 20
2.3 Who Benefits from, and Who Pays for, Efficiency ...................................................................... 20 2.4 Market Definitions and Segmentation ......................................................................................... 21
2.4.1 Vertical Components ............................................................................................................. 21 2.4.2 Horizontal Components ......................................................................................................... 22
2.4.2.1 New Construction ......................................................................................................... 22 2.4.2.2 Retrofit .......................................................................................................................... 22
2.5 Considerations by Application ..................................................................................................... 23 2.5.1 Indoor .................................................................................................................................... 23
2.5.1.1 General Illumination for Offices, Schools, and Institutional Facilities ........................... 23 2.5.1.2 Industrial ....................................................................................................................... 24 2.5.1.3 Warehouses .................................................................................................................. 24 2.5.1.4 Big Box Retail ............................................................................................................... 24 2.5.1.5 Theatrical and Architectural Illumination ....................................................................... 24 2.5.1.6 Retail Display/Jewelry ................................................................................................... 24 2.5.1.7 Plants and Produce ...................................................................................................... 24 2.5.1.8 Cold Storage/Freezers .................................................................................................. 25
2.5.2 Outdoor .................................................................................................................................. 25 2.5.2.1 Roadways and Parking Lot Poles and Structures ........................................................ 25 2.5.2.2 Auto Dealer Parking Lots .............................................................................................. 26 2.5.2.3 Sports/Event Lighting .................................................................................................... 26
2.6 Market Variations by International Region .................................................................................. 26 2.6.1 Asia Pacific ............................................................................................................................ 26 2.6.2 Europe ................................................................................................................................... 27 2.6.3 Middle East/Africa ................................................................................................................. 27
Energy Efficient Lighting for Commercial Markets
© 2011 Pike Research LLC. All Rights Reserved. This publication may be used only as expressly permitted by license from Pike Research LLC and may not otherwise be accessed or used, without the express written permission of Pike Research LLC.
84
2.6.4 Latin America ......................................................................................................................... 29 Section 3 .................................................................................................................................................... 30 Technology Issues .................................................................................................................................... 30
3.1 Technical Definitions and Measures of Efficiency ....................................................................... 30 3.1.1 Efficacy, Efficiency, and Coefficient of Utilization .................................................................. 30 3.1.2 Lamp Life ............................................................................................................................... 30 3.1.3 Color Rendering Index (CRI) and Pupil Lumens ................................................................... 32 3.1.4 Lumen Depreciation/Lumen Maintenance ............................................................................ 33 3.1.5 Ambient and Device Temperature Effects ............................................................................ 33
3.1.5.1 Fluorescent ................................................................................................................... 33 3.1.5.2 LED ............................................................................................................................... 34
3.2 State of Efficient Light Sources ................................................................................................... 35 3.2.1 Linear Fluorescent ................................................................................................................. 35 3.2.2 Compact Fluorescent Lamp .................................................................................................. 36 3.2.3 Induction ................................................................................................................................ 36 3.2.4 High-Intensity Discharge ....................................................................................................... 37
3.2.4.1 Pulse Start Metal Halide ............................................................................................... 37 3.2.4.2 Ceramic Metal Halide ................................................................................................... 37
3.2.5 Solid-State Lighting (LED and OLED) ................................................................................... 38 3.2.5.1 LED ............................................................................................................................... 38 3.2.5.2 OLED ............................................................................................................................ 38
3.3 Other Considerations in Efficiency .............................................................................................. 39 3.3.1 DC Power Distribution ........................................................................................................... 39 3.3.2 Voltage Effects (120/240/277/347/480 VAC) ........................................................................ 39 3.3.3 Current Inrush Effects ........................................................................................................... 40 3.3.4 Lighting Controls ................................................................................................................... 40
Section 4 .................................................................................................................................................... 41 Key Industry Players ................................................................................................................................. 41
4.1 Introduction .................................................................................................................................. 41 4.2 Major lighting brands and Global Lighting Giants ....................................................................... 41
4.2.1 GE Lighting ............................................................................................................................ 41 4.2.2 OSRAM ................................................................................................................................. 43 4.2.3 Philips Lighting ...................................................................................................................... 45
4.3 Controls ....................................................................................................................................... 46 4.3.1 Leviton ................................................................................................................................... 46 4.3.2 Lutron .................................................................................................................................... 47 4.3.3 LED Technology .................................................................................................................... 49 4.3.4 Bridgelux ................................................................................................................................ 49 4.3.5 Cree/Ruud ............................................................................................................................. 50 4.3.6 Nichia ..................................................................................................................................... 53
4.4 Other Large Companies .............................................................................................................. 54 4.4.1 Acuity Brands ........................................................................................................................ 54 4.4.2 Cooper Lighting ..................................................................................................................... 55 4.4.3 Hubbell Lighting ..................................................................................................................... 56 4.4.4 Juno Lighting ......................................................................................................................... 58 4.4.5 Zumtobel Group..................................................................................................................... 59
4.5 Major Lighting Brands ................................................................................................................. 61 4.5.1 Lightolier ................................................................................................................................ 61 4.5.2 Lithonia Lighting .................................................................................................................... 62
4.6 Research Organizations .............................................................................................................. 64 4.7 Industry Associations – Lighting and Energy Efficiency ............................................................. 65 4.8 Government – Regulators and Programs ................................................................................... 66
4.8.1 U.S. Department of Energy ................................................................................................... 66
Energy Efficient Lighting for Commercial Markets
© 2011 Pike Research LLC. All Rights Reserved. This publication may be used only as expressly permitted by license from Pike Research LLC and may not otherwise be accessed or used, without the express written permission of Pike Research LLC.
85
4.8.2 European Union..................................................................................................................... 66 4.8.3 Other Regions ....................................................................................................................... 67
4.9 Lighting Competitions .................................................................................................................. 67 4.10 Other Industry Information Sources ............................................................................................ 67
Section 5 .................................................................................................................................................... 68 Market Forecasts ....................................................................................................................................... 68
5.1 Introduction .................................................................................................................................. 68 5.2 Forecast Methodology ................................................................................................................. 69 5.3 Forecast Components ................................................................................................................. 69
5.3.1 Commercial Floor Space ....................................................................................................... 69 5.3.2 New Construction and Existing Space .................................................................................. 70 5.3.3 Retrofit of Existing Space ...................................................................................................... 70 5.3.4 Lighting Power Density (LPD) ............................................................................................... 71 5.3.5 Share of Lamp Type for New and Retrofit Projects............................................................... 71 5.3.6 Replacement Lamps ............................................................................................................. 72
Section 6 .................................................................................................................................................... 76 Company Directory ................................................................................................................................... 76 Section 7 .................................................................................................................................................... 78 Acronym and Abbreviation List ............................................................................................................... 78 Section 8 .................................................................................................................................................... 83 Table of Contents ...................................................................................................................................... 83 Section 9 .................................................................................................................................................... 86 Table of Charts and Figures..................................................................................................................... 86 Section 10 .................................................................................................................................................. 88 Scope of Study .......................................................................................................................................... 88
Data Collection ........................................................................................................................................ 89 Sources and Methodology ....................................................................................................................... 90 Notes .......................................................................................................................................................... 90
Energy Efficient Lighting for Commercial Markets
© 2011 Pike Research LLC. All Rights Reserved. This publication may be used only as expressly permitted by license from Pike Research LLC and may not otherwise be accessed or used, without the express written permission of Pike Research LLC.
86
Section 9 TABLE OF CHARTS AND FIGURES
Chart 1.1 Commercial Lighting Revenue by Region, World Markets: 2011-2021 .................................. 4 Chart 1.2 Commercial Lamps Revenue by Technology, World Markets: 2011-2021 ............................. 5 Chart 2.1 Phosphor Price Index: 2011 .................................................................................................. 13 Chart 2.2 Commercial Electricity Prices, United States: 1960-2011 ..................................................... 17 Chart 3.1 Typical Fluorescent Lumen Output by Temperature ............................................................. 34 Chart 3.2 Estimated Outdoor Pole-Mounted LED Life Expectancy versus Ambient Temperature ....... 35 Chart 5.1 Commercial Luminaire Unit Shipments by Technology, World Markets: 2011-2021 ............ 74 Chart 5.2 Commercial Luminare Revenue by Technology, World Markets: 2011-2021 ...................... 74 Chart 5.3 Commercial Lamp Unit Shipments by Technology, World Markets: 2011-2021 .................. 75 Chart 5.4 Commercial Lamp Revenue by Technology, World Markets: 2011-2021 ............................ 75
Figure 2.1 State Energy Code Status: 2011 ............................................................................................. 8 Figure 2.2 State Energy Code Status: 2007 ............................................................................................. 9 Figure 2.3 Commercial Electric Rates, United States: April 2011 .......................................................... 18
Table 2.1 Type of Use and Allowed Lighting Power for Currently Adopted Standards .......................... 7 Table 2.2 Commercial Floor Space Lit by Lamp Type ............................................................................ 9 Table 2.3 LED Substrate Roadmap, World Markets: 2010-2015 .......................................................... 14 Table 2.4 2010 Estimated LED Component Cost Reduction Projections: 2010-2020 .......................... 15 Table 2.5 2011 Estimated LED Component Cost Reduction Projections: 2010-2020 .......................... 15 Table 2.6 SSL Product Prices, United States: 2011-2021 .................................................................... 16 Table 2.7 50k Hour Operating Cost for 2x4 Commercial Troffer ........................................................... 17 Table 2.8 Commercial Electric Rates, United States: 2010-2021 ......................................................... 18 Table 2.9 Commercial Electricity Rates, World Markets: 2010 ............................................................. 19 Table 2.10 Commercial Building Age, United States: 2011 .................................................................... 23 Table 3.1 Typical Performance of Lighting Technologies ..................................................................... 30 Table 3.2 Average Lamp Life by Technology ........................................................................................ 31 Table 3.3 Pupil Lumens for Lamp Technologies ................................................................................... 32 Table 3.4 Pupil Lumen Adjusted LED: 2010-2015 ................................................................................ 33 Table 3.5 Typical Performance of Lighting Technologies ..................................................................... 35 Table 3.6 LED Metrics Roadmap, World Markets: 2010-2020 .............................................................. 38 Table 4.1 GE Lighting SWOT Analysis ................................................................................................. 42 Table 4.2 OSRAM SWOT Analysis ....................................................................................................... 44 Table 4.3 Philips Lighting SWOT Analysis ............................................................................................ 46 Table 4.4 Leviton SWOT Analysis ......................................................................................................... 47 Table 4.5 Lutron SWOT Analysis .......................................................................................................... 49 Table 4.6 Bridgelux SWOT Analysis ..................................................................................................... 50 Table 4.7 Cree/Ruud SWOT Analysis ................................................................................................... 52 Table 4.8 Nichia SWOT Analysis .......................................................................................................... 54 Table 4.9 Acuity Brands SWOT Analysis .............................................................................................. 55 Table 4.10 Cooper Lighting SWOT Analysis ........................................................................................... 56 Table 4.11 Hubbell Lighting SWOT Analysis .......................................................................................... 58 Table 4.12 Juno Lighting SWOT Analysis ............................................................................................... 59 Table 4.13 Zumtobel Group SWOT Analysis .......................................................................................... 61 Table 4.14 Lightolier SWOT Analysis ...................................................................................................... 62
Energy Efficient Lighting for Commercial Markets
© 2011 Pike Research LLC. All Rights Reserved. This publication may be used only as expressly permitted by license from Pike Research LLC and may not otherwise be accessed or used, without the express written permission of Pike Research LLC.
87
Table 4.15 Lithonia Lighting SWOT Analysis .......................................................................................... 63 Table 4.16 Summary of Research Organizations ................................................................................... 64 Table 4.17 Summary of Industry Associations ........................................................................................ 65 Table 4.18 Summary of U.S. DOE Regulators and Programs ................................................................ 66 Table 4.19 Summary of EU Regulators and Programs ........................................................................... 66 Table 4.20 Summary of Regulators in Other Regions ............................................................................ 67 Table 4.21 Lighting Competitions ............................................................................................................ 67 Table 4.22 Other Industry Information Sources ...................................................................................... 67 Table 5.1 Commercial Building Floor Space, World Markets: 2011 and 2021 ..................................... 70 Table 5.2 Projected Retrofit Rates: 2011-2021 ..................................................................................... 70 Table 5.3 Lighting Power Density for New Commercial Installations (New Construction and Retrofits) .......................................................................................... 71 Table 5.4 Commercial Share of Lighting Type for New Construction: 2011-2021 ................................ 71 Table 5.5 Typical Lighting Power Density for Commercial Segments, World Markets: 2011 ............... 72 Table 5.6 Lamp Replacements per Year on Installed Base, World Markets: 2006 .............................. 73
Energy Efficient Lighting for Commercial Markets
© 2011 Pike Research LLC. All Rights Reserved. This publication may be used only as expressly permitted by license from Pike Research LLC and may not otherwise be accessed or used, without the express written permission of Pike Research LLC.
88
Section 10 SCOPE OF STUDY
This report focuses on the global commercial market for energy-efficient lighting. Analyses of the market dynamics, industry structure, and technological features driving LED, fluorescent, high-intensity discharge (HID), and incandescent lamp types are presented. Pike Research focuses on the growth of LED and the decline of incandescent lighting. While we do not provide quantitative analyses of lighting controls, drivers/ballasts, or luminaire design, these topics are discussed with respect to how they are influencing the adoption of more efficient lighting.
More specifically, the following seven regions are covered in this report:
North America
Latin America
Western Europe
Eastern Europe
Asia Pacific
Middle East
Africa
Primary attention is given to the commercial sector. Although most applications represent a mix of the following spaces, this report segments commercial space as follows:
Commercial office space
Retail
Education
Healthcare
Hotels and restaurants
Institutional and assembly space
Warehouses
Transportation facilities
Where appropriate, Pike Research also discusses various industrial, outdoor stationary, and municipal/ government applications.
The report presents forecasts for each global region from 2011 through 2021 for the two largest segments of the lighting market – lamps and luminaires (fixtures). Pike Research presents market-sizing forecasts in both U.S. dollars and units for eight major building types and sectors.
For each global region, forecasts are provided for the following technology classes:
Incandescent lamps and luminaires
T8 and T5 fluorescent lamps and luminaires
Energy Efficient Lighting for Commercial Markets
© 2011 Pike Research LLC. All Rights Reserved. This publication may be used only as expressly permitted by license from Pike Research LLC and may not otherwise be accessed or used, without the express written permission of Pike Research LLC.
89
T12 lamps and luminaires
Compact fluorescent and miscellaneous fluorescent lamps and luminaires
Induction discharge lamps and luminaires
Mercury vapor lamps and luminaires
Metal halide lamps and luminaires
High pressure sodium lamps and luminaires
Low pressure sodium lamps and luminaires
General Illumination LED sources and luminaires
LED exit signs
Finally, Pike Research analyzes a cross-section of the key players in this market and presents a profile and SWOT analysis of each.
Data Collection
The forecasts provided in this study represent Pike Research’s best estimates and projections for 2011 to 2021. Values for 2011 are either extrapolated from prior-year data or prorated based on the first six to nine months of 2011 data (when available).
Forecasts are based on primary and secondary information obtained up to September 9, 2011. Primary research is based on interviews conducted in each global region. Pike Research interviewed 20 experts in the industry (generally at the director and vice president level or above), including manufacturers, engineers, lighting specifiers, consultants, and representatives from non-profits and associations. Also included is analysis gleaned from the author's direct industry experience. Secondary research information was collected from a wide range of international sources, including the U.S. Department of Energy (DOE), the International Energy Agency (IEA), LEDs Magazine, the U.S. Green Building Council (USGBC) and its European and Australian counterparts (BREEAM and Green Star), a variety of industry associations, and numerous press releases from vendors and end users.
Energy Efficient Lighting for Commercial Markets
© 2011 Pike Research LLC. All Rights Reserved. This publication may be used only as expressly permitted by license from Pike Research LLC and may not otherwise be accessed or used, without the express written permission of Pike Research LLC.
90
SOURCES AND METHODOLOGY
Pike Research’s industry analysts utilize a variety of research sources in preparing Research Reports. The key component of Pike Research’s analysis is primary research gained from phone and in-person interviews with industry leaders including executives, engineers, and marketing professionals. Analysts are diligent in ensuring that they speak with representatives from every part of the value chain, including but not limited to technology companies, utilities and other service providers, industry associations, government agencies, and the investment community.
Additional analysis includes secondary research conducted by Pike Research’s analysts and the firm’s staff of research assistants. Where applicable, all secondary research sources are appropriately cited within this report.
These primary and secondary research sources, combined with the analyst’s industry expertise, are synthesized into the qualitative and quantitative analysis presented in Pike Research’s reports. Great care is taken in making sure that all analysis is well-supported by facts, but where the facts are unknown and assumptions must be made, analysts document their assumptions and are prepared to explain their methodology, both within the body of a report and in direct conversations with clients.
Pike Research is an independent market research firm whose goal is to present an objective, unbiased view of market opportunities within its coverage areas. The firm is not beholden to any special interests and is thus able to offer clear, actionable advice to help clients succeed in the industry, unfettered by technology hype, political agendas, or emotional factors that are inherent in cleantech markets.
NOTES
CAGR refers to compound average annual growth rate, using the formula:
CAGR = (End Year Value ÷ Start Year Value)(1/steps) – 1.
CAGRs presented in the tables are for the entire timeframe in the title. Where data for fewer years are given, the CAGR is for the range presented. Where relevant, CAGRs for shorter timeframes may be given as well.
Figures are based on the best estimates available at the time of calculation. Annual revenues, shipments, and sales are based on end-of-year figures unless otherwise noted. All values are expressed in year 2011 U.S. dollars unless otherwise noted. Percentages may not add up to 100 due to rounding.
Energy Efficient Lighting for Commercial Markets
© 2011 Pike Research LLC. All Rights Reserved. This publication may be used only as expressly permitted by license from Pike Research LLC and may not otherwise be accessed or used, without the express written permission of Pike Research LLC.
91
Published 4Q 2011
© 2011 Pike Research LLC 1320 Pearl Street, Suite 300
Boulder, CO 80302 USA Tel: +1 303.997.7609
http://www.pikeresearch.com
This publication is provided by Pike Research LLC (“Pike”). This publication may be used only as expressly permitted by license from Pike and may not otherwise be reproduced, recorded, photocopied, distributed, displayed, modified, extracted, accessed or used without the express written permission of Pike. Notwithstanding the foregoing, Pike makes no claim to any Government data and other data obtained from public sources found in this publication (whether or not the owners of such data are noted in this publication). If you do not have a license from Pike covering this publication, please refrain from accessing or using this publication. Please contact Pike to obtain a license to this publication.