Embed Size (px)
Citation preview
Experiment and Statistical Analysis of End Milling Parameters for Al/SiC Using
Response Surface Methodology Vamsi Krishna M#1, Anthony Xavior M *2
#Assistant Professor, Department of Mechanical Engineering, MITS, Madanapalle-517325, Andhra Pradesh, INDIA.
1 [email protected] *Professor, School of Mechanical and Building Sciences, VIT University,
Vellore-632014, Tamil Nadu, INDIA. [email protected]
Abstract—For industrial applications, the ceramics composites are machined in large scale using end milling. Due the abrasive reinforcement particle, the failure in tool life and surface quality are possible. This research work focuses on developing the mathematical models of cutting force (FR), Metal Removal Rate (MRR) and surface roughness (Ra) and to optimize it. The Response Surface Methodology (RSM) with L31 empirical model was used for conducting the basic trails on Al/SiC composites of various compositions. The XRD, EDS, Optical microscopic images of Al/SiC composites were analysed and the SEM morphology of the machined samples were studied. The models developed for predicting responses were tested by analysis of variance (ANOVA) to evaluate its adequacy. The optimal machining configuration was identified which yields 0.5%, 14% and 4% of MRR, Ra and FR respectively compared with experimental results.
Keyword - Carbide, Aluminium, Milling, Composites, Cutting, Machinability, Optimization, Ceramic I. INTRODUCTION
Generally, the ceramic composites are Aluminium Metal Matrix Composites (AMMC) which are reinforced with different kinds of ceramic particles like Si3N4, A12O3, B4C, TiC and the most commonly used particle is SiC [1-6]. The Al/SiC composites with low density and high strength are mostly preferable for the industrial applications [7]. However, it could be very difficult to machine ceramic composites, because of their non-homogeneous, anisotropic and reinforced by very abrasive materials. So, the machined composite may experience a significant damage and high wear rate of cutting tools. After all, the machining of composite materials is depending on several conditions like material properties, relative content of the reinforcement and the response to the machining process [8, 9].
Fei et al. [10] studied compound machining of engineering materials to increase the efficiency of the machining method. In which, it was concluded that based on the output parameter the machine can be suggested but optimizing all the output in a single machine mode was tedious.
End milling is a vital and common machining process because of its flexibility and capability to produce various profiles even with curved surfaces. It has the ability to remove material faster with a good surface quality and milled surfaces are largely used to mate the aerospace, automobile, biomedical products, as well as in manufacturing industries applications [11]. End mill has found wide use in aerospace, automobile, mold and general machinery industries because of its good performance in processing difficult-to-machine materials [12]. The aims are to improve the surface roughness quality and maximize the material removal rate (MRR) with optimal cutting force. Traditionally, trial-and-error and heuristic approaches are employed to obtain the optimal machining parameters. It is well recognized that these methods are time consuming and lead to long machining periods with large machining cost [13].
Design of Experiments (DOE) is a powerful analysis tool for modelling and analysing the influence of control factors on output performance. The traditional experimental design is difficult to be used especially when dealing with large number of experiments and when the number of machining parameter is increasing [14]. The most important stage in the design of experiment lies in the selection of the control factors [15].
Oktem et al. [16] had focused on the development of an effective methodology to determine the optimum cutting conditions leading to minimum surface roughness (Ra) in milling by coupling Response Surface Methodology (RSM) with a developed genetic algorithm (GA). The micro milling condition which influence cutting force was studied to optimize the process stability [17]. Later, Emel et al. [18] had done a work to optimize cutting fluids and cutting parameters in end milling process using DOE. As a result, a new machining method with minimal machining cost without environmental impacts was developed.
e-ISSN : 0975-4024 Vamsi Krishna M et al. / International Journal of Engineering and Technology (IJET)
p-ISSN : 2319-8613 Vol 7 No 6 Dec 2015-Jan 2016 2274
The optimization of all the output parameters of end milling process was a tedious. This research work focuses on developing the mathematical models of cutting force (FR), Metal Removal Rate (MRR) and surface roughness (Ra) and to optimize it. And also the adequacies in predicting the responses by the developed models are evaluated along with experimental deviation of the optimal configuration.
II. MATERIALS AND METHODS
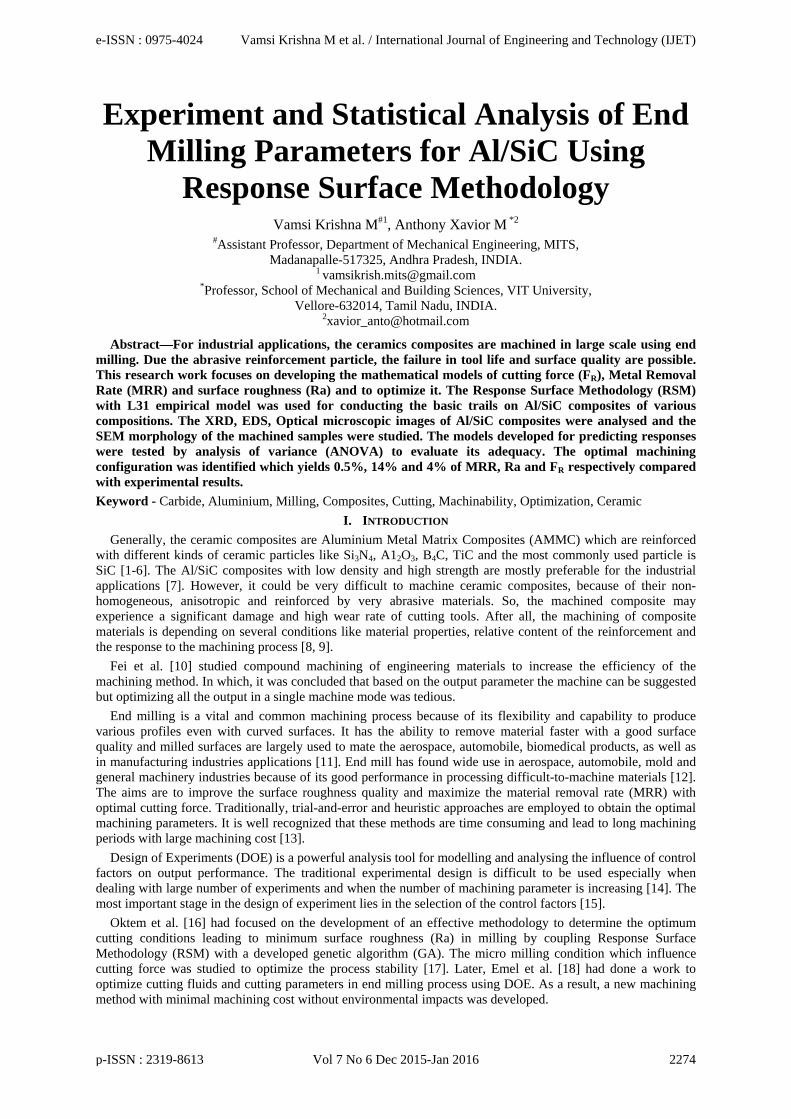
A. Materials The end milling tests were conducted with BATIBOI-NOMO universal milling machine (Fig. 1 (a)). In the
milling experiments, Al 6061/SiC composite material were used as the work piece with varying reinforcement wt. % of 5, 10 and 15, which had a dimension of 100*100*10mm3. Using the stir casting method, the Al/SiC composites were manufactured with SiC particle size of 37μm. For machining these composites for good machinability, the Poly Crystalline Diamond (PCD) tools were suggested [19].The Poly Crstalline Diamond (PCD) coated tool (Fig. 1 (b)) of thickness 0.6mm and 12mm in dia is used.
Fig. 1. (a) Universal milling machine (b) PCD coated tool
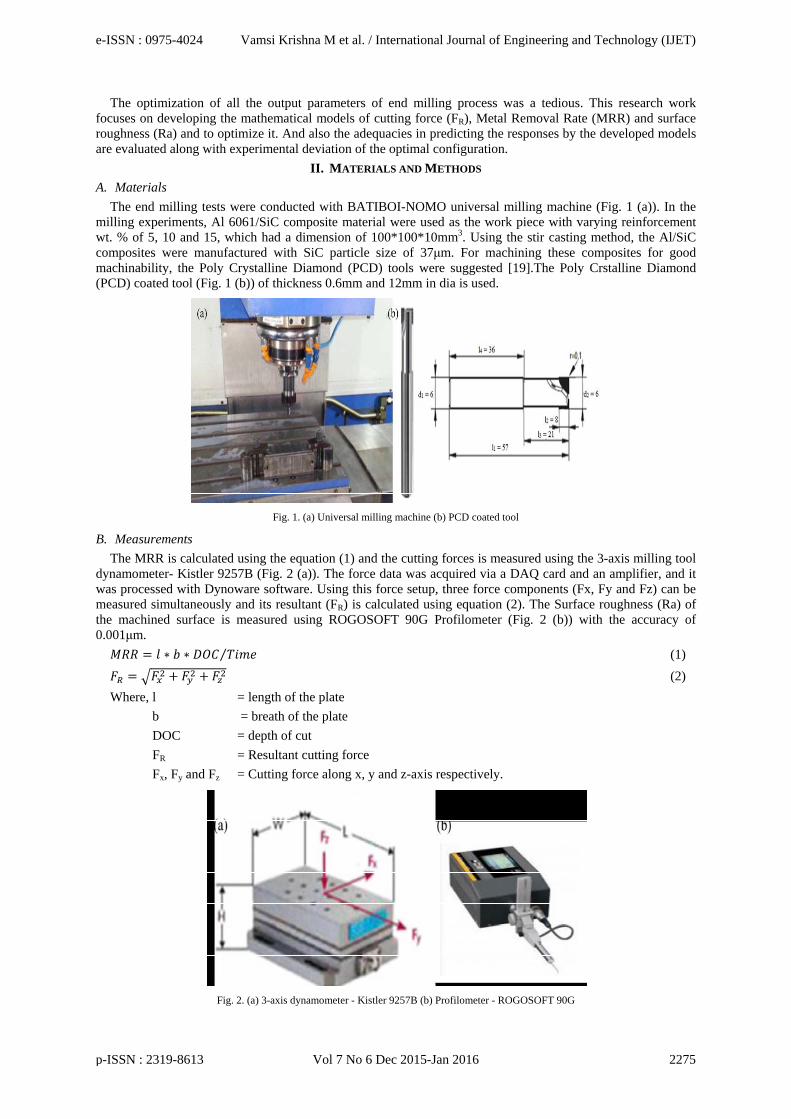
B. Measurements The MRR is calculated using the equation (1) and the cutting forces is measured using the 3-axis milling tool
dynamometer- Kistler 9257B (Fig. 2 (a)). The force data was acquired via a DAQ card and an amplifier, and it was processed with Dynoware software. Using this force setup, three force components (Fx, Fy and Fz) can be measured simultaneously and its resultant (FR) is calculated using equation (2). The Surface roughness (Ra) of the machined surface is measured using ROGOSOFT 90G Profilometer (Fig. 2 (b)) with the accuracy of 0.001μm. = ∗ ∗ ⁄ (1) = + + (2)
Where, l = length of the plate b = breath of the plate DOC = depth of cut FR = Resultant cutting force
Fx, Fy and Fz = Cutting force along x, y and z-axis respectively.
Fig. 2. (a) 3-axis dynamometer - Kistler 9257B (b) Profilometer - ROGOSOFT 90G
e-ISSN : 0975-4024 Vamsi Krishna M et al. / International Journal of Engineering and Technology (IJET)
p-ISSN : 2319-8613 Vol 7 No 6 Dec 2015-Jan 2016 2275
III. CHARACTERIZATION
A. X-ray Diffraction Analysis The X-ray diffraction (XRD) (Model: X’per PRO) pattern of the Al/SiC composite is shown in Fig. 3 and it
matches with the JCPDS file #04-0787 [20]. It exhibits strong (111) orientation at 38.33° and weak (311) peak at 77.91°. An osbornite phase was identified; and as a result of (111) to (220) peak intensity ratios, it can be understood as almost similar to the preferred orientation of Al [21]. It can be seen that the higher full width half maximum (FWHM) appeared along the (200) plane at 44.56°, resulting in the calculated crystalline size of about 44.9 nm. The unit cell of Al/SiC exhibits a hexagonal structure with a = b = 4.063460 Å and c = 4.068095Å of lattice.
Fig. 3. XRD pattern of Al/SiC composite
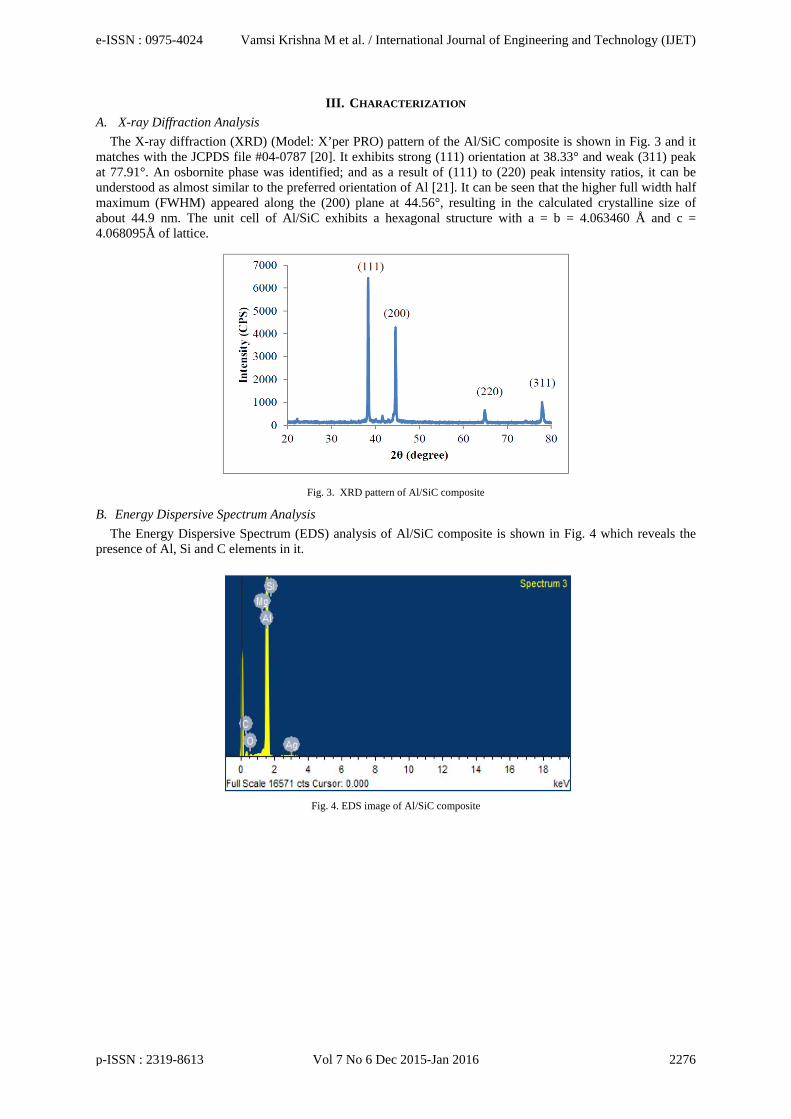
B. Energy Dispersive Spectrum Analysis The Energy Dispersive Spectrum (EDS) analysis of Al/SiC composite is shown in Fig. 4 which reveals the
presence of Al, Si and C elements in it.
Fig. 4. EDS image of Al/SiC composite
e-ISSN : 0975-4024 Vamsi Krishna M et al. / International Journal of Engineering and Technology (IJET)
p-ISSN : 2319-8613 Vol 7 No 6 Dec 2015-Jan 2016 2276
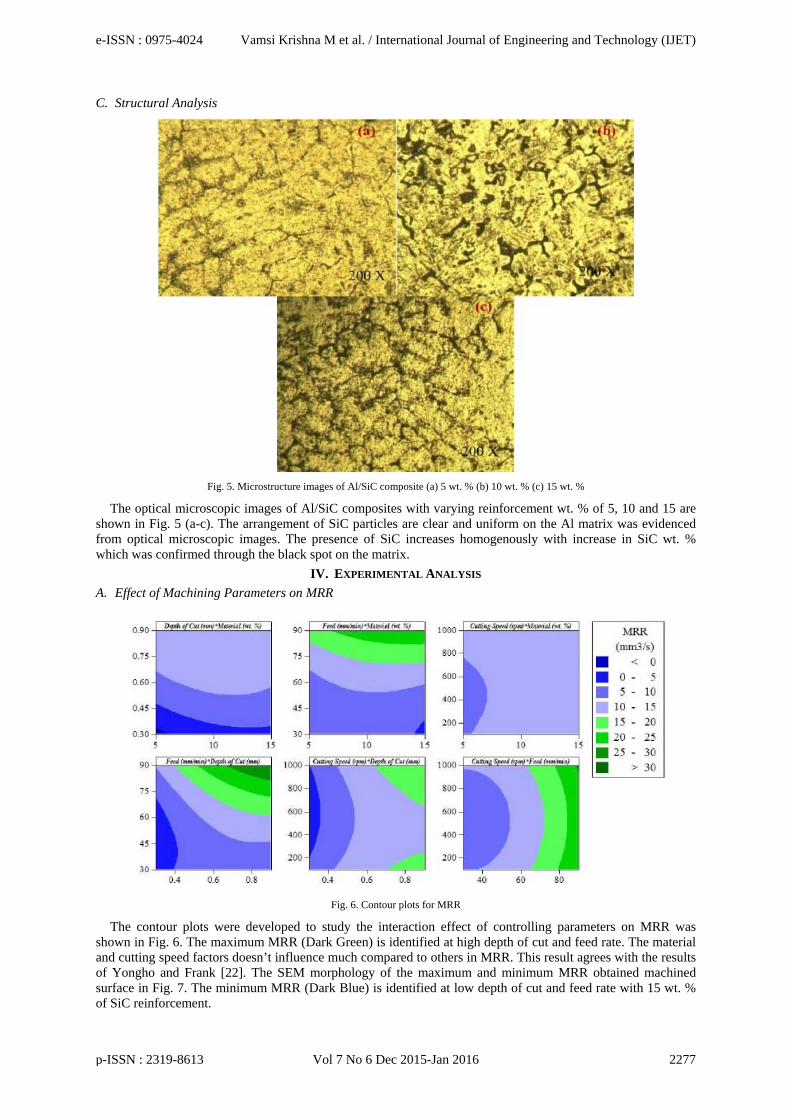
C. Structural Analysis
Fig. 5. Microstructure images of Al/SiC composite (a) 5 wt. % (b) 10 wt. % (c) 15 wt. %
The optical microscopic images of Al/SiC composites with varying reinforcement wt. % of 5, 10 and 15 are shown in Fig. 5 (a-c). The arrangement of SiC particles are clear and uniform on the Al matrix was evidenced from optical microscopic images. The presence of SiC increases homogenously with increase in SiC wt. % which was confirmed through the black spot on the matrix.
IV. EXPERIMENTAL ANALYSIS
A. Effect of Machining Parameters on MRR
Fig. 6. Contour plots for MRR
The contour plots were developed to study the interaction effect of controlling parameters on MRR was shown in Fig. 6. The maximum MRR (Dark Green) is identified at high depth of cut and feed rate. The material and cutting speed factors doesn’t influence much compared to others in MRR. This result agrees with the results of Yongho and Frank [22]. The SEM morphology of the maximum and minimum MRR obtained machined surface in Fig. 7. The minimum MRR (Dark Blue) is identified at low depth of cut and feed rate with 15 wt. % of SiC reinforcement.
e-ISSN : 0975-4024 Vamsi Krishna M et al. / International Journal of Engineering and Technology (IJET)
p-ISSN : 2319-8613 Vol 7 No 6 Dec 2015-Jan 2016 2277
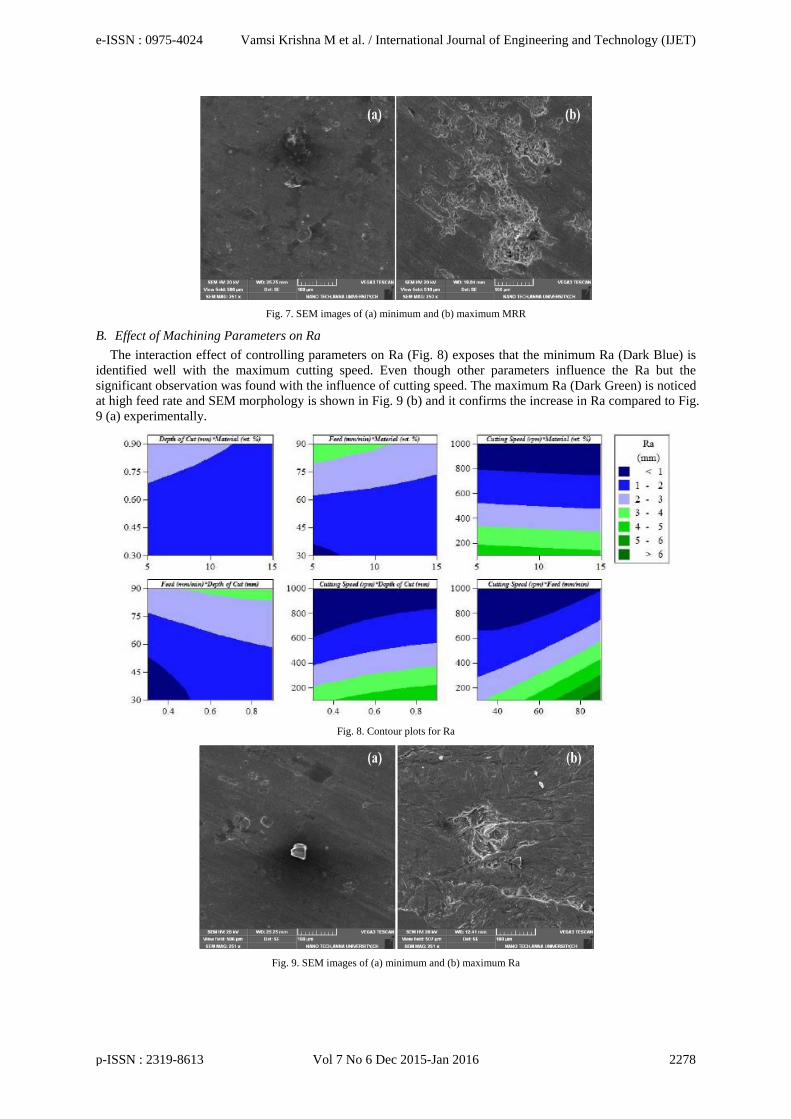
Fig. 7. SEM images of (a) minimum and (b) maximum MRR
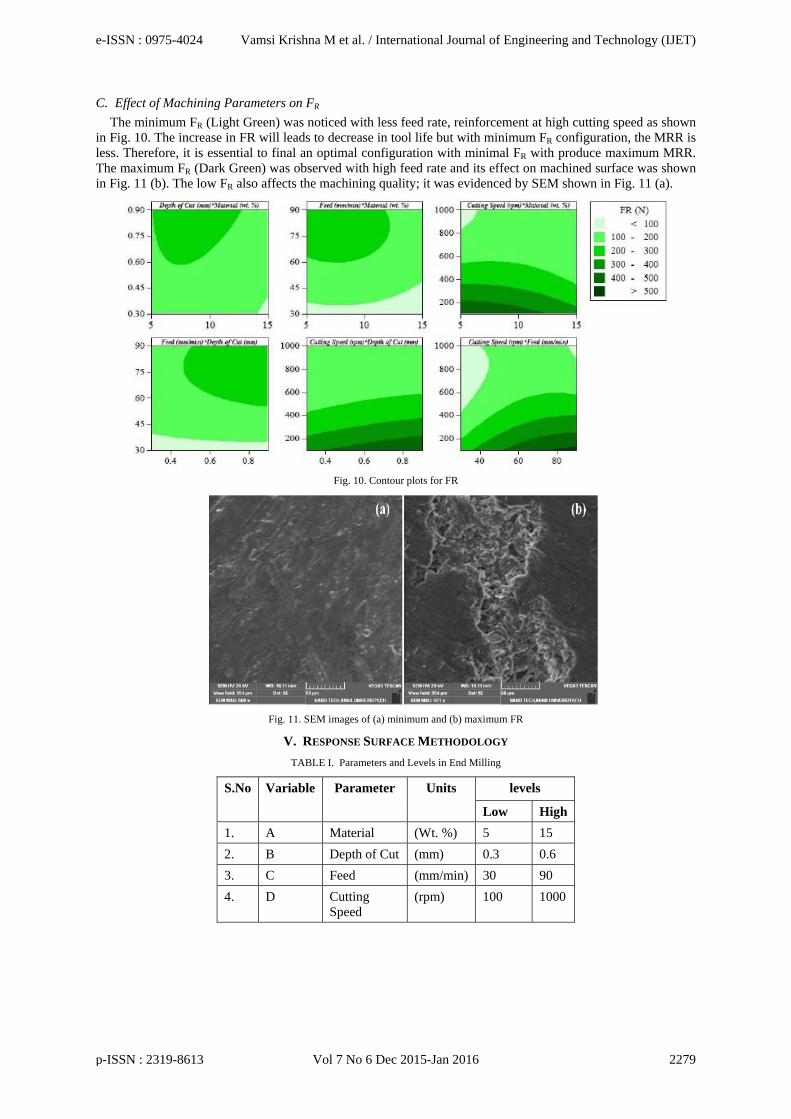
B. Effect of Machining Parameters on Ra The interaction effect of controlling parameters on Ra (Fig. 8) exposes that the minimum Ra (Dark Blue) is
identified well with the maximum cutting speed. Even though other parameters influence the Ra but the significant observation was found with the influence of cutting speed. The maximum Ra (Dark Green) is noticed at high feed rate and SEM morphology is shown in Fig. 9 (b) and it confirms the increase in Ra compared to Fig. 9 (a) experimentally.
Fig. 8. Contour plots for Ra
Fig. 9. SEM images of (a) minimum and (b) maximum Ra
e-ISSN : 0975-4024 Vamsi Krishna M et al. / International Journal of Engineering and Technology (IJET)
p-ISSN : 2319-8613 Vol 7 No 6 Dec 2015-Jan 2016 2278
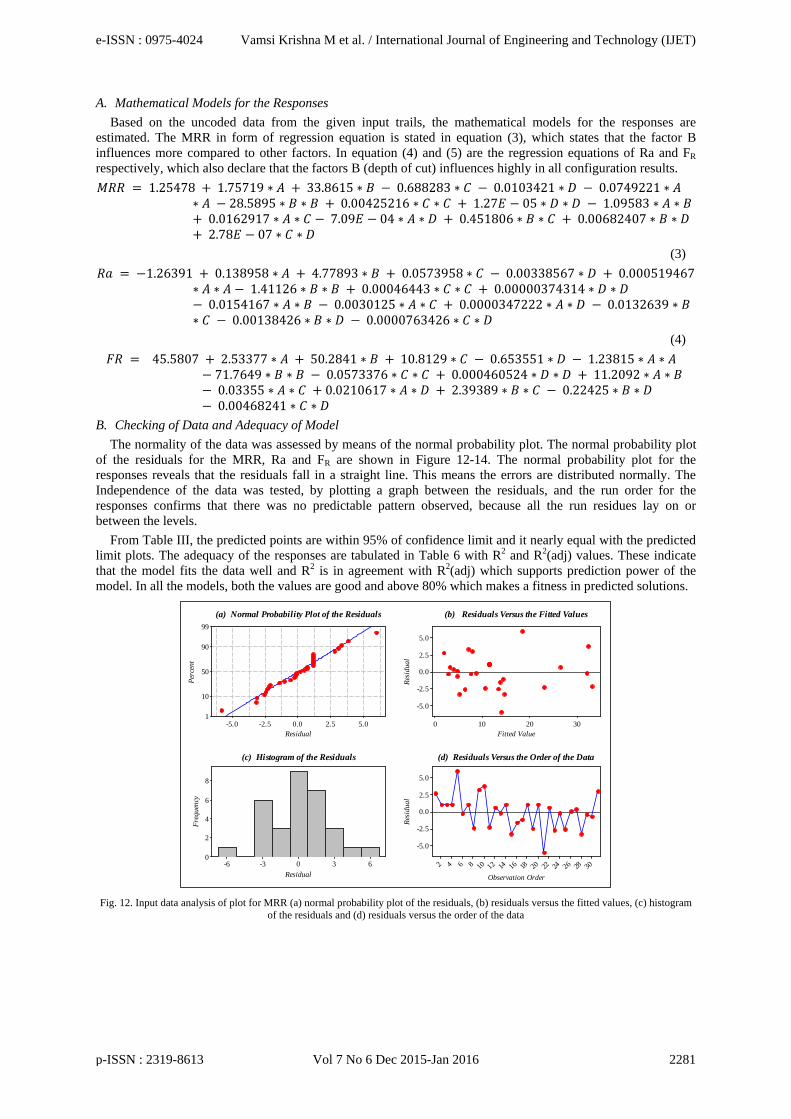
C. Effect of Machining Parameters on FR The minimum FR (Light Green) was noticed with less feed rate, reinforcement at high cutting speed as shown
in Fig. 10. The increase in FR will leads to decrease in tool life but with minimum FR configuration, the MRR is less. Therefore, it is essential to final an optimal configuration with minimal FR with produce maximum MRR. The maximum FR (Dark Green) was observed with high feed rate and its effect on machined surface was shown in Fig. 11 (b). The low FR also affects the machining quality; it was evidenced by SEM shown in Fig. 11 (a).
Fig. 10. Contour plots for FR
Fig. 11. SEM images of (a) minimum and (b) maximum FR
V. RESPONSE SURFACE METHODOLOGY
TABLE I. Parameters and Levels in End Milling
S.No Variable Parameter Units levels
Low High
1. A Material (Wt. %) 5 15 2. B Depth of Cut (mm) 0.3 0.6 3. C Feed (mm/min) 30 90 4. D Cutting
Speed (rpm) 100 1000
e-ISSN : 0975-4024 Vamsi Krishna M et al. / International Journal of Engineering and Technology (IJET)
p-ISSN : 2319-8613 Vol 7 No 6 Dec 2015-Jan 2016 2279
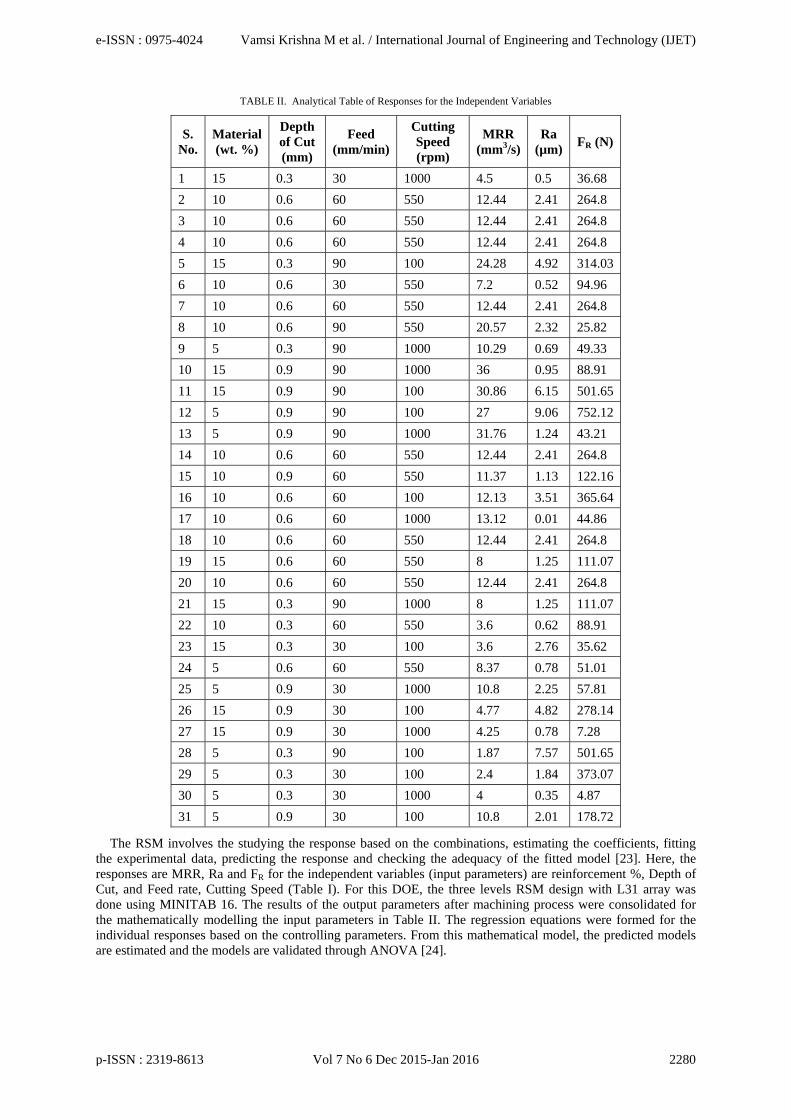
TABLE II. Analytical Table of Responses for the Independent Variables
S. No.
Material (wt. %)
Depth of Cut (mm)
Feed (mm/min)
Cutting Speed (rpm)
MRR (mm3/s)
Ra (µm)
FR (N)
1 15 0.3 30 1000 4.5 0.5 36.68 2 10 0.6 60 550 12.44 2.41 264.8 3 10 0.6 60 550 12.44 2.41 264.8 4 10 0.6 60 550 12.44 2.41 264.8 5 15 0.3 90 100 24.28 4.92 314.03 6 10 0.6 30 550 7.2 0.52 94.96 7 10 0.6 60 550 12.44 2.41 264.8 8 10 0.6 90 550 20.57 2.32 25.82 9 5 0.3 90 1000 10.29 0.69 49.33 10 15 0.9 90 1000 36 0.95 88.91 11 15 0.9 90 100 30.86 6.15 501.65 12 5 0.9 90 100 27 9.06 752.12 13 5 0.9 90 1000 31.76 1.24 43.21 14 10 0.6 60 550 12.44 2.41 264.8 15 10 0.9 60 550 11.37 1.13 122.16 16 10 0.6 60 100 12.13 3.51 365.64 17 10 0.6 60 1000 13.12 0.01 44.86 18 10 0.6 60 550 12.44 2.41 264.8 19 15 0.6 60 550 8 1.25 111.07 20 10 0.6 60 550 12.44 2.41 264.8 21 15 0.3 90 1000 8 1.25 111.07 22 10 0.3 60 550 3.6 0.62 88.91 23 15 0.3 30 100 3.6 2.76 35.62 24 5 0.6 60 550 8.37 0.78 51.01 25 5 0.9 30 1000 10.8 2.25 57.81 26 15 0.9 30 100 4.77 4.82 278.14 27 15 0.9 30 1000 4.25 0.78 7.28 28 5 0.3 90 100 1.87 7.57 501.65 29 5 0.3 30 100 2.4 1.84 373.07 30 5 0.3 30 1000 4 0.35 4.87 31 5 0.9 30 100 10.8 2.01 178.72
The RSM involves the studying the response based on the combinations, estimating the coefficients, fitting the experimental data, predicting the response and checking the adequacy of the fitted model [23]. Here, the responses are MRR, Ra and FR for the independent variables (input parameters) are reinforcement %, Depth of Cut, and Feed rate, Cutting Speed (Table I). For this DOE, the three levels RSM design with L31 array was done using MINITAB 16. The results of the output parameters after machining process were consolidated for the mathematically modelling the input parameters in Table II. The regression equations were formed for the individual responses based on the controlling parameters. From this mathematical model, the predicted models are estimated and the models are validated through ANOVA [24].
e-ISSN : 0975-4024 Vamsi Krishna M et al. / International Journal of Engineering and Technology (IJET)
p-ISSN : 2319-8613 Vol 7 No 6 Dec 2015-Jan 2016 2280
A. Mathematical Models for the Responses Based on the uncoded data from the given input trails, the mathematical models for the responses are
estimated. The MRR in form of regression equation is stated in equation (3), which states that the factor B influences more compared to other factors. In equation (4) and (5) are the regression equations of Ra and FR respectively, which also declare that the factors B (depth of cut) influences highly in all configuration results. = 1.25478 + 1.75719 ∗ + 33.8615 ∗ − 0.688283 ∗ − 0.0103421 ∗ − 0.0749221 ∗∗ − 28.5895 ∗ ∗ + 0.00425216 ∗ ∗ + 1.27 − 05 ∗ ∗ − 1.09583 ∗ ∗ + 0.0162917 ∗ ∗ − 7.09 − 04 ∗ ∗ + 0.451806 ∗ ∗ + 0.00682407 ∗ ∗ + 2.78 − 07 ∗ ∗
(3) = −1.26391 + 0.138958 ∗ + 4.77893 ∗ + 0.0573958 ∗ − 0.00338567 ∗ + 0.000519467∗ ∗ − 1.41126 ∗ ∗ + 0.00046443 ∗ ∗ + 0.00000374314 ∗ ∗ − 0.0154167 ∗ ∗ − 0.0030125 ∗ ∗ + 0.0000347222 ∗ ∗ − 0.0132639 ∗∗ − 0.00138426 ∗ ∗ − 0.0000763426 ∗ ∗ (4) = 45.5807 + 2.53377 ∗ + 50.2841 ∗ + 10.8129 ∗ − 0.653551 ∗ − 1.23815 ∗ ∗ − 71.7649 ∗ ∗ − 0.0573376 ∗ ∗ + 0.000460524 ∗ ∗ + 11.2092 ∗ ∗ − 0.03355 ∗ ∗ + 0.0210617 ∗ ∗ + 2.39389 ∗ ∗ − 0.22425 ∗ ∗ − 0.00468241 ∗ ∗
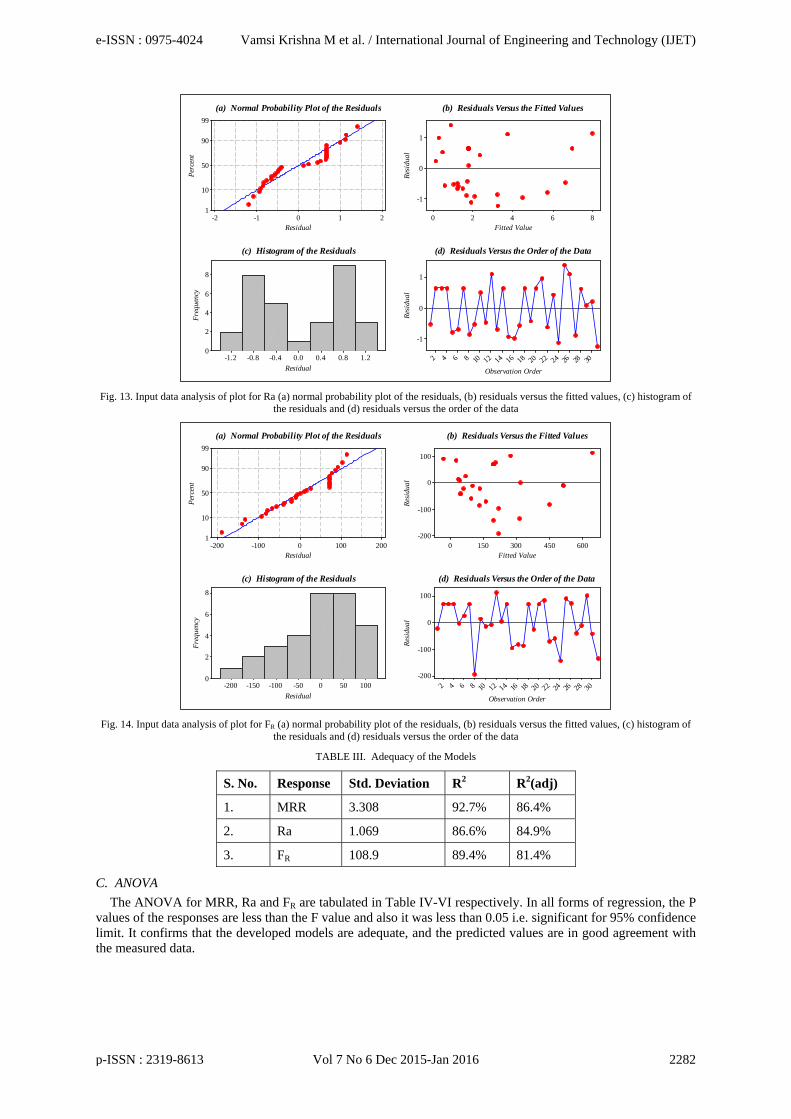
B. Checking of Data and Adequacy of Model The normality of the data was assessed by means of the normal probability plot. The normal probability plot
of the residuals for the MRR, Ra and FR are shown in Figure 12-14. The normal probability plot for the responses reveals that the residuals fall in a straight line. This means the errors are distributed normally. The Independence of the data was tested, by plotting a graph between the residuals, and the run order for the responses confirms that there was no predictable pattern observed, because all the run residues lay on or between the levels.
From Table III, the predicted points are within 95% of confidence limit and it nearly equal with the predicted limit plots. The adequacy of the responses are tabulated in Table 6 with R2 and R2(adj) values. These indicate that the model fits the data well and R2 is in agreement with R2(adj) which supports prediction power of the model. In all the models, both the values are good and above 80% which makes a fitness in predicted solutions.
Residual
Perc
ent
5.02.50.0-2.5-5.0
99
90
50
10
1
Fitted Value
Resi
dual
3020100
5.0
2.5
0.0
-2.5
-5.0
Residual
Freq
uenc
y
630-3-6
8
6
4
2
0
Observation Order
Resi
dual
30282624222018161412108642
5.0
2.5
0.0
-2.5
-5.0
(a) Normal Probability Plot of the Residuals (b) Residuals Versus the Fitted Values
(c) Histogram of the Residuals (d) Residuals Versus the Order of the Data
Fig. 12. Input data analysis of plot for MRR (a) normal probability plot of the residuals, (b) residuals versus the fitted values, (c) histogram
of the residuals and (d) residuals versus the order of the data
e-ISSN : 0975-4024 Vamsi Krishna M et al. / International Journal of Engineering and Technology (IJET)
p-ISSN : 2319-8613 Vol 7 No 6 Dec 2015-Jan 2016 2281
Residual
Perc
ent
210-1-2
99
90
50
10
1
Fitted Value
Resi
dual
86420
1
0
-1
Residual
Freq
uenc
y
1.20.80.40.0-0.4-0.8-1.2
8
6
4
2
0
Observation Order
Resi
dual
30282624222018161412108642
1
0
-1
(a) Normal Probability Plot of the Residuals (b) Residuals Versus the Fitted Values
(c) Histogram of the Residuals (d) Residuals Versus the Order of the Data
Fig. 13. Input data analysis of plot for Ra (a) normal probability plot of the residuals, (b) residuals versus the fitted values, (c) histogram of
the residuals and (d) residuals versus the order of the data
Residual
Perc
ent
2001000-100-200
99
90
50
10
1
Fitted Value
Resi
dual
6004503001500
100
0
-100
-200
Residual
Freq
uenc
y
100500-50-100-150-200
8
6
4
2
0
Observation Order
Resi
dual
30282624222018161412108642
100
0
-100
-200
(a) Normal Probability Plot of the Residuals (b) Residuals Versus the Fitted Values
(c) Histogram of the Residuals (d) Residuals Versus the Order of the Data
Fig. 14. Input data analysis of plot for FR (a) normal probability plot of the residuals, (b) residuals versus the fitted values, (c) histogram of
the residuals and (d) residuals versus the order of the data
TABLE III. Adequacy of the Models
S. No. Response Std. Deviation R2 R2(adj)
1. MRR 3.308 92.7% 86.4%
2. Ra 1.069 86.6% 84.9%
3. FR 108.9 89.4% 81.4%
C. ANOVA The ANOVA for MRR, Ra and FR are tabulated in Table IV-VI respectively. In all forms of regression, the P
values of the responses are less than the F value and also it was less than 0.05 i.e. significant for 95% confidence limit. It confirms that the developed models are adequate, and the predicted values are in good agreement with the measured data.
e-ISSN : 0975-4024 Vamsi Krishna M et al. / International Journal of Engineering and Technology (IJET)
p-ISSN : 2319-8613 Vol 7 No 6 Dec 2015-Jan 2016 2282
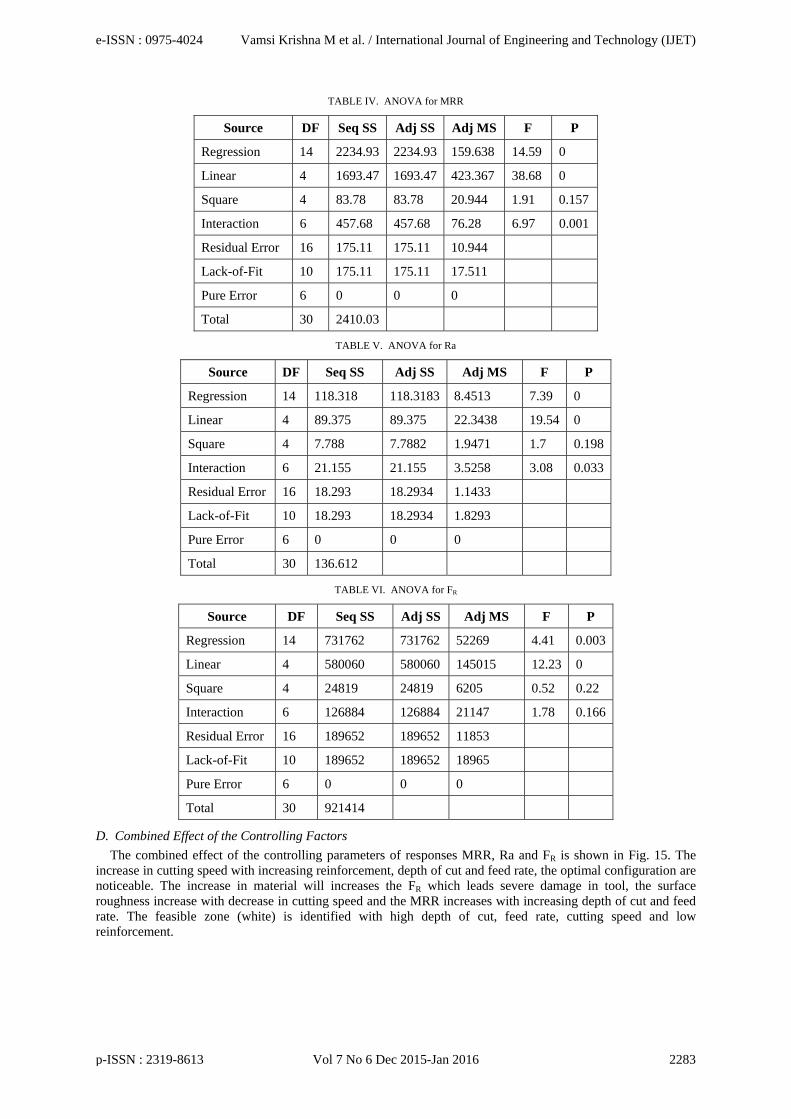
TABLE IV. ANOVA for MRR
Source DF Seq SS Adj SS Adj MS F P
Regression 14 2234.93 2234.93 159.638 14.59 0
Linear 4 1693.47 1693.47 423.367 38.68 0
Square 4 83.78 83.78 20.944 1.91 0.157
Interaction 6 457.68 457.68 76.28 6.97 0.001
Residual Error 16 175.11 175.11 10.944
Lack-of-Fit 10 175.11 175.11 17.511
Pure Error 6 0 0 0
Total 30 2410.03
TABLE V. ANOVA for Ra
Source DF Seq SS Adj SS Adj MS F P
Regression 14 118.318 118.3183 8.4513 7.39 0
Linear 4 89.375 89.375 22.3438 19.54 0
Square 4 7.788 7.7882 1.9471 1.7 0.198
Interaction 6 21.155 21.155 3.5258 3.08 0.033
Residual Error 16 18.293 18.2934 1.1433
Lack-of-Fit 10 18.293 18.2934 1.8293
Pure Error 6 0 0 0
Total 30 136.612
TABLE VI. ANOVA for FR
Source DF Seq SS Adj SS Adj MS F P
Regression 14 731762 731762 52269 4.41 0.003
Linear 4 580060 580060 145015 12.23 0
Square 4 24819 24819 6205 0.52 0.22
Interaction 6 126884 126884 21147 1.78 0.166
Residual Error 16 189652 189652 11853
Lack-of-Fit 10 189652 189652 18965
Pure Error 6 0 0 0
Total 30 921414
D. Combined Effect of the Controlling Factors The combined effect of the controlling parameters of responses MRR, Ra and FR is shown in Fig. 15. The
increase in cutting speed with increasing reinforcement, depth of cut and feed rate, the optimal configuration are noticeable. The increase in material will increases the FR which leads severe damage in tool, the surface roughness increase with decrease in cutting speed and the MRR increases with increasing depth of cut and feed rate. The feasible zone (white) is identified with high depth of cut, feed rate, cutting speed and low reinforcement.
e-ISSN : 0975-4024 Vamsi Krishna M et al. / International Journal of Engineering and Technology (IJET)
p-ISSN : 2319-8613 Vol 7 No 6 Dec 2015-Jan 2016 2283
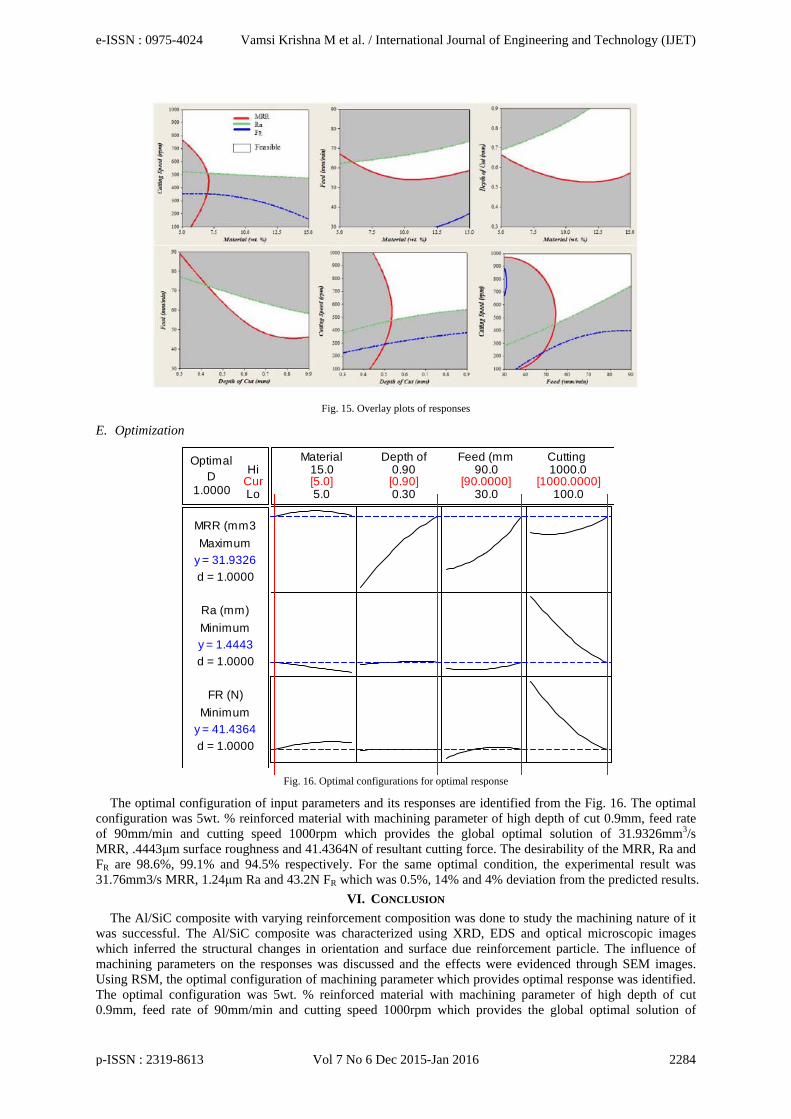
Fig. 15. Overlay plots of responses
E. Optimization
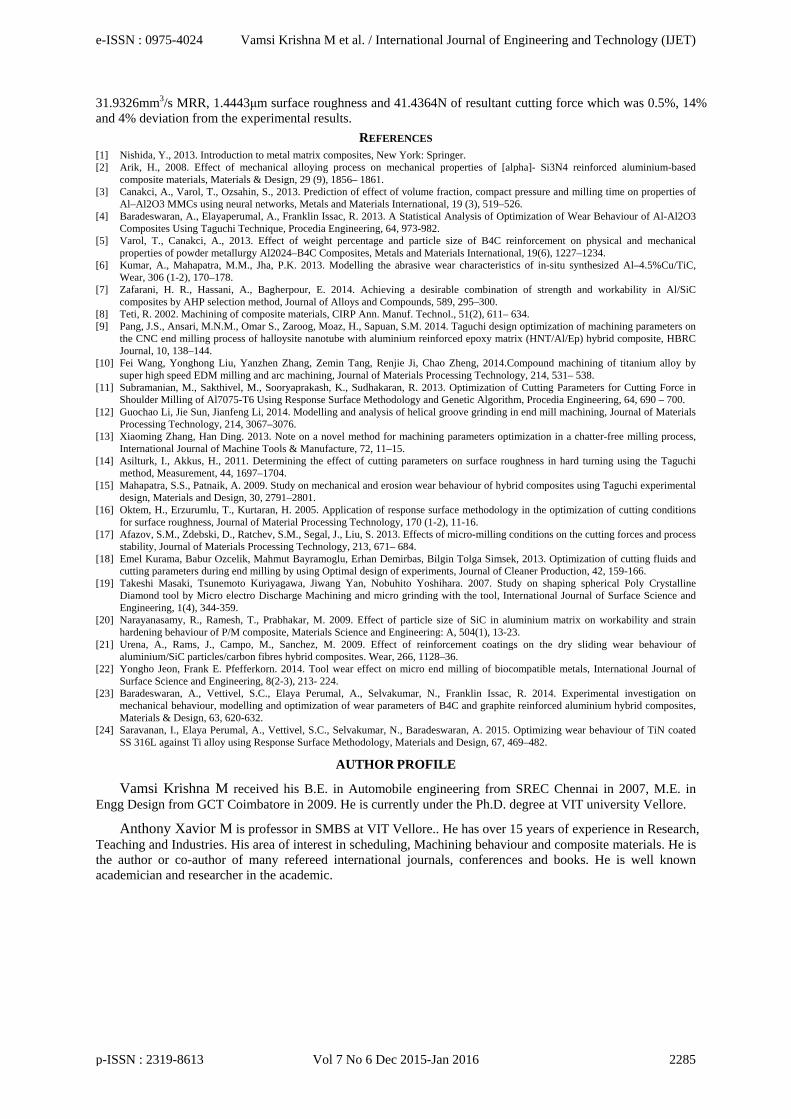
Fig. 16. Optimal configurations for optimal response
The optimal configuration of input parameters and its responses are identified from the Fig. 16. The optimal configuration was 5wt. % reinforced material with machining parameter of high depth of cut 0.9mm, feed rate of 90mm/min and cutting speed 1000rpm which provides the global optimal solution of 31.9326mm3/s MRR, .4443μm surface roughness and 41.4364N of resultant cutting force. The desirability of the MRR, Ra and FR are 98.6%, 99.1% and 94.5% respectively. For the same optimal condition, the experimental result was 31.76mm3/s MRR, 1.24μm Ra and 43.2N FR which was 0.5%, 14% and 4% deviation from the predicted results.
VI. CONCLUSION
The Al/SiC composite with varying reinforcement composition was done to study the machining nature of it was successful. The Al/SiC composite was characterized using XRD, EDS and optical microscopic images which inferred the structural changes in orientation and surface due reinforcement particle. The influence of machining parameters on the responses was discussed and the effects were evidenced through SEM images. Using RSM, the optimal configuration of machining parameter which provides optimal response was identified. The optimal configuration was 5wt. % reinforced material with machining parameter of high depth of cut 0.9mm, feed rate of 90mm/min and cutting speed 1000rpm which provides the global optimal solution of
Hi
Lo1.0000D
Optimal
Cur
d = 1.0000
MinimumFR (N)
d = 1.0000
MinimumRa (mm)
d = 1.0000
MaximumMRR (mm3
y = 41.4364
y = 1.4443
y = 31.9326
100.0
1000.0
30.0
90.0
0.30
0.90
5.0
15.0Depth of Feed (mm Cutting Material
[5.0] [0.90] [90.0000] [1000.0000]
e-ISSN : 0975-4024 Vamsi Krishna M et al. / International Journal of Engineering and Technology (IJET)
p-ISSN : 2319-8613 Vol 7 No 6 Dec 2015-Jan 2016 2284
31.9326mm3/s MRR, 1.4443μm surface roughness and 41.4364N of resultant cutting force which was 0.5%, 14% and 4% deviation from the experimental results.
REFERENCES [1] Nishida, Y., 2013. Introduction to metal matrix composites, New York: Springer. [2] Arik, H., 2008. Effect of mechanical alloying process on mechanical properties of [alpha]- Si3N4 reinforced aluminium-based
composite materials, Materials & Design, 29 (9), 1856– 1861. [3] Canakci, A., Varol, T., Ozsahin, S., 2013. Prediction of effect of volume fraction, compact pressure and milling time on properties of
Al–Al2O3 MMCs using neural networks, Metals and Materials International, 19 (3), 519–526. [4] Baradeswaran, A., Elayaperumal, A., Franklin Issac, R. 2013. A Statistical Analysis of Optimization of Wear Behaviour of Al-Al2O3
Composites Using Taguchi Technique, Procedia Engineering, 64, 973-982. [5] Varol, T., Canakci, A., 2013. Effect of weight percentage and particle size of B4C reinforcement on physical and mechanical
properties of powder metallurgy Al2024–B4C Composites, Metals and Materials International, 19(6), 1227–1234. [6] Kumar, A., Mahapatra, M.M., Jha, P.K. 2013. Modelling the abrasive wear characteristics of in-situ synthesized Al–4.5%Cu/TiC,
Wear, 306 (1-2), 170–178. [7] Zafarani, H. R., Hassani, A., Bagherpour, E. 2014. Achieving a desirable combination of strength and workability in Al/SiC
composites by AHP selection method, Journal of Alloys and Compounds, 589, 295–300. [8] Teti, R. 2002. Machining of composite materials, CIRP Ann. Manuf. Technol., 51(2), 611– 634. [9] Pang, J.S., Ansari, M.N.M., Omar S., Zaroog, Moaz, H., Sapuan, S.M. 2014. Taguchi design optimization of machining parameters on
the CNC end milling process of halloysite nanotube with aluminium reinforced epoxy matrix (HNT/Al/Ep) hybrid composite, HBRC Journal, 10, 138–144.
[10] Fei Wang, Yonghong Liu, Yanzhen Zhang, Zemin Tang, Renjie Ji, Chao Zheng, 2014.Compound machining of titanium alloy by super high speed EDM milling and arc machining, Journal of Materials Processing Technology, 214, 531– 538.
[11] Subramanian, M., Sakthivel, M., Sooryaprakash, K., Sudhakaran, R. 2013. Optimization of Cutting Parameters for Cutting Force in Shoulder Milling of Al7075-T6 Using Response Surface Methodology and Genetic Algorithm, Procedia Engineering, 64, 690 – 700.
[12] Guochao Li, Jie Sun, Jianfeng Li, 2014. Modelling and analysis of helical groove grinding in end mill machining, Journal of Materials Processing Technology, 214, 3067–3076.
[13] Xiaoming Zhang, Han Ding. 2013. Note on a novel method for machining parameters optimization in a chatter-free milling process, International Journal of Machine Tools & Manufacture, 72, 11–15.
[14] Asilturk, I., Akkus, H., 2011. Determining the effect of cutting parameters on surface roughness in hard turning using the Taguchi method, Measurement, 44, 1697–1704.
[15] Mahapatra, S.S., Patnaik, A. 2009. Study on mechanical and erosion wear behaviour of hybrid composites using Taguchi experimental design, Materials and Design, 30, 2791–2801.
[16] Oktem, H., Erzurumlu, T., Kurtaran, H. 2005. Application of response surface methodology in the optimization of cutting conditions for surface roughness, Journal of Material Processing Technology, 170 (1-2), 11-16.
[17] Afazov, S.M., Zdebski, D., Ratchev, S.M., Segal, J., Liu, S. 2013. Effects of micro-milling conditions on the cutting forces and process stability, Journal of Materials Processing Technology, 213, 671– 684.
[18] Emel Kurama, Babur Ozcelik, Mahmut Bayramoglu, Erhan Demirbas, Bilgin Tolga Simsek, 2013. Optimization of cutting fluids and cutting parameters during end milling by using Optimal design of experiments, Journal of Cleaner Production, 42, 159-166.
[19] Takeshi Masaki, Tsunemoto Kuriyagawa, Jiwang Yan, Nobuhito Yoshihara. 2007. Study on shaping spherical Poly Crystalline Diamond tool by Micro electro Discharge Machining and micro grinding with the tool, International Journal of Surface Science and Engineering, 1(4), 344-359.
[20] Narayanasamy, R., Ramesh, T., Prabhakar, M. 2009. Effect of particle size of SiC in aluminium matrix on workability and strain hardening behaviour of P/M composite, Materials Science and Engineering: A, 504(1), 13-23.
[21] Urena, A., Rams, J., Campo, M., Sanchez, M. 2009. Effect of reinforcement coatings on the dry sliding wear behaviour of aluminium/SiC particles/carbon fibres hybrid composites. Wear, 266, 1128–36.
[22] Yongho Jeon, Frank E. Pfefferkorn. 2014. Tool wear effect on micro end milling of biocompatible metals, International Journal of Surface Science and Engineering, 8(2-3), 213- 224.
[23] Baradeswaran, A., Vettivel, S.C., Elaya Perumal, A., Selvakumar, N., Franklin Issac, R. 2014. Experimental investigation on mechanical behaviour, modelling and optimization of wear parameters of B4C and graphite reinforced aluminium hybrid composites, Materials & Design, 63, 620-632.
[24] Saravanan, I., Elaya Perumal, A., Vettivel, S.C., Selvakumar, N., Baradeswaran, A. 2015. Optimizing wear behaviour of TiN coated SS 316L against Ti alloy using Response Surface Methodology, Materials and Design, 67, 469–482.
AUTHOR PROFILE
Vamsi Krishna M received his B.E. in Automobile engineering from SREC Chennai in 2007, M.E. in Engg Design from GCT Coimbatore in 2009. He is currently under the Ph.D. degree at VIT university Vellore.
Anthony Xavior M is professor in SMBS at VIT Vellore.. He has over 15 years of experience in Research, Teaching and Industries. His area of interest in scheduling, Machining behaviour and composite materials. He is the author or co-author of many refereed international journals, conferences and books. He is well known academician and researcher in the academic.
e-ISSN : 0975-4024 Vamsi Krishna M et al. / International Journal of Engineering and Technology (IJET)
p-ISSN : 2319-8613 Vol 7 No 6 Dec 2015-Jan 2016 2285