Embed Size (px)
Citation preview
Experimental Investigation of the Velocity Field in a Controlled Wind-aided Propagating Fire Using Particle Image Velocimetry
JESSE LOZANO 1, WATCHARAPONG TACHAJAPONG 1, HANSHENG PAN 1, AARON SWANSON 2, CHRIS KELLEY2, MARKO PRINCEVAC 1, and SHANKAR MAHALINGAM 1 1 Department of Mechanical Engineering, University of California, Riverside, California, USA 2 Northrop Grumman Space Technology, Redondo Beach, California, USA 1 University of California, Riverside, CA 92521 2 Bldg. M3/2053, Redondo Beach, CA 90278
ABSTRACT
Experiments on wind-aided firespread across an array of small diameter discrete fuel elements using a Particle Image Velocimetry (PIV) and thermocouple system were carried out in a specially designed wind tunnel at Northrop Grumman Space Technology. The rate of spread is determined using data gathered from thermocouples that were uniformly spaced within the fuel elements along the primary fire spread direction. The fuel consisted of a two dimensional array of identical, evenly spaced, wooden elements, positioned vertically in holes in a ceramic substrate. Utilization of this fuel bed allowed for repeatability of experiments. The effect on firespread rate was investigated for two different fuel loadings. A PIV system was used to investigate the various fluid dynamic structures present within a propagating fire front, and how firespread was influenced.
From analysis of the thermocouple and PIV data it was determined that in the high fuel loading situation (total dry fuel mass per unit fuel bed area, m = 3.12 kg/m2) firespread was assisted by intense forced turbulent convection, which preheated the fuel elements downwind of the fire front. For the low fuel loading case (m = 0.78 kg/m2) radiation played a more significant role in preheating of the unburned fuel elements.
KEYWORDS: firespread, PIV, wind-aided
INTRODUCTION
Current operational fire behavior models like BEHAVE [1] and FARSITE [2] are prescriptive in the sense that extensive empirical data is utilized to predict fire spread through fuel complexes. Temporal and spatial evolution of a fire front rely extensively on real-time data including local terrain and vegetation maps, local weather, and field reports based on land and air reconnaissance. This approach works well for steady, wind-driven fires, with modest heat loads. It is challenged when the coupling with the atmosphere is significant, as might occur during intense burns or dangerous blow-ups [3, 4]. Part of the limitation arises because these models do not account for a two-way coupling between the fire and the unsteady fluid flow field around the fire, which in turn determines the role of turbulent convection on heat transfer. The next generation operational fire behavior models are expected to be descriptive, including accurate representation of flow physics. It will improve the model output that drives decision support planning. This will enhance decision support systems for improved planning, operations, management, and risk assessment. In addition, it will provide a sound scientific basis for predicting pollutant formation, emissions, and transport of pollutants over fire scale and beyond. The focus of the research results reported here is on obtaining an improved understanding of one aspect of wind-aided fire spread, viz., the interconnection between fire and the fluid velocity field in its immediate vicinity.
Fire spread in the presence of wind is a fundamental problem in fire research but its dynamics are not quantitatively understood. The role of wind on the spread of a fire has been widely studied to understand its impact on the heat transfer mechanism for preheating unburned fuel. Convective and radiative energy transfers are assumed to be the main mechanisms in current operational models to predict fire spread (i.e. the Rothermel model [5]). Turbulent convection is considered to be an important heat transfer mechanism for preheating unburned fuel [6]. For laboratory-scale fire, Carrier et al. [6] reported that “convection and turbulent diffusion” are the main preheating mechanisms for wind-aided fire spread across an array of discrete fuel elements. In their experiments [7] that are similar to the ones reported here, they argue that the estimated radiative energy transfer to the unburned fuel is two orders of magnitude lower than
255
FIRE SAFETY SCIENCE–PROCEEDINGS OF THE NINTH INTERNATIONAL SYMPOSIUM, pp. 255-266
COPYRIGHT © 2008 INTERNATIONAL ASSOCIATION FOR FIRE SAFETY SCIENCE / DOI:10.3801/IAFSS.FSS.9-255
preheating energy required for the fuel to attain a pyrolysis temperature, leading to the conclusion that a convective-diffusive balance is sufficient to explain their observed results. The main result of their theoretical analysis is that the steady-state rate of spread (ROS) for wind-aided fire spread across small
diameter, discrete fuel elements is given by bmUR ∝ where R is the rate of spread, U is the steady ambient wind speed, and mb is the (burnt) fuel load defined as the burnt fuel mass per unit fuel bed area. Carrier et al. (1991)’s model [6] was tested against data from laboratory scale experiments (including experimental data from Fons (1946), Steward (1974), Nelson and Adkins (1988)) [8-10]. The trends of spread rate are reasonably consistent with the experiments [7]. Nevertheless, there was no data existing to describe the flow field of hot gas surrounding the fire front. The role of turbulent convection on the preheating process was not determined directly via experimentation [10]. A related scientific issue is the question of the existence of a steady state rate of spread. Recently [11], it has been argued that the rate of spread is dependent on fire growth history, and depending on the type of ignition (point versus line), acceleration or deceleration may occur. The relevance of this issue to the present work is addressed further in this paper.
Due to the difficulty in measuring the velocity field in a spreading fire there is currently no available data that describes the small temporal and spatial scales involved in the fire vortices that help to determine fire spread [12]. Fire induced vortices are thought to be an important fire spread mechanism through both local dynamics and their ability to loft flaming objects into areas well removed from the former fire front [13]. The specific goal of the work reported herein is to successfully implement a particle image velocimetry (PIV) technique that enables direct quantitative measurement of the instantaneous flow field in the vicinity of a spreading fire. The unique aspect of this work is that the fuel bed, fire spread, fire dynamics, imposed wind, are all precisely controlled and repeatable as in [7], but now the flow field is amenable to direct velocity measurements, which provides additional insight into fire spread dynamics.
EXPERIMENTAL SETUP
Fuel bed
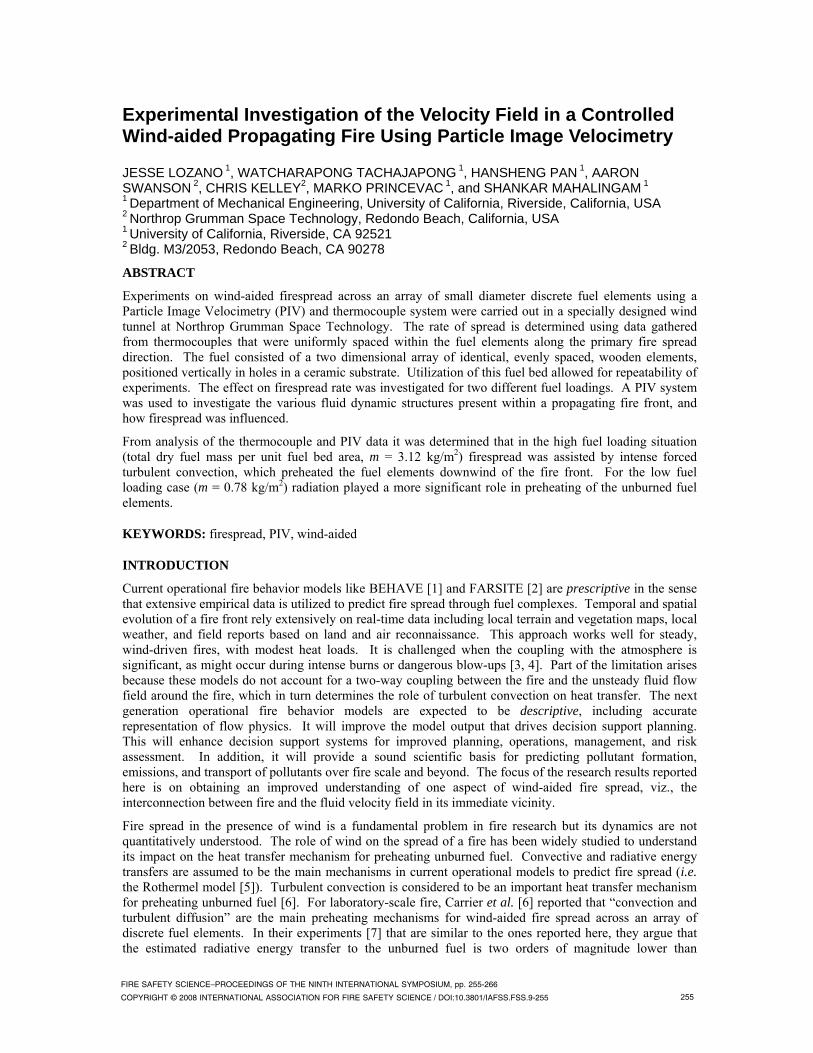
A laboratory scale experiment was set up in a wind tunnel to observe the effects of wind on wind-aided fire spread through an array of discrete fuel elements as shown in Fig. 1. The fuel samples used were bamboo skewers with diameter, length, and dry mass per unit length of 3.0 mm, 5.0 cm, and 0.062 g/cm, respectively. The dry-basis moisture content of fuel samples were in the range of 4.3-5.0% measured using an Arizona Instruments Computrac moisture analyzer. The fuel elements were inserted into an array of equally spaced holes over a 55.0 cm x 110.0 cm clay substrate. The depth of holes was 1.5 cm so the height of fuel above the substrate surface was 3.5 cm. Two fuel loading values m, were investigated by varying the spacing between each fuel element (i.e. 1.0 cm x 1.0 cm grid for m = 3.12 kg/m2, and 2.0 cm x 2.0 cm grid for m = 0.78 kg/m2). The fuel load m is defined as the total dry fuel mass per unit fuel bed area, including the entire 5.0 cm length of fuel elements. The fuel elements were ignited by a propane flame dispensing from a line of 1/8” holes in a steel tube run parallel to the upwind-most row. Ignition was typically accomplished between 2.0 and 8.0 seconds. Due to the large amount of time required to prepare each fuel bed, to date, it was only possible to perform four repetitions of case 1 (m = 3.12 kg/m2) experiments and two repetitions of case 2 (m = 0.78 kg/m2) experiments.
Wind tunnel
The experiments were conducted in a specially designed wind tunnel located at the Northrop Grumman Space Technology (NGST) campus in Redondo Beach, CA. The wind tunnel characteristics are described in more detail in [7]. Here a summary of the main features is presented. The wind tunnel test section has a cross sectional area of 1.0 m (width) x 1.0 m (height) and a length of 5.0 m. The lateral walls are made of transparent 0.5 cm thick pyroceram or pyrex material. A unique aspect of the NGST fire tunnel is that it has a movable ceiling that allows combustion products to rise without obstruction through an exhaust hood that is located 3.0 m above the fuel bed. This is accomplished manually by locating the downwind edge of the ceiling, just upwind of the spreading fire front, while maintaining a constant cross sectional area upwind of the fire front. This is aided by a video camera mounted on the movable ceiling, which provides a continuous view of the fire line. A system including a blower and a flow conditioning section produces
256
an approximately uniform stream of low turbulence air throughout the length of the test section. A wind speed of 0.6 m/s was chosen for this study. Due to the amount of fuel being used in the high fuel loading case, a slight wind condition is required to maintain fire propagation. The slowest speed available at the Northrop Grumman wind tunnel is 0.6 m/s, thus 0.6 m/s wind condition is used for this study. The ambient conditions were not controlled. The ambient temperature and relative humidity were in the range of 288 K to 294 K and 49 % to 66 %, respectively. Each fuel loading condition was repeated at least two times for the same nominal values of input variables. Because conditions could be controlled precisely, the number of experiments performed for each case is adequate for this study.
Fig. 1. The experimental setup showing the uniform fuel bed with approximate thermocouple locations
indicated as black dots (TC1-TC8)
Thermocouple system
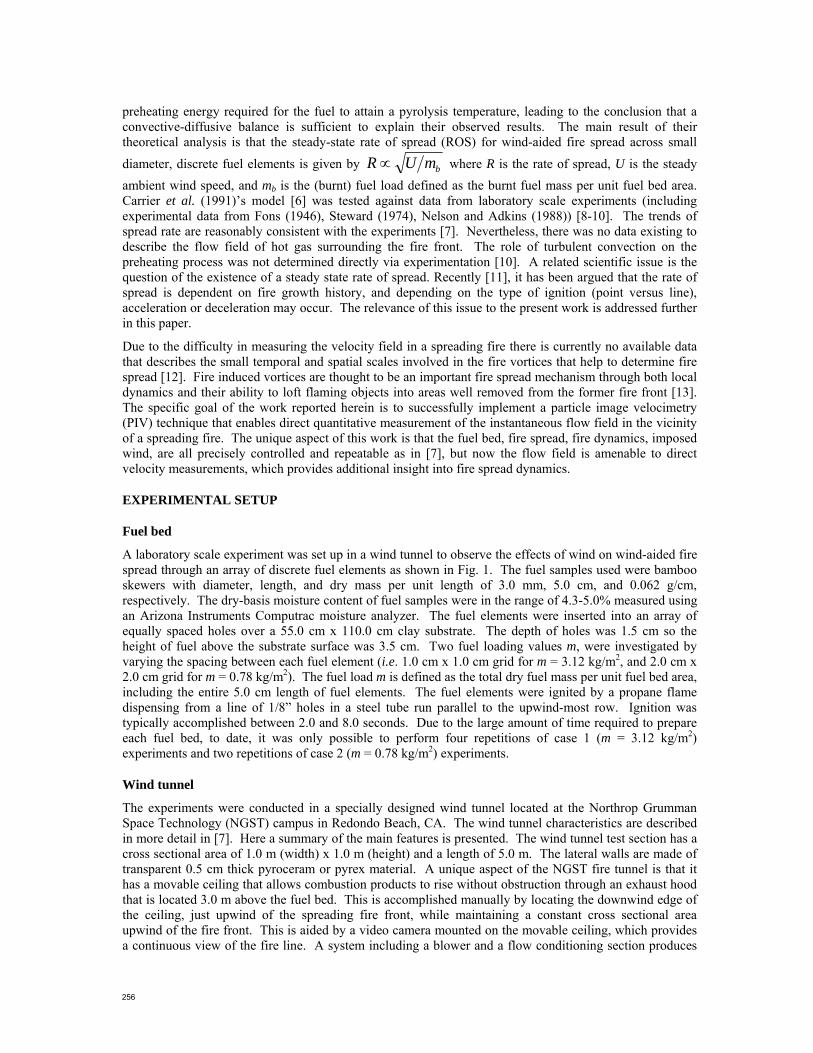
A set of eight 14 gauge (1.6 mm diameter) type K (bare chromel-alumel) thermocouples was used to record the temperatures of the fire within the fuel bed. Temperatures were recorded every 0.20 seconds and were taken along the centerline of the fire spread path with a 14.0 cm interval spacing between each thermocouple. Since the rate of spread was below 1.0 cm/s, the sampling rate of 5 Hz was deemed adequate for this study. The thermocouples were located at a height of 2.0 cm above the substrate surface (approximately at half the fuel element height) as shown in Fig. 2. Radiation correction was applied [14] so that the temperature was corrected approximately 211 K for a maximum thermocouple reading of 1,171 K.
Fig. 2. Thermocouple used for temperature measurements.
257
PIV Setup
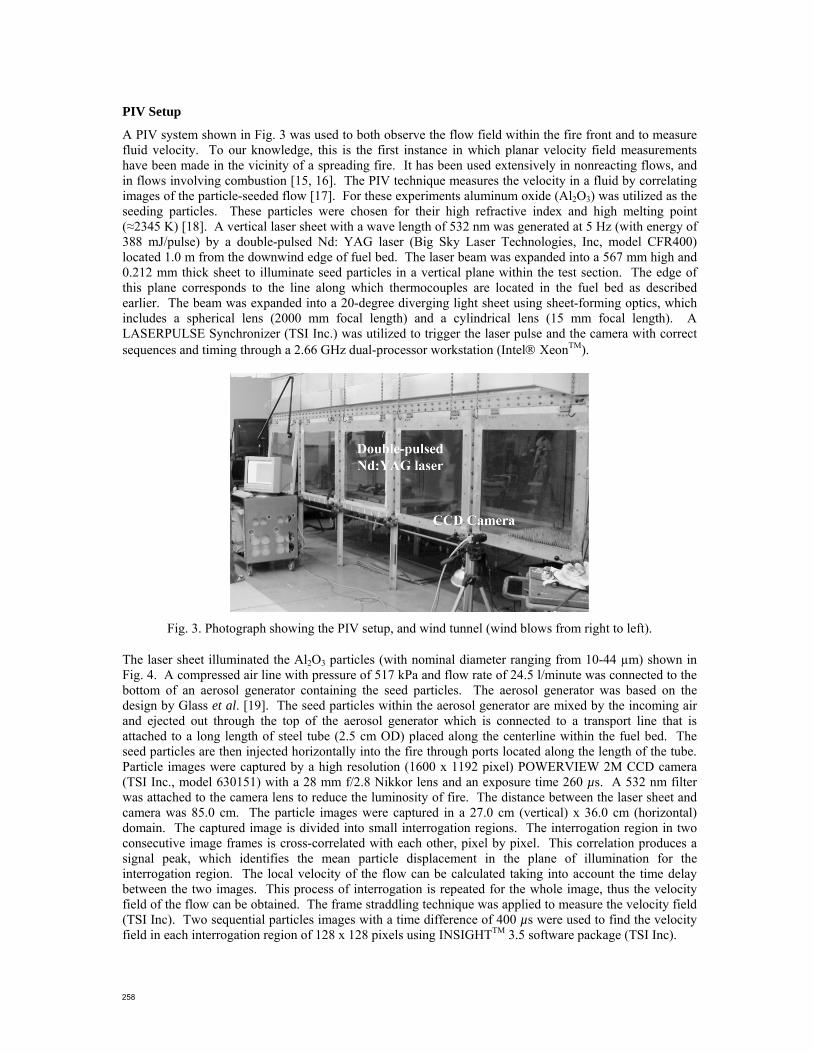
A PIV system shown in Fig. 3 was used to both observe the flow field within the fire front and to measure fluid velocity. To our knowledge, this is the first instance in which planar velocity field measurements have been made in the vicinity of a spreading fire. It has been used extensively in nonreacting flows, and in flows involving combustion [15, 16]. The PIV technique measures the velocity in a fluid by correlating images of the particle-seeded flow [17]. For these experiments aluminum oxide (Al2O3) was utilized as the seeding particles. These particles were chosen for their high refractive index and high melting point (≈2345 K) [18]. A vertical laser sheet with a wave length of 532 nm was generated at 5 Hz (with energy of 388 mJ/pulse) by a double-pulsed Nd: YAG laser (Big Sky Laser Technologies, Inc, model CFR400) located 1.0 m from the downwind edge of fuel bed. The laser beam was expanded into a 567 mm high and 0.212 mm thick sheet to illuminate seed particles in a vertical plane within the test section. The edge of this plane corresponds to the line along which thermocouples are located in the fuel bed as described earlier. The beam was expanded into a 20-degree diverging light sheet using sheet-forming optics, which includes a spherical lens (2000 mm focal length) and a cylindrical lens (15 mm focal length). A LASERPULSE Synchronizer (TSI Inc.) was utilized to trigger the laser pulse and the camera with correct sequences and timing through a 2.66 GHz dual-processor workstation (Intel® XeonTM).
Fig. 3. Photograph showing the PIV setup, and wind tunnel (wind blows from right to left).
The laser sheet illuminated the Al2O3 particles (with nominal diameter ranging from 10-44 µm) shown in Fig. 4. A compressed air line with pressure of 517 kPa and flow rate of 24.5 l/minute was connected to the bottom of an aerosol generator containing the seed particles. The aerosol generator was based on the design by Glass et al. [19]. The seed particles within the aerosol generator are mixed by the incoming air and ejected out through the top of the aerosol generator which is connected to a transport line that is attached to a long length of steel tube (2.5 cm OD) placed along the centerline within the fuel bed. The seed particles are then injected horizontally into the fire through ports located along the length of the tube. Particle images were captured by a high resolution (1600 x 1192 pixel) POWERVIEW 2M CCD camera (TSI Inc., model 630151) with a 28 mm f/2.8 Nikkor lens and an exposure time 260 µs. A 532 nm filter was attached to the camera lens to reduce the luminosity of fire. The distance between the laser sheet and camera was 85.0 cm. The particle images were captured in a 27.0 cm (vertical) x 36.0 cm (horizontal) domain. The captured image is divided into small interrogation regions. The interrogation region in two consecutive image frames is cross-correlated with each other, pixel by pixel. This correlation produces a signal peak, which identifies the mean particle displacement in the plane of illumination for the interrogation region. The local velocity of the flow can be calculated taking into account the time delay between the two images. This process of interrogation is repeated for the whole image, thus the velocity field of the flow can be obtained. The frame straddling technique was applied to measure the velocity field (TSI Inc). Two sequential particles images with a time difference of 400 µs were used to find the velocity field in each interrogation region of 128 x 128 pixels using INSIGHTTM 3.5 software package (TSI Inc).
258
RESULTS AND DISCUSSION
Temperature and spread rate
From the thermocouple data (Fig. 5) we were able to calculate the rate of spread for the two loading cases. For these experiments two fuel element loading cases were considered, case 1 with a fuel loading m = 3.12 kg/m2 and case 2 with m = 0.78 kg/m2. Temperatures range from ambient temperature to a maximum between 1300 K (in case 1) to 1600 K (in case 2). The temporal evolution shows that temperature rises gradually from nearly ambient values as the fuel is preheated (till about 400K), followed by a region in which the temperature rises rapidly within about 20 seconds, following arrival of the fire front. The temperature then drops relatively slowly as the thermocouple is convectively cooled by the incoming cold air. Using a reference temperature (500 K) and the distance between adjacent thermocouples (14.0 cm), the rate of spread was computed by noting the time each thermocouple required to reach the reference temperature. Figure 5a show the temperature reading for a case 1 experiment. The average rate of spread calculated from the four case 1 experiments is 0.26 cm/s. Figure 5b shows the thermocouple readings for a case 2 experiment. Average rate of spread determined from the two case 2 experiments performed is 0.59 cm/s.
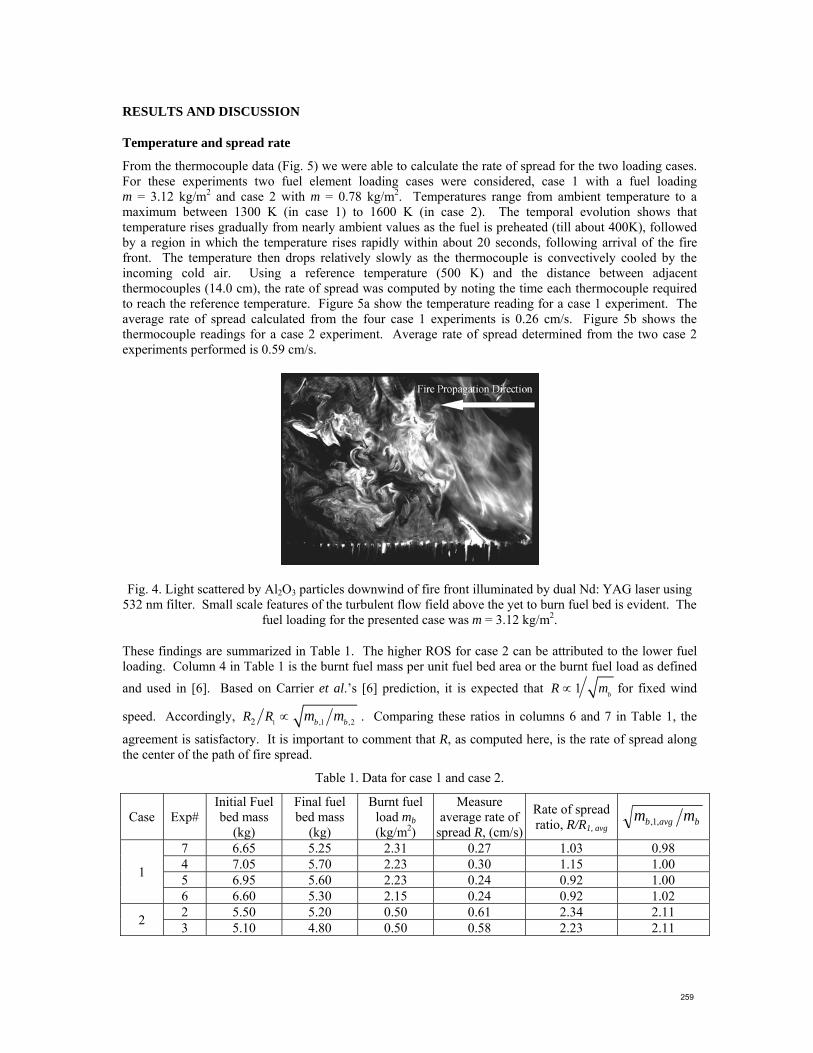
Fig. 4. Light scattered by Al2O3 particles downwind of fire front illuminated by dual Nd: YAG laser using 532 nm filter. Small scale features of the turbulent flow field above the yet to burn fuel bed is evident. The
fuel loading for the presented case was m = 3.12 kg/m2.
These findings are summarized in Table 1. The higher ROS for case 2 can be attributed to the lower fuel loading. Column 4 in Table 1 is the burnt fuel mass per unit fuel bed area or the burnt fuel load as defined
and used in [6]. Based on Carrier et al.’s [6] prediction, it is expected that 1 bR m∝ for fixed wind
speed. Accordingly, 1 ,1 ,22 b bR R m m∝ . Comparing these ratios in columns 6 and 7 in Table 1, the
agreement is satisfactory. It is important to comment that R, as computed here, is the rate of spread along the center of the path of fire spread.
Table 1. Data for case 1 and case 2.
Case Exp# Initial Fuel bed mass
(kg)
Final fuel bed mass
(kg)
Burnt fuel load mb (kg/m2)
Measure average rate of
spread R, (cm/s)
Rate of spread ratio, R/R1, avg bavgb mm ,1,
1
7 6.65 5.25 2.31 0.27 1.03 0.98 4 7.05 5.70 2.23 0.30 1.15 1.00 5 6.95 5.60 2.23 0.24 0.92 1.00 6 6.60 5.30 2.15 0.24 0.92 1.02
2 2 5.50 5.20 0.50 0.61 2.34 2.11 3 5.10 4.80 0.50 0.58 2.23 2.11
259
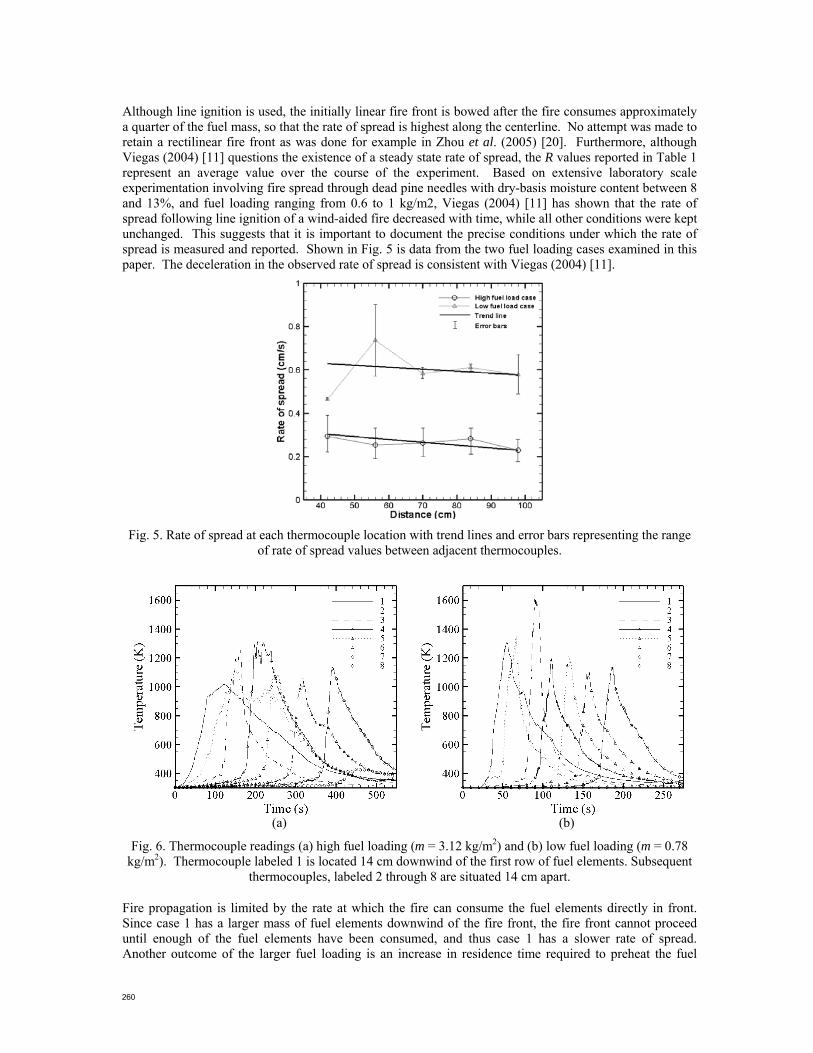
Although line ignition is used, the initially linear fire front is bowed after the fire consumes approximately a quarter of the fuel mass, so that the rate of spread is highest along the centerline. No attempt was made to retain a rectilinear fire front as was done for example in Zhou et al. (2005) [20]. Furthermore, although Viegas (2004) [11] questions the existence of a steady state rate of spread, the R values reported in Table 1 represent an average value over the course of the experiment. Based on extensive laboratory scale experimentation involving fire spread through dead pine needles with dry-basis moisture content between 8 and 13%, and fuel loading ranging from 0.6 to 1 kg/m2, Viegas (2004) [11] has shown that the rate of spread following line ignition of a wind-aided fire decreased with time, while all other conditions were kept unchanged. This suggests that it is important to document the precise conditions under which the rate of spread is measured and reported. Shown in Fig. 5 is data from the two fuel loading cases examined in this paper. The deceleration in the observed rate of spread is consistent with Viegas (2004) [11].
Fig. 5. Rate of spread at each thermocouple location with trend lines and error bars representing the range
of rate of spread values between adjacent thermocouples.
(a)
(b)
Fig. 6. Thermocouple readings (a) high fuel loading (m = 3.12 kg/m2) and (b) low fuel loading (m = 0.78 kg/m2). Thermocouple labeled 1 is located 14 cm downwind of the first row of fuel elements. Subsequent
thermocouples, labeled 2 through 8 are situated 14 cm apart.
Fire propagation is limited by the rate at which the fire can consume the fuel elements directly in front. Since case 1 has a larger mass of fuel elements downwind of the fire front, the fire front cannot proceed until enough of the fuel elements have been consumed, and thus case 1 has a slower rate of spread. Another outcome of the larger fuel loading is an increase in residence time required to preheat the fuel
260
elements downwind of the fire front which is observed through a comparison of the thermocouple data in Figs. 6a and 6b. Note that thermocouple 7 shows fire front arrival at approximately 360 seconds following ignition for the higher fuel load, while this time is about 170 seconds for the lower fuel load case.
(a)
(b)
(c)
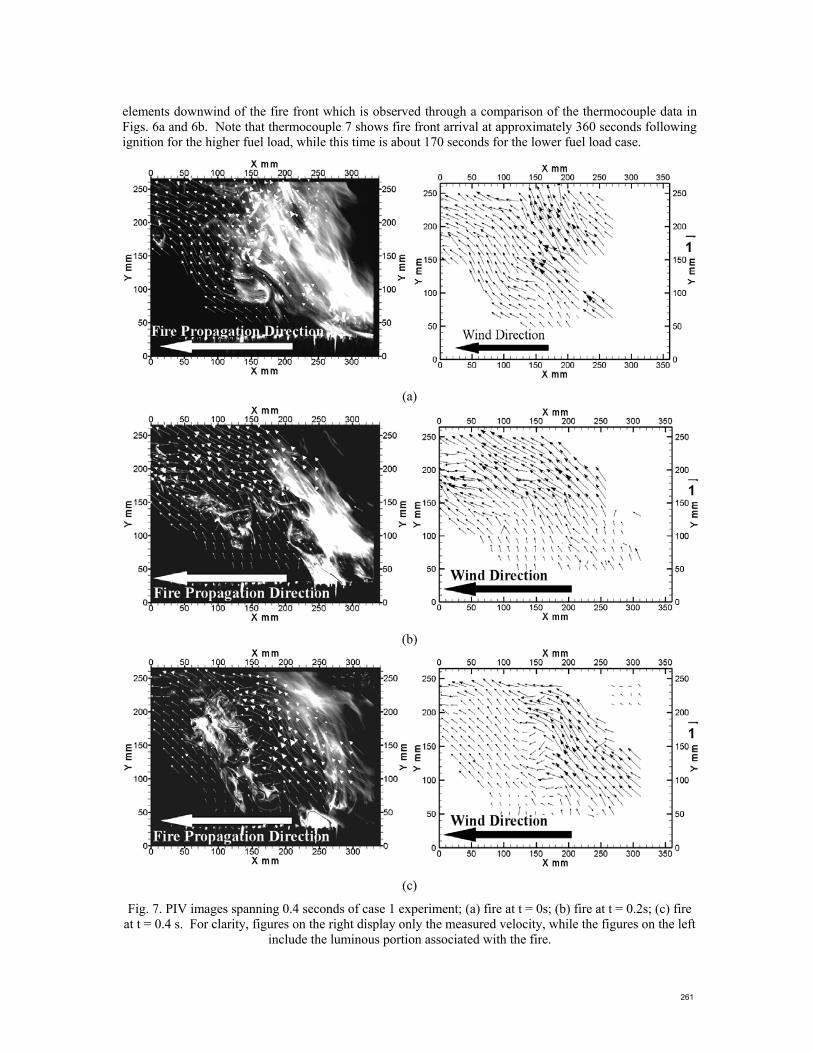
Fig. 7. PIV images spanning 0.4 seconds of case 1 experiment; (a) fire at t = 0s; (b) fire at t = 0.2s; (c) fire at t = 0.4 s. For clarity, figures on the right display only the measured velocity, while the figures on the left
include the luminous portion associated with the fire.
261
Another factor that influences fire spread is the flame tilt angle towards unburned fuels. Flame tilt angle influences fire spread by altering the view factor and regulating the amount of radiative heat transfer to the unburned fuels. To determine if the tilt angle of the flame in case 2 enabled the fire to propagate at a greater rate than in case 1, a flame tilt angle analysis was performed. In this analysis the flame tilt angle was measured from each PIV image from each experiment for both cases. For case 1 and case 2 the average flame tilt angles from the vertical were 41° and 44° respectively. The small differences in tilt angles alone should not be sufficient to increase the ROS in case 2 by a factor of 2.
PIV and thermocouple data analysis
Utilizing the PIV data it was possible to visualize the fluid dynamic structures present within and around a propagating fire front and to determine the effect those structure have on fire spread rate for the different fuel loading cases investigated. Figure 7 shows a sequence of PIV images recorded along with the calculated velocity vector field for case 1 (m = 3.12 kg/m2). The length of the velocity vectors corresponds to the magnitude of the velocity. The time separation between successive images is 0.2 seconds. It is evident that seed particles are lifted by the flame, enabling measurement of velocities both in the luminous flame region and ahead of it. The largest velocities are measured within the fire front itself where the highest temperatures in the gas phase are expected. Velocities in this region varied from 1.5 m/s to 2.7 m/s. Also note that the velocity is measured within about 10 mm above the edge of the fuel elements, and in regions clearly within the fire front. Data in Fig. 7 shows empty regions in which the seed particle density is insufficient to enable measurement of fluid velocity.
(a)
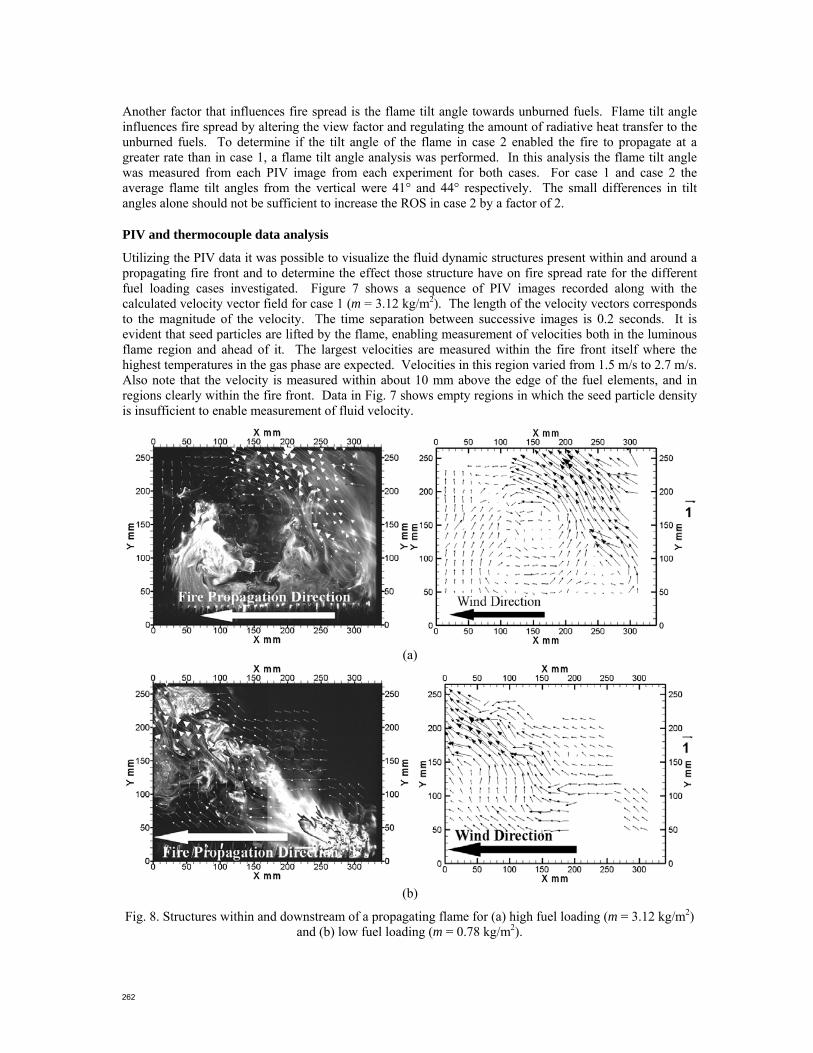
(b)
Fig. 8. Structures within and downstream of a propagating flame for (a) high fuel loading (m = 3.12 kg/m2) and (b) low fuel loading (m = 0.78 kg/m2).
262
From Fig. 8a we can see that a vortex has formed downstream of the fire front. The fire intensity I is a measure of the energy release rate per unit length (kJ/s/m) along the fire line. It is proportional to the product of the rate of spread and the burnt fuel mass loading, i.e., bI Rm∝ . Since 1 bR m∝ as
suggested by [6] and validated by [7] and present data in Table 1, it is evident that bI m∝ , thus, because of the higher loading in case 1, a higher intensity fire front is present which causes entrainment of ambient air under more turbulent conditions resulting in the formation of a vortex. Ambient air entrained by the fire as it approaches the fire front is heated. This heated air preheats the fuel elements and is then forced upward as it reaches the downstream side of the fire front. Heated air from this region is then re-circulated to continue preheating the fuel elements downstream of the fire front. By investigating numerous images, it was found that for both cases 1 and 2 turbulent convection is present, but only in case 1 does it result in the formation of vortices. These vortices are an indication of intense forced convective activity which Carrier et al. [6] suggest as being the dominant mechanism for preheating of unburned fuel. In other words, the effects of turbulence to heat transport are significant. Figure 8b shows a PIV image for case 2, which shows no presence of vortices. From a detailed analysis of the PIV data it was observed that no significant vortices developed in any of the low fuel loading experiments. This indicates the smaller role of convection, or in other words, the turbulent flow contributes less significantly to fire propagation. From analysis of the PIV data we see that another reason that convective preheating plays a greater role in preheating of the unburned fuel elements in case 1 and not is case 2 is the critical velocity ratio required for the formation of vortices [21]. The higher upward buoyant velocity of the gaseous products of combustion in case 1 induced the vortices that are detected through the PIV analysis. Kuwana et al. [21] state that there is a critical velocity ratio ( )bc UU above which vortices are not formed. If the slower upward buoyant velocity of the gaseous products of combustion in case 2 result in a velocity ratios 1 3bU U > then vortices will not form. The absence of vortices reduces the possibility that the incoming air, which is heated as it approaches the fire front, will be re-circulated upon reaching the fire front and ambient air boundary. Without the vortices in case 2, convective heat transfer mechanism does not play a significant role in preheating the fuel elements downstream of the fire front. Absence of strong convection, in case 2, suggests that radiation plays a significant role in preheating the fuel downstream of the fire front. Radiative and convective preheating is present in both cases, but it is in case 1 that convective preheating begins to play a more significant role in preheating unburned fuel elements downstream of the fire front than in case 2. It is not a complete change of the heat transfer mechanism from radiative to convective preheating; but instead it is the degree to which the convective heat transfer mechanism is involved in preheating of unburned fuel. The larger fire intensity present in case 1 leads to the increased role of convective preheating.
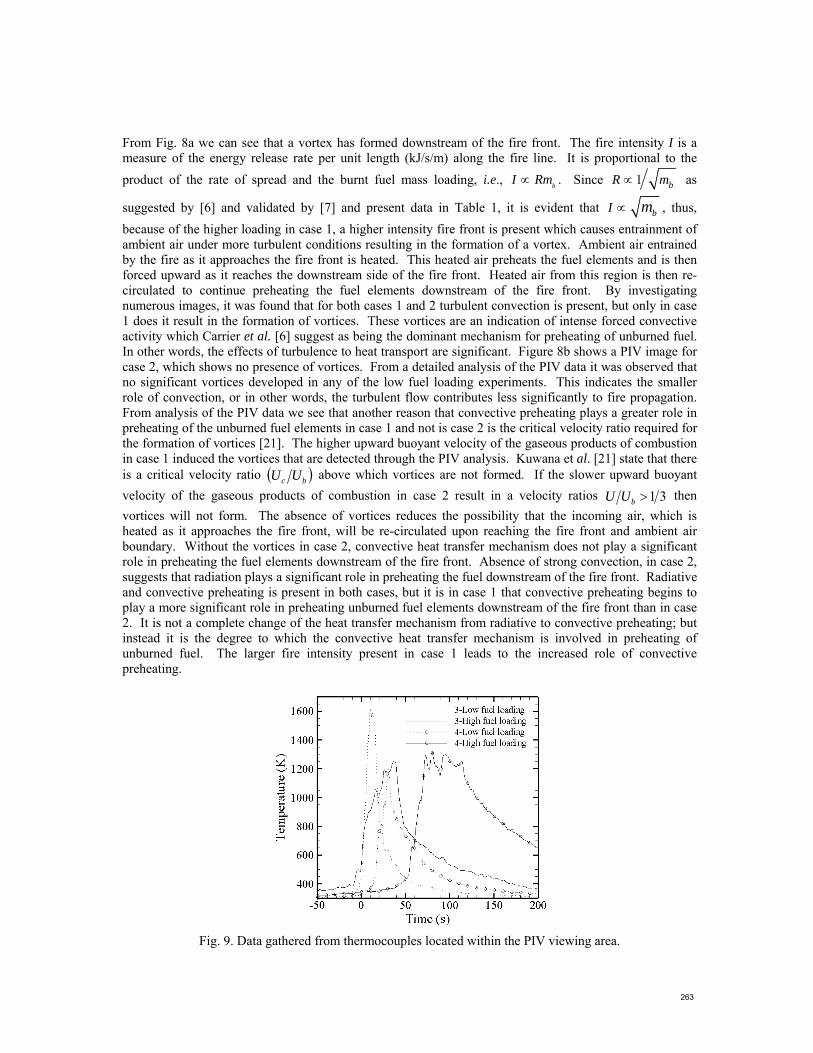
Fig. 9. Data gathered from thermocouples located within the PIV viewing area.
263
The preheating in Fig. 8 is evident from the temperature plot shown in Fig. 9. It is assumed that the fire front reaches thermocouple 3 at time t = 0. Thermocouple 4 shows that the fuel elements in that region are preheated for a longer period of time for case 1 (high fuel loading) than for case 2 (low fuel loading). During the period before the fire front reached thermocouple 4 (at time t = 0 s) the temperature is approximately 32 K less than that of the thermocouple reading during case 1. The same trend is evident from observation of the thermocouple 3 temperature data. A comparison between both cases (at time t = 0 s) shows that for case 2, the temperature before fire front arrival is approximately 50 K less than that of case 1. Figure 9 also shows a difference of approximately 32 K between the slopes of thermocouple 4 at case 1 and case 2. Due to the turbulent convection in case 1, the fuel elements are at a higher temperature when the fire front arrives. Without the strong convective mechanism the fuel elements downstream of the fire front depend on the proximity of the fire front to provide the required hot convective air to preheat the fuel elements. This results in a shorter preheating period followed by a sharp increase in temperature when the fire front arrives at location where thermocouple 4 is located. Since these are small scale laboratory experiments the temperature difference due to the turbulent convection is low, but for larger scale fires this effect is expected to be even more pronounced leading to the greater preheating temperature difference downstream of the fire front.
SUMMARY AND CONCLUSION
Utilizing a particle image velocimetry (PIV) and thermocouple system, fluid dynamic structure and temperature data were gathered that assisted in the investigation of wind-aided fire spread across an array of small diameter discrete fuel elements in a low speed wind tunnel operating at a wind speed of 0.6 m/s. The fuel samples used were bamboo skewers with diameter, length, and dry mass per unit length of 3.0 mm, 5.0 cm, and 0.062 g/cm, respectively. The unique aspect of this work is that the fuel bed, fire spread, fire dynamics, and imposed wind are all precisely controlled and highly repeatable. From the data acquired, it was determined that experiments conducted at a higher fuel loading of 3.12 kg/m2 (based on total dry fuel mass per unit fuel bed area), resulted in a lower rate of spread (0.26 cm/s), higher intensity fire front, and development of strong vortices was present. For this high fuel loading, the vortices captured through the use of the PIV system indicated the presence of turbulent convection that preheated the fuel elements further ahead of the fire front. This preheating was observed in the thermocouple data. When the fuel loading was reduced by a factor 4 to 0.78 kg/m2, the recorded temperatures before the fire front reached the thermocouples were lower. The difference in temperatures is attributed to the non-existence of significant turbulent convection in the low fuel loading case. Through the use of the PIV system we were able to capture images of wind-aided firespread, which resulted in the computation of the velocity vector fields upstream and downstream of the spreading fire and within the fire front. To our knowledge, this is the first instance in which planar velocity field measurements have been made in the vicinity of a spreading fire. The average rate of spread is inversely proportional to the square root of the burnt fuel mass load, consistent with theoretical predictions in the literature. The reduction in the rate of spread as the initially rectilinear fire front propagates through the fuel bed is also consistent with predictions reported in the literature. Although results are promising, further work is required to better understand the unsteady flow effects on fire spread. A detailed investigation of the fire dynamics was limited by the relatively low PIV image capture rate of 5 Hz. Sampling at higher rates is important especially at higher wind velocities, which have not yet been investigated. Modification of the fuel loading for each experimental case was achieved by varying the space between individual fuel elements, which will inevitably influence the drag forces of the flow within the fuel bed. However, the influence of fuel element spacing on the flow within the fuel bed was not investigated. Most likely, the amount of oxygen provided to the flame zone will be affected. The larger quantity of fuel will hinder the flow of oxygen into the flame zone, thus combustion within the flame zone will be affected. Performing a scaling analysis would be useful to determine if the results attained from the NGST experiments can be utilized to predict fire spread in a large-scale forest fire [22, 23].
REFERENCES
[1] Andrews, P.L., BEHAVE: Fire Behavior prediction system - BURN subsystem, Part 1. 1986, USDA Forest Service, Intermountain Research Station: Ogden, Utah, USA.
264
[2] Finney, M.A., FARSITE users guide and technical documentation. 1998: USDA For. Serv. Res. Pap. RMRS-RP-4.
[3] Byram, G.M., Atmospheric conditions related to blowup fires. 1954, United States Department of Agriculture Forest Service Station Paper 35, 31 pp.
[4] Clark, T., et al., (1996). A coupled atmospheric-fire model: convective feedback on fire line dynamics, Journal of Applied Meteorology, 3: 875-901, doi:10.1175/1520-0450(1996)035<0875:ACAMCF>2.0.CO;2
[5] Rothermel, R.C., A mathematical model for predicting fire spread in wildland fuels. 1972: USDA Forest Service, Intermountain Research Station, Research Paper, INT-115, Ogden, Utah, USA.
[6] Carrier, G.F., F.E. Fendell, and M.F. Wolff, (1991). Wind-Aided Firespread across Arrays of Discrete Fuel Elements. I. Theory, Combustion Science and Technology, 75: 31-51, doi:10.1080/00102209108924077
[7] Wolff, M.F., G.F. Carrier, and F.E. Fendell, (1991). Wind-Aided Firespread Across Arrays of Discrete Fuel Elements. II. Experiment, Combustion Science and Technology, 77: 261-289, doi:10.1080/00102209108951731
[8] Fons, W.L., (1946). Analysis of fire spread in light forest fuels, Journal of Agricultural Research, 72: 93-121.
[9] Steward, F.R., Fire spread through various types of fuel beds. 1974, Fire Science Centre, University of New Brunswick: Fredericton, Canada.
[10] Nelson, R.J. and C.W. Adkins, (1988). A dimensionless correlation for the spread of wind-driven fires, Canadian J. Forest Res., 16: 391-397.
[11] Viegas, D.X., (2004). On the existence of a steady state regime for slope and wind driven fires, International Journal of Wildland Fire, 13: 101-117, doi:10.1071/WF03008
[12] Zhou, X., et al., (2003). Thermal Particle Image Velocity Estimation of Fire Plume Flow, Combustion Science and Technology, 175: 1293-1316, doi:10.1080/00102200302376
[13] Clark, T., et al., (1999). Analysis of small-scale convective dynamics of a crown fire using infrared video camera imagery, Journal of Applied Meteorology, 38: 1401-1420, doi:10.1175/1520-0450(1999)038<1401:AOSSCD>2.0.CO;2
[14] Cox, G. and R. Chitty, (1985). Some source-dependent effects of unbounded fires, Combustion and Flame, 60: 219, doi:10.1016/0010-2180(85)90027-6
[15] Reuss, D.L., R.J. Adrian, and C.C. Landreth, (1989). Two-dimensional velocity Measurement in a Laminar Flame Using Particle Image Velocimetry, Combustion Science and Technology, 67: 73-77, doi:10.1080/00102208908924062
[16] Driscoll, J.F., et al., (1993). The strain Exerted by a Vortex on a Flame Determined from Velocity Field Images, AIAA-93-0362 ed. 1993.
[17] Adrian, R.J., Review of Particle Image Velocimetry Research in The Symposium on Optical Methods in Flow and Particle Diagnostics, 6th International-Congress on Applications of Lasers and Electro-Optics. 1988, Optics and Lasers in Engineering 9(3-4): 317-319: San-Diego, California, USA.
[18] Melling, A., (1997). Tracer Particles and Seeding for Particle Image Velocimetry, Measurement Science and Technology 8: 1406-1416. doi:10.1088/0957-0233/8/12/005
[19] Glass, M. and I.M. Kennedy, (1977). An Improved Seeding Method for High Temperature Laser Doppler Velocimetry, Combustion and Flame 29: 333-335, doi:10.1016/0010-2180(77)90124-9
[20] Zhou, X., D. Weise, and S. Mahalingam. "Experimental measurements and numerical modeling of marginal burning in live chaparral shrub fuel beds," Proceeding of Combustion Institute, 2005, 30: pp. 2287-2294, doi:10.1016/j.proci.2004.08.022
265

[21] Kuwana K., Sekimoto K., Saito K. (2007). Can We Predict the Occurrence of Extreme Fire Whirls? AIAA Journal, Vol. 45, No. 1, doi:: 10.2514/1.28533
[22] Baum H. 2002. Modeling and Scaling Laws for Large Fires, 8th AIAA/ASME Joint Thermophysics and Heat Transfer Conference.
[23] Johnson E., Miyanishi K, “Flames,” Forest Fires: Behavior and Ecological Effects, Academic Press, San Diego, CA, 2001, p. 11-54. doi:10.1016/B978-012386660-8/50004-0
266