Embed Size (px)
Citation preview
466
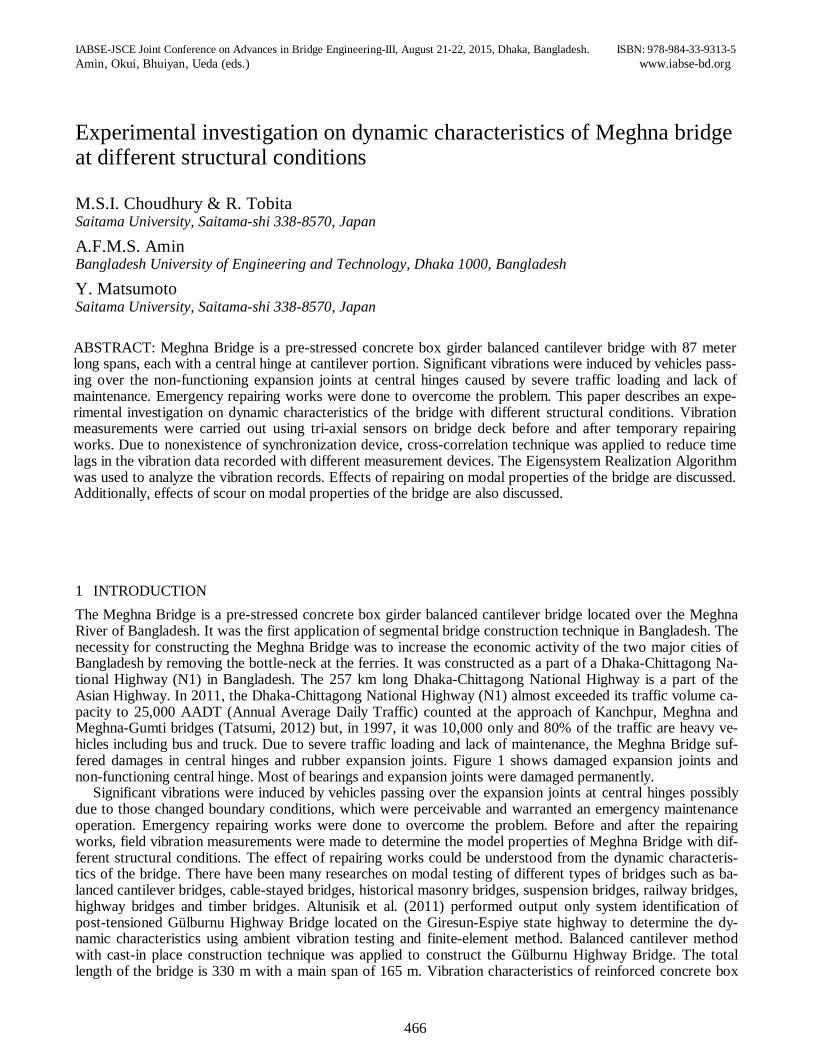
1 INTRODUCTION The Meghna Bridge is a pre-stressed concrete box girder balanced cantilever bridge located over the Meghna River of Bangladesh. It was the first application of segmental bridge construction technique in Bangladesh. The necessity for constructing the Meghna Bridge was to increase the economic activity of the two major cities of Bangladesh by removing the bottle-neck at the ferries. It was constructed as a part of a Dhaka-Chittagong Na-tional Highway (N1) in Bangladesh. The 257 km long Dhaka-Chittagong National Highway is a part of the Asian Highway. In 2011, the Dhaka-Chittagong National Highway (N1) almost exceeded its traffic volume ca-pacity to 25,000 AADT (Annual Average Daily Traffic) counted at the approach of Kanchpur, Meghna and Meghna-Gumti bridges (Tatsumi, 2012) but, in 1997, it was 10,000 only and 80% of the traffic are heavy ve-hicles including bus and truck. Due to severe traffic loading and lack of maintenance, the Meghna Bridge suf-fered damages in central hinges and rubber expansion joints. Figure 1 shows damaged expansion joints and non-functioning central hinge. Most of bearings and expansion joints were damaged permanently.
Significant vibrations were induced by vehicles passing over the expansion joints at central hinges possibly due to those changed boundary conditions, which were perceivable and warranted an emergency maintenance operation. Emergency repairing works were done to overcome the problem. Before and after the repairing works, field vibration measurements were made to determine the model properties of Meghna Bridge with dif-ferent structural conditions. The effect of repairing works could be understood from the dynamic characteris-tics of the bridge. There have been many researches on modal testing of different types of bridges such as ba-lanced cantilever bridges, cable-stayed bridges, historical masonry bridges, suspension bridges, railway bridges, highway bridges and timber bridges. Altunisik et al. (2011) performed output only system identification of post-tensioned Gülburnu Highway Bridge located on the Giresun-Espiye state highway to determine the dy-namic characteristics using ambient vibration testing and finite-element method. Balanced cantilever method with cast-in place construction technique was applied to construct the Gülburnu Highway Bridge. The total length of the bridge is 330 m with a main span of 165 m. Vibration characteristics of reinforced concrete box
IABSE-JSCE Joint Conference on Advances in Bridge Engineering-III, August 21-22, 2015, Dhaka, Bangladesh. ISBN: 978-984-33-9313-5 Amin, Okui, Bhuiyan, Ueda (eds.) www.iabse-bd.org
Experimental investigation on dynamic characteristics of Meghna bridge at different structural conditions
M.S.I. Choudhury & R. Tobita Saitama University, Saitama-shi 338-8570, Japan
A.F.M.S. Amin Bangladesh University of Engineering and Technology, Dhaka 1000, Bangladesh
Y. Matsumoto Saitama University, Saitama-shi 338-8570, Japan
ABSTRACT: Meghna Bridge is a pre-stressed concrete box girder balanced cantilever bridge with 87 meter long spans, each with a central hinge at cantilever portion. Significant vibrations were induced by vehicles pass-ing over the non-functioning expansion joints at central hinges caused by severe traffic loading and lack of maintenance. Emergency repairing works were done to overcome the problem. This paper describes an expe-rimental investigation on dynamic characteristics of the bridge with different structural conditions. Vibration measurements were carried out using tri-axial sensors on bridge deck before and after temporary repairing works. Due to nonexistence of synchronization device, cross-correlation technique was applied to reduce time lags in the vibration data recorded with different measurement devices. The Eigensystem Realization Algorithm was used to analyze the vibration records. Effects of repairing on modal properties of the bridge are discussed. Additionally, effects of scour on modal properties of the bridge are also discussed.
467
girder balanced cantilever Kömürhan Highway Bridge located over Firat River in Turkey was determined through ambient vibration testing by Bayraktar et al. (2009).
Additionally, for the Meghna Bridge, scouring in the river bed took place during floods. Scour is one of the most problematic issues for bridges over rivers in Bangladesh and elsewhere. Wardhana and Hadipriono (2003) concluded that hydraulic loading including scour is responsible for about 50% of the bridge failure over the pe-riod of 1989-2000 in the US. Elsaid and Seracino (2013) proposed scour detection technique based on dynam-ic features of the bridge superstructure without underwater instrumentation. “Horizontally-displaced mode shapes” were selected for the assessment of scour from finite element models of an “idealized bridge” with dif-ferent scour levels, based on significant changes in their modal properties due to scour. Experimental investiga-tions were carried out in the laboratory to assess the applicability of the proposed scour detection technique us-ing mode shape curvature, flexibility based deflections and flexibility based curvature of horizontally displaced mode shapes. Chen et al. (2014) developed a foundation scour evaluation method based on ambient vibration measurements taken from the superstructure of a Kao-Ping-His cable-stayed bridge.
The objective of this study was to investigate the dynamic characteristics of Meghna Bridge with different structural conditions. Field vibration measurements were conducted and the dynamic characteristics of the bridge were extracted using Eigensystem Realization Algorithm (ERA) (Juang and Pappa 1985), one of the most popular stochastic system identification approach. Effects of repairing on modal properties of the bridge have been discussed based on the measurements made before and after temporary repairing works. Effects of scour on modal properties of the bridge have been discussed also.
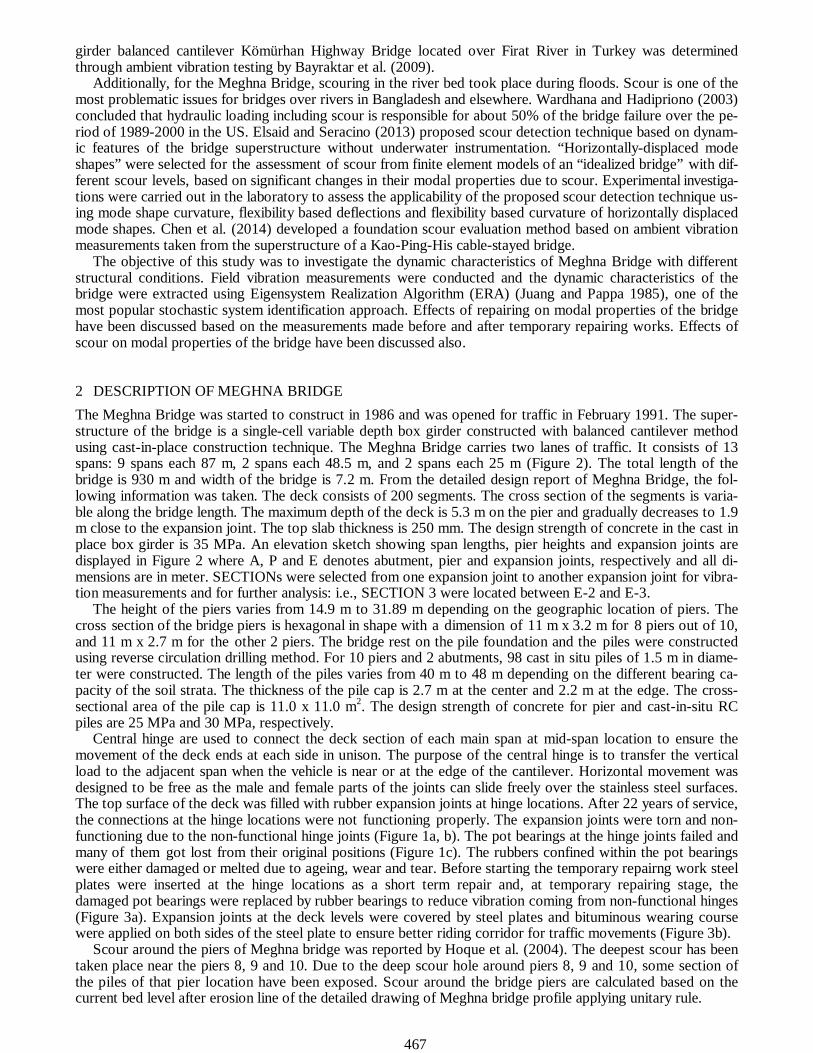
2 DESCRIPTION OF MEGHNA BRIDGE The Meghna Bridge was started to construct in 1986 and was opened for traffic in February 1991. The super-structure of the bridge is a single-cell variable depth box girder constructed with balanced cantilever method using cast-in-place construction technique. The Meghna Bridge carries two lanes of traffic. It consists of 13 spans: 9 spans each 87 m, 2 spans each 48.5 m, and 2 spans each 25 m (Figure 2). The total length of the bridge is 930 m and width of the bridge is 7.2 m. From the detailed design report of Meghna Bridge, the fol-lowing information was taken. The deck consists of 200 segments. The cross section of the segments is varia-ble along the bridge length. The maximum depth of the deck is 5.3 m on the pier and gradually decreases to 1.9 m close to the expansion joint. The top slab thickness is 250 mm. The design strength of concrete in the cast in place box girder is 35 MPa. An elevation sketch showing span lengths, pier heights and expansion joints are displayed in Figure 2 where A, P and E denotes abutment, pier and expansion joints, respectively and all di-mensions are in meter. SECTIONs were selected from one expansion joint to another expansion joint for vibra-tion measurements and for further analysis: i.e., SECTION 3 were located between E-2 and E-3.
The height of the piers varies from 14.9 m to 31.89 m depending on the geographic location of piers. The cross section of the bridge piers is hexagonal in shape with a dimension of 11 m x 3.2 m for 8 piers out of 10, and 11 m x 2.7 m for the other 2 piers. The bridge rest on the pile foundation and the piles were constructed using reverse circulation drilling method. For 10 piers and 2 abutments, 98 cast in situ piles of 1.5 m in diame-ter were constructed. The length of the piles varies from 40 m to 48 m depending on the different bearing ca-pacity of the soil strata. The thickness of the pile cap is 2.7 m at the center and 2.2 m at the edge. The cross-sectional area of the pile cap is 11.0 x 11.0 m2. The design strength of concrete for pier and cast-in-situ RC piles are 25 MPa and 30 MPa, respectively.
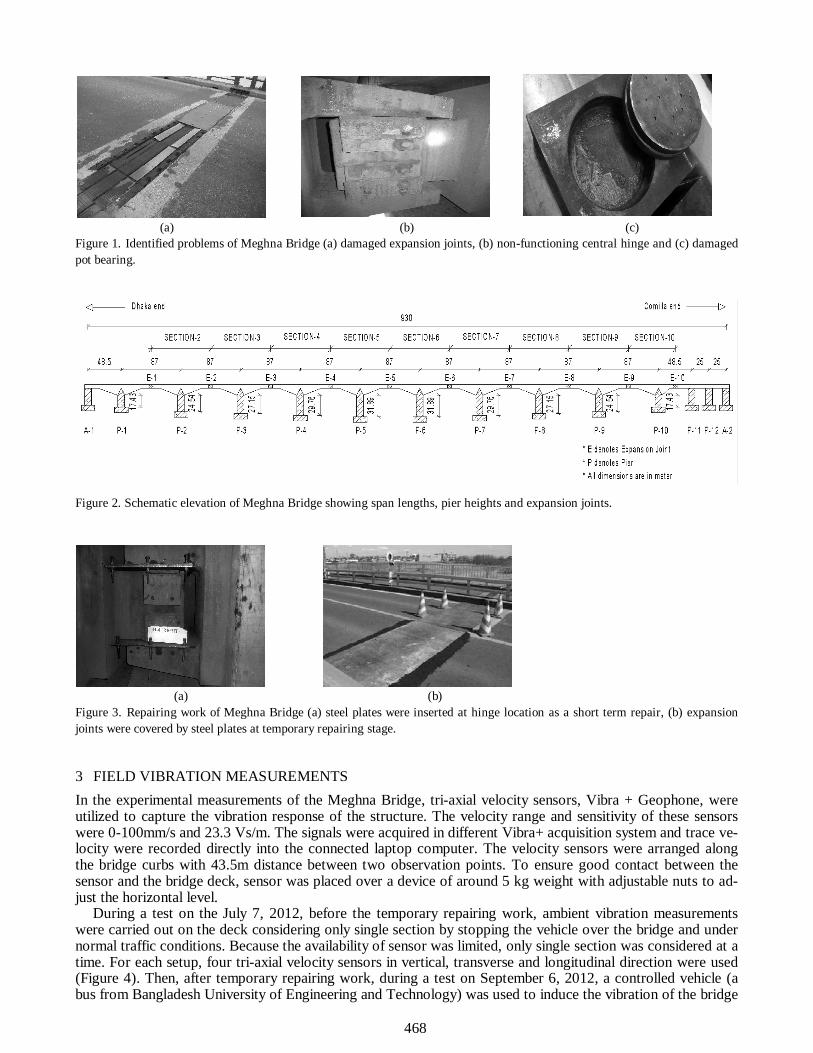
Central hinge are used to connect the deck section of each main span at mid-span location to ensure the movement of the deck ends at each side in unison. The purpose of the central hinge is to transfer the vertical load to the adjacent span when the vehicle is near or at the edge of the cantilever. Horizontal movement was designed to be free as the male and female parts of the joints can slide freely over the stainless steel surfaces. The top surface of the deck was filled with rubber expansion joints at hinge locations. After 22 years of service, the connections at the hinge locations were not functioning properly. The expansion joints were torn and non-functioning due to the non-functional hinge joints (Figure 1a, b). The pot bearings at the hinge joints failed and many of them got lost from their original positions (Figure 1c). The rubbers confined within the pot bearings were either damaged or melted due to ageing, wear and tear. Before starting the temporary repairng work steel plates were inserted at the hinge locations as a short term repair and, at temporary repairing stage, the damaged pot bearings were replaced by rubber bearings to reduce vibration coming from non-functional hinges (Figure 3a). Expansion joints at the deck levels were covered by steel plates and bituminous wearing course were applied on both sides of the steel plate to ensure better riding corridor for traffic movements (Figure 3b).
Scour around the piers of Meghna bridge was reported by Hoque et al. (2004). The deepest scour has been taken place near the piers 8, 9 and 10. Due to the deep scour hole around piers 8, 9 and 10, some section of the piles of that pier location have been exposed. Scour around the bridge piers are calculated based on the current bed level after erosion line of the detailed drawing of Meghna bridge profile applying unitary rule.
468
(a) (b) (c) Figure 1. Identified problems of Meghna Bridge (a) damaged expansion joints, (b) non-functioning central hinge and (c) damaged pot bearing.
Figure 2. Schematic elevation of Meghna Bridge showing span lengths, pier heights and expansion joints.
(a) (b) Figure 3. Repairing work of Meghna Bridge (a) steel plates were inserted at hinge location as a short term repair, (b) expansion joints were covered by steel plates at temporary repairing stage.
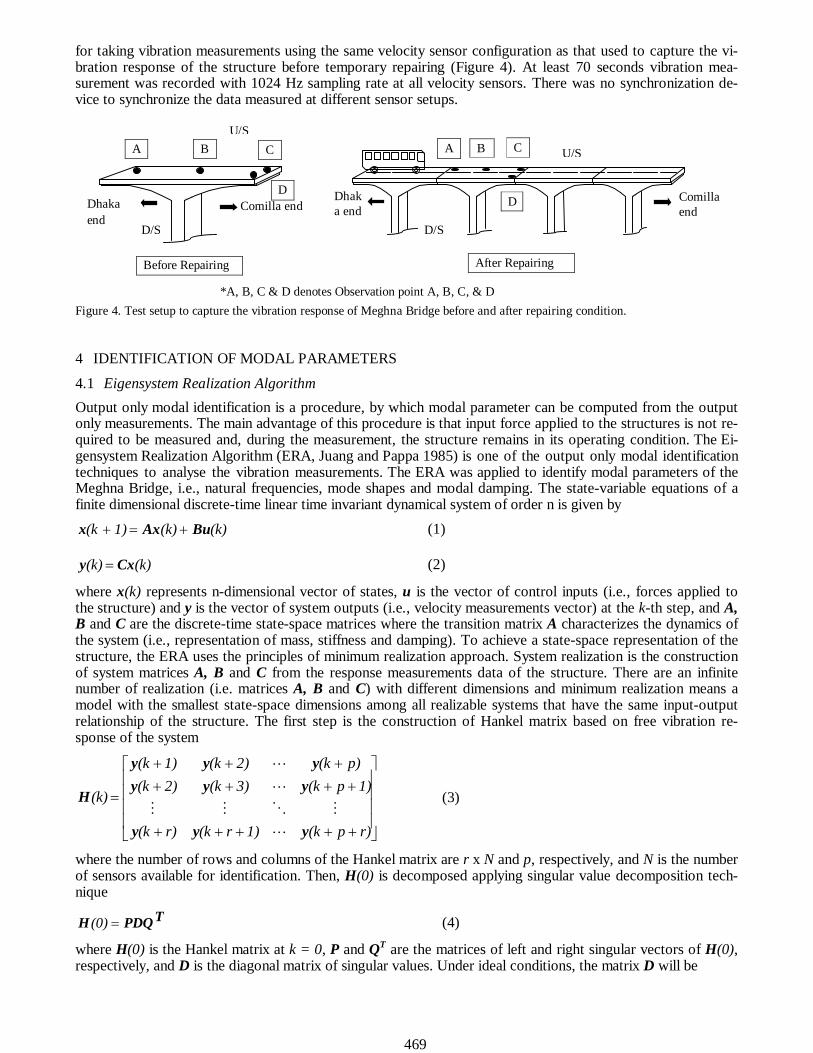
3 FIELD VIBRATION MEASUREMENTS In the experimental measurements of the Meghna Bridge, tri-axial velocity sensors, Vibra + Geophone, were utilized to capture the vibration response of the structure. The velocity range and sensitivity of these sensors were 0-100mm/s and 23.3 Vs/m. The signals were acquired in different Vibra+ acquisition system and trace ve-locity were recorded directly into the connected laptop computer. The velocity sensors were arranged along the bridge curbs with 43.5m distance between two observation points. To ensure good contact between the sensor and the bridge deck, sensor was placed over a device of around 5 kg weight with adjustable nuts to ad-just the horizontal level.
During a test on the July 7, 2012, before the temporary repairing work, ambient vibration measurements were carried out on the deck considering only single section by stopping the vehicle over the bridge and under normal traffic conditions. Because the availability of sensor was limited, only single section was considered at a time. For each setup, four tri-axial velocity sensors in vertical, transverse and longitudinal direction were used (Figure 4). Then, after temporary repairing work, during a test on September 6, 2012, a controlled vehicle (a bus from Bangladesh University of Engineering and Technology) was used to induce the vibration of the bridge
469
for taking vibration measurements using the same velocity sensor configuration as that used to capture the vi-bration response of the structure before temporary repairing (Figure 4). At least 70 seconds vibration mea-surement was recorded with 1024 Hz sampling rate at all velocity sensors. There was no synchronization de-vice to synchronize the data measured at different sensor setups.
Figure 4. Test setup to capture the vibration response of Meghna Bridge before and after repairing condition.
4 IDENTIFICATION OF MODAL PARAMETERS
4.1 Eigensystem Realization Algorithm Output only modal identification is a procedure, by which modal parameter can be computed from the output only measurements. The main advantage of this procedure is that input force applied to the structures is not re-quired to be measured and, during the measurement, the structure remains in its operating condition. The Ei-gensystem Realization Algorithm (ERA, Juang and Pappa 1985) is one of the output only modal identification techniques to analyse the vibration measurements. The ERA was applied to identify modal parameters of the Meghna Bridge, i.e., natural frequencies, mode shapes and modal damping. The state-variable equations of a finite dimensional discrete-time linear time invariant dynamical system of order n is given by
(k)(k)1)(k BuAxx (1)
(k)(k) Cxy (2)
where x(k) represents n-dimensional vector of states, u is the vector of control inputs (i.e., forces applied to the structure) and y is the vector of system outputs (i.e., velocity measurements vector) at the k-th step, and A, B and C are the discrete-time state-space matrices where the transition matrix A characterizes the dynamics of the system (i.e., representation of mass, stiffness and damping). To achieve a state-space representation of the structure, the ERA uses the principles of minimum realization approach. System realization is the construction of system matrices A, B and C from the response measurements data of the structure. There are an infinite number of realization (i.e. matrices A, B and C) with different dimensions and minimum realization means a model with the smallest state-space dimensions among all realizable systems that have the same input-output relationship of the structure. The first step is the construction of Hankel matrix based on free vibration re-sponse of the system
r)p(k1)r(kr)(k
1)p(k3)(k2)(kp)(k2)(k1)(k
(k)
yyy
yyyyyy
H
(3)
where the number of rows and columns of the Hankel matrix are r x N and p, respectively, and N is the number of sensors available for identification. Then, H(0) is decomposed applying singular value decomposition tech-nique
TPDQH (0) (4)
where H(0) is the Hankel matrix at k = 0, P and QT are the matrices of left and right singular vectors of H(0), respectively, and D is the diagonal matrix of singular values. Under ideal conditions, the matrix D will be
Before Repairing After Repairing
*A, B, C & D denotes Observation point A, B, C, & D
U/S
D/S
Comilla end Dhaka end
B A C
D
B C
D
D/S
U/S
Dhaka end
Comilla end
A
470
00
0gDD (5)
where Dg is a g by g matrix and g is the system order or number of poles. A minimum order system that represents the structure is obtained by eliminating smaller singular values along the diagonal of D correspond to nonphysical or noise modes. The state-space matrices for the discrete-time structural model are found using
1/2(1)1/2 QDHTPDA (6)
mETQDB 1/2 (7)
1/2PDTpEC (8)
where Ep = [Ip, 0p,…,0p] and Em = [Im, 0m,…,0m] with I being an identity matrix and 0 as a null square ma-trix. Eigenvalues z and eigenvectors can be obtained from the following equation
Ζ]ψQDHTP[Dψ 1/2(k)1/21 (9)
The eigenvalues of A are complex conjugates and are called the poles of the system. Each complex conjugate pair corresponds to one vibration mode and can be used to determine the natural frequency and the damping ratio of structural vibration modes. The eigenvalues in the z-plane in Eq. 9 are transformed to the s-plane to obtain natural frequencies from the following relationships:
Fszsz )log( (10)
')(szdiags (11)
22 imaginaryrealna (12)
nan real / (13)
piimaginaryrealn 2/22 (14)
where Fs is sampling rate, ξn stands for damping ratio and ᅟn stands for natural frequency of the n-th vibration mode of the structure. Mode shapes can be obtained through the matrix Ep
TPD1/2 and the initial modal ampli-tudes can be calculated through the matrix 1-D½QTEm . The ERA was implemented in MATLAB in this study.
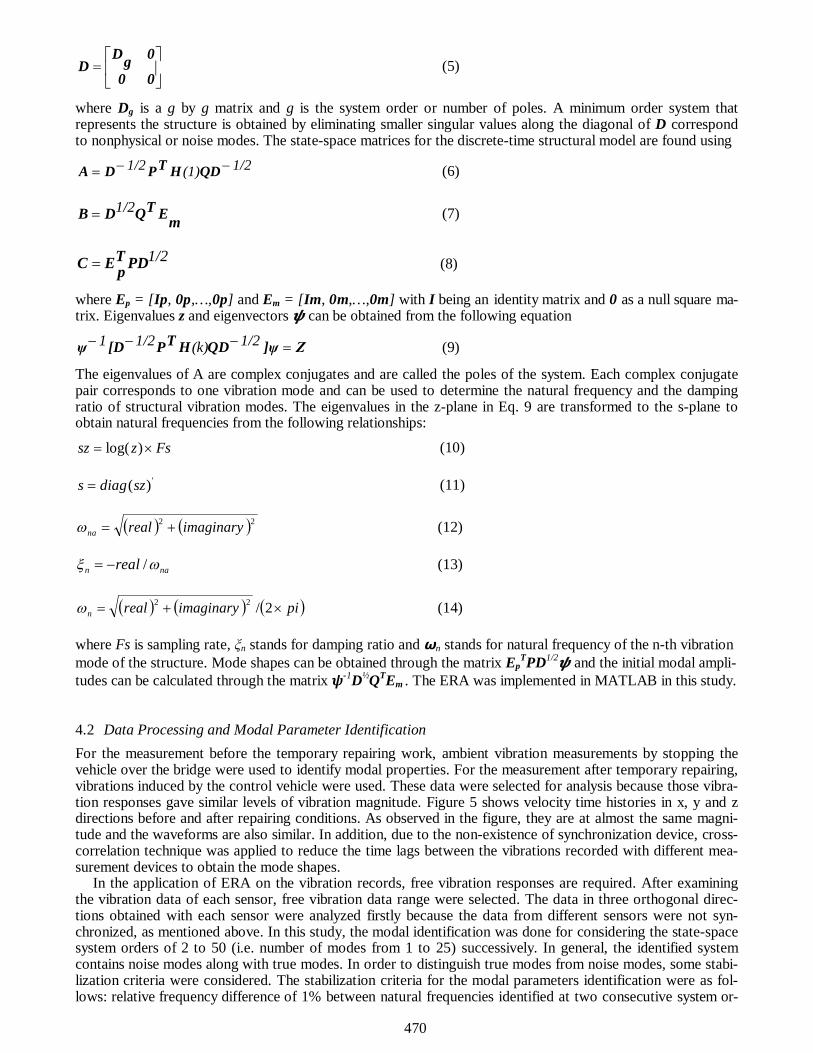
4.2 Data Processing and Modal Parameter Identification For the measurement before the temporary repairing work, ambient vibration measurements by stopping the vehicle over the bridge were used to identify modal properties. For the measurement after temporary repairing, vibrations induced by the control vehicle were used. These data were selected for analysis because those vibra-tion responses gave similar levels of vibration magnitude. Figure 5 shows velocity time histories in x, y and z directions before and after repairing conditions. As observed in the figure, they are at almost the same magni-tude and the waveforms are also similar. In addition, due to the non-existence of synchronization device, cross-correlation technique was applied to reduce the time lags between the vibrations recorded with different mea-surement devices to obtain the mode shapes.
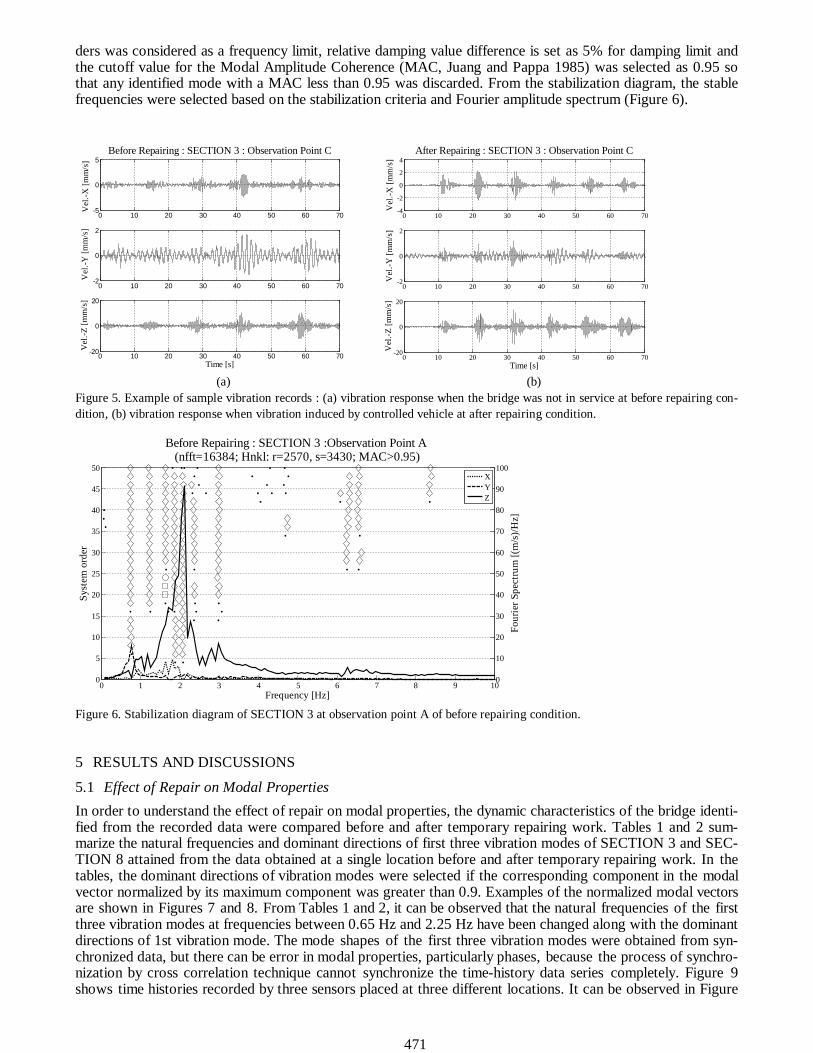
In the application of ERA on the vibration records, free vibration responses are required. After examining the vibration data of each sensor, free vibration data range were selected. The data in three orthogonal direc-tions obtained with each sensor were analyzed firstly because the data from different sensors were not syn-chronized, as mentioned above. In this study, the modal identification was done for considering the state-space system orders of 2 to 50 (i.e. number of modes from 1 to 25) successively. In general, the identified system contains noise modes along with true modes. In order to distinguish true modes from noise modes, some stabi-lization criteria were considered. The stabilization criteria for the modal parameters identification were as fol-lows: relative frequency difference of 1% between natural frequencies identified at two consecutive system or-
471
ders was considered as a frequency limit, relative damping value difference is set as 5% for damping limit and the cutoff value for the Modal Amplitude Coherence (MAC, Juang and Pappa 1985) was selected as 0.95 so that any identified mode with a MAC less than 0.95 was discarded. From the stabilization diagram, the stable frequencies were selected based on the stabilization criteria and Fourier amplitude spectrum (Figure 6).
(a) (b) Figure 5. Example of sample vibration records : (a) vibration response when the bridge was not in service at before repairing con-dition, (b) vibration response when vibration induced by controlled vehicle at after repairing condition.
Figure 6. Stabilization diagram of SECTION 3 at observation point A of before repairing condition.
5 RESULTS AND DISCUSSIONS
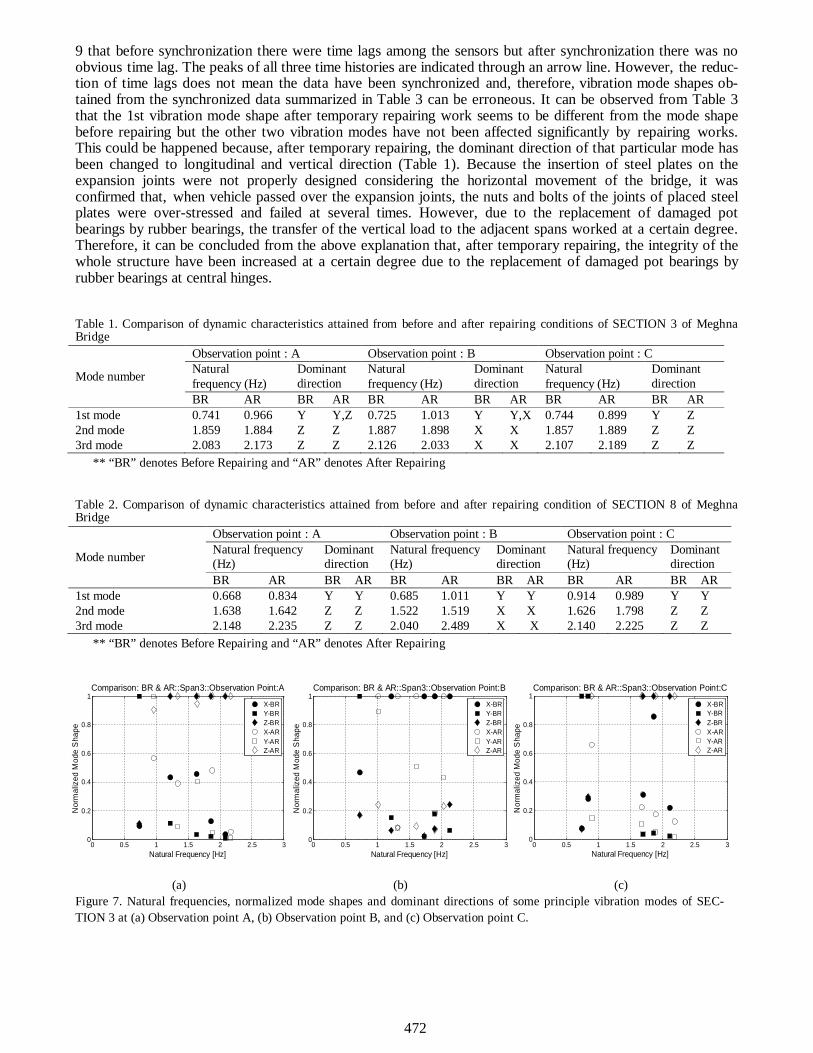
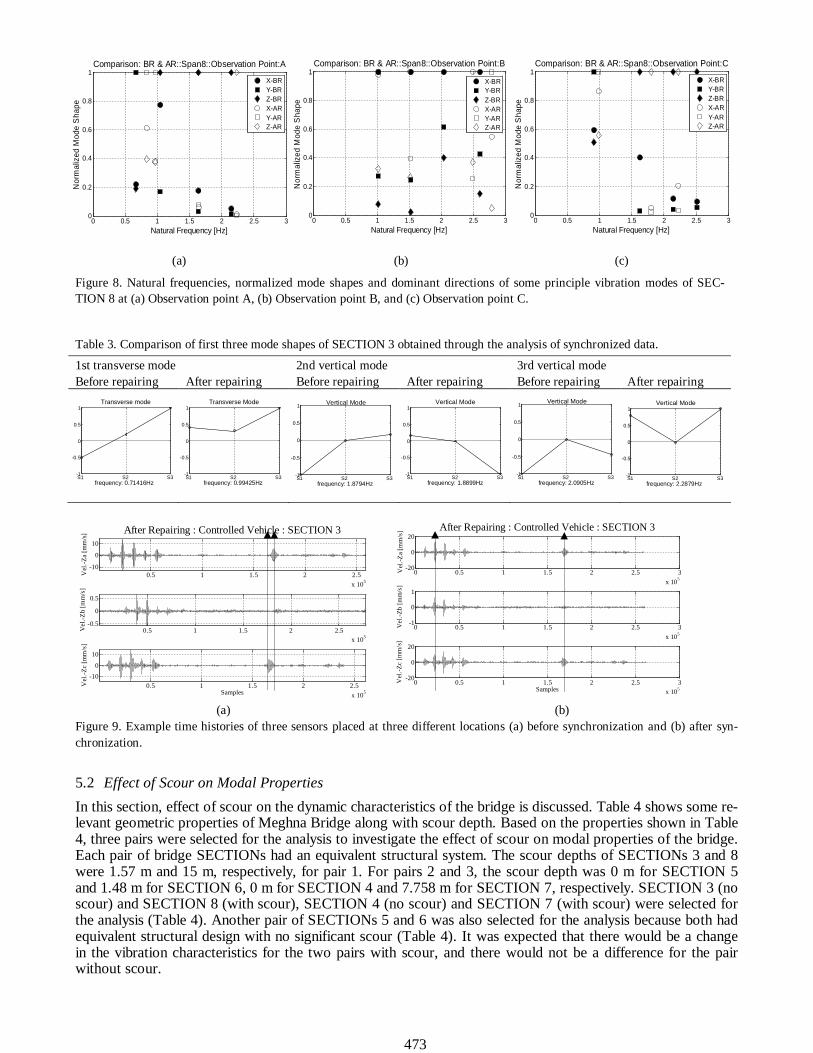
5.1 Effect of Repair on Modal Properties In order to understand the effect of repair on modal properties, the dynamic characteristics of the bridge identi-fied from the recorded data were compared before and after temporary repairing work. Tables 1 and 2 sum-marize the natural frequencies and dominant directions of first three vibration modes of SECTION 3 and SEC-TION 8 attained from the data obtained at a single location before and after temporary repairing work. In the tables, the dominant directions of vibration modes were selected if the corresponding component in the modal vector normalized by its maximum component was greater than 0.9. Examples of the normalized modal vectors are shown in Figures 7 and 8. From Tables 1 and 2, it can be observed that the natural frequencies of the first three vibration modes at frequencies between 0.65 Hz and 2.25 Hz have been changed along with the dominant directions of 1st vibration mode. The mode shapes of the first three vibration modes were obtained from syn-chronized data, but there can be error in modal properties, particularly phases, because the process of synchro-nization by cross correlation technique cannot synchronize the time-history data series completely. Figure 9 shows time histories recorded by three sensors placed at three different locations. It can be observed in Figure
0 10 20 30 40 50 60 70-5
0
5
Vel
.-X [m
m/s
]
Before Repairing : SECTION 3 : Observation Point C
0 10 20 30 40 50 60 70-2
0
2
Vel
.-Y [m
m/s
]
0 10 20 30 40 50 60 70-20
0
20
Vel
.-Z [m
m/s
]
Time [s]
0 10 20 30 40 50 60 70-4
-2
0
2
4
Vel
.-X [m
m/s
]
After Repairing : SECTION 3 : Observation Point C
0 10 20 30 40 50 60 70-2
0
2
Vel
.-Y [m
m/s
]
0 10 20 30 40 50 60 70-20
0
20
Vel
.-Z [m
m/s
]
Time [s]
0
5
10
15
20
25
30
35
40
45
50
Syst
em o
rder
0 1 2 3 4 5 6 7 8 9 100
10
20
30
40
50
60
70
80
90
100
Frequency [Hz]
Four
ier S
pect
rum
[(m
/s)/H
z]
Before Repairing : SECTION 3 :Observation Point A (nfft=16384; Hnkl: r=2570, s=3430; MAC>0.95)
XYZ
472
9 that before synchronization there were time lags among the sensors but after synchronization there was no obvious time lag. The peaks of all three time histories are indicated through an arrow line. However, the reduc-tion of time lags does not mean the data have been synchronized and, therefore, vibration mode shapes ob-tained from the synchronized data summarized in Table 3 can be erroneous. It can be observed from Table 3 that the 1st vibration mode shape after temporary repairing work seems to be different from the mode shape before repairing but the other two vibration modes have not been affected significantly by repairing works. This could be happened because, after temporary repairing, the dominant direction of that particular mode has been changed to longitudinal and vertical direction (Table 1). Because the insertion of steel plates on the expansion joints were not properly designed considering the horizontal movement of the bridge, it was confirmed that, when vehicle passed over the expansion joints, the nuts and bolts of the joints of placed steel plates were over-stressed and failed at several times. However, due to the replacement of damaged pot bearings by rubber bearings, the transfer of the vertical load to the adjacent spans worked at a certain degree. Therefore, it can be concluded from the above explanation that, after temporary repairing, the integrity of the whole structure have been increased at a certain degree due to the replacement of damaged pot bearings by rubber bearings at central hinges.
Table 1. Comparison of dynamic characteristics attained from before and after repairing conditions of SECTION 3 of Meghna Bridge
Mode number
Observation point : A Observation point : B Observation point : C Natural frequency (Hz)
Dominant direction
Natural frequency (Hz)
Dominant direction
Natural frequency (Hz)
Dominant direction
BR AR BR AR BR AR BR AR BR AR BR AR 1st mode 0.741 0.966 Y Y,Z 0.725 1.013 Y Y,X 0.744 0.899 Y Z 2nd mode 1.859 1.884 Z Z 1.887 1.898 X X 1.857 1.889 Z Z 3rd mode 2.083 2.173 Z Z 2.126 2.033 X X 2.107 2.189 Z Z
** “BR” denotes Before Repairing and “AR” denotes After Repairing
Table 2. Comparison of dynamic characteristics attained from before and after repairing condition of SECTION 8 of Meghna Bridge
Mode number
Observation point : A Observation point : B Observation point : C Natural frequency (Hz)
Dominant direction
Natural frequency (Hz)
Dominant direction
Natural frequency (Hz)
Dominant direction
BR AR BR AR BR AR BR AR BR AR BR AR 1st mode 0.668 0.834 Y Y 0.685 1.011 Y Y 0.914 0.989 Y Y 2nd mode 1.638 1.642 Z Z 1.522 1.519 X X 1.626 1.798 Z Z 3rd mode 2.148 2.235 Z Z 2.040 2.489 X X 2.140 2.225 Z Z
** “BR” denotes Before Repairing and “AR” denotes After Repairing
(a) (b) (c)
Figure 7. Natural frequencies, normalized mode shapes and dominant directions of some principle vibration modes of SEC-TION 3 at (a) Observation point A, (b) Observation point B, and (c) Observation point C.
0 0.5 1 1.5 2 2.5 30
0.2
0.4
0.6
0.8
1
Natural Frequency [Hz]
Nor
mal
ized
Mod
e S
hape
Comparison: BR & AR::Span3::Observation Point:A
X-BRY-BRZ-BRX-ARY-ARZ-AR
0 0.5 1 1.5 2 2.5 30
0.2
0.4
0.6
0.8
1
Natural Frequency [Hz]
Nor
mal
ized
Mod
e S
hape
Comparison: BR & AR::Span3::Observation Point:B
X-BRY-BRZ-BRX-ARY-ARZ-AR
0 0.5 1 1.5 2 2.5 30
0.2
0.4
0.6
0.8
1
Natural Frequency [Hz]
Nor
mal
ized
Mod
e S
hape
Comparison: BR & AR::Span3::Observation Point:C
X-BRY-BRZ-BRX-ARY-ARZ-AR
473
S1 S2 S3 -1
-0.5
0
0.5
1
frequency: 0.71416Hz
Transverse mode
S1 S2 S3 -1
-0.5
0
0.5
1 Vertical Mode
frequency: 1.8794HzS1 S2 S3 -1
-0.5
0
0.5
1 Vertical Mode
frequency: 2.0905HzS1 S2 S3 -1
-0.5
0
0.5
1Transverse Mode
frequency: 0.99425Hz S1 S2 S3 -1
-0.5
0
0.5
1Vertical Mode
frequency: 1.8899HzS1 S2 S3 -1
-0.5
0
0.5
1Vertical Mode
frequency: 2.2879Hz
(a) (b) (c)
Figure 8. Natural frequencies, normalized mode shapes and dominant directions of some principle vibration modes of SEC-TION 8 at (a) Observation point A, (b) Observation point B, and (c) Observation point C.
Table 3. Comparison of first three mode shapes of SECTION 3 obtained through the analysis of synchronized data. 1st transverse mode 2nd vertical mode 3rd vertical mode Before repairing After repairing Before repairing After repairing Before repairing After repairing
(a) (b) Figure 9. Example time histories of three sensors placed at three different locations (a) before synchronization and (b) after syn-chronization.
5.2 Effect of Scour on Modal Properties In this section, effect of scour on the dynamic characteristics of the bridge is discussed. Table 4 shows some re-levant geometric properties of Meghna Bridge along with scour depth. Based on the properties shown in Table 4, three pairs were selected for the analysis to investigate the effect of scour on modal properties of the bridge. Each pair of bridge SECTIONs had an equivalent structural system. The scour depths of SECTIONs 3 and 8 were 1.57 m and 15 m, respectively, for pair 1. For pairs 2 and 3, the scour depth was 0 m for SECTION 5 and 1.48 m for SECTION 6, 0 m for SECTION 4 and 7.758 m for SECTION 7, respectively. SECTION 3 (no scour) and SECTION 8 (with scour), SECTION 4 (no scour) and SECTION 7 (with scour) were selected for the analysis (Table 4). Another pair of SECTIONs 5 and 6 was also selected for the analysis because both had equivalent structural design with no significant scour (Table 4). It was expected that there would be a change in the vibration characteristics for the two pairs with scour, and there would not be a difference for the pair without scour.
0.5 1 1.5 2 2.5x 10⁵
-10
0
10
Vel
.-Za
[mm
/s] After Repairing : Controlled Vehicle : SECTION 3
0.5 1 1.5 2 2.5x 10⁵
-0.5
0
0.5
Vel
.-Zb
[mm
/s]
0.5 1 1.5 2 2.5x 10⁵
-100
10
Vel
.-Zc
[mm
/s]
Samples
0 0.5 1 1.5 2 2.5 3x 10⁵
-20
0
20
Vel
.-Za
[mm
/s] After Repairing : Controlled Vehicle : SECTION 3
0 0.5 1 1.5 2 2.5 3x 10⁵
-1
0
1
Vel
.-Zb
[mm
/s]
0 0.5 1 1.5 2 2.5 3x 10⁵
-20
0
20
Vel
.-Zc
[mm
/s]
Samples
0 0.5 1 1.5 2 2.5 30
0.2
0.4
0.6
0.8
1
Natural Frequency [Hz]
Nor
mal
ized
Mod
e S
hape
Comparison: BR & AR::Span8::Observation Point:A
X-BRY-BRZ-BRX-ARY-ARZ-AR
0 0.5 1 1.5 2 2.5 30
0.2
0.4
0.6
0.8
1
Natural Frequency [Hz]
Nor
mal
ized
Mod
e S
hape
Comparison: BR & AR::Span8::Observation Point:B
X-BRY-BRZ-BRX-ARY-ARZ-AR
0 0.5 1 1.5 2 2.5 30
0.2
0.4
0.6
0.8
1
Natural Frequency [Hz]
Nor
mal
ized
Mod
e S
hape
Comparison: BR & AR::Span8::Observation Point:C
X-BRY-BRZ-BRX-ARY-ARZ-AR
474
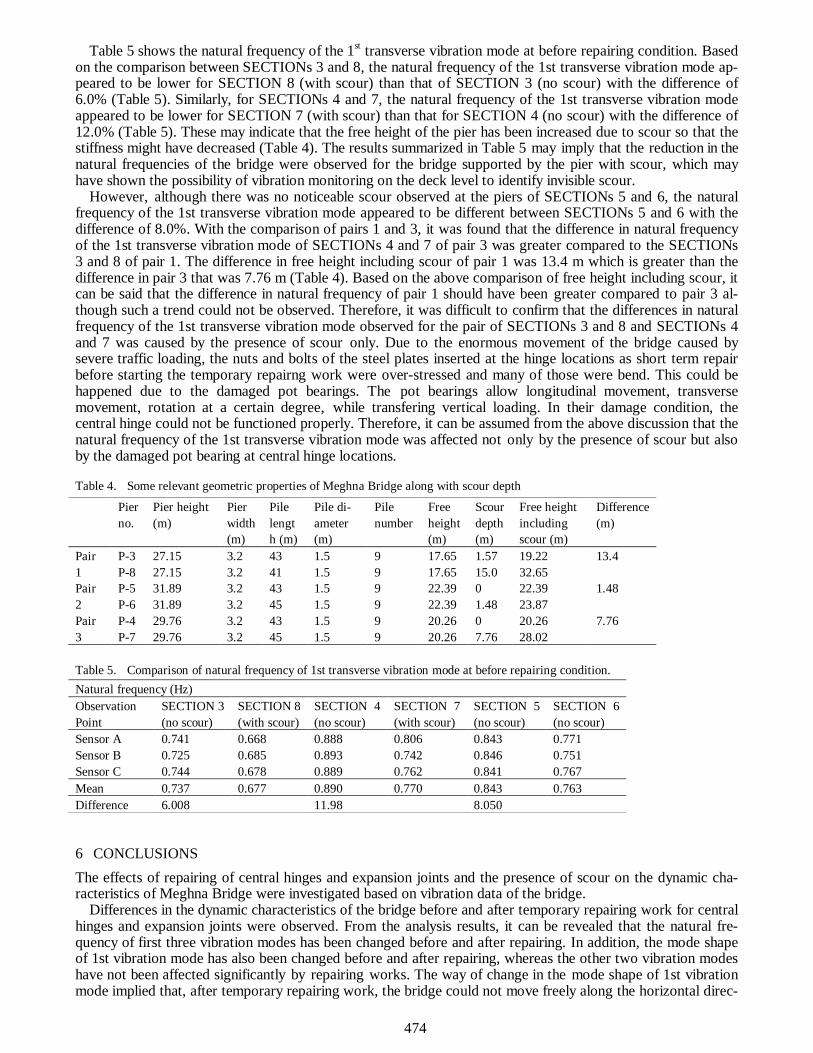
Table 5 shows the natural frequency of the 1st transverse vibration mode at before repairing condition. Based on the comparison between SECTIONs 3 and 8, the natural frequency of the 1st transverse vibration mode ap-peared to be lower for SECTION 8 (with scour) than that of SECTION 3 (no scour) with the difference of 6.0% (Table 5). Similarly, for SECTIONs 4 and 7, the natural frequency of the 1st transverse vibration mode appeared to be lower for SECTION 7 (with scour) than that for SECTION 4 (no scour) with the difference of 12.0% (Table 5). These may indicate that the free height of the pier has been increased due to scour so that the stiffness might have decreased (Table 4). The results summarized in Table 5 may imply that the reduction in the natural frequencies of the bridge were observed for the bridge supported by the pier with scour, which may have shown the possibility of vibration monitoring on the deck level to identify invisible scour.
However, although there was no noticeable scour observed at the piers of SECTIONs 5 and 6, the natural frequency of the 1st transverse vibration mode appeared to be different between SECTIONs 5 and 6 with the difference of 8.0%. With the comparison of pairs 1 and 3, it was found that the difference in natural frequency of the 1st transverse vibration mode of SECTIONs 4 and 7 of pair 3 was greater compared to the SECTIONs 3 and 8 of pair 1. The difference in free height including scour of pair 1 was 13.4 m which is greater than the difference in pair 3 that was 7.76 m (Table 4). Based on the above comparison of free height including scour, it can be said that the difference in natural frequency of pair 1 should have been greater compared to pair 3 al-though such a trend could not be observed. Therefore, it was difficult to confirm that the differences in natural frequency of the 1st transverse vibration mode observed for the pair of SECTIONs 3 and 8 and SECTIONs 4 and 7 was caused by the presence of scour only. Due to the enormous movement of the bridge caused by severe traffic loading, the nuts and bolts of the steel plates inserted at the hinge locations as short term repair before starting the temporary repairng work were over-stressed and many of those were bend. This could be happened due to the damaged pot bearings. The pot bearings allow longitudinal movement, transverse movement, rotation at a certain degree, while transfering vertical loading. In their damage condition, the central hinge could not be functioned properly. Therefore, it can be assumed from the above discussion that the natural frequency of the 1st transverse vibration mode was affected not only by the presence of scour but also by the damaged pot bearing at central hinge locations.
Table 4. Some relevant geometric properties of Meghna Bridge along with scour depth Pier
no. Pier height (m)
Pier width (m)
Pile length (m)
Pile di-ameter (m)
Pile number
Free height (m)
Scour depth (m)
Free height including scour (m)
Difference (m)
Pair 1
P-3 27.15 3.2 43 1.5 9 17.65 1.57 19.22 13.4 P-8 27.15 3.2 41 1.5 9 17.65 15.0 32.65
Pair 2
P-5 31.89 3.2 43 1.5 9 22.39 0 22.39 1.48 P-6 31.89 3.2 45 1.5 9 22.39 1.48 23.87
Pair 3
P-4 29.76 3.2 43 1.5 9 20.26 0 20.26 7.76 P-7 29.76 3.2 45 1.5 9 20.26 7.76 28.02
Table 5. Comparison of natural frequency of 1st transverse vibration mode at before repairing condition. Natural frequency (Hz) Observation Point
SECTION 3 (no scour)
SECTION 8 (with scour)
SECTION 4 (no scour)
SECTION 7 (with scour)
SECTION 5 (no scour)
SECTION 6 (no scour)
Sensor A 0.741 0.668 0.888 0.806 0.843 0.771 Sensor B 0.725 0.685 0.893 0.742 0.846 0.751 Sensor C 0.744 0.678 0.889 0.762 0.841 0.767 Mean 0.737 0.677 0.890 0.770 0.843 0.763 Difference 6.008 11.98 8.050
6 CONCLUSIONS The effects of repairing of central hinges and expansion joints and the presence of scour on the dynamic cha-racteristics of Meghna Bridge were investigated based on vibration data of the bridge.
Differences in the dynamic characteristics of the bridge before and after temporary repairing work for central hinges and expansion joints were observed. From the analysis results, it can be revealed that the natural fre-quency of first three vibration modes has been changed before and after repairing. In addition, the mode shape of 1st vibration mode has also been changed before and after repairing, whereas the other two vibration modes have not been affected significantly by repairing works. The way of change in the mode shape of 1st vibration mode implied that, after temporary repairing work, the bridge could not move freely along the horizontal direc-
475
tions because the insertion of improperly designed steel plates on the expansion joints. The nuts and bolts of the joints of placed steel plates were over-stressed and failed at several times when vehicles passed over the expansion joints. However, the transfer of the vertical load to the adjacent spans worked at a certain degree because of the replacement of damaged pot bearings by rubber bearings. This may be considered as an im-provement in the integrity of the whole structure, after temporary repairing.
It was observed that the natural frequency of the 1st transverse vibration mode appeared to be lower for piers with scour with respect to the piers without scour of pairs 1 and 3. It could be hypothesized that the natu-ral frequency of the bridge has reduced because the stiffness of the bridge has decreased due to the increase free height of the pier caused by scour. This may have shown the possibility of vibration monitoring on the deck level to identify invisible scour. Based on the comparison of free height including scour of pair 1 and pair 3, the differences in natural frequencies of pair 1 should have been higher compared to pair 3, although such a trend could not be observed. The differences in natural frequency of the 1st transverse vibration mode ob-served in the results may be caused not only by the presence of scour but also by the damaged pot bearing at central hinge locations.
ACKNOWLEDGEMENT The authors would like to express their gratefulness to Md. Mashfiqul Islam, Assistant Professor, Department of Civil Engineering, Ahsanullah University of Science and Technology (AUST), Ariful Hasnat, Senior Lectur-er, Department of Civil Engineering, University of Asia Pacific (UAP), Md. Mahmudul Haque, Nafis Fuad and Md. Abdullah, Graduate students, Department of Civil Engineering, BUET for their assistance to the data col-lection of Meghna Bridge. Special thanks go to Bangladesh University of Engineering and Technology (BUET) for providing BUET bus and their staffs for their enormous support in vibration measurements.
REFERENCES Altunisik, A.C., Bayraktar, A. & Sevim, B. 2011. Output-only system identification of posttensioned segmental concrete highway
bridges. Journal of bridge engineering; 16(2):259-266. Bayraktar, A., Altunisik, A. C., Sevim, B., Türker, T., Dominic, A., & Tas, Y. 2009. Vibration characteristics of Kömürhan
Highway Bridge constructed with balanced cantilever method. Journal of performance of constructed facilities, 23(2):90-99. Chen, C. C., Wu, W. H. Shih, F. & Wang, S. W. 2014. Scour evaluation for foundation of a cable-stayed bridge based on ambient
vibration measurements of superstructure. Journal of bridge engineering; 16(2):259-266. Elsaid, A. &Seracino, R. 2013. Rapid assessment of foundation scour using the dynamic features of bridge superstructure. Journal
of construction and building materials, 50 (2014): 42-49. Hoque, M.M., Rahman, M. M., Hossain, M. A. 2004. Morphological characteristics of the river Meghna: A collaborative study.
The 2nd Asia pacific association of hydrology and water resources (APHW) conference, Singapore, 5-8 July 2004. Juang, J.N. & Pappa, R. S. 1985. An eigensystem realization algorithm for modal parameter identification and model reduction.
Journal of guidance; 8(5):620-627. Tatsumi, M. 2012. Preparatory survey for Dhaka-Chittagong National Highway No.1: Bridge construction and rehabilitation
project: Environmental impact assessment. Oriental Consultants co., ltd.; Katahira & Engineers International. Japan. Wardhana, K., and Hadipriono, F. C. 2003. Analysis of recent bridge failures in the United States. Journal of performance of con-
structed facilities, 17(3):144– 150.