Embed Size (px)
Citation preview
Experimental Study of Cabin and Engine Vibration
Isolation Elements
Växjö, Spring 2011 Thesis no: SE XXX/2011
Names: Isa Demir
Alireza Izadi M. Yasar Javaid
Department of Mechanical Engineering
II
Organisation/ Organization Författare/Author(s) Volvo Construction Equipment Isa Demir, Alireza Izadi, M. Yasar Javaid Dokumenttyp/Type of document Handledare/tutor Exami nator/examiner Thesis Professor Torbjörn Ekevid Titel och undertitel/Title and subtitle Experimental study of cabin and engine mounts of a Volvo articulated hauler Sammanfattning (på svenska) Nyckelord Abstract (in English) This project investigates engine and cabin mounts of articulated haulers. Experimental study of engine and cabin mounts identifies the structural behaviour of the complicated metal-net elastomeric mounts to isolate driver from noise and vibration transfer. In order to achieve the expected results, the loss factor and dynamic stiffness of engine mount is studied to provide fundamental information of the energy dissipation. A simple experimental method is presented in this project to evaluate the frequency dependent rubber mount stiffness and damping characteristics by utilizing the measured complex frequency response function from low frequency. The study shows the transition of the rubber mount stiffness from static to dynamic values. Using the experimentally estimated values of the rubber mount stiffness and damping, the dynamic response of the tested spring-mass system using a metal-net rubber mount as the elastic element can be accurately reproduced. Key Words Cabin mount, Engine mount, loss factor, dynamic stiffness, damping, metal-net isolator
Utgivningsår/Year of issue Språk/Language Antal s idor/Number of pages
III
Abstract
This project investigates engine and cabin mounts of articulated haulers. Experimental study of engine and cabin mounts identifies the structural behaviour of the complicated metal-net elastomeric mounts to isolate driver from noise and vibration transfer. In order to achieve the expected results, the loss factor and dynamic stiffness of engine mount is studied to provide fundamental information of the energy dissipation. A simple experimental method is presented in this project to evaluate the frequency dependent rubber mount stiffness and damping characteristics by utilizing the measured complex frequency response function from low frequency. The study shows the transition of the rubber mount stiffness from static to dynamic values. Using the experimentally estimated values of the rubber mount stiffness and damping, the dynamic response of the tested spring-mass system using a metal-net rubber mount as the elastic element can be accurately reproduced.
Acknowledgement
This experimental research is a team effort from many individuals at Linnaeus University and Volvo Construction Equipment. Those that specifically contributed to this project are Alireza Izadi, Isa Damir and M. Yasar Javaid under supervision of Prof. Torbjorn Ekevid. Manufacturing parts supported by Volvo Construction Equipment workshop. The projects also acknowledge was Mr. Bertil Enquist for his assistance in the experimental setup.
IV
Table of contents Abstract ........................................................................................................................................ III
Acknowledgement ....................................................................................................................... III
Table of contents .......................................................................................................................... IV
1. Introduction ................................................................................................................................ 1
1.1 Background ............................................................................................................................... 2
1.2 Purpose ...................................................................................................................................... 2
1.3 Aim ............................................................................................................................................ 3
1.4 Hypothesis and Limitations ..................................................................................................... 3
1.5 Reliability, validity and objectivity ......................................................................................... 3
2. Theory ......................................................................................................................................... 4
3. Literature review ........................................................................................................................ 8
4. Methodology ............................................................................................................................... 9
4.1 Design and manufacturing of cabin and engine brackets......................................................9
4.1.1 Cabin mount tension and compression bracket…………………………………………11
4.1.2 Cabin mount shear test bracket…………………………………………………………..11
4.1.3 Engine mount tension and compression bracket………………………………………...12
4.1.4 Engine mount shear test bracket…………………………………………………………13
4.1.5 Static test of model singularities…………………………………………………………..14
4.2 Implementing the tests………………………………………………………………………15
5 Results ........................................................................................................................................ 17
5.1 Cabin mount experiments………………………………………………………..………….17
5.1.1 CM axial test……………………………………………………………………………….17
5.1.2 CM radial test ………………………………………………………………………..……20
5.2 Engine mount tests…………………………………………………………………..………23
5.2.1 EM radial test…………………………………………………………………..………….23
5.2.2 EM axial test…………………………………………………………………….…………26
6. Analysis of the results .............................................................................................................. 27
7. Discussion .................................................................................................................................. 28
8. Conclusions ............................................................................................................................... 29
9. References..................................................................................................................................30
10. Appendix……………………………………………………………………………………..31
1
1. Introduction
This master thesis is done in cooperation between three students at Linnaeus University and Volvo Construction Equipment, Braås, Sweden. Volvo Construction Equipment, originally Volvo BM, is a subsidiary and business area of AB Volvo. Volvo Construction Equipment develops, manufactures and markets equipment for the construction and related industries. The Volvo Construction company in Braås produces the articulated hauler. The articulated hauler invented by Volvo Construction Equipment is a piece of heavy equipment used to transport loads over rough terrain. The first such machine was introduced in 1968. The machine consists of two basic units, one front unit called the tractor and the rear unit, called the hauler or load unit, which contains the dump body and generally could handle load up to 40 tons. A comfortable ride has become a sales argument with the continuous development of the vehicle industries due to new standards on lower level of noise and vibration. Volvo CE tries to increase the standards level for the cabin by improving the cabin and engine isolators to reduce the noise pressure level in cabin. Engine is a vibration source and the most important element of the hauler which cause vibration and noise in cabin. In order to isolate the cabin from engine, different mount systems have been applied. The articulated haulers with large power diesel engines cause high vibration in a wide frequency range. To isolate the engine vibration in a relatively large frequency range, the engine mounts are required to be soft-low elastic stiffness. To prevent engine bounce in the low frequency range, engine mounts should be hard-high elastic stiffness or high damping. The idea of applying engine mount system is to isolate engine vibration caused by the engine disturbance forces in engine speed range and to prevent engine to bounce from shock excitation. This implies that the dynamic stiffness and damping of the engine mount should be frequency and amplitude-dependent. The development of engine mounting systems has mostly focused on improvement of frequency and amplitude-dependent properties. The conventional elastomeric mounts do not meet all the requirements and can only offer a trade-off between static detection and vibration isolation. Traditionally, most mount systems use rubber isolators. From the characteristics of rubber isolator and vibration control theory, relation of its load and deformation is approximately linear. On the other hand, rubber isolator fits to work only in normal temperature. Although the conventional elastomeric mounts do not meet all the requirements and can only offer a trade-off between static deflection and vibration isolation, elastomeric mount properties like compactness, cost-effectiveness and low maintenance make elastomeric mounts still very attractive [1].
2
Successful application of metal-net isolator as a new vibration control unit in heavy vehicles with nonlinear stiffness characteristic, large damping and power circumstance adaptability is achievable. Experiments shows that the properties of metal-net isolator are prior to those of the rubber isolators and can be used as the large power diesel engine’s mounts [2, 3]. Metal-net isolator also has a good sound behavior in a broad frequency band and thus is a promising isolator [3]. There are various factors that affect the interior noise level, and all these factors can be summarized as internal factors and external factors [3]. The internal factors is for example natural frequencies of car body, damp, modal vibration modes, and acoustic mode of cabin; the external factors e.g. as exciting forces of the engine, exciting force of the road and wind noise when vehicle in high speed. The interior noise is impacted by all of those factors through structure or air. The interior noise is greatly influenced by the exciting forces of engine, especially under idle operating condition [3]. The engine mount, cabin mount, and power train mount system have large influence to vibration isolation. A targeted optimization of mount system can be achieved through the analysis of the relationship between the mount exciting forces and interior noise. The force transferred from the mount to car body is to be reduced, and thus the interior noise reduction and the noise vibration and harshness improvement will be carried out. In order to achieve the ideal point, the suspension elements include vibration isolator rubber elements for cabin and engine on front frame of a Volvo hauler will be studied to understand the elements roles in reducing the noise pressure of cabin.
1.1 Background
The isolation elements on haulers was designed in mid 1990 be used in D-generation of AH and they are still use. Applying same mounts as of 1990s generation of Volvo articulated hauler for its new generation causes the pressure noise problem in F-generation. The vibration isolation system including rubber elements for cabin and engine mounted on the front frame of a Volvo hauler will be studied to optimize the elements to reduce the noise pressure of cabin and improve overall performance.
1.2 Purpose
This project investigates the dynamic characteristics of cabin and engine mounts via proper experimental vibration tests. The results will be analyzed and used to improve the mounts to achieve a better operational performance. Test rigs should be designed to fix the engine and cabin isolator components in a hydraulic test machine. The components have complex shapes and are impossible to test without using
3
special rigs. The rigs are thought to be simple and to help to obtain exact results from the test. Moreover, finite element analyses are applied in Abaqus and Solidwork to clarify the brackets operations and probable errors.
1.3 Aim
To Volvo Construction Company the main project aims to improve the cabin standard with the lowest possible vibration and noise. In order to optimize cabin quality the dynamic behaviors of isolators is researched. To reduce the noise, vibration and harshness, the element’s properties should be indicated.
1.4 Hypothesis and Limitations
In order to reach the aim, it is assumed that; • The current suspension system is reliable. However, the performance and reliability of
system may need further improvement. The cabin vibration and noise is able to decrease using improved engine and cabin mounts.
• The improvement of engine and cabin mounts is possible via change the rubber parts or related metal-net mounts.
• During the tests, one of the most critical factors is how the frame and cabin will be suspended; the influence of the suspension should be minimized. The optimal way would be to perform tests in place to see the actual movement of the frame.
1.5 Reliability, validity and objectivity
As it is expected, the ideal engine mounts should isolate engine vibration caused by engine disturbances in various engine speed range in six degree of freedom which prevent the forces in ZYX ,, directions and momentum around theses three axis and prevent engine bounce from
shock excitation. Also, the cabin mounts should isolate cabin from vibration. These imply that the dynamic stiffness and damping of engine mount should be frequency and amplitude dependent. The conventional elastomeric mounts do not meet all requirements and can only offer a trade-off between static deflection and vibration isolation. But elastomeric mount properties like compactness, cost-effectiveness and low maintenance make elastomeric mounts still very attractive. Transfer rate of metal-net isolator is always smaller than that of rubber isolator and the experiments state that the characters of metal-net isolator are prior to those of the rubber isolator and can be used as the large power diesel engine’s mount [2, 3]. Researches on
4
passive hydraulic, semi-active and active engine and cabin mounts can provide better performance than elastomeric mounts especially in the low frequency range [1]. Beside these, the performance of the whole engine mounting system not only depends on the performance of individual mounts, but the optimum design of the whole system as well. According to the achieved results, optimization is possible by tuning the natural frequency of the engine and cabin mounts to desired range to avoid resonance and to improve the isolation of various excitations.
2. Theory
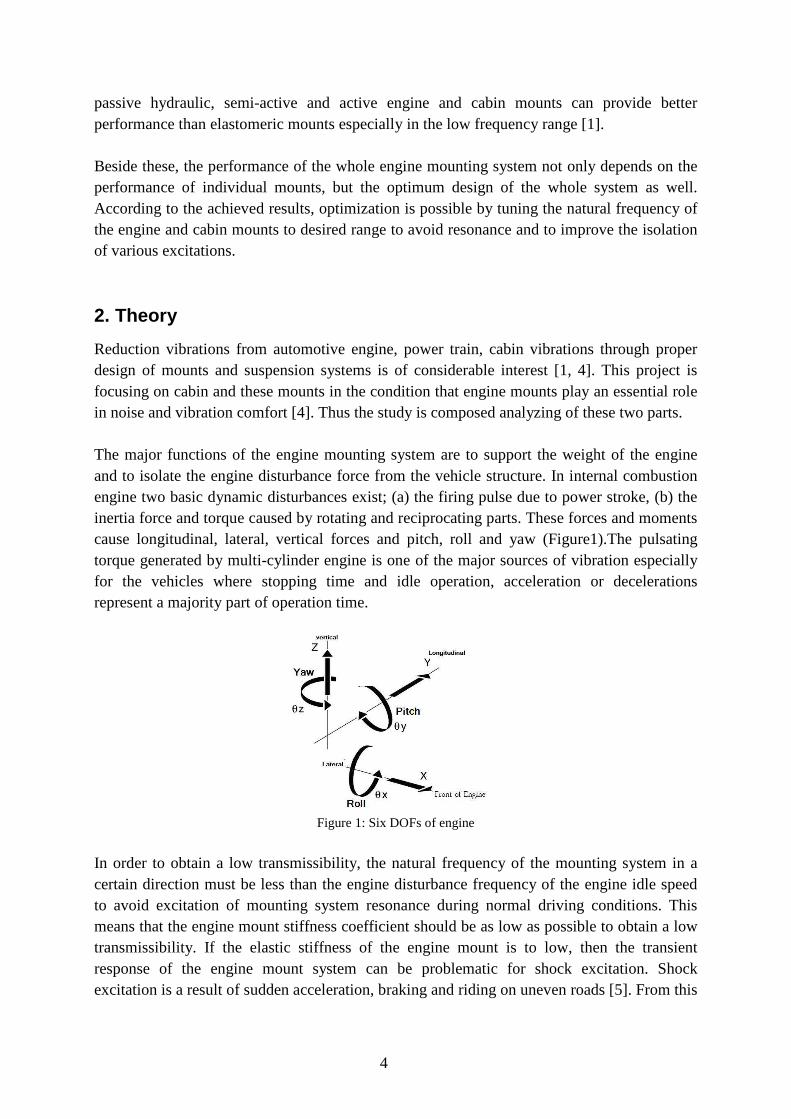
Reduction vibrations from automotive engine, power train, cabin vibrations through proper design of mounts and suspension systems is of considerable interest [1, 4]. This project is focusing on cabin and these mounts in the condition that engine mounts play an essential role in noise and vibration comfort [4]. Thus the study is composed analyzing of these two parts. The major functions of the engine mounting system are to support the weight of the engine and to isolate the engine disturbance force from the vehicle structure. In internal combustion engine two basic dynamic disturbances exist; (a) the firing pulse due to power stroke, (b) the inertia force and torque caused by rotating and reciprocating parts. These forces and moments cause longitudinal, lateral, vertical forces and pitch, roll and yaw (Figure1).The pulsating torque generated by multi-cylinder engine is one of the major sources of vibration especially for the vehicles where stopping time and idle operation, acceleration or decelerations represent a majority part of operation time.
Figure 1: Six DOFs of engine
In order to obtain a low transmissibility, the natural frequency of the mounting system in a certain direction must be less than the engine disturbance frequency of the engine idle speed to avoid excitation of mounting system resonance during normal driving conditions. This means that the engine mount stiffness coefficient should be as low as possible to obtain a low transmissibility. If the elastic stiffness of the engine mount is to low, then the transient response of the engine mount system can be problematic for shock excitation. Shock excitation is a result of sudden acceleration, braking and riding on uneven roads [5]. From this
5
point of view, high stiffness and high damping are required to minimize the engine motion and absorb engine shake and resonances. From the above discussion, it can be easily inferred that to isolate the engine vibration in a relatively high frequency range, the engine mounts are required to be soft-low elastic stiffness and low damping and to prevent engine bounce in the low frequency range, engine mounts should be hard-high elastic stiffness and high damping [1]. Elastomeric or metal-net mounts are widely used to isolate vehicle structure from engine vibration. Volvo Hauler A35F uses three metal-net isolators in three sides of engine. Thus, this engine mount can optimize for the necessary elastic stiffness rate characteristics in all direction. These engine mounts can be modeled with common types of spring-dashpot models [6, 7]which are:
• Kelvin or Voigt, • Zener, • Zener model
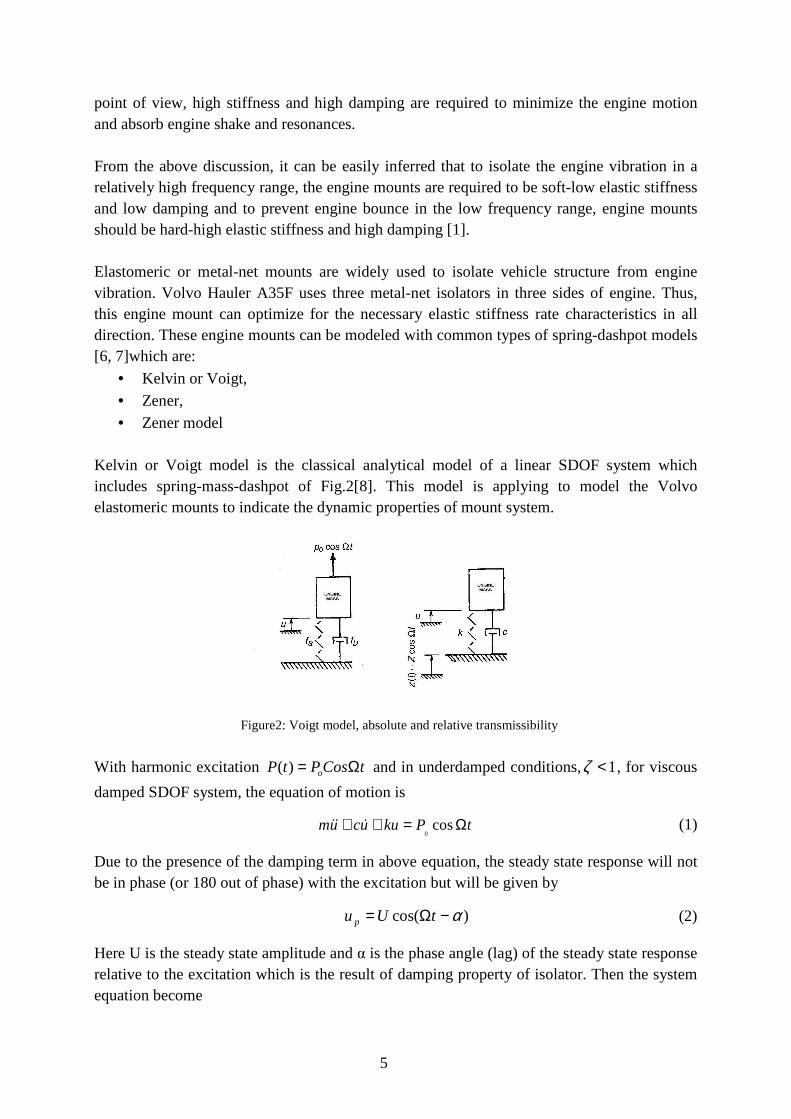
Kelvin or Voigt model is the classical analytical model of a linear SDOF system which includes spring-mass-dashpot of Fig.2[8]. This model is applying to model the Volvo elastomeric mounts to indicate the dynamic properties of mount system.
Figure2: Voigt model, absolute and relative transmissibility
With harmonic excitation tCosPtP o Ω=)( and in underdamped conditions, 1<ζ , for viscous
damped SDOF system, the equation of motion is
tPkuucum Ω=++ cos0
&&& (1)
Due to the presence of the damping term in above equation, the steady state response will not be in phase (or 180 out of phase) with the excitation but will be given by
)cos( α−Ω= tUup (2)
Here U is the steady state amplitude and α is the phase angle (lag) of the steady state response relative to the excitation which is the result of damping property of isolator. Then the system equation become
6
tptkUtUctUm Ω=−Ω+−ΩΩ−−ΩΩ− cos)cos()sin()cos( 02 ααα (3)
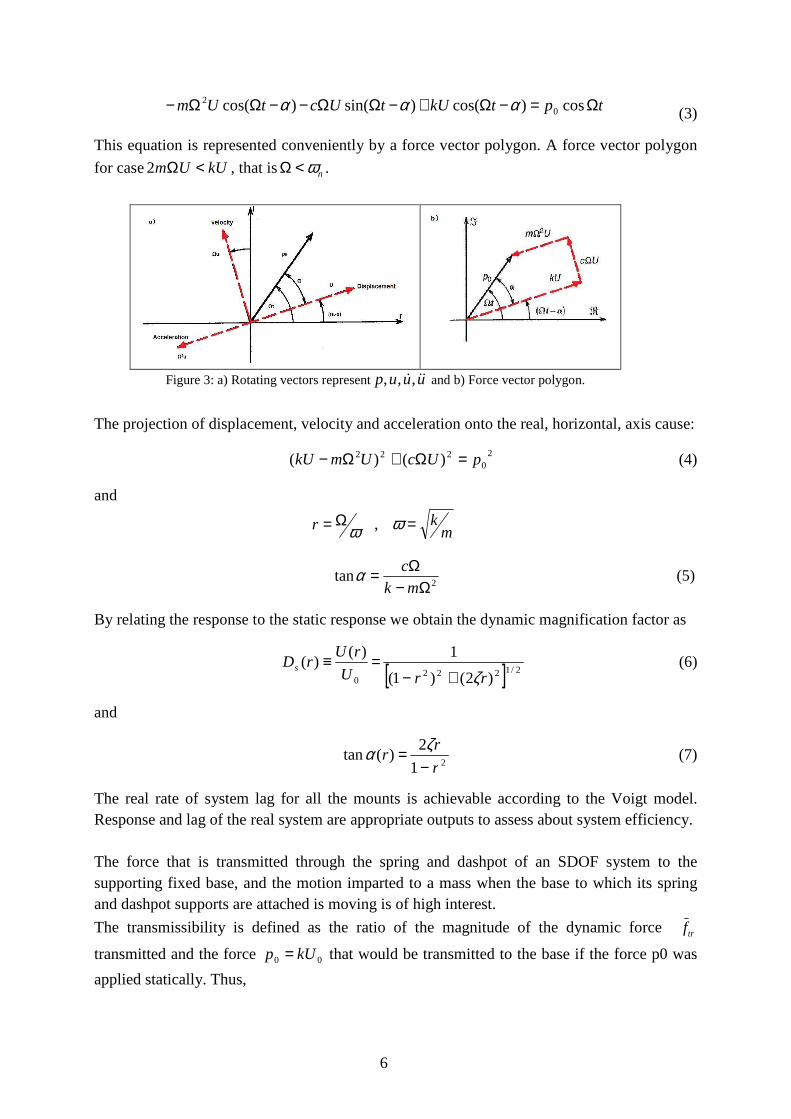
This equation is represented conveniently by a force vector polygon. A force vector polygon
for case kUUm <Ω2 , that is nω<Ω .
Figure 3: a) Rotating vectors represent uuup &&&,,, and b) Force vector polygon.
The projection of displacement, velocity and acceleration onto the real, horizontal, axis cause:
20
222 )()( pUcUmkU =Ω+Ω− (4)
and
ωΩ=r , m
k=ω
2tan
Ω−Ω=mk
cα (5)
By relating the response to the static response we obtain the dynamic magnification factor as
[ ] 2/12220 )2()1(
1)()(
rrU
rUrDs
ζ+−=≡ (6)
and
21
2)(tan
r
rr
−= ζα (7)
The real rate of system lag for all the mounts is achievable according to the Voigt model. Response and lag of the real system are appropriate outputs to assess about system efficiency. The force that is transmitted through the spring and dashpot of an SDOF system to the supporting fixed base, and the motion imparted to a mass when the base to which its spring and dashpot supports are attached is moving is of high interest.
The transmissibility is defined as the ratio of the magnitude of the dynamic force trf
transmitted and the force 00 kUp = that would be transmitted to the base if the force p0 was
applied statically. Thus,
7
[ ] 2/120
0
)2(1 rHp
fTR
tr ζ+== (8)
where
[ ] 2/12220)2()1(
1
rrH
ζ+−= (9)
The force transmitted to the base dynamically is less than the static force only if 2>r ,
decreasing the damping decreases the transmitted force provided that if 2>r . We consider also the case when 0)( =tP but the base undergoes simple harmonic
motion tZz Ω= cos zuz −= Let us assume complex steady-state responses of the forms tieUu Ω= and tieWw Ω= . Then, the magnitude of the absolute and relative responses related to
the base motion as functions of frequency can be determined.
[ ][ ] [ ] 2/12
02/1222
2/12
)2(1)2()1(
)2(1rH
rr
r
Z
U
Z
U ζζ
ζ +=+−
+== (10)
And
[ ] 02
2/1222
2
)2()1(Hr
rr
r
Z
W
Z
W =+−
=≡ζ
(11)
Examine (10) and (11), we can conclude that
1. When nω<<Ω (i.e., r << 1), there is little relative motion between the mass and the
base; that is, the mass moves with the base.
2. When nω≈Ω , the usual resonance phenomenon is observed. For small base motion
there is large amplitude of relative motion with only the damping force limiting the amplitude.
3. When nω>>Ω , the inertia of the mass keeps it from moving much, so that the relative
motion consists primarily of the base moving relative to the mass. In addition to this simple the principles of vibration, the practical theory of experimental part of a
SDOF system involves frequency dependent stiffness, k , and loss factor, η . Thus the equation
of motion is:
Fxjkxm =++ )1( η&& (12)
Where m is the mass, x is the displacement, x&& is the acceleration, and F is the excitation of system. Thus, the complex response of viscous-damped system,
stst exxeFF 00 , == , fjs 2, == ωω , is shown as:
stst eFexjkXms 002 ))1(( =++ η (13)
8
To characterize the system behavior the below ratio is apply.
2
0
0 )1( ωη mjkx
F−+= (14)
This above equation is equal to dynamic stiffness and can illustrate the dynamic behavior of
the system in the form of dynamic stiffness,dk
kjmkkd ηω +−= 2 (15)
To validate the real and imaginary parts of dynamic stiffness, the sine swept frequency test is applicable. Moreover, the dynamic stiffness has imaginary and real parts that are:
.imagreald kkk += (16)
These two last equations show that frequency dependent stiffness and loss factor are:
2ωmkk real += (17)
And,
k
kimag.=η (18)
3. Literature review
User-friendly systems are the most popular in today’s technology. From the first day of the vehicle evolution, the carriage was equipped by leather isolator to prevent the bounces and shocks transfer to the cab. Primarily, in old vehicle, leather and rubber elements was used to increase the comfortable conditions of cab. An ideal engine mount system should isolate engine vibration caused by engine disturbance force in engine speed range and prevent engine bounce from shock excitation. This implies that the dynamic stiffness and damping of the engine mount should be frequency and amplitude dependent. The development of engine mounting systems has mostly concerned on improvement of frequency- and amplitude dependent properties. The conventional elastomeric mounts do not meet all the requirements but can offer a trade-off between static deflection and vibration isolation. Passive hydraulic mounts can provide a better performance than elastomeric mounts especially in the low frequency range. Semi-active techniques are usually used to further improve performance of hydraulic mounts by making them more tunable. The active engine mounting system can be very stiff at low frequency and be tuned to be very soft at the higher frequency range to isolate the vibration. The active engine mounts have been considered as the next generation of engine mounts. The optimization of engine mounting systems is quite desirable. The current work on the optimization of the engine mount systems shows some limitations.
9
Based on the above review of the literature on automotive vehicle engine mounting systems, we can summarize:
• The ideal engine mounts should isolate engine vibration caused by engine disturbances in the engine speed range and prevent engine bounce from shock excitation. This implies that the dynamic stiffness and damping of engine mount should be frequency and amplitude dependent. The development of an engine mounting system should concentrate on improvement of such frequency and amplitude dependent properties.
• The conventional elastomeric mounts do not meet all the requirements and can only offer a trade-off between static deflection and vibration isolation but elastomeric mount properties like compactness, cost-effectiveness and low maintenance make elastomeric mounts still very attractive [3].
• Rubber and fluid-filled rubber engine mounts are commonly used in automotive and aerospace applications to provide reduced cabin noise and vibration, and/or motion accommodations. In certain applications, the rubber mount may operate at frequencies as high as 5000 Hz. Therefore, dynamic stiffness of the mount needs to be known in this frequency range. Commercial high frequency test machines are practically nonexistent, and the best high frequency test machine on the market is only capable of frequencies as high as 1000 Hz. In paper, a high frequency test machine is described that allows test engineers to study the high frequency performance of rubber mounts at frequencies up to 5000 Hz [4].
4. Methodology
The experimental research is expected to find some relations between entities by proper equation and tests. The project needs basic preparation which includes:
• Design and manufacturing cabin and engine brackets
• Implementing the tests • Analyzing output data
4.1 Design and manufacturing of cabin and engine br ackets
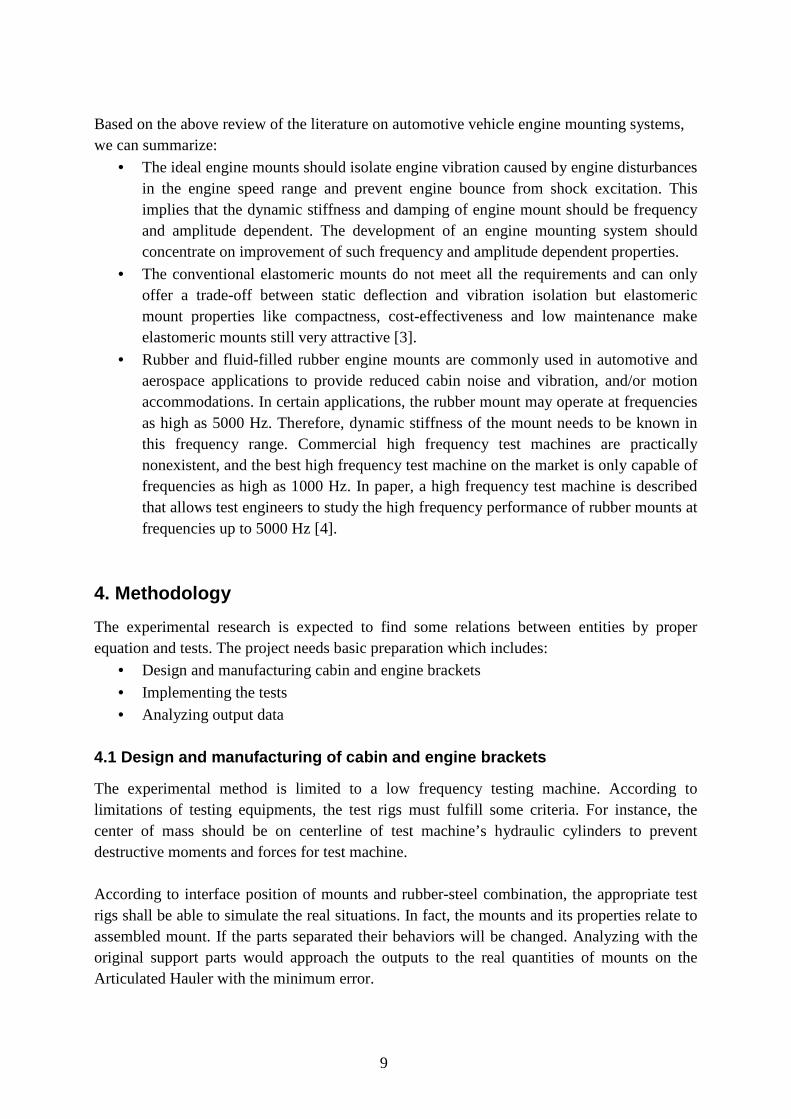
The experimental method is limited to a low frequency testing machine. According to limitations of testing equipments, the test rigs must fulfill some criteria. For instance, the center of mass should be on centerline of test machine’s hydraulic cylinders to prevent destructive moments and forces for test machine. According to interface position of mounts and rubber-steel combination, the appropriate test rigs shall be able to simulate the real situations. In fact, the mounts and its properties relate to assembled mount. If the parts separated their behaviors will be changed. Analyzing with the original support parts would approach the outputs to the real quantities of mounts on the Articulated Hauler with the minimum error.
10
Figure 4: Cabin mount (left) and engine mount element (right)
When the brackets were designed, the main intension was to use simple parts that can be shared in both radial and axial tests. The rigs should be simple to produce, assemble and with the lowest expense but effective and trustful. In the end four tests’ brackets are “cabin mount isolator element tension and compression test bracket” , “cabin mount isolator element shear test bracket” and “engine mount isolator element tension and compression test bracket” and “engine mount isolator element shear test bracket”. The main aim when designing all bracket and their part is to avoid eccentricity i.e. deviation from the normal axis of applied force it has a destructive effect on the test machine. In addition, the force is transferred to corners of the bracket that generates bending forces. So stiffness of the specimen can be affected. Thus, in some test, the brackets are designed to analyze two rubber elements to centralize the applied force. 4.1.1 Cabin mount tension and compression test brac ket
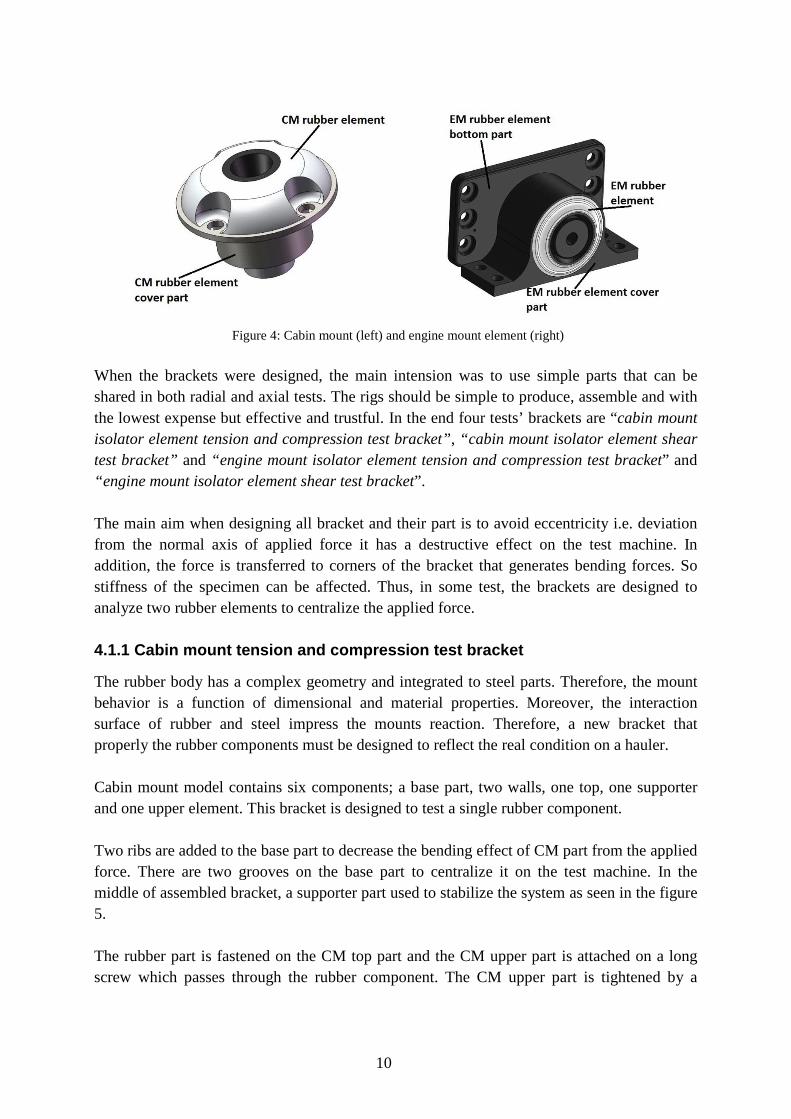
The rubber body has a complex geometry and integrated to steel parts. Therefore, the mount behavior is a function of dimensional and material properties. Moreover, the interaction surface of rubber and steel impress the mounts reaction. Therefore, a new bracket that properly the rubber components must be designed to reflect the real condition on a hauler. Cabin mount model contains six components; a base part, two walls, one top, one supporter and one upper element. This bracket is designed to test a single rubber component. Two ribs are added to the base part to decrease the bending effect of CM part from the applied force. There are two grooves on the base part to centralize it on the test machine. In the middle of assembled bracket, a supporter part used to stabilize the system as seen in the figure 5. The rubber part is fastened on the CM top part and the CM upper part is attached on a long screw which passes through the rubber component. The CM upper part is tightened by a
11
500Nm torque like the real condition. Then, the CM upper part and CM base parts are attached to the grapples of test machine.
Figure 5: Cabin mount rubber element tension and compression test bracket
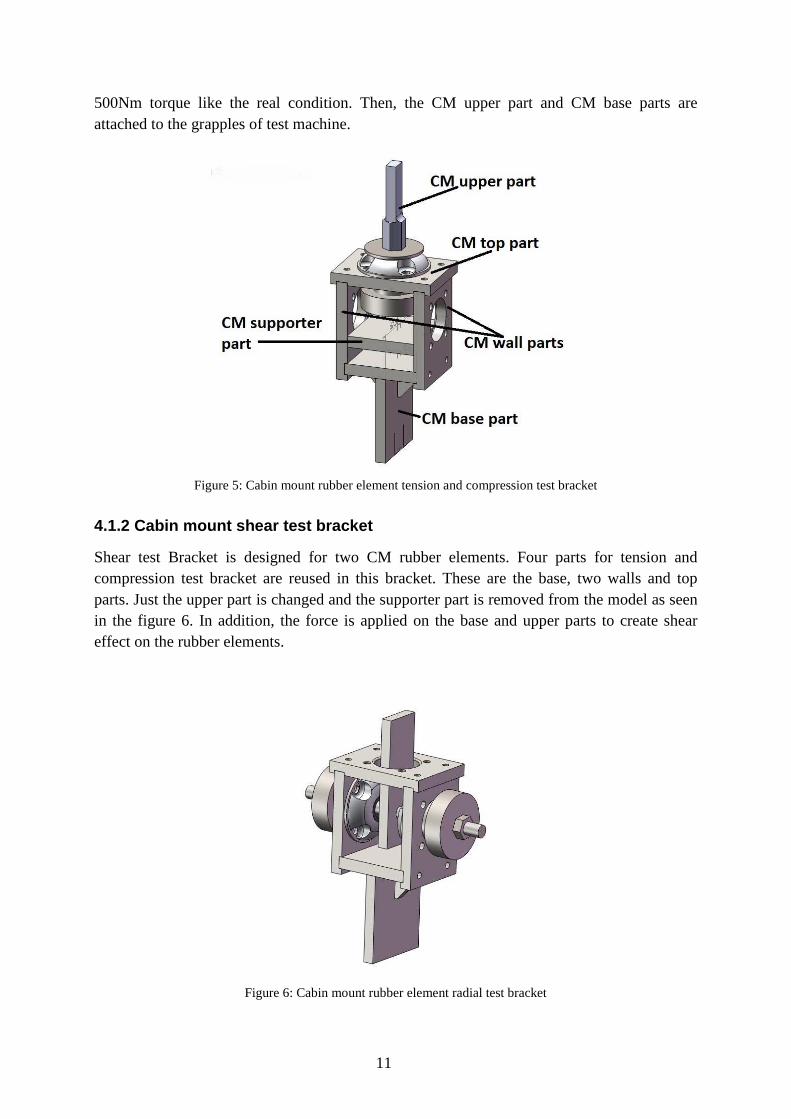
4.1.2 Cabin mount shear test bracket
Shear test Bracket is designed for two CM rubber elements. Four parts for tension and compression test bracket are reused in this bracket. These are the base, two walls and top parts. Just the upper part is changed and the supporter part is removed from the model as seen in the figure 6. In addition, the force is applied on the base and upper parts to create shear effect on the rubber elements.
Figure 6: Cabin mount rubber element radial test bracket
12
The model uses two cabin mounts at the same time to avoid eccentricity of applied force.
While assembling the bracket, the rubber components are screwed on the CM wall parts and a long screw is used to tighten the two rubber elements in order to handle the radial force. A 500 Nm torque is applied to simulate to convince the real conditions. There are two gaps between upper element and rubber parts and these are fixed with washers to make the upper part stable.
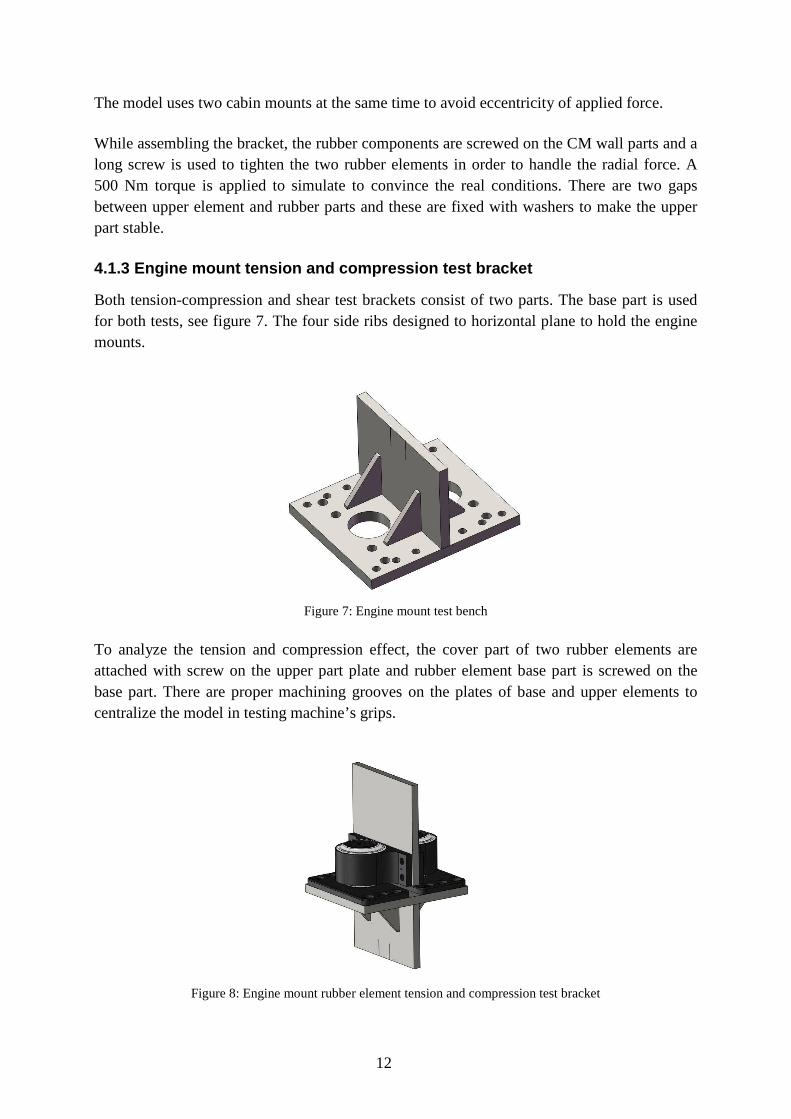
4.1.3 Engine mount tension and compression test bra cket
Both tension-compression and shear test brackets consist of two parts. The base part is used for both tests, see figure 7. The four side ribs designed to horizontal plane to hold the engine mounts.
Figure 7: Engine mount test bench
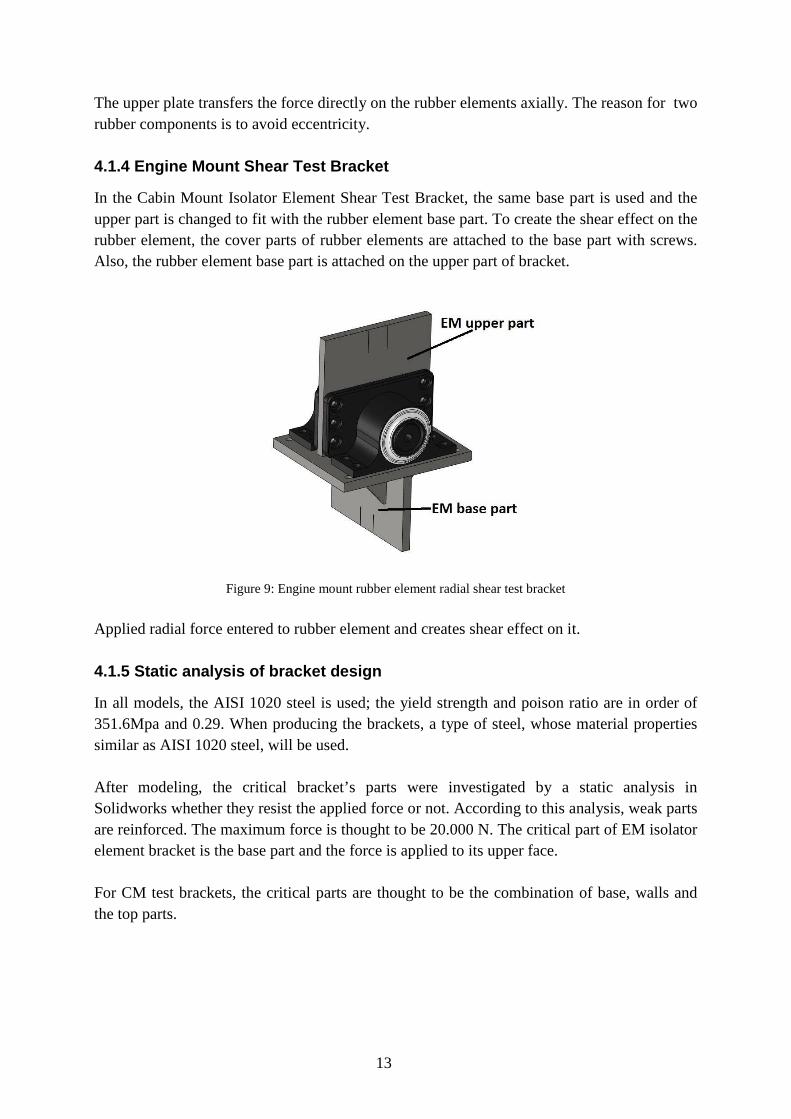
To analyze the tension and compression effect, the cover part of two rubber elements are attached with screw on the upper part plate and rubber element base part is screwed on the base part. There are proper machining grooves on the plates of base and upper elements to centralize the model in testing machine’s grips.
Figure 8: Engine mount rubber element tension and compression test bracket
13
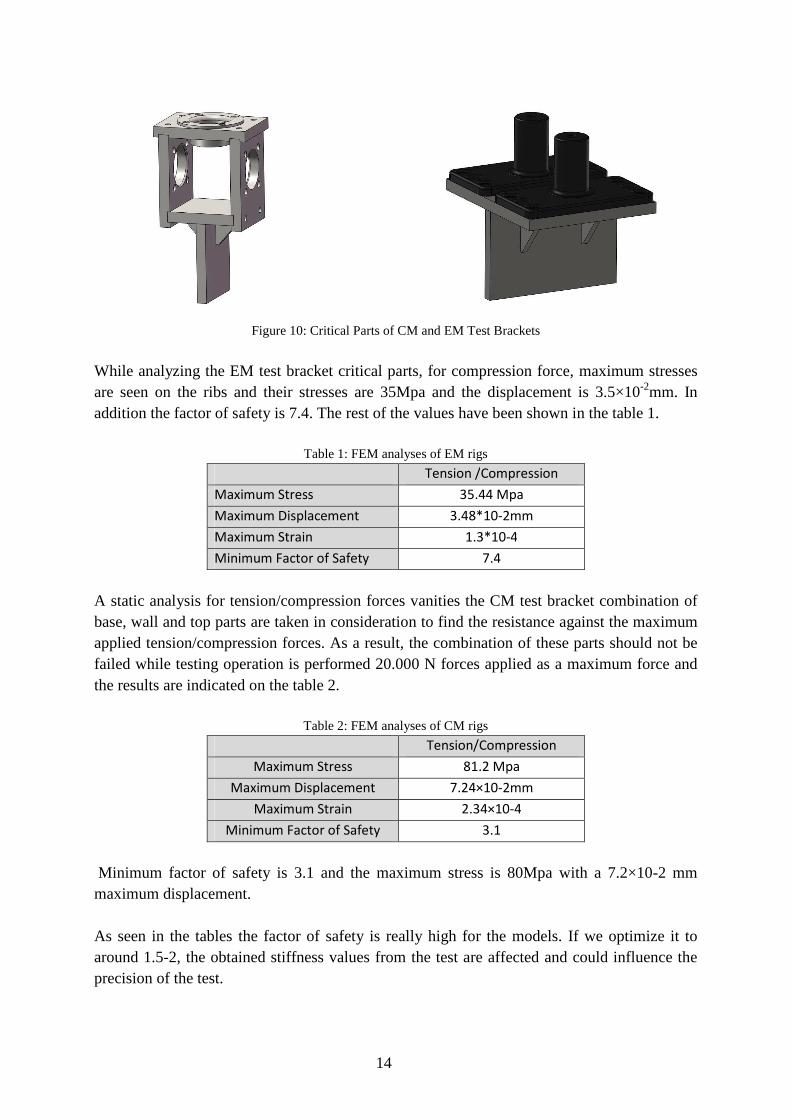
The upper plate transfers the force directly on the rubber elements axially. The reason for two rubber components is to avoid eccentricity. 4.1.4 Engine Mount Shear Test Bracket
In the Cabin Mount Isolator Element Shear Test Bracket, the same base part is used and the upper part is changed to fit with the rubber element base part. To create the shear effect on the rubber element, the cover parts of rubber elements are attached to the base part with screws. Also, the rubber element base part is attached on the upper part of bracket.
Figure 9: Engine mount rubber element radial shear test bracket
Applied radial force entered to rubber element and creates shear effect on it. 4.1.5 Static analysis of bracket design
In all models, the AISI 1020 steel is used; the yield strength and poison ratio are in order of 351.6Mpa and 0.29. When producing the brackets, a type of steel, whose material properties similar as AISI 1020 steel, will be used. After modeling, the critical bracket’s parts were investigated by a static analysis in Solidworks whether they resist the applied force or not. According to this analysis, weak parts are reinforced. The maximum force is thought to be 20.000 N. The critical part of EM isolator element bracket is the base part and the force is applied to its upper face. For CM test brackets, the critical parts are thought to be the combination of base, walls and the top parts.
14
Figure 10: Critical Parts of CM and EM Test Brackets
While analyzing the EM test bracket critical parts, for compression force, maximum stresses are seen on the ribs and their stresses are 35Mpa and the displacement is 3.5×10⁻²mm. In addition the factor of safety is 7.4. The rest of the values have been shown in the table 1.
Table 1: FEM analyses of EM rigs Tension /Compression
Maximum Stress 35.44 Mpa
Maximum Displacement 3.48*10-2mm
Maximum Strain 1.3*10-4
Minimum Factor of Safety 7.4
A static analysis for tension/compression forces vanities the CM test bracket combination of base, wall and top parts are taken in consideration to find the resistance against the maximum applied tension/compression forces. As a result, the combination of these parts should not be failed while testing operation is performed 20.000 N forces applied as a maximum force and the results are indicated on the table 2.
Table 2: FEM analyses of CM rigs Tension/Compression
Maximum Stress 81.2 Mpa
Maximum Displacement 7.24×10⁻²mm
Maximum Strain 2.34×10⁻⁴
Minimum Factor of Safety 3.1
Minimum factor of safety is 3.1 and the maximum stress is 80Mpa with a 7.2×10⁻² mm maximum displacement. As seen in the tables the factor of safety is really high for the models. If we optimize it to around 1.5-2, the obtained stiffness values from the test are affected and could influence the precision of the test.
15
Stress, displacement, Strain and Factor of Safety figures are seen on the appendix 1.
4.2 Implementing the tests
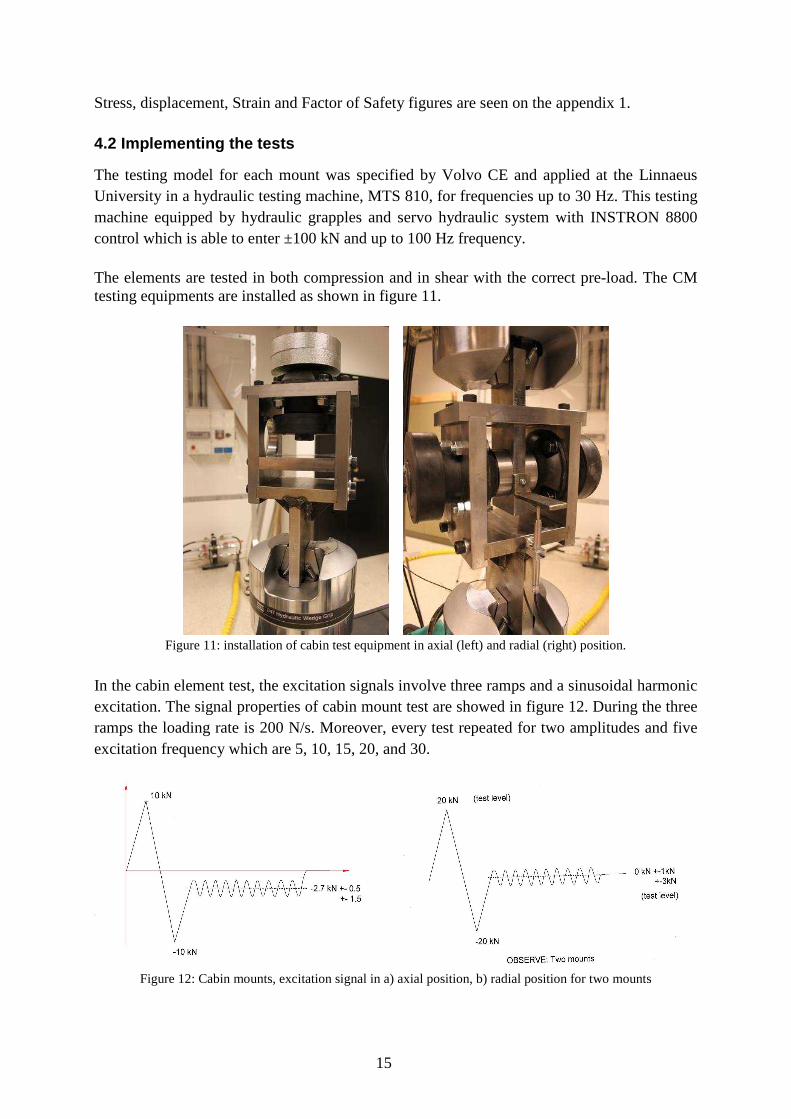
The testing model for each mount was specified by Volvo CE and applied at the Linnaeus University in a hydraulic testing machine, MTS 810, for frequencies up to 30 Hz. This testing machine equipped by hydraulic grapples and servo hydraulic system with INSTRON 8800 control which is able to enter ±100 kN and up to 100 Hz frequency. The elements are tested in both compression and in shear with the correct pre-load. The CM testing equipments are installed as shown in figure 11.
Figure 11: installation of cabin test equipment in axial (left) and radial (right) position.
In the cabin element test, the excitation signals involve three ramps and a sinusoidal harmonic excitation. The signal properties of cabin mount test are showed in figure 12. During the three ramps the loading rate is 200 N/s. Moreover, every test repeated for two amplitudes and five excitation frequency which are 5, 10, 15, 20, and 30.
Figure 12: Cabin mounts, excitation signal in a) axial position, b) radial position for two mounts
16
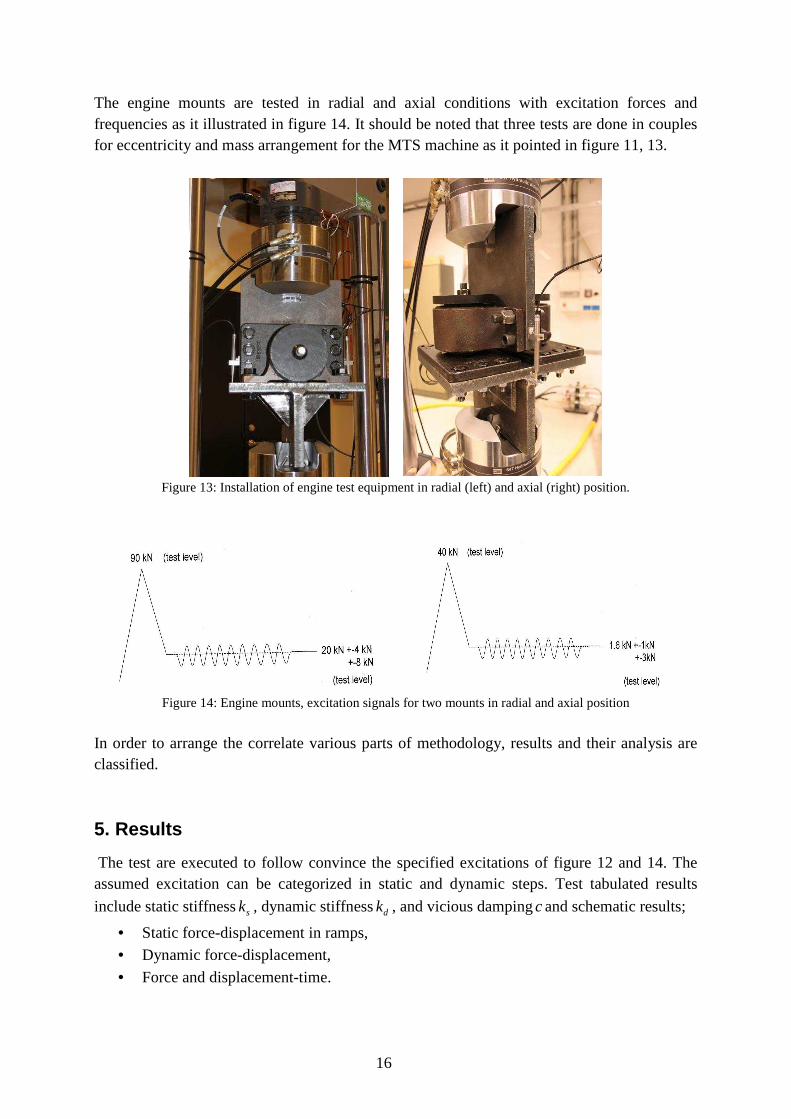
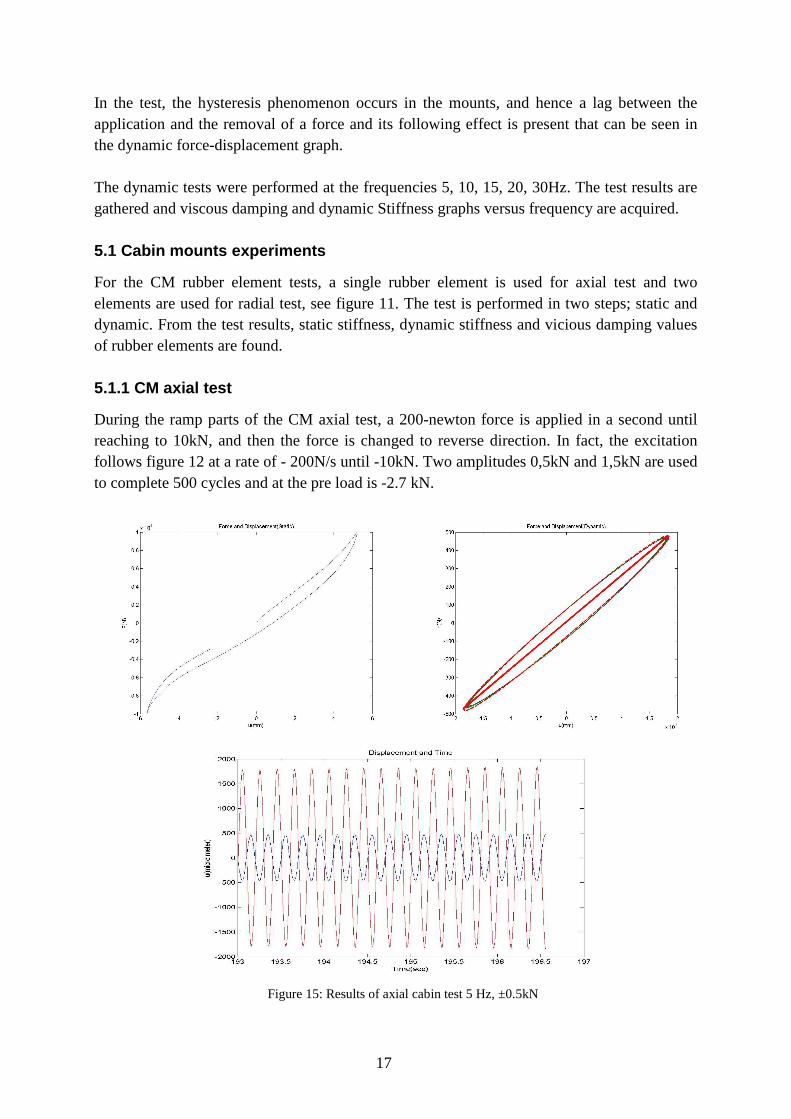
The engine mounts are tested in radial and axial conditions with excitation forces and frequencies as it illustrated in figure 14. It should be noted that three tests are done in couples for eccentricity and mass arrangement for the MTS machine as it pointed in figure 11, 13.
Figure 13: Installation of engine test equipment in radial (left) and axial (right) position.
Figure 14: Engine mounts, excitation signals for two mounts in radial and axial position
In order to arrange the correlate various parts of methodology, results and their analysis are classified.
5. Results
The test are executed to follow convince the specified excitations of figure 12 and 14. The assumed excitation can be categorized in static and dynamic steps. Test tabulated results
include static stiffnesssk , dynamic stiffnessdk , and vicious dampingcand schematic results;
• Static force-displacement in ramps, • Dynamic force-displacement,
• Force and displacement-time.
17
In the test, the hysteresis phenomenon occurs in the mounts, and hence a lag between the application and the removal of a force and its following effect is present that can be seen in the dynamic force-displacement graph. The dynamic tests were performed at the frequencies 5, 10, 15, 20, 30Hz. The test results are gathered and viscous damping and dynamic Stiffness graphs versus frequency are acquired. 5.1 Cabin mounts experiments
For the CM rubber element tests, a single rubber element is used for axial test and two elements are used for radial test, see figure 11. The test is performed in two steps; static and dynamic. From the test results, static stiffness, dynamic stiffness and vicious damping values of rubber elements are found. 5.1.1 CM axial test
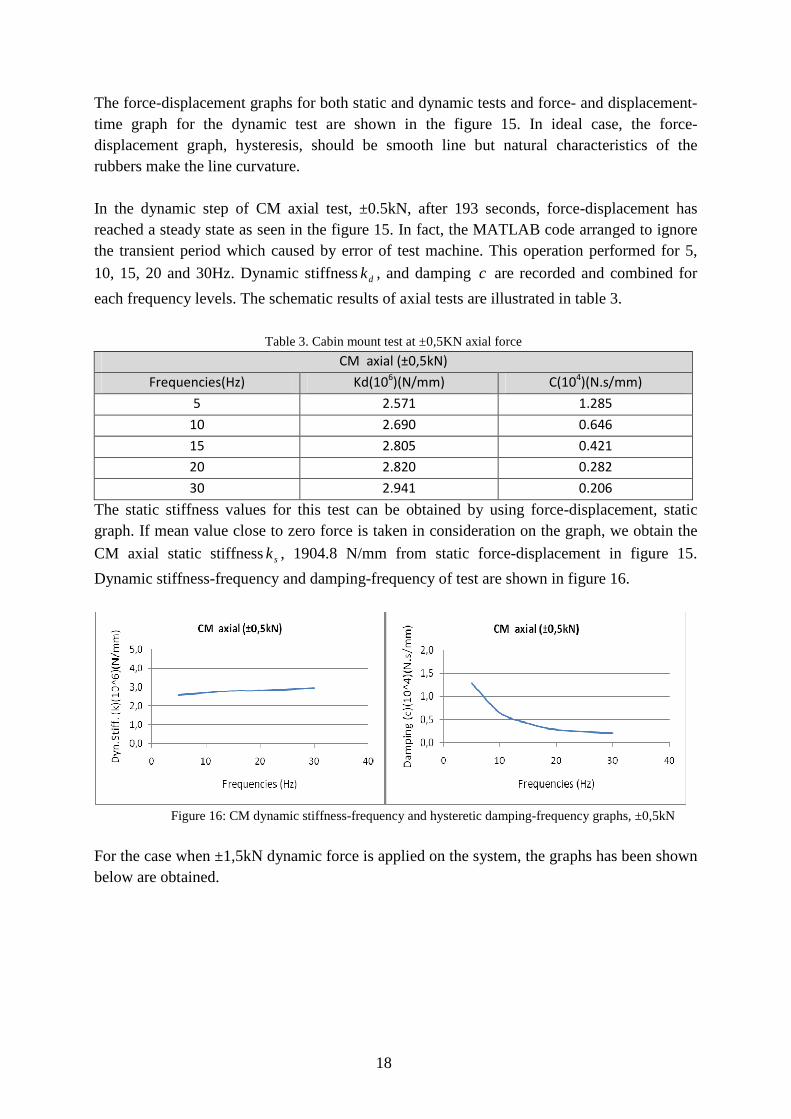
During the ramp parts of the CM axial test, a 200-newton force is applied in a second until reaching to 10kN, and then the force is changed to reverse direction. In fact, the excitation follows figure 12 at a rate of - 200N/s until -10kN. Two amplitudes 0,5kN and 1,5kN are used to complete 500 cycles and at the pre load is -2.7 kN.
Figure 15: Results of axial cabin test 5 Hz, ±0.5kN
18
The force-displacement graphs for both static and dynamic tests and force- and displacement-time graph for the dynamic test are shown in the figure 15. In ideal case, the force-displacement graph, hysteresis, should be smooth line but natural characteristics of the rubbers make the line curvature. In the dynamic step of CM axial test, ±0.5kN, after 193 seconds, force-displacement has reached a steady state as seen in the figure 15. In fact, the MATLAB code arranged to ignore the transient period which caused by error of test machine. This operation performed for 5,
10, 15, 20 and 30Hz. Dynamic stiffnessdk , and damping c are recorded and combined for
each frequency levels. The schematic results of axial tests are illustrated in table 3.
Table 3. Cabin mount test at ±0,5KN axial force
CM axial (±0,5kN)
Frequencies(Hz) Kd(106)(N/mm) C(10
4)(N.s/mm)
5 2.571 1.285
10 2.690 0.646
15 2.805 0.421
20 2.820 0.282
30 2.941 0.206
The static stiffness values for this test can be obtained by using force-displacement, static graph. If mean value close to zero force is taken in consideration on the graph, we obtain the
CM axial static stiffnesssk , 1904.8 N/mm from static force-displacement in figure 15.
Dynamic stiffness-frequency and damping-frequency of test are shown in figure 16.
Figure 16: CM dynamic stiffness-frequency and hysteretic damping-frequency graphs, ±0,5kN
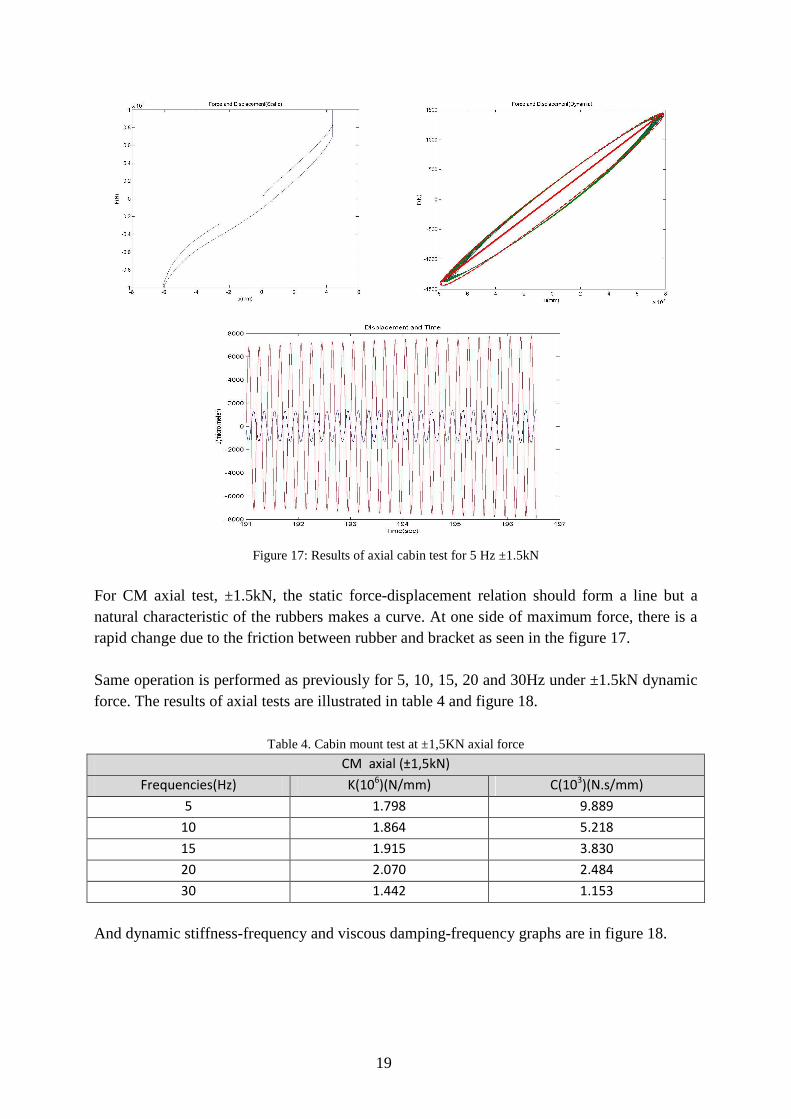
For the case when ±1,5kN dynamic force is applied on the system, the graphs has been shown below are obtained.
19
Figure 17: Results of axial cabin test for 5 Hz ±1.5kN
For CM axial test, ±1.5kN, the static force-displacement relation should form a line but a natural characteristic of the rubbers makes a curve. At one side of maximum force, there is a rapid change due to the friction between rubber and bracket as seen in the figure 17. Same operation is performed as previously for 5, 10, 15, 20 and 30Hz under ±1.5kN dynamic force. The results of axial tests are illustrated in table 4 and figure 18.
Table 4. Cabin mount test at ±1,5KN axial force
CM axial (±1,5kN)
Frequencies(Hz) K(106)(N/mm) C(10
3)(N.s/mm)
5 1.798 9.889
10 1.864 5.218
15 1.915 3.830
20 2.070 2.484
30 1.442 1.153
And dynamic stiffness-frequency and viscous damping-frequency graphs are in figure 18.
20
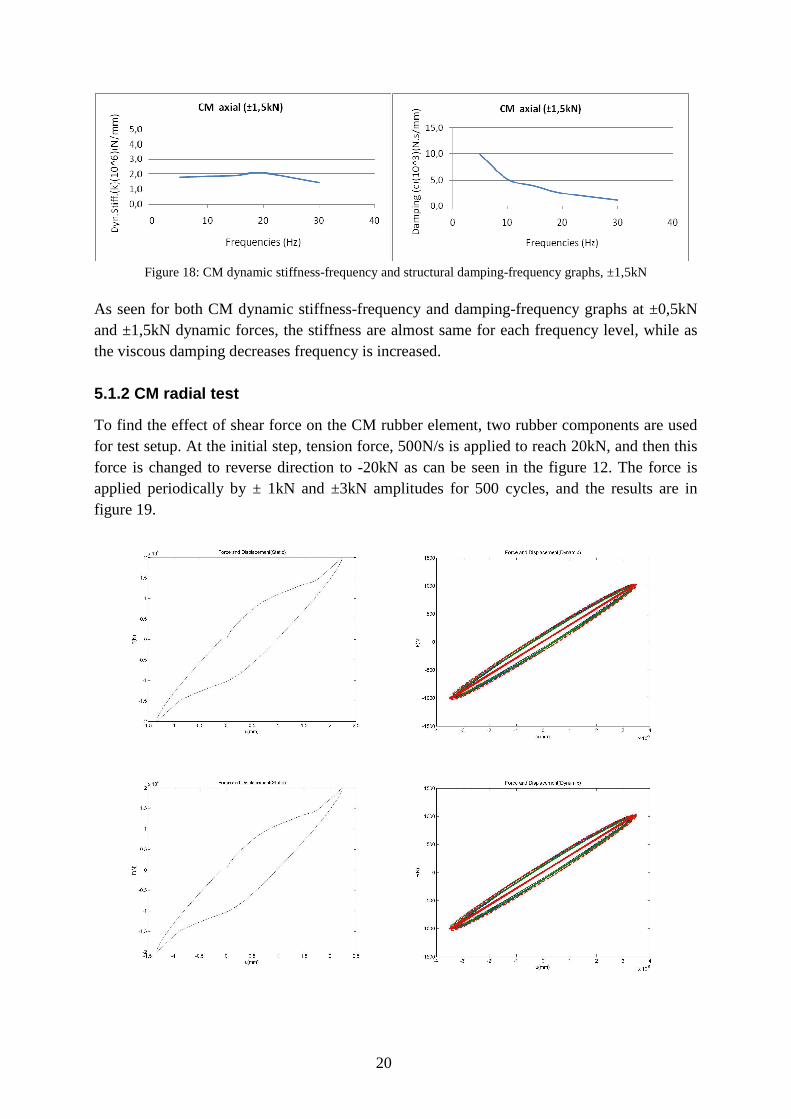
Figure 18: CM dynamic stiffness-frequency and structural damping-frequency graphs, ±1,5kN
As seen for both CM dynamic stiffness-frequency and damping-frequency graphs at ±0,5kN and ±1,5kN dynamic forces, the stiffness are almost same for each frequency level, while as the viscous damping decreases frequency is increased. 5.1.2 CM radial test
To find the effect of shear force on the CM rubber element, two rubber components are used for test setup. At the initial step, tension force, 500N/s is applied to reach 20kN, and then this force is changed to reverse direction to -20kN as can be seen in the figure 12. The force is applied periodically by ± 1kN and ±3kN amplitudes for 500 cycles, and the results are in figure 19.
21
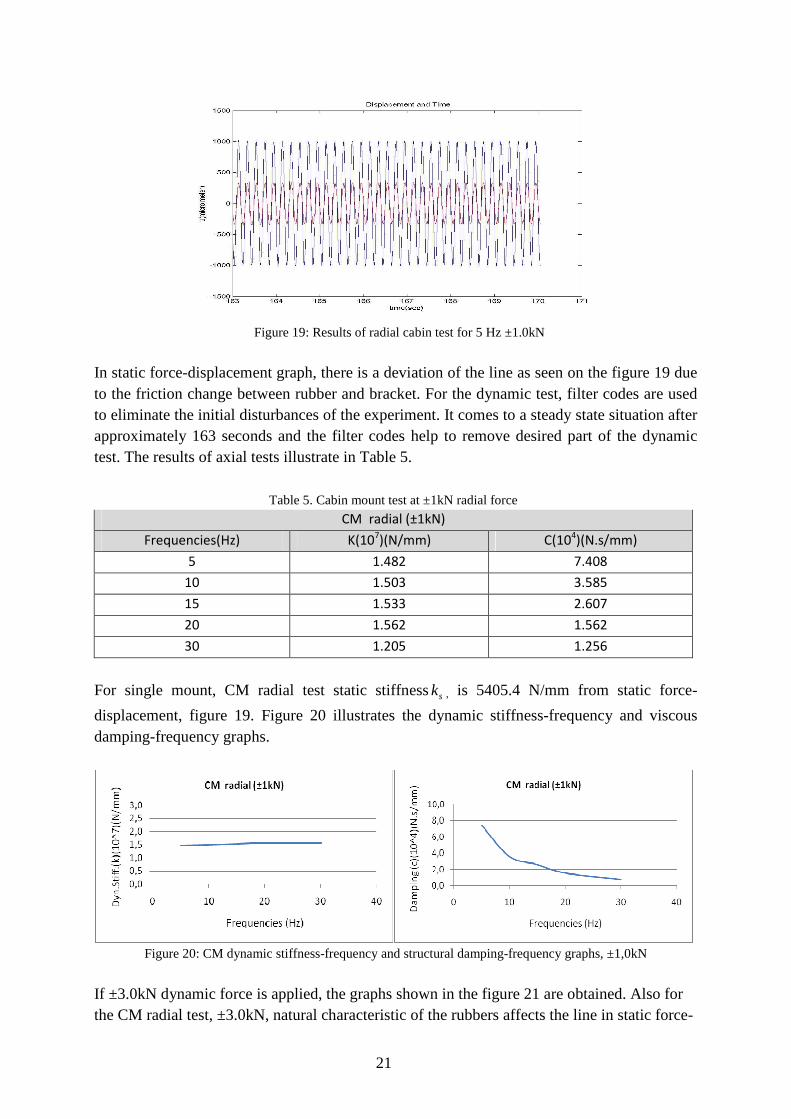
Figure 19: Results of radial cabin test for 5 Hz ±1.0kN
In static force-displacement graph, there is a deviation of the line as seen on the figure 19 due to the friction change between rubber and bracket. For the dynamic test, filter codes are used to eliminate the initial disturbances of the experiment. It comes to a steady state situation after approximately 163 seconds and the filter codes help to remove desired part of the dynamic test. The results of axial tests illustrate in Table 5.
Table 5. Cabin mount test at ±1kN radial force
CM radial (±1kN)
Frequencies(Hz) K(107)(N/mm) C(10
4)(N.s/mm)
5 1.482 7.408
10 1.503 3.585
15 1.533 2.607
20 1.562 1.562
30 1.205 1.256
For single mount, CM radial test static stiffnesssk , is 5405.4 N/mm from static force-
displacement, figure 19. Figure 20 illustrates the dynamic stiffness-frequency and viscous damping-frequency graphs.
Figure 20: CM dynamic stiffness-frequency and structural damping-frequency graphs, ±1,0kN
If ±3.0kN dynamic force is applied, the graphs shown in the figure 21 are obtained. Also for the CM radial test, ±3.0kN, natural characteristic of the rubbers affects the line in static force-
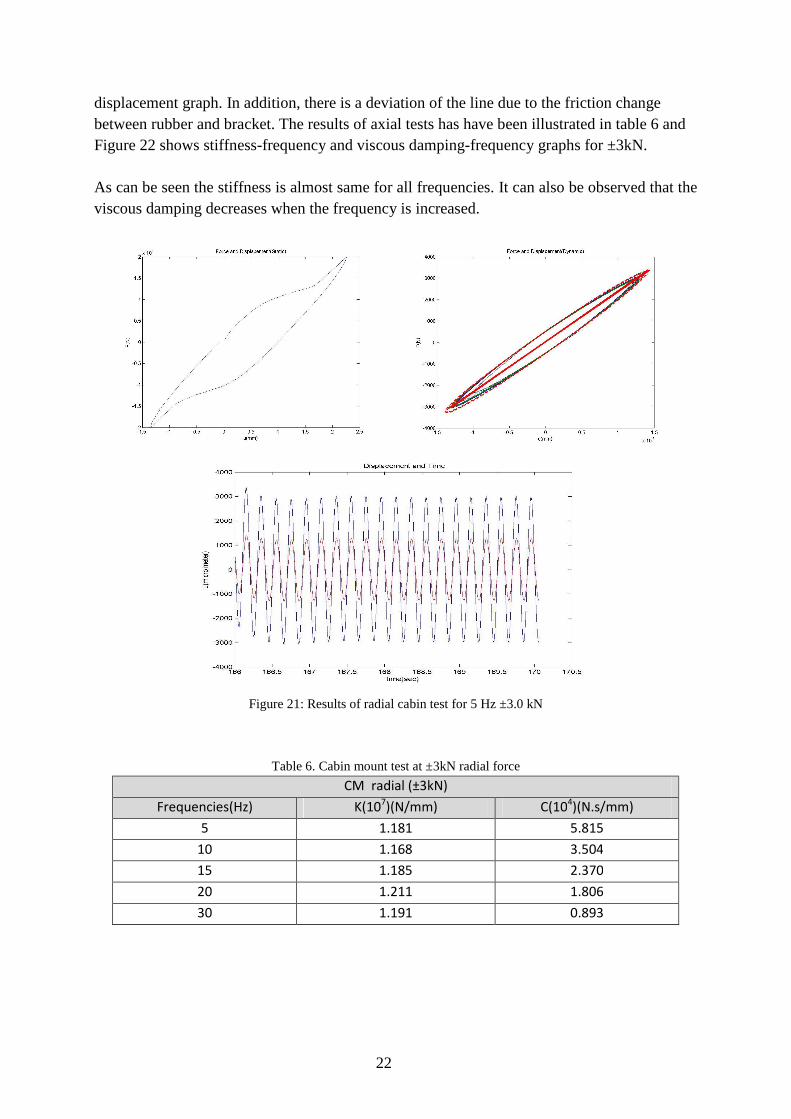
22
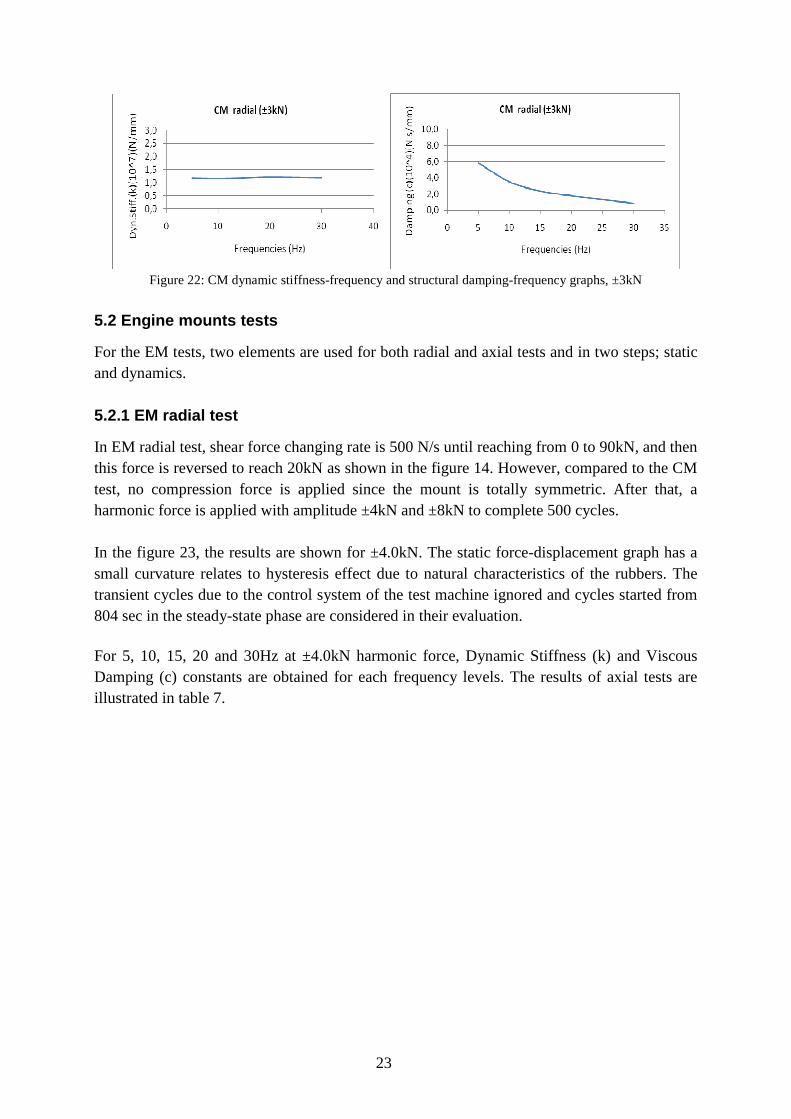
displacement graph. In addition, there is a deviation of the line due to the friction change between rubber and bracket. The results of axial tests has have been illustrated in table 6 and Figure 22 shows stiffness-frequency and viscous damping-frequency graphs for ±3kN. As can be seen the stiffness is almost same for all frequencies. It can also be observed that the viscous damping decreases when the frequency is increased.
Figure 21: Results of radial cabin test for 5 Hz ±3.0 kN
Table 6. Cabin mount test at ±3kN radial force
CM radial (±3kN)
Frequencies(Hz) K(107)(N/mm) C(10
4)(N.s/mm)
5 1.181 5.815
10 1.168 3.504
15 1.185 2.370
20 1.211 1.806
30 1.191 0.893
23
Figure 22: CM dynamic stiffness-frequency and structural damping-frequency graphs, ±3kN
5.2 Engine mounts tests
For the EM tests, two elements are used for both radial and axial tests and in two steps; static and dynamics. 5.2.1 EM radial test
In EM radial test, shear force changing rate is 500 N/s until reaching from 0 to 90kN, and then this force is reversed to reach 20kN as shown in the figure 14. However, compared to the CM test, no compression force is applied since the mount is totally symmetric. After that, a harmonic force is applied with amplitude ±4kN and ±8kN to complete 500 cycles. In the figure 23, the results are shown for ±4.0kN. The static force-displacement graph has a small curvature relates to hysteresis effect due to natural characteristics of the rubbers. The transient cycles due to the control system of the test machine ignored and cycles started from 804 sec in the steady-state phase are considered in their evaluation.
For 5, 10, 15, 20 and 30Hz at ±4.0kN harmonic force, Dynamic Stiffness (k) and Viscous Damping (c) constants are obtained for each frequency levels. The results of axial tests are illustrated in table 7.
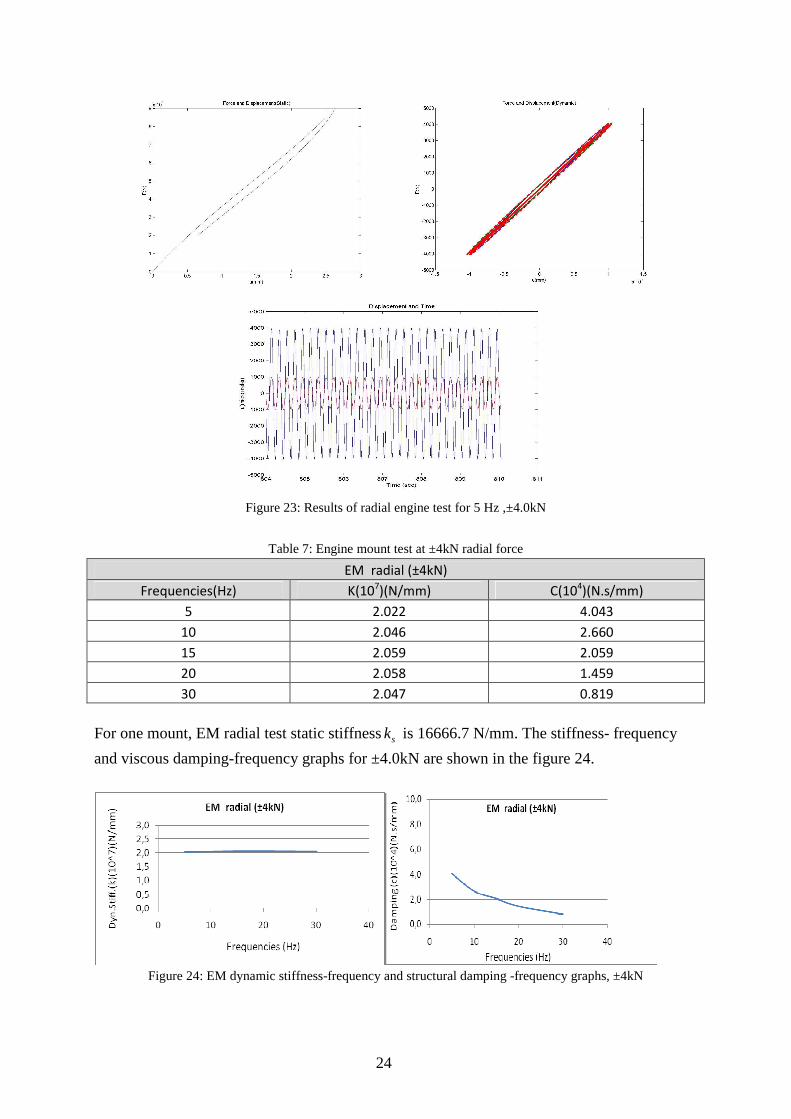
24
Figure 23: Results of radial engine test for 5 Hz ,±4.0kN
Table 7: Engine mount test at ±4kN radial force
EM radial (±4kN)
Frequencies(Hz) K(107)(N/mm) C(10
4)(N.s/mm)
5 2.022 4.043
10 2.046 2.660
15 2.059 2.059
20 2.058 1.459
30 2.047 0.819
For one mount, EM radial test static stiffnesssk is 16666.7 N/mm. The stiffness- frequency
and viscous damping-frequency graphs for ±4.0kN are shown in the figure 24.
Figure 24: EM dynamic stiffness-frequency and structural damping -frequency graphs, ±4kN
25
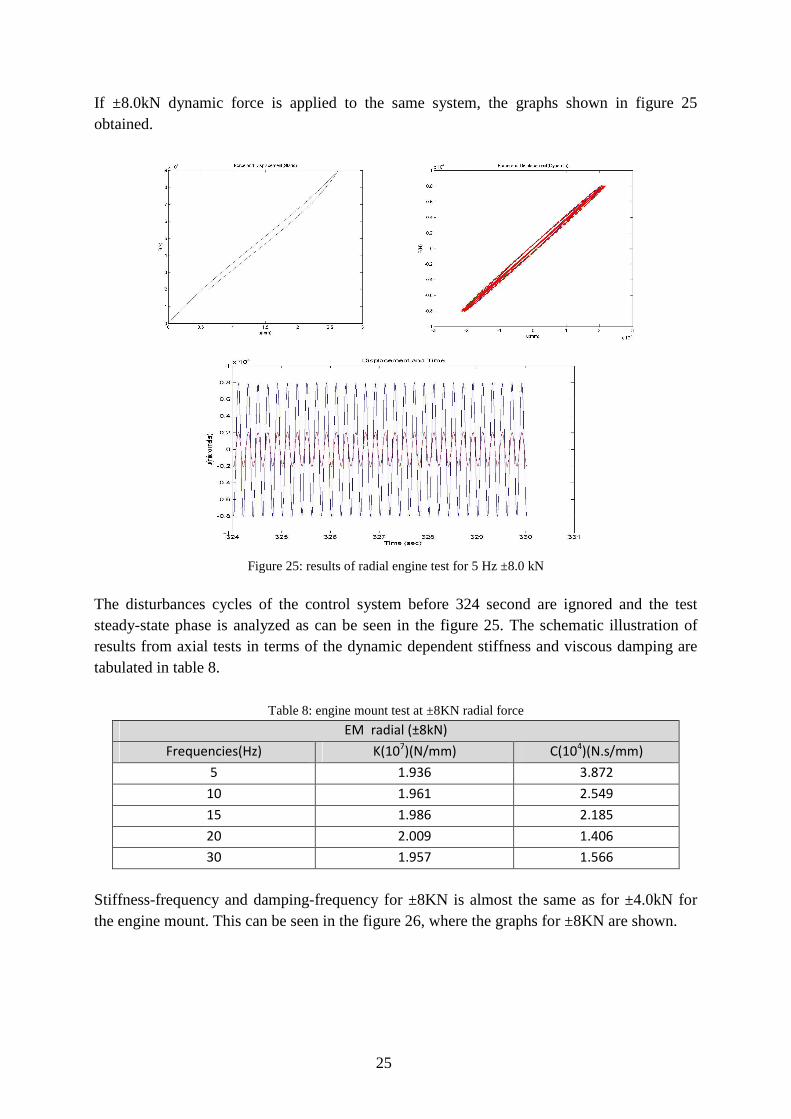
If ±8.0kN dynamic force is applied to the same system, the graphs shown in figure 25 obtained.
Figure 25: results of radial engine test for 5 Hz ±8.0 kN
The disturbances cycles of the control system before 324 second are ignored and the test steady-state phase is analyzed as can be seen in the figure 25. The schematic illustration of results from axial tests in terms of the dynamic dependent stiffness and viscous damping are tabulated in table 8.
Table 8: engine mount test at ±8KN radial force
EM radial (±8kN)
Frequencies(Hz) K(107)(N/mm) C(10
4)(N.s/mm)
5 1.936 3.872
10 1.961 2.549
15 1.986 2.185
20 2.009 1.406
30 1.957 1.566
Stiffness-frequency and damping-frequency for ±8KN is almost the same as for ±4.0kN for the engine mount. This can be seen in the figure 26, where the graphs for ±8KN are shown.
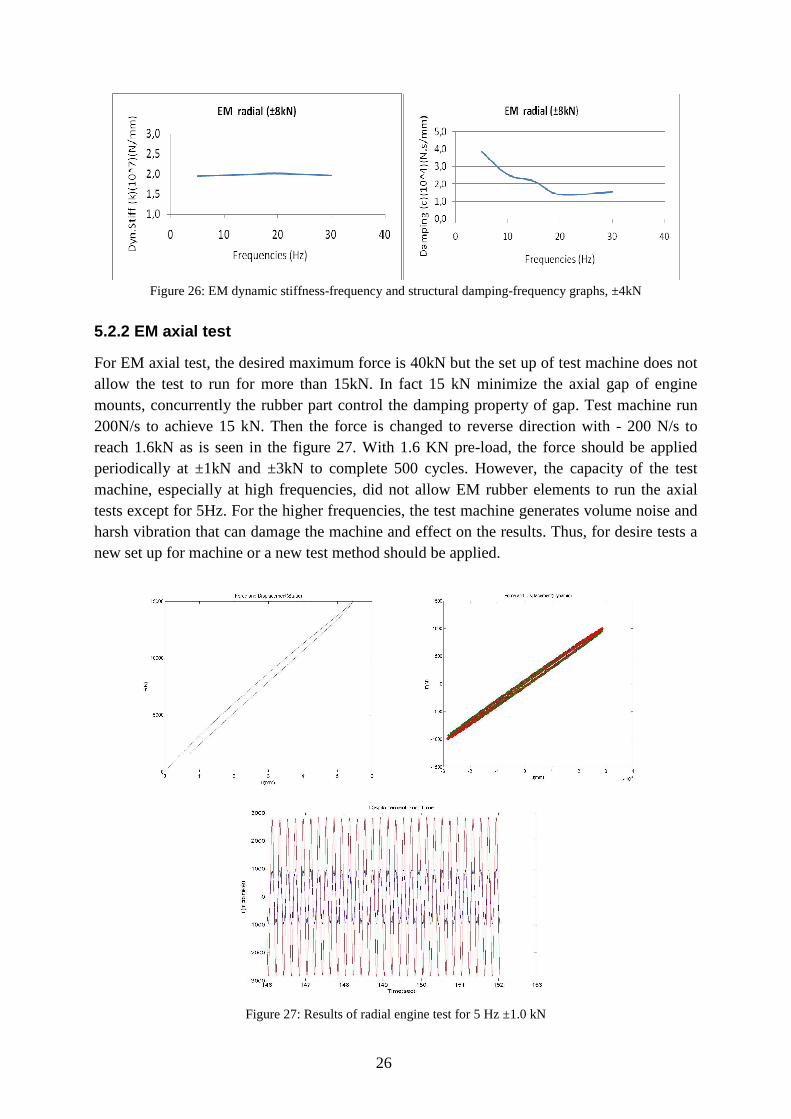
26
Figure 26: EM dynamic stiffness-frequency and structural damping-frequency graphs, ±4kN
5.2.2 EM axial test
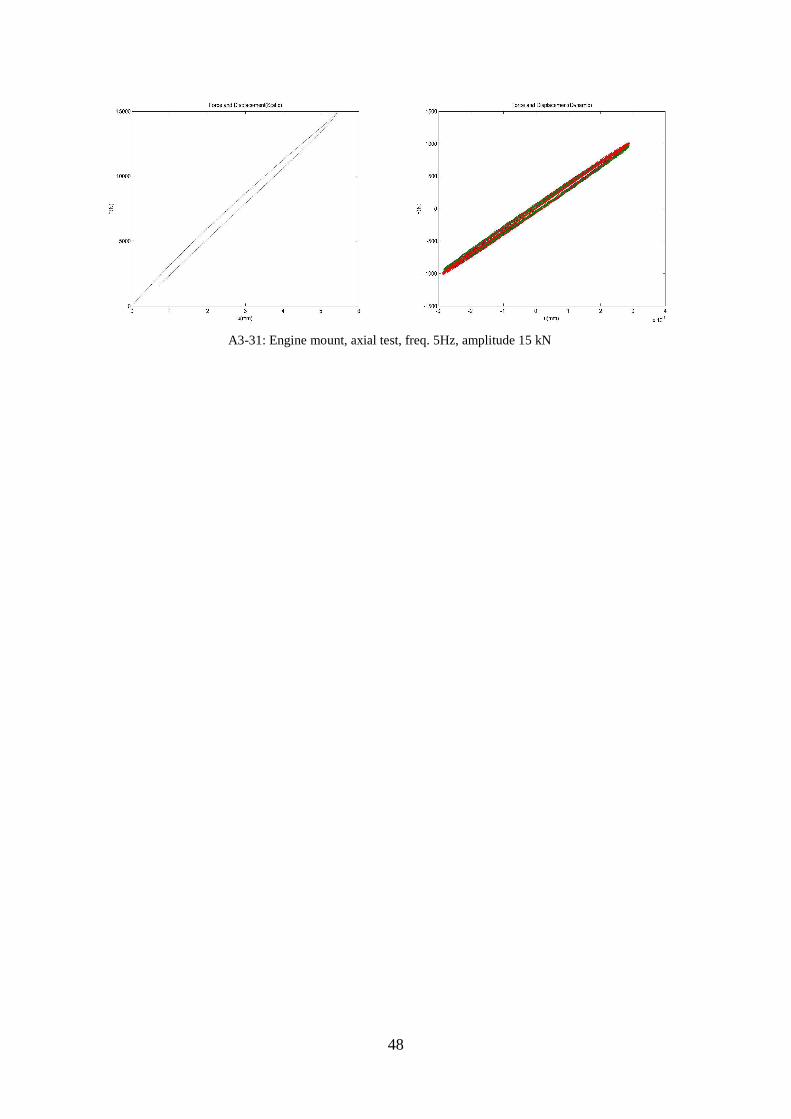
For EM axial test, the desired maximum force is 40kN but the set up of test machine does not allow the test to run for more than 15kN. In fact 15 kN minimize the axial gap of engine mounts, concurrently the rubber part control the damping property of gap. Test machine run 200N/s to achieve 15 kN. Then the force is changed to reverse direction with - 200 N/s to reach 1.6kN as is seen in the figure 27. With 1.6 KN pre-load, the force should be applied periodically at ±1kN and ±3kN to complete 500 cycles. However, the capacity of the test machine, especially at high frequencies, did not allow EM rubber elements to run the axial tests except for 5Hz. For the higher frequencies, the test machine generates volume noise and harsh vibration that can damage the machine and effect on the results. Thus, for desire tests a new set up for machine or a new test method should be applied.
Figure 27: Results of radial engine test for 5 Hz ±1.0 kN
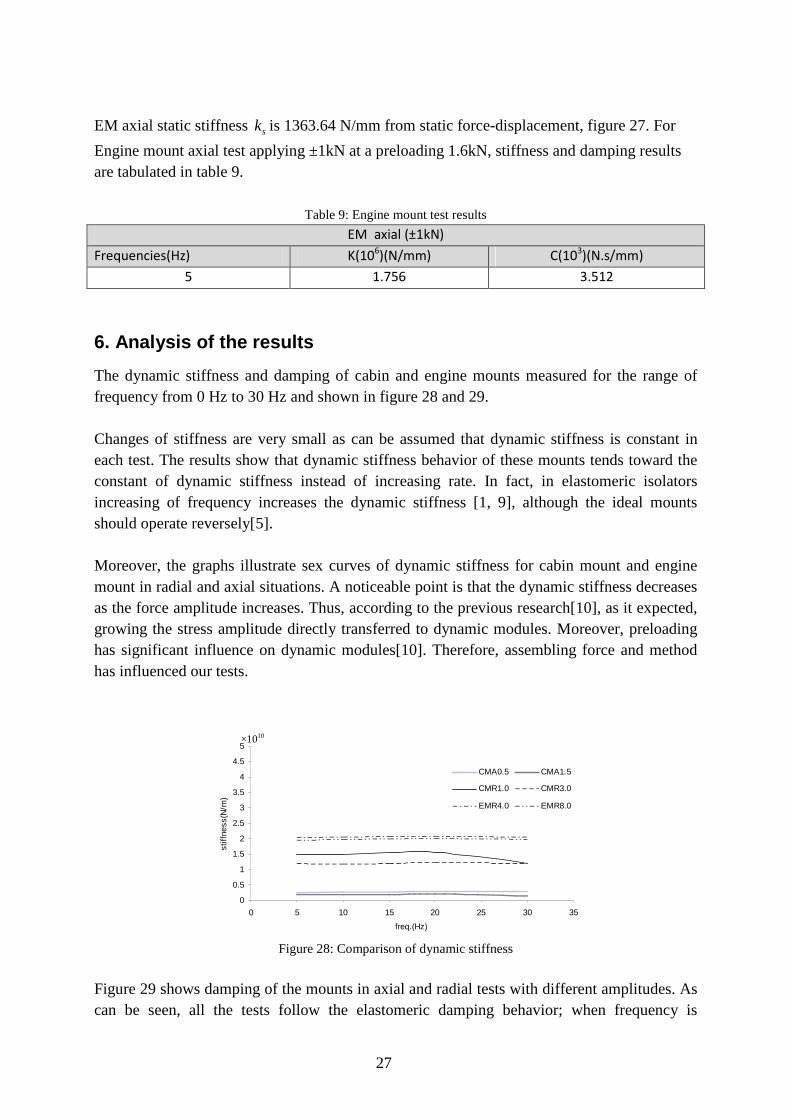
27
EM axial static stiffness sk is 1363.64 N/mm from static force-displacement, figure 27. For
Engine mount axial test applying ±1kN at a preloading 1.6kN, stiffness and damping results are tabulated in table 9.
Table 9: Engine mount test results
EM axial (±1kN)
Frequencies(Hz) K(106)(N/mm) C(10
3)(N.s/mm)
5 1.756 3.512
6. Analysis of the results
The dynamic stiffness and damping of cabin and engine mounts measured for the range of frequency from 0 Hz to 30 Hz and shown in figure 28 and 29. Changes of stiffness are very small as can be assumed that dynamic stiffness is constant in each test. The results show that dynamic stiffness behavior of these mounts tends toward the constant of dynamic stiffness instead of increasing rate. In fact, in elastomeric isolators increasing of frequency increases the dynamic stiffness [1, 9], although the ideal mounts should operate reversely[5]. Moreover, the graphs illustrate sex curves of dynamic stiffness for cabin mount and engine mount in radial and axial situations. A noticeable point is that the dynamic stiffness decreases as the force amplitude increases. Thus, according to the previous research[10], as it expected, growing the stress amplitude directly transferred to dynamic modules. Moreover, preloading has significant influence on dynamic modules[10]. Therefore, assembling force and method has influenced our tests.
0
0.5
1
1.5
2
2.5
3
3.5
4
4.5
5
0 5 10 15 20 25 30 35
freq.(Hz)
stiff
ness
(N/m
)
CMA0.5 CMA1.5
CMR1.0 CMR3.0
EMR4.0 EMR8.0
Figure 28: Comparison of dynamic stiffness
Figure 29 shows damping of the mounts in axial and radial tests with different amplitudes. As can be seen, all the tests follow the elastomeric damping behavior; when frequency is
×1010
28
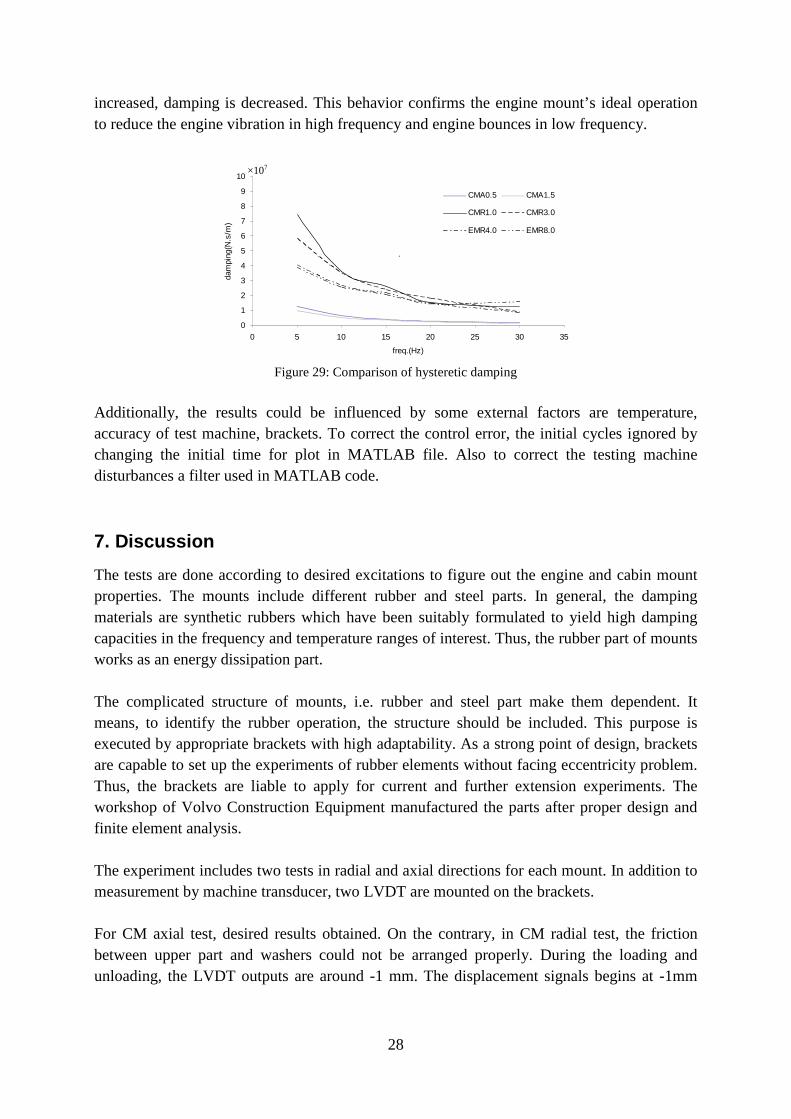
increased, damping is decreased. This behavior confirms the engine mount’s ideal operation to reduce the engine vibration in high frequency and engine bounces in low frequency.
0
1
2
3
4
5
6
7
8
9
10
0 5 10 15 20 25 30 35
freq.(Hz)
dam
ping
(N.s
/m)
CMA0.5 CMA1.5
CMR1.0 CMR3.0
EMR4.0 EMR8.0
.
Figure 29: Comparison of hysteretic damping
Additionally, the results could be influenced by some external factors are temperature, accuracy of test machine, brackets. To correct the control error, the initial cycles ignored by changing the initial time for plot in MATLAB file. Also to correct the testing machine disturbances a filter used in MATLAB code.
7. Discussion
The tests are done according to desired excitations to figure out the engine and cabin mount properties. The mounts include different rubber and steel parts. In general, the damping materials are synthetic rubbers which have been suitably formulated to yield high damping capacities in the frequency and temperature ranges of interest. Thus, the rubber part of mounts works as an energy dissipation part. The complicated structure of mounts, i.e. rubber and steel part make them dependent. It means, to identify the rubber operation, the structure should be included. This purpose is executed by appropriate brackets with high adaptability. As a strong point of design, brackets are capable to set up the experiments of rubber elements without facing eccentricity problem. Thus, the brackets are liable to apply for current and further extension experiments. The workshop of Volvo Construction Equipment manufactured the parts after proper design and finite element analysis. The experiment includes two tests in radial and axial directions for each mount. In addition to measurement by machine transducer, two LVDT are mounted on the brackets. For CM axial test, desired results obtained. On the contrary, in CM radial test, the friction between upper part and washers could not be arranged properly. During the loading and unloading, the LVDT outputs are around -1 mm. The displacement signals begins at -1mm
×107
29
and slide to upper with each cycle in the dynamic test step. In order to correct this error high-pass filtration method was applied in the MATLAB code. EM axial tests could not be implemented property. The test machine capabilities and set up allows tests for 5Hz. When frequency of the test was increased, the machine generates noise and severe vibrations which have negative effects on the test results. Finally, the experiments performed and results tabulated and analyzed. In order to extend the results, some offers are mentioned:
Applying the two dimensional vibration tests with the main installation parts, Extending the tests to high-frequency tests, Applying sine swept frequency test. Indicating the pure properties of rubber to prepare initial information for computer
analyzes. The future studies of this project are enhanced since if it is possible to correlate their results with current experiments.
8. Conclusions
According to the results, it can be concluded: • In all experiments, the stiffness is not frequency dependent, but the damping is frequency-
dependent.
• In all experiments, the damping is frequency dependent with downward trend from low frequency area to high frequency.
• The experiments are influenced by preloading, amplitude. Thus, the dynamic stiffness and mount damping are amplitude dependent as it expected.
30
9. References
1. Yu, Y., N.G. Naganathan, and R.V. Dukkipati, A literature review of automotive vehicle engine mounting systems. Mechanism and Machine Theory, 2001. 36(1): p. 123-142.
2. Jeong, T. and R. Singh, Inclusion of measured frequency- and amplitude-dependent mount properties in vehicle or machinery models. Journal of Sound and Vibration, 2001. 245(3): p. 385-415.
3. Yan, W.-b., et al., Experimental study of engine mount system's vibration characteristics, in Proceedings of the 2009 WRI World Congress on Software Engineering - Volume 032009, IEEE Computer Society. p. 43-46.
4. El Hafidi, A., et al., Vibration reduction on city buses: Determination of optimal position of engine mounts. Mechanical Systems and Signal Processing, 2010. 24(7): p. 2198-2209.
5. Miraei, S.A., et al., Modeling, dynamic analysis and optimization of Budsan truck engine mounts. Applied Science, 2008. 8: p. 13.
6. Ashrafiuon, H., H.T. Wu, and D.A. Swanson, Optimization of aircraft engine suspension systems. Journal of Aircraft,1993 30(6): p. 6.
7. Swanson, D.A. and L. Corp, Active engine mounts for vehicles. International Off-Highway & Powerplant Congress & Exposition, 1993.
8. Craig, R.R. and A.J. Kurdila, Fundamentals of structural dynamics. 2nd Edition ed2006: Wiley. 744.
9. Ripin, Z.M. and O.L. Ean, Dynamic characterization of engine mount at different orientation using sine swept frequency test, in Regional conference on mechanical and aerospace technology2010: Bali. p. 6.
10. Rendek, M. and A. Lion, Amplitude dependence of filler-reinforced rubber: Experiments, constitutive modelling and FEM - Implementation. International Journal of Solids and Structures, 2010. 47(21): p. 2918-2936.
31
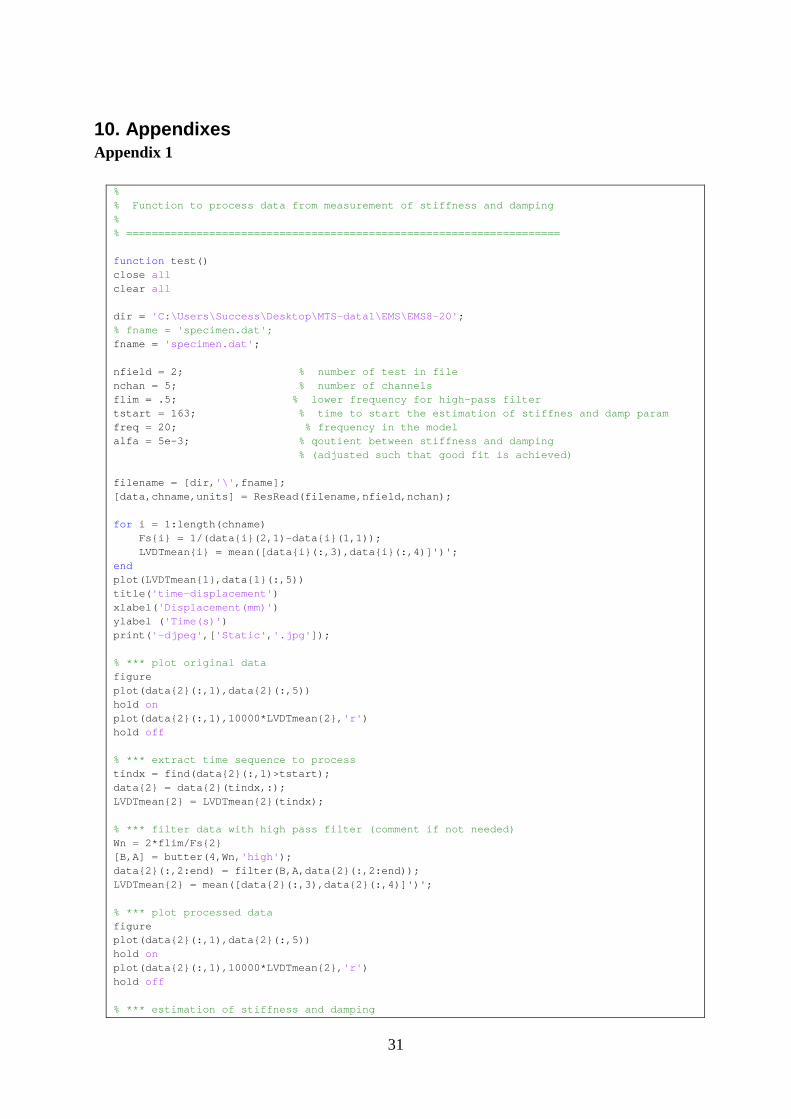
10. Appendixes Appendix 1
% % Function to process data from measurement of sti ffness and damping % % ================================================= =================== function test() close all clear all dir = 'C:\Users\Success\Desktop\MTS-data1\EMS\EMS8-20' ; % fname = 'specimen.dat'; fname = 'specimen.dat' ; nfield = 2; % number of test in file nchan = 5; % number of channels flim = .5; % lower frequency for high-pass filter tstart = 163; % time to start the estimation of stiffnes and dam p param freq = 20; % frequency in the model alfa = 5e-3; % qoutient between stiffness and damping % (adjusted such that good fit is achieved) filename = [dir, '\' ,fname]; [data,chname,units] = ResRead(filename,nfield,nchan ); for i = 1:length(chname) Fsi = 1/(datai(2,1)-datai(1,1)); LVDTmeani = mean([datai(:,3),datai(:,4)]' )'; end plot(LVDTmean1,data1(:,5)) title( 'time-displacement' ) xlabel( 'Displacement(mm)' ) ylabel ( 'Time(s)' ) print( '-djpeg' ,[ 'Static' , '.jpg' ]); % *** plot original data figure plot(data2(:,1),data2(:,5)) hold on plot(data2(:,1),10000*LVDTmean2, 'r' ) hold off % *** extract time sequence to process tindx = find(data2(:,1)>tstart); data2 = data2(tindx,:); LVDTmean2 = LVDTmean2(tindx); % *** filter data with high pass filter (comment if not needed) Wn = 2*flim/Fs2 [B,A] = butter(4,Wn, 'high' ); data2(:,2:end) = filter(B,A,data2(:,2:end)); LVDTmean2 = mean([data2(:,3),data2(:,4)]')'; % *** plot processed data figure plot(data2(:,1),data2(:,5)) hold on plot(data2(:,1),10000*LVDTmean2, 'r' ) hold off % *** estimation of stiffness and damping
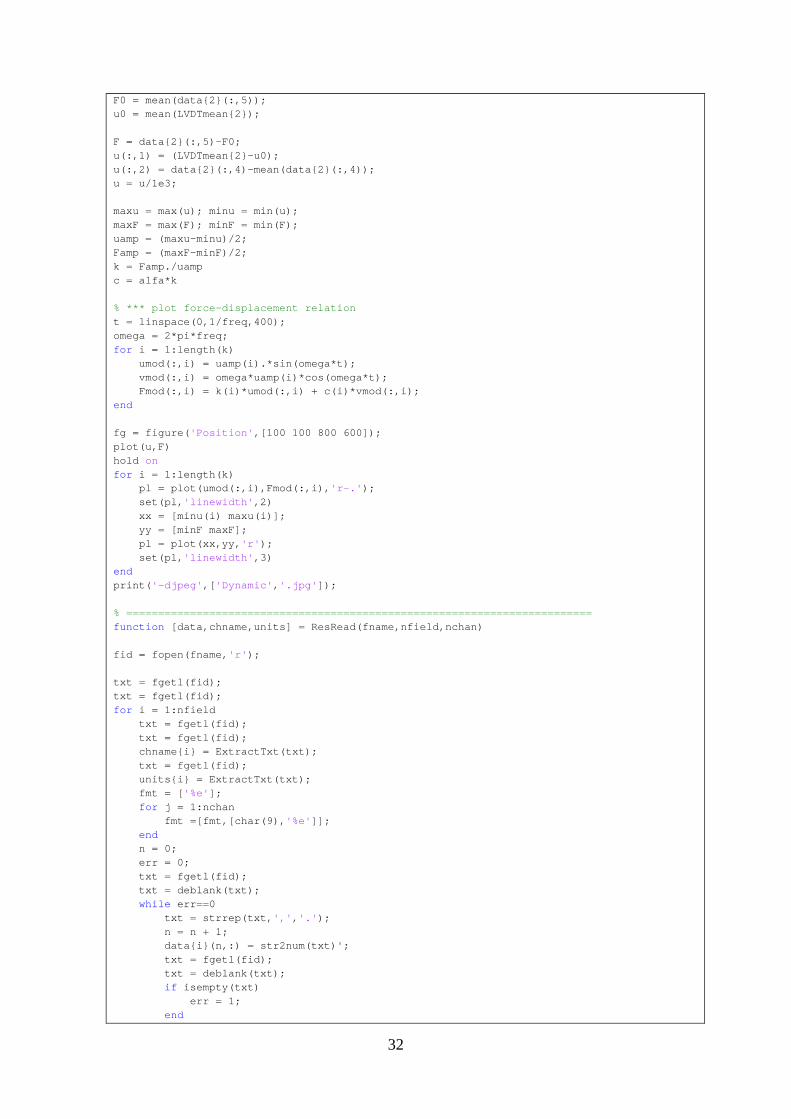
32
F0 = mean(data2(:,5)); u0 = mean(LVDTmean2); F = data2(:,5)-F0; u(:,1) = (LVDTmean2-u0); u(:,2) = data2(:,4)-mean(data2(:,4)); u = u/1e3; maxu = max(u); minu = min(u); maxF = max(F); minF = min(F); uamp = (maxu-minu)/2; Famp = (maxF-minF)/2; k = Famp./uamp c = alfa*k % *** plot force-displacement relation t = linspace(0,1/freq,400); omega = 2*pi*freq; for i = 1:length(k) umod(:,i) = uamp(i).*sin(omega*t); vmod(:,i) = omega*uamp(i)*cos(omega*t); Fmod(:,i) = k(i)*umod(:,i) + c(i)*vmod(:,i); end fg = figure( 'Position' ,[100 100 800 600]); plot(u,F) hold on for i = 1:length(k) pl = plot(umod(:,i),Fmod(:,i), 'r-.' ); set(pl, 'linewidth' ,2) xx = [minu(i) maxu(i)]; yy = [minF maxF]; pl = plot(xx,yy, 'r' ); set(pl, 'linewidth' ,3) end print( '-djpeg' ,[ 'Dynamic' , '.jpg' ]); % ================================================= ======================== function [data,chname,units] = ResRead(fname,nfield,nchan) fid = fopen(fname, 'r' ); txt = fgetl(fid); txt = fgetl(fid); for i = 1:nfield txt = fgetl(fid); txt = fgetl(fid); chnamei = ExtractTxt(txt); txt = fgetl(fid); unitsi = ExtractTxt(txt); fmt = [ '%e' ]; for j = 1:nchan fmt =[fmt,[char(9), '%e' ]]; end n = 0; err = 0; txt = fgetl(fid); txt = deblank(txt); while err==0 txt = strrep(txt, ',' , '.' ); n = n + 1; datai(n,:) = str2num(txt)'; txt = fgetl(fid); txt = deblank(txt); if isempty(txt) err = 1; end

33
end end return % ================================================= ======================== function txts = ExtractTxt(txt) indx = [1 findstr(txt,char(9)) length(txt)]; for j = 1:length(indx)-1 txtsj = txt(indx(j):indx(j+1)); txtsj = strtrim(txtsj); end

34
Appendix 2
A1-1: EM Bracket Base Part Stresses under the Compression Force
A1-2: EM Bracket Base Part Displacements under Compression
35
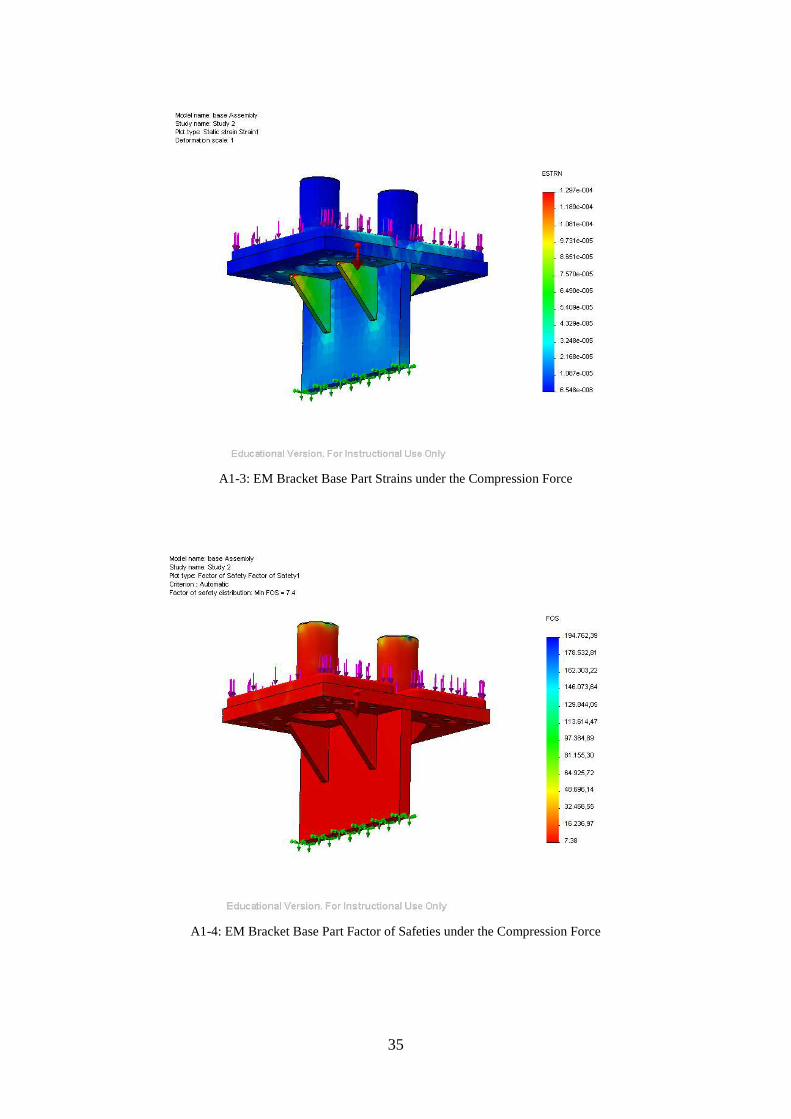
A1-3: EM Bracket Base Part Strains under the Compression Force
A1-4: EM Bracket Base Part Factor of Safeties under the Compression Force
36
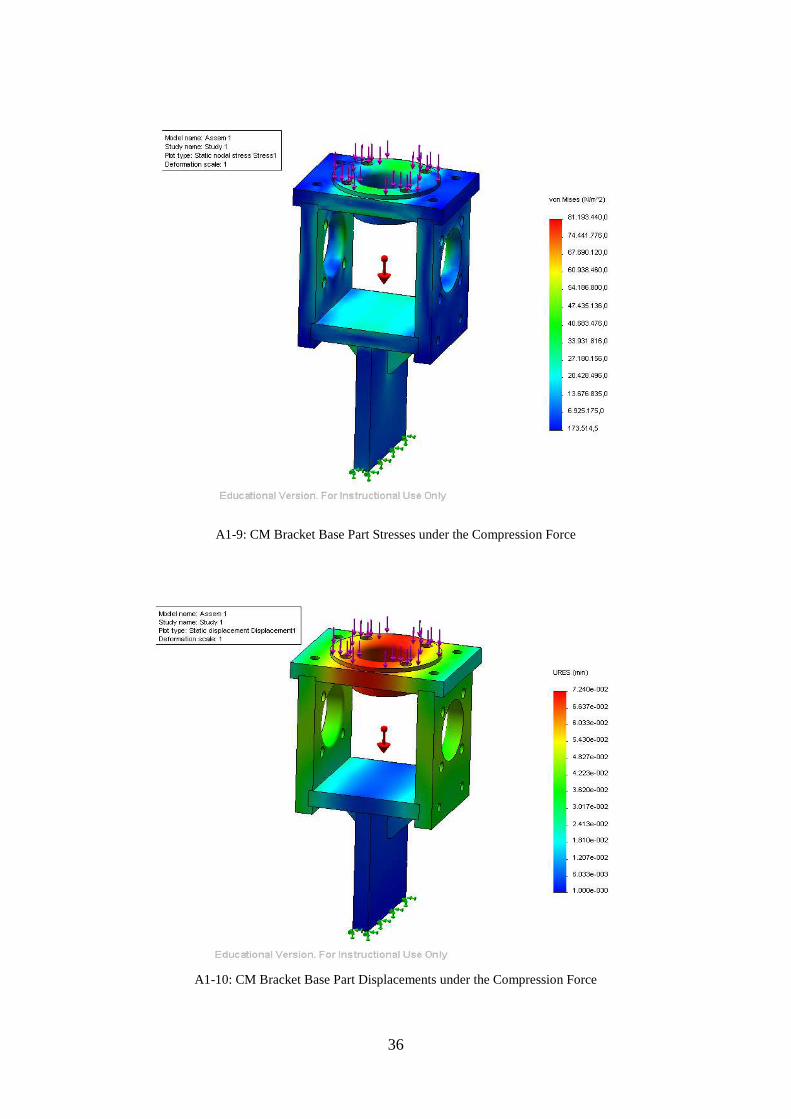
A1-9: CM Bracket Base Part Stresses under the Compression Force
A1-10: CM Bracket Base Part Displacements under the Compression Force
37
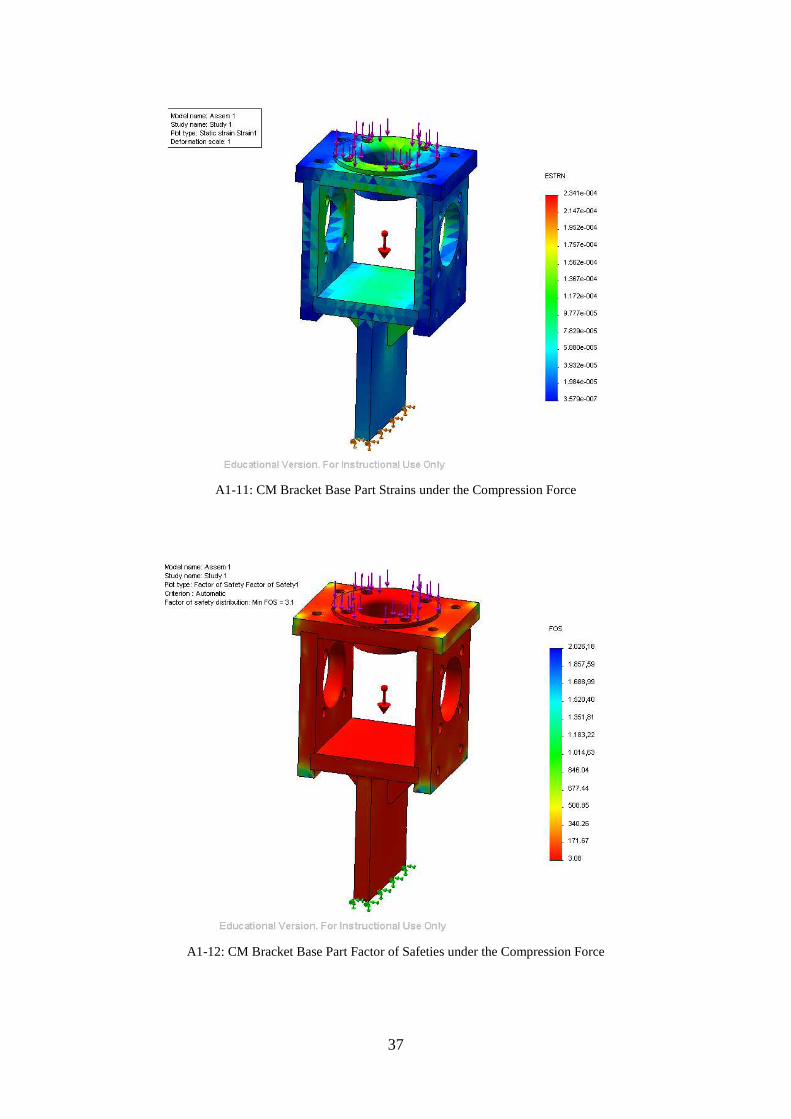
A1-11: CM Bracket Base Part Strains under the Compression Force
A1-12: CM Bracket Base Part Factor of Safeties under the Compression Force
38
Appendix 3
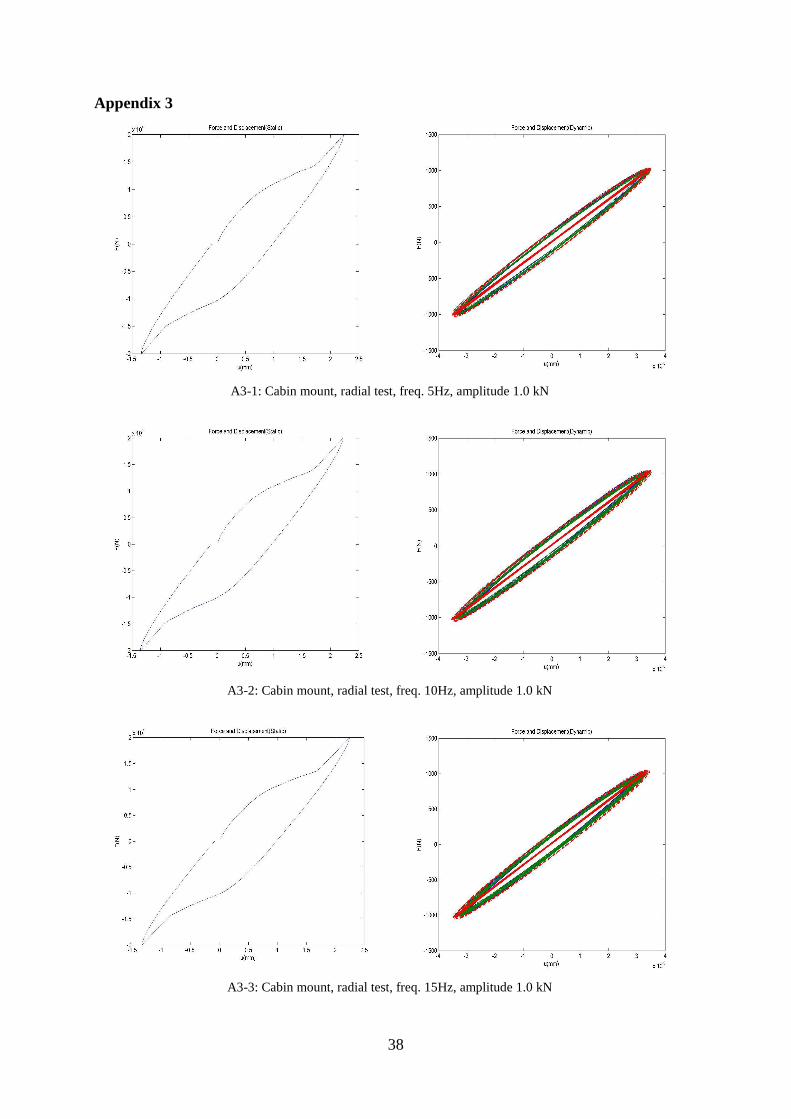
A3-1: Cabin mount, radial test, freq. 5Hz, amplitude 1.0 kN
A3-2: Cabin mount, radial test, freq. 10Hz, amplitude 1.0 kN
A3-3: Cabin mount, radial test, freq. 15Hz, amplitude 1.0 kN
39
A3-4: Cabin mount, radial test, freq. 20Hz, amplitude 1.0 kN
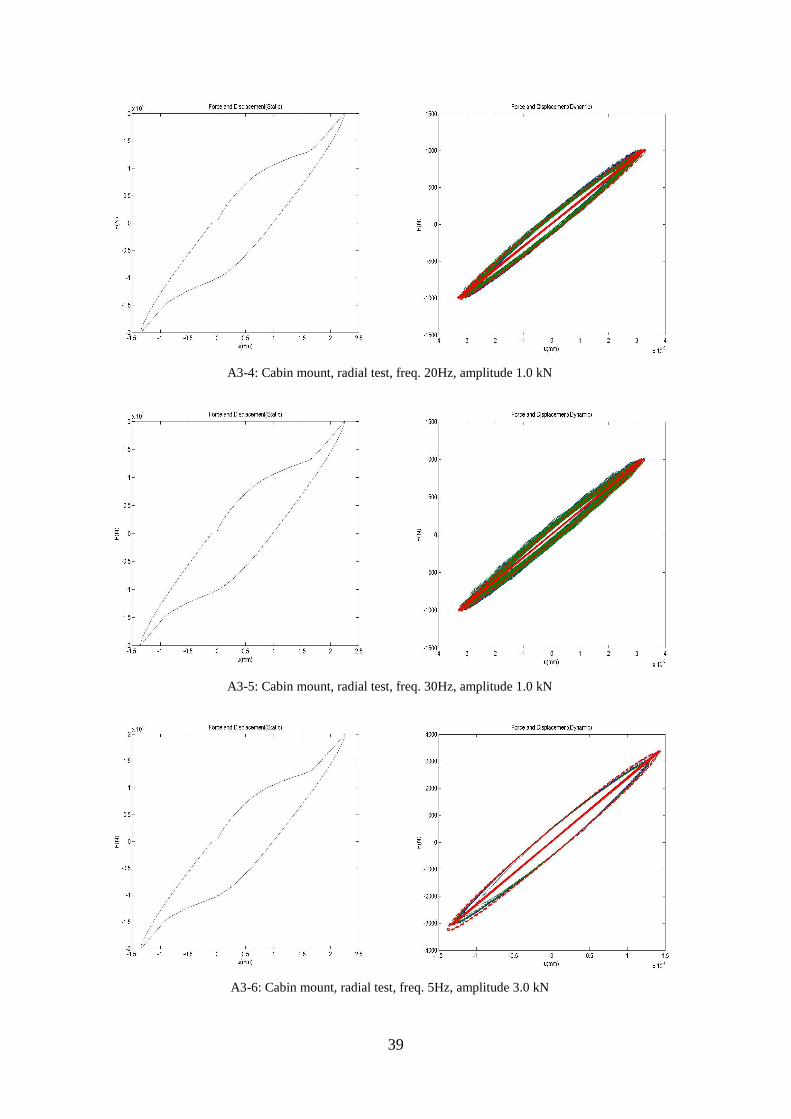
A3-5: Cabin mount, radial test, freq. 30Hz, amplitude 1.0 kN
A3-6: Cabin mount, radial test, freq. 5Hz, amplitude 3.0 kN
40
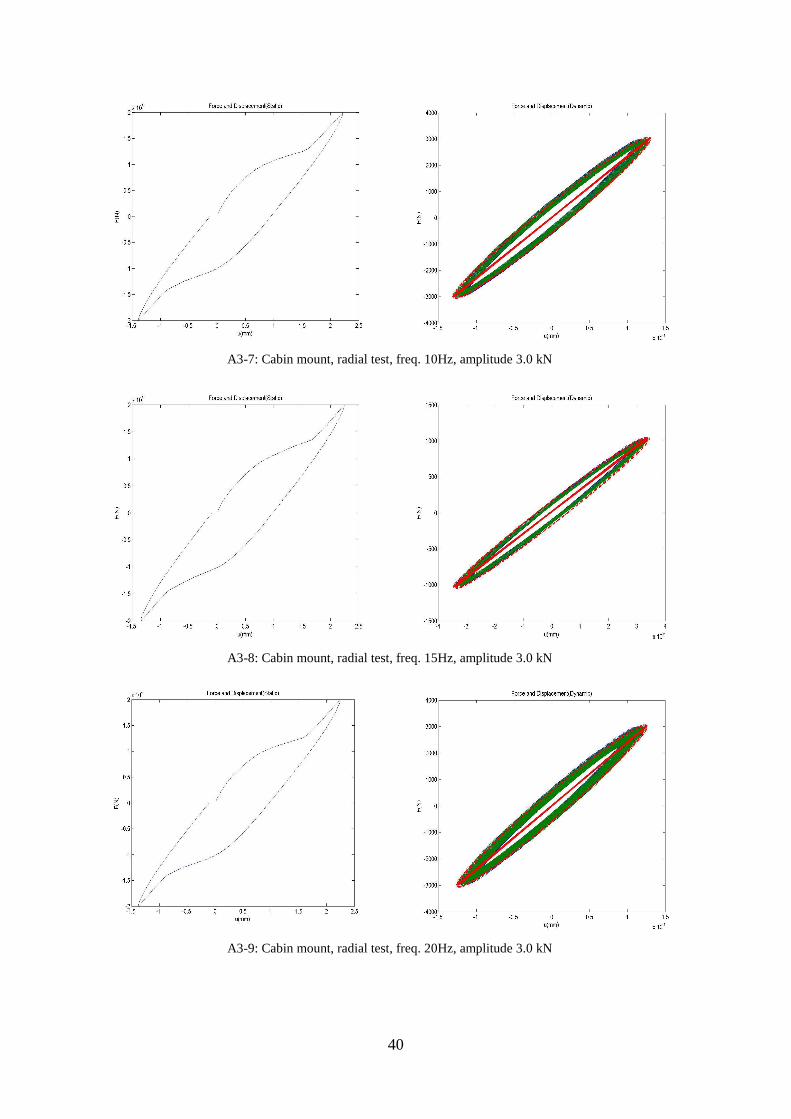
A3-7: Cabin mount, radial test, freq. 10Hz, amplitude 3.0 kN
A3-8: Cabin mount, radial test, freq. 15Hz, amplitude 3.0 kN
A3-9: Cabin mount, radial test, freq. 20Hz, amplitude 3.0 kN
41
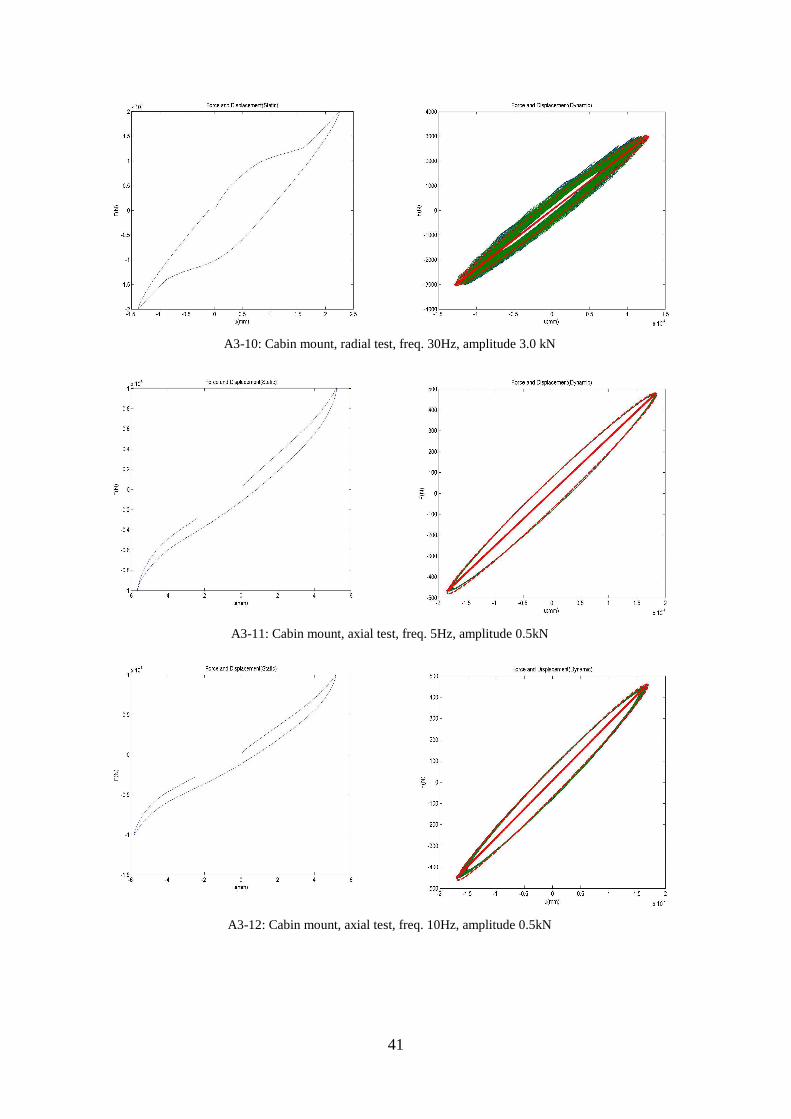
A3-10: Cabin mount, radial test, freq. 30Hz, amplitude 3.0 kN
A3-11: Cabin mount, axial test, freq. 5Hz, amplitude 0.5kN
A3-12: Cabin mount, axial test, freq. 10Hz, amplitude 0.5kN
42
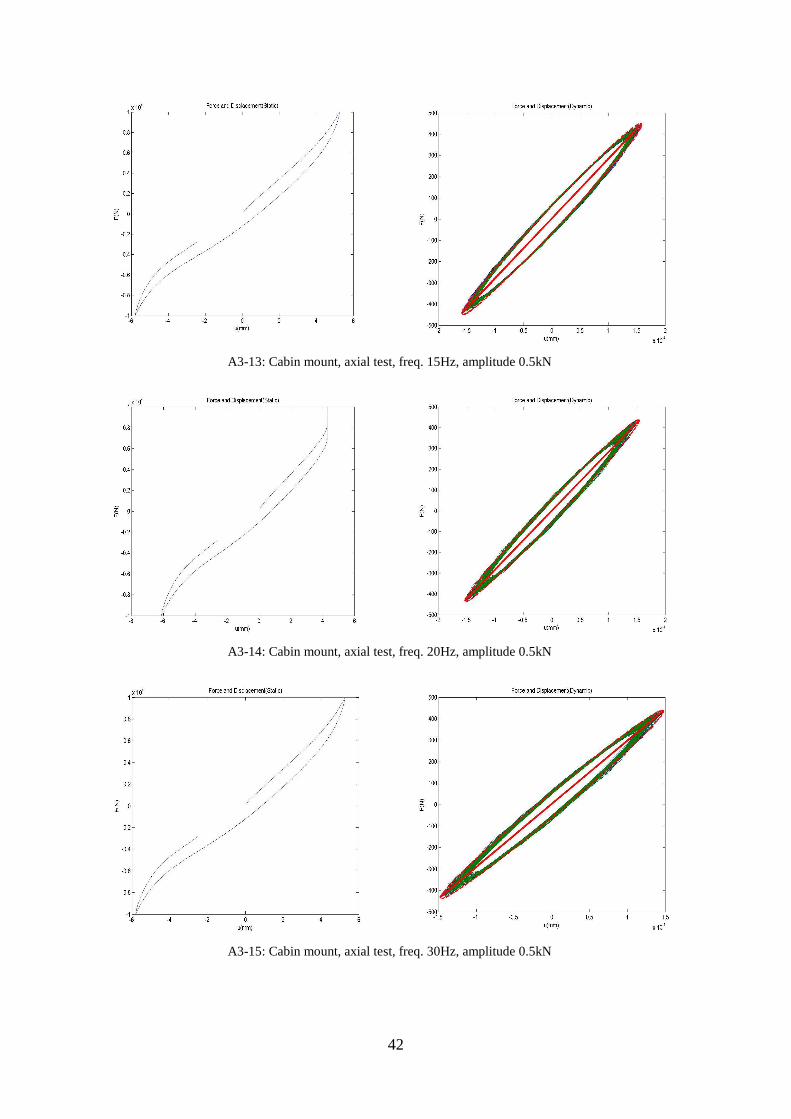
A3-13: Cabin mount, axial test, freq. 15Hz, amplitude 0.5kN
A3-14: Cabin mount, axial test, freq. 20Hz, amplitude 0.5kN
A3-15: Cabin mount, axial test, freq. 30Hz, amplitude 0.5kN
43
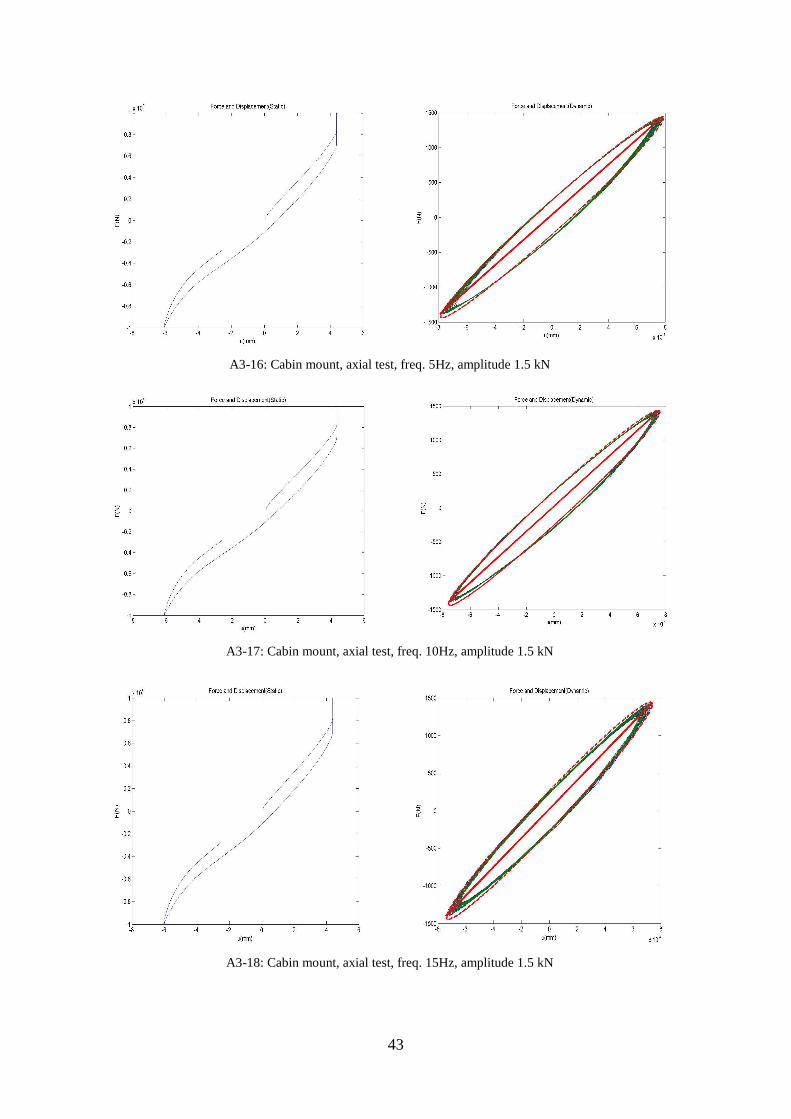
A3-16: Cabin mount, axial test, freq. 5Hz, amplitude 1.5 kN
A3-17: Cabin mount, axial test, freq. 10Hz, amplitude 1.5 kN
A3-18: Cabin mount, axial test, freq. 15Hz, amplitude 1.5 kN
44
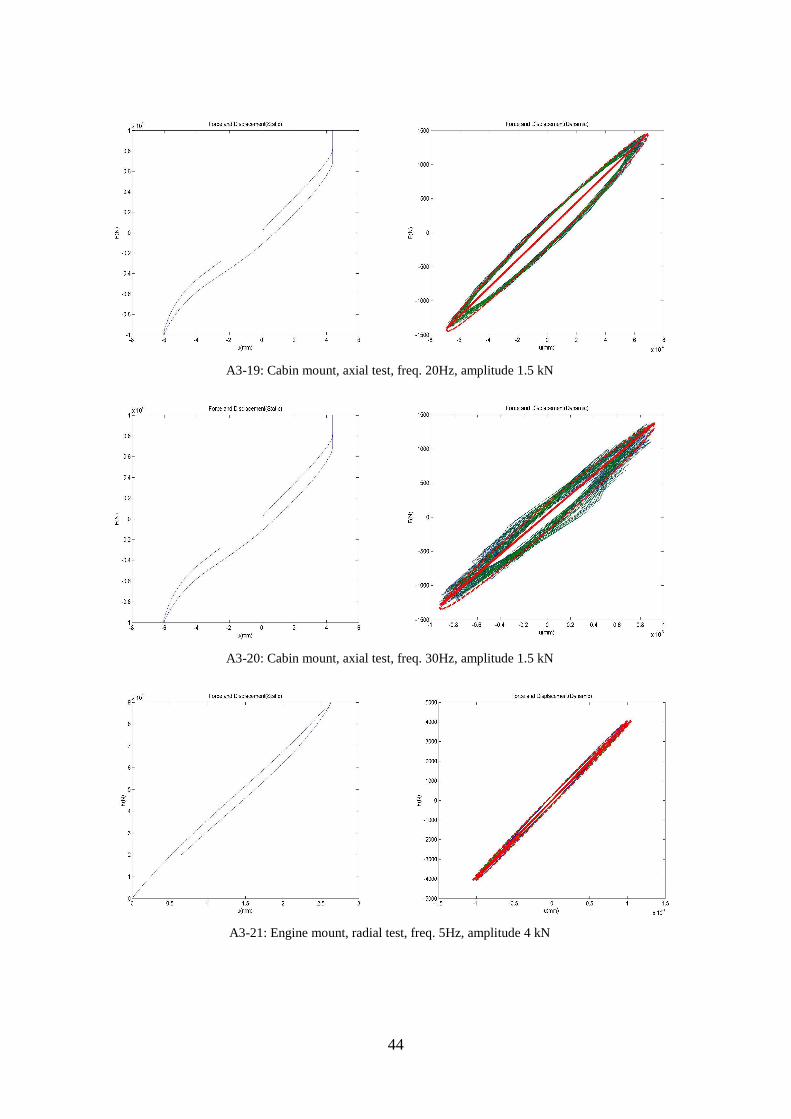
A3-19: Cabin mount, axial test, freq. 20Hz, amplitude 1.5 kN
A3-20: Cabin mount, axial test, freq. 30Hz, amplitude 1.5 kN
A3-21: Engine mount, radial test, freq. 5Hz, amplitude 4 kN
45
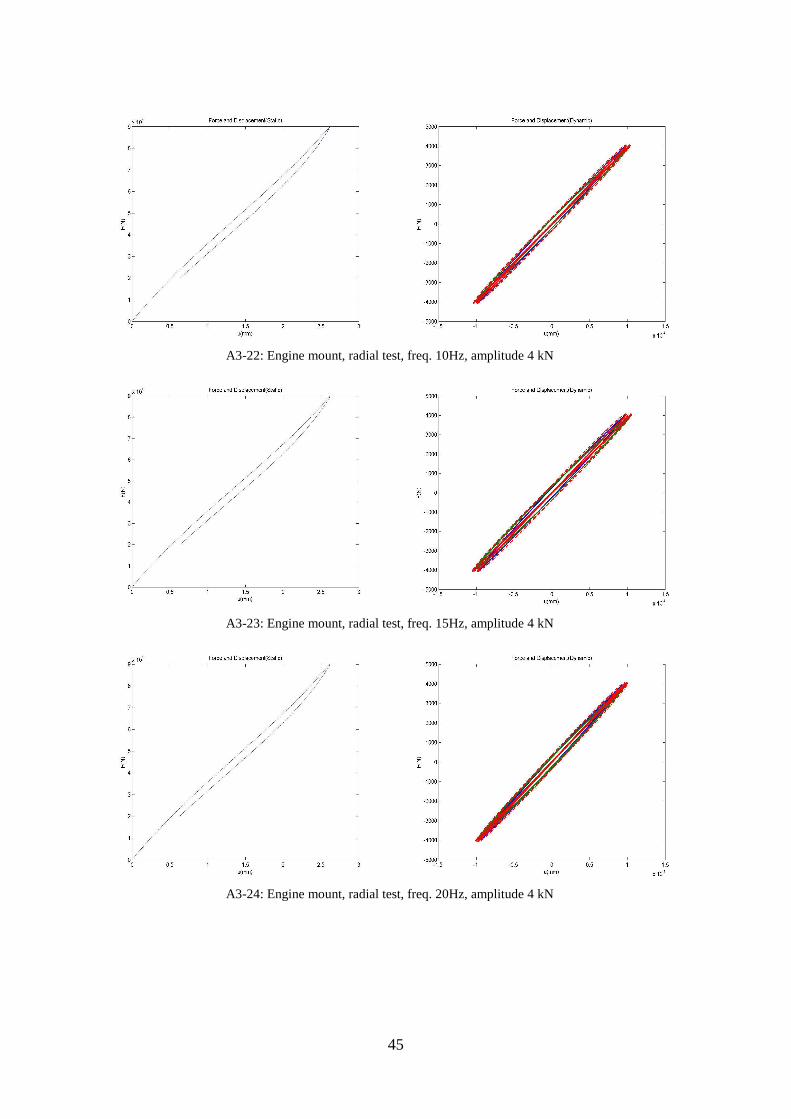
A3-22: Engine mount, radial test, freq. 10Hz, amplitude 4 kN
A3-23: Engine mount, radial test, freq. 15Hz, amplitude 4 kN
A3-24: Engine mount, radial test, freq. 20Hz, amplitude 4 kN
46
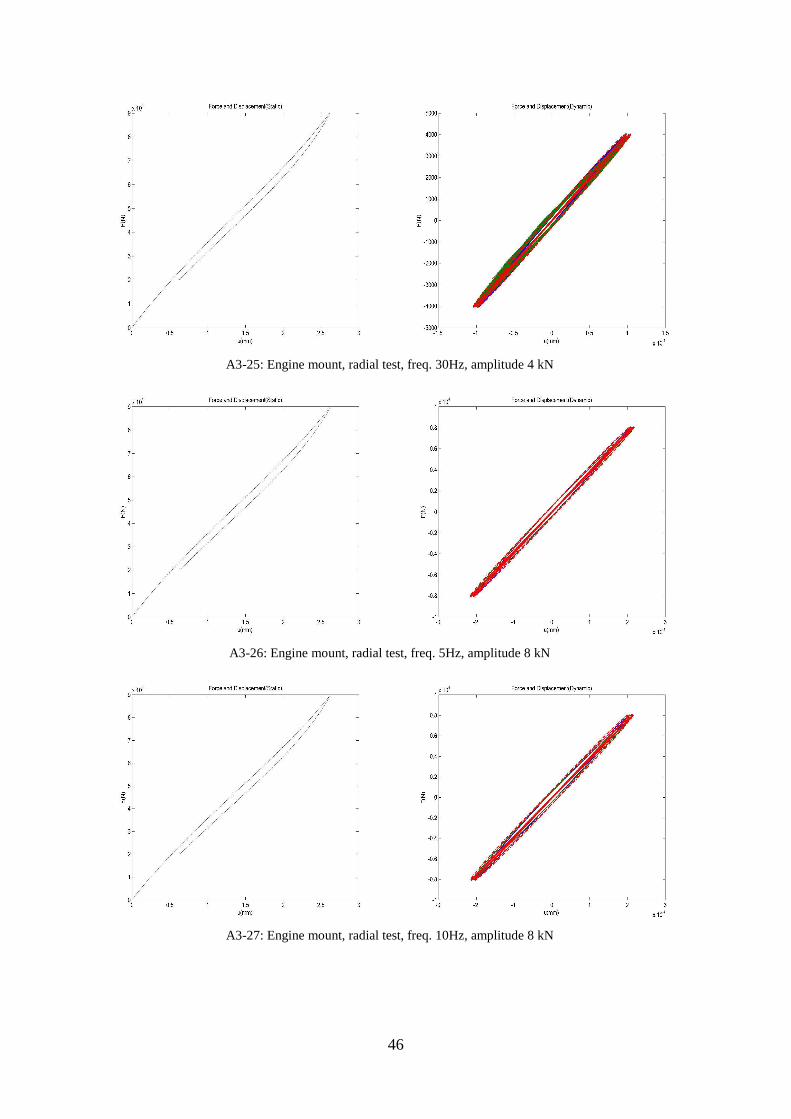
A3-25: Engine mount, radial test, freq. 30Hz, amplitude 4 kN
A3-26: Engine mount, radial test, freq. 5Hz, amplitude 8 kN
A3-27: Engine mount, radial test, freq. 10Hz, amplitude 8 kN
47
A3-28: Engine mount, radial test, freq. 15Hz, amplitude 8 kN
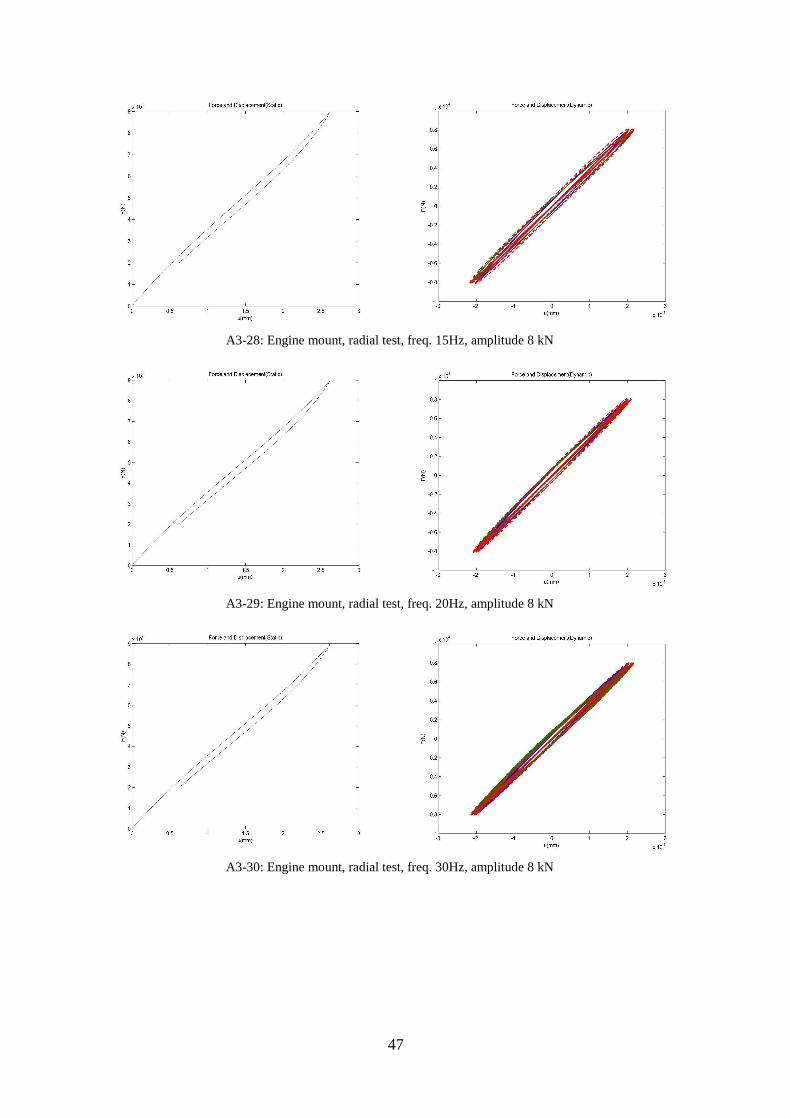
A3-29: Engine mount, radial test, freq. 20Hz, amplitude 8 kN
A3-30: Engine mount, radial test, freq. 30Hz, amplitude 8 kN
48
A3-31: Engine mount, axial test, freq. 5Hz, amplitude 15 kN