Embed Size (px)
Citation preview

Experimental Study of Wall Shear Stress Modification by Surface Coating:
Pressure Drop Measurements in a Rectangular Channel
Justin Edward Dominic
Thesis submitted to the faculty of the Virginia Polytechnic Institute and State University in partial fulfillment of the requirements for the degree of
Master of Science
In
Mechanical Engineering
Pavlos P. Vlachos
John J. Charonko
Thomas E. Diller
31 May 2011
Blacksburg, VA
Keywords: hydrophobicity, wetting, boundary layer, drag reduction

Experimental Study of Wall Shear Stress Modification by Surface Coating:
Pressure Drop Measurements in a Rectangular Channel
Justin Edward Dominic
ABSTRACT
Presented in this paper are experiments to test the hypothesis that drag reduction is possible over hydrophobic surfaces in the Wenzel state during laminar and turbulent flows. Quantification of surface drag reduction in rectangular channel flow over walls with specific hydrophobic or hydrophilic properties was obtained with pressure drop measurements along the channel for a range of Reynolds numbers between 350 and 5900. Several commercially available materials and coatings were chosen in order to span a range of contact angles between 30° and 135°. The results are within the bounds of the theoretical values calculated with the Colebrook equation, and do not show any reduction in wall shear stress as a function of material properties or surface chemistry. The differences between this experiment and others measuring pressure drop over hydrophobic surfaces is the macro-scale conditions and the hydrophobic surfaces being fully wetted. These experiments are further proof of the importance of a liquid-vapor interface for increasing the shear free area to produce drag reduction.

iii
TableofContentsTable of Contents ........................................................................................................................... iii
Table of Figures .............................................................................................................................. iv
Table of Tables ................................................................................................................................ v
Nomenclature ................................................................................................................................. vi
Introduction ..................................................................................................................................... 1
Contact Angle ................................................................................................................. 1
Spreading ........................................................................................................................ 4
Previous Drag Reduction Experiments ........................................................................... 5
Experimental Approach ................................................................................................................... 6
Material Characterization ............................................................................................... 7
Channel Design ............................................................................................................... 7
Functional Model .......................................................................................................... 10
Results ........................................................................................................................................... 12
Material Characterization Data ..................................................................................... 12
Experimental Data ........................................................................................................ 14
Data Reduction ............................................................................................................. 14
Range of Uncertainty .................................................................................................... 16
Discussion ..................................................................................................................................... 18
Conclusion ..................................................................................................................................... 19
Bibliography .................................................................................................................................. 21

iv
TableofFiguresFigure 1. A droplet existing in the fully wetted Wenzel state over a rough surface contrasted by a droplet existing in the non-wetted Cassie-Baxter state. .................................................................. 3
Figure 2. Free body diagram at the three phase junction of the S-L-V interface. .......................... 4
Figure 3. Cross sections of the test apparatus showing the different layers at a typical location along the channel and at a pressure tap location. At the bottom of the figure is a scale picture of the channel showing the development length based on the channel height and pressure tap locations........................................................................................................................................... 8
Figure 4. Diagram of the experiment setup, showing the manifolds, pump locations, and sensor locations........................................................................................................................................... 9
Figure 5. A photograph of a water drop on a piece of acrylic coated with WX2100 used to measure the contact angle of the material. .................................................................................... 13
Figure 6. A plot showing the surface roughness of the materials used for the experiment, which were measured using a profilometer. ............................................................................................. 13
Figure 7. A plot of the pressure drop along the channel as a function of the flow rate. ............... 14
Figure 8. The WSS is plotted as a function of Re number for the different materials. They are bounded by the theoretical WSS, which were calculated using friction factors at temperatures of 20 °C and 30°C. ............................................................................................................................. 15
Figure 9. The WSS was non-dimensionalized using the dynamic pressure to derive the Fanning friction factor. The Fanning friction factor is temperature invariant. ........................................... 16
Figure 10. The uncertainty in WSS as a function of WSS. .......................................................... 17
Figure 11. The uncertainty in Re number as a function of Re number. ....................................... 18

v
TableofTablesTable 1. Summary of the equipment used for the experiment. ....................................................... 9
Table 2. A summary of the surface roughness and contact angle measurements used for classifying the materials. ............................................................................................................... 12

vi
NomenclatureThe following abbreviations will be found in this document.
θC Contact angle
θA Advancing contact angle
θR Receding contact angle
S-L Solid-liquid
S-V Solid-vapor
L-V Liquid-vapor
L-L Liquid-liquid
WSL Adhesion work
γSL Surface tension at solid-liquid interface
γSV Surface tension at solid-vapor interface
γLV Surface tension at liquid-vapor interface
γLL Surface tension at liquid-liquid interface
R Roughness factor
ci Heterogeneous surface coverage
RMS Root mean square
h Channel height
w Channel width
V Average flow rate
Δp Pressure drop
Pressure drop length
uslip Wall slip velocity
b Wall slip length
µ Dynamic viscosity
ρ Density
ν Kinematic viscosity
Shear rate
f Friction factor
fColebrook Friction factor from Colebrook equation
fHaaland Friction factor from Haaland equation
REDh Hydraulic diameter Reynolds number

vii
Dh Hydraulic diameter
ε Roughness height
WSS Wall shear stress
PIV Particle image velocimetry
CNC Computer numerical control
FM Flowmeter
RTD Resistive thermal device
N-S Navier-Stokes
τw Calculated wall shear stress
FFF Fanning friction factor
Δ[] Uncertainty in [] measurement
σ[] Standard deviation in [] measurement
U[] Total uncertainty in []

1
IntroductionControlling drag in a variety of flow conditions is a concept that has been debated and tested for the last two centuries. The slip boundary condition, postulated by Navier, is generally discarded for the simplicity of a no-slip boundary condition in engineering calculations (Choi, Westin, & Breuer, 2003). However, there are no physical principles that support the no-slip boundary condition (Day, 2004). The idea that the slip velocity scales linearly with strain rate is often discussed but has not been fully investigated (Navier, 1823).
Methods of drag control that have been studied include polymer additives, which use small amounts of certain materials added to the liquid to interfere with the turbulent bursting process (Virk, 1975); blowing jets, which alter stagnation-point placement and rotate lift force into the thrust direction (Glauert, Walker, Raymer, & Gregory, 1952); and piezo electrics for active skin control, which produce traveling waves perpendicular to the flow direction (Wehrmann, 1968). Drag reduction using polymer additives is bound by the Prandtl-Karman law and the maximum drag reduction asymptote. Drag reduction from blowing jets is controlled by the jet velocity relative to the bulk velocity. For an active skin method, the drag reduction can be characterized by the traveling wave force, which is a function of the excitation amplitude. However, these methods are limited to the turbulent flow regime. For laminar flows, drag reduction is possible using hydrophobic surfaces or the addition of air bubbles, or air layers (Rothstein, 2010).
ContactAngleThe hydrophobicity of surfaces can be characterized using a parameter called the contact angle, θC, which is the angle tangent to the liquid surface as it intersects the solid surface (Wolf, dos Santos, & Phillippi, 2009). A line drawn at this angle from the solid surface is termed the contact line. Hydrophobic surfaces have a contact angle greater than 90° and conversely hydrophilic surfaces have a contact angle less than 90°. A subdivision of hydrophobic surfaces is super-hydrophobic surfaces, which incorporate micro- or nanoscale surface roughness to obtain contact angles that approach 180°. These surfaces minimize contact with the fluid causing droplet formation. The surface roughness allows for gas to be trapped beneath the liquid creating a shear-free gas-liquid interface (Rothstein, 2010). Super-hydrophobic surfaces can be engineered to produce an apparent wall slip velocity and reduce drag in turbulent and laminar flows (Daniello, Waterhouse, & Rothstein, 2009).
The contact angle is a dynamic value, meaning that a liquid has a range of contact angles bounded by the advancing contact angle, θA, and the receding contact angle, θR (de Gennes, 1985). As θC approaches θA the liquid spreads over the surface because surface tension is not strong enough to maintain that shape. As θC approaches θR the liquid contracts because the liquid surface tension is stronger than the external gas pressure. Surface properties, such as roughness, affect the contact angle, and therefore, the spreading of the liquid over the surface. There are two models that are typically used to describe surface wetting; the Wenzel model is used to describe a fully wetted surface (Wenzel R. N., 1936), and the Cassie-Baxter model is used to describe a partially wetted surface with gas trapped under the liquid (Cassie & Baxter, 1944).

2
Regularly patterned arrays of micro-ridges or micro-posts are one method of inducing the surface roughness necessary for a super-hydrophobic material to operate in the Cassie state. A liquid drop moving on such a surface has very little drag because instead of sliding over the surface it rolls. As the amount of liquid increases beyond the carrying capacity of the material gas trapped under the liquid layer is displaced and the material transitions to the Wenzel state (Rothstein, 2010).
Contact angle theory is a complicated problem because of surface feature and fluid scaling, global versus local effects, and being able to resolve close enough to the three phase junction. Applying this theory to practical systems requires an understanding of the role of surface roughness, and chemical composition of the surface and liquid phases. In 1805, Young discussed fluid cohesion and surface tension to explain the contact angle of a liquid drop in equilibrium on a solid surface (Young, 1805). He stated a relation for the solid-liquid, S-L, solid-vapor, S-V, and liquid-vapor, L-V, interfaces and the curvature of the fluid resting on a horizontal plane as a trigonometric function. A vectorized equation of Young's written word has taken several forms based on the reader's interpretation. For example, a relation between the adhesion work, WSL, and the surface tension of the L-V interface, γLV, as a function of θC can be written as shown in eq. 1 (Pease, 1945). Another relation can be written for the surface tensions of the three interfaces and θC eq. 2 (Bangham & Razouk, 1937).
SL LV CW 1 cos 1
SV SL LV Ccos 2
The first application of Young's equation was used to quantitatively evaluate the characteristics of water proofing agents (Wenzel R. N., 1936). Wenzel studied continuous, solid surfaces and made direct measurements of θA and θR using the tilting plate method. He found that the physical condition of the surface had a more pronounced effect on the water repellency than the surface chemistry. Wenzel concluded that an increase in the surface area results in an increase in the water repellency and modified the Young equation to scale the adhesion tension with a roughness factor, R, eq. 3. R is equal to the contour area divided by the projected area of the wetted surface (R will always be greater than or equal to unity). The adhesion term is often misinterpreted as a measure of the force which holds the solid layer and the adjacent liquid layer together, but can be understood as the force necessary to pull apart the liquid and solid phases (Bangham & Razouk, 1937).
SL SV SL LV CRW R cos
3
The next modification of Young's equation came after Cassie investigated water repellency of porous surfaces. Using a coated wire grid, it was shown that small hysteresis causes a droplet to roll without wetting the surface. To deal with heterogeneous surfaces additional contact angle terms were added to Young's equation as shown in equations 4 & 5. The surface tension is weighted based on what the liquid is in contact with; for example half of the liquid may be on a glass surface and have a low contact angle, while the other half is over porous cavities of air with a high contact angle. When θC is greater than 90° liquid will not penetrate concavities. Porous surfaces are very significant for droplet movement because they exhibit large advancing and receding

contacontr
cos
LV c
Figurdrople
Afterwere RMSof rourebutsurfa(WenmeanexplaequilL-V iof theadhesresist
Anotha onethroucompwhat limitaarbitrequatL-V ttheir 7.
act angles (Crasted in figu
C 1 1c cos
C 1cos c
e 1. A dropletet existing in t
r these expershown durin
S surface heigughness rathttal by Wenzce height an
nzel R. N., 1ning of contaained that theibrium; howis in equilibre system. Tosion. And totance, which
her importane dimensionaugh any positposition presjunction is u
ation to the trary point whtion can be dtension forcerespective su
Cassie & Baxure 1.
2 2c cos
1,SV 1,SL
t existing in ththe non-wetted
riments by Wng experimeghts were us
her than magzel explainednd as of then 949). A des
act angle meere are three
wever, adhesirium the woro recede the o advance thh is the differ
nt item that Pal system. Ttion, which c
sent in the soused as the sthree phase lhere the soliderived, figues at their reurface tensio
xter, 1944).
2 2,SVc
he fully wettedd Cassie-Baxt
Wenzel and Cents in the apsed while chgnitude deterd that the routhere was no
scription of pasurements w
e types of conion work canrk of adhesioL-V interfac
he L-V interfrence betwee
Pease discusThere are an icould encoun
olid. Variousummation pline junctionid, liquid, anure 2, eq. 6. spective inteons, which r
3
Examples o
2,SL
d Wenzel stateter state.
Cassie, a lot pplication of aracterizing
rmined contaughness areao method of problems abowere providntact angle: nnot be calcuon is an exprce requires t
face the liquien the cohes
ssed was treainfinite amonter any surfs adhesion w
point (Pease,n, a free bodynd vapor phaThe forces berfaces. Theesults in a d
f the Wenze
e over a rough
of confusionf what they th
surface rougact angle (Bia has nothingf determiningout the S-L i
ded by (Peaseadvancing, rulated from ression of ththe largest poid has to ovesion and adh
ating the threount of three face roughne
works could , 1945). Undy diagram ca
ases meet andbeing balance forces are derivation of
el and Cassie
4
5
h surface cont
n and misconheorized. Foghness to shikerman, 195g to do with g the roughninterface ande, 1945). Pereceding, anany of them
he minimal eossible meanercome the gesion work.
ee phase linephase line juess or chemibe calculatederstanding an be drawn d a force balced are the Sdirectly propthe Young e
e models are
rasted by a
nceptions or example,
how that type50). A the RMS
ness factor d the ease nd
m. When the energy valuen work of greatest mean
e junction asunctions ical
ed based on this at an
lance -L, S-V, and
portional to equation, eq
e
e
n
s
d
.

Figur
XFSL
SpreDropmethpositiuntil surfapointroughpositi
GibbderivFurthvaliddo wiwhenequalequalenergenergsurfause omanisurfaassum
An exunder
e 2. Free body
X SL SV: F F
SV LV c
eadinglet movemenod of deposiion by advanthe liquid suce intersectit is in equilibhness alone bion, which is
sian thermodve the Younghermore, Johity of the Yoith the terms
n discussing l is when thel. The Youngy (Johnson,gy must be ace energy. T
of terms or thfested in errce tension is
mption that t
xplanation orstanding of
y diagram at t
LVF cos
cos 0
nt and spreaition, surfacencing or receurface area ison satisfies t
brium. Shuttbecause thers also the rea
dynamics, exg equation tohnson discusoung equatios surface tenthe terms of
e adsorption ng equation i 1959). Nex minimum foThird, as canhe physical inors when ints not a compthe Young eq
of solids wettf long range f
the three phas
0
ading, rest poe roughness,eding (Shuttls minimizedthe Young etleworth shore are differeason that spr
xplicitly cono show that itses four reas
on is questionsion and fref the Young of a solvent
is expressed xt, the equilifor constant tn be seen so nterpretationterpreting th
pressive forcequation is in
ting requiresforces, as we
4
se junction of
osition, and c, and whetheleworth & B
d and the conequation, meowed that hyent minima oreading is an
nsidering adst is generallysons for the cned (Bikerme surface enequation. Tt is assumed in terms of brium conditemperature,far there is an of a quanti
he physical me in the surfa
nvalid for a c
s physical chell as fluid d
the S-L-V int
contact angler the dropleBailey, 1948)ntact line aroeaning that thysteresis can on the surfacnisotropic.
sorption andy valid (Johnconfusion of
man, 1950). nergy being uThe only time
to be zero, osurface tensition for a sy, volume, ana lot of confuity. The loo
meaning of qface, which hcontact angle
hemistry, stadynamics (de
terface.
6
7
e are impactet arrived at i). Droplets w
ound the drophe contact anbe caused b
ce depending
d gravity, cannson, 1959).f this subjecThe first reaused interchae that the twotherwise thion not surfa
ystem is that nd mass: not fusion about se definition
quantities. Fhas led to thee of zero.
atistical physe Gennes, 19
ted by the its final will move plet and ngle at any
by surface g on the
n be used to . t and why th
ason has to angeably o terms are ey are not ace free the total frejust the freethe proper
n of terms is inally, e incorrect
sics, an 985). When
he
ee e

5
studying the dynamics of spreading there are problems with experimental designs that must be overcome, such as eliminating hysteresis (with a smooth, homogeneous surface) and choosing simple flow geometry (to eliminate gravity and viscous effects). There are many methods of determining the contact angle between the S-L interface, including photographically using an edge detection method, reflection with liquid prisms, or using a liquid column height in a capillary. Sources of hysteresis are not limited to surface roughness; heterogeneous surfaces also cause hysteresis, contamination of the solid surface, as well as solutes in the liquid phase.
There are two regimes into which fluid spreading can be separated; rolling and melting (de Gennes, 1985). The melting regime is used to describe fluids that tend to slip on solid surfaces, and the rolling regime describes fluids that roll over a solid surface. Applying either type of motion to the fluid at the three phase junction results in a moving contact line. The L-V interface can be substituted by a liquid-liquid, L-L, interface and Young’s equation remains essentially unchanged, eq. 8. Surface tension has been related to fluid viscosity using empirically derived equations (Pelofsky, 1966), and adhesion work is related to surface tension and θC using Young’s equation, eq. 9. Fluid drag on the surface can be quantified using wall shear stress, WSS, or friction factor, f. Since WSS is a function of viscosity, it follows that drag can be described in terms of θC.
1 2 1 2SL SL L L Ccos
8
1 2L LW 1 cos
9
PreviousDragReductionExperimentsA series of experiments performed in hydrophilic and hydrophobic micro-channels with smooth surfaces found a significant difference between the boundary conditions of the two surface types (Choi, Westin, & Breuer, 2003). Using the Hagen-Poiseuille equation with an additional slip flow rate term, shown in eq. 10, they were able to derive a relation for the apparent slip length as a function of shear rate in eq. 11. They observed that apparent slip length increased linearly with shear rate for the smooth, hydrophobic surface.
3
slip
2 wh pV 2hw u
3
10
slip
2
u V hb
2 pwh 3
11
A similar series of experiments was performed with micro-patterned super-hydrophobic surfaces which found laminar drag reduction (Ou, Perot, & Rothstein, 2004). They found that the air-water interface between the micro-features provides a shear-free boundary condition that produces pressure drop reductions of over 40%. An increase in feature spacing and a decrease in channel height were found to increase the effectiveness of these surfaces.
Experiments have been performed with patterned surfaces in micro-channel flow conditions to characterize drag reduction induced by the surface (Daniello, Waterhouse,

6
& Rothstein, 2009). They found significant drag in turbulent flows but no significant drag reduction in laminar flows. Furthermore, they propose that the viscous sublayer thickness is the correct height for the patterned micro-features on the surfaces. They compared their data to theoretical values of pressure drop along a pipe, eq. 12, using the Colebrook equation, eq. 13. The Colebrook equation is an implicit equation relating friction factor, f, to Reynolds number, which can be used in conjunction with the Darcy-Weisbach equation to calculate pressure drop. The Haaland equation, eq. 14, is used to calculate the initial friction factor to put into the Colebrook equation.
Dh
Moody Dhh
9640% laminar flow
Ref
f Re , 15% turbulent flowD
12
h
h10
Colebrook D Colebrook
D1 2.512log
3.7f Re f
13
h
1.11
h10
DHaaland
D1 6.91.8log
3.7 Ref
14
There are discrepancies between these experiments, such as two finding laminar drag reduction using hydrophobic or super-hydrophobic surfaces but the third not finding laminar drag reduction. Additionally, the experiments with the smooth hydrophobic surfaces saw large apparent slip lengths despite the absence of a L-V interface. These experiments were performed in a micro-channel environment, but remain to be tested in macro-scale flows.
This experiment tests the hypothesis that drag reduction is possible over hydrophobic surfaces in the Wenzel state during laminar and turbulent flows. The objectives of the experiment were to: build a test apparatus with interchangeable components to allow the testing of materials with different contact angle properties; develop a method of characterizing the materials' properties for comparison; calculate WSS as a function of Reynolds number, Re, using pressure drop, volumetric flow rate, and temperature measurements; contrast the WSS values for the different materials with each other and with theoretical values derived from the Colebrook equation, using the Haaland equation as the initial input; and develop a plan of action for pursuing future research based on the results.
ExperimentalApproachThe present work presents pressure drop measurements of rectangular channel flow over walls with specific hydrophobic or hydrophilic properties. Several commercially available materials and coatings were chosen in order to span the range of contact angles. A sample of each material and coating was used for characterization purposes since their properties cannot be measured inside of the channel. Wetting properties of the material surfaces were characterized by measuring the fluid contact angle. Contact angle
7
measurements were performed with a digital camera and edge detection software. The material surface roughness heights were measured with a KLA Tencor Alpha-Step IQ profilometer, which has a vertical resolution of 0.012Å. The surface roughness heights did not extend past the viscous sublayer of the flow in order to investigate the effect of surface chemistry on turbulent drag reduction. The viscous sublayer height was calculated using the law of the wall, eq. 15, and the roughness heights are less than one wall unit, y+. y+ was calculated to be 20µm and the maximum surface roughness height measured was 10µm for the WX2100 coated acrylic.
w
uy y y
15
MaterialCharacterizationEach material sample was placed in front of a Nikon D70 digital SLR 6.1 megapixel camera such that the plane of the wetted side is parallel with the horizontal plane. A drop of distilled water was placed on the material with a syringe. Droplet sizes were random, and spanned from small to large to measure advancing and receding contact angles. After photographs were taken for each material for a variety of droplet sizes the images were loaded into MATLAB and the contact angles were measured for each sample. MATLAB measured the contact angles by detecting the edge of the droplet and the horizontal material surface, fitting a curve to those edges, and calculating the angle between the fitted curves.
A clean, dry sample of each material was placed on the stage of the profilometer so that surface roughness heights could be measured. The profile length was set to 5000 µm and the scan speed was set to 200 µm/s using the Tencor software for all of the material samples. The profilometer then acquired the surface profile using a stylus in contact with the sample and recorded the data. The data was plotted using MATLAB and by visual inspection the roughness heights were determined by finding the largest difference between consecutive peaks and valleys.
ChannelDesignThe test apparatus consisted of stacked layers with the channel being a void in the middle of the apparatus as shown in figure 3. The two outside layers were 1/2 in thick acrylic pieces, designed to support the channel and maintain a straight, level cross section. Moving inward, the next two layers were the material surfaces being tested. The top material surface was always glass so that, in the event that particle image velocimetry, PIV, data had to be taken, a laser plane could enter through that layer to illuminate particles within the channel. The final middle layer was the channel spacer, which was a CNC laser cut piece of 3/16 in thick extruded acrylic to set the channel height and width. The layers were bolted together with 1/4 in nylon fasteners, spaced 75 mm apart, in a staggered bolting pattern. The tensile strength of nylon is lower than the compressive strength of acrylic, which means that the bolts will fail before the acrylic layers begin to yield. This helps to prevent over tightening the apparatus and provide an even clamping

forcewas p
Figurthe chchann
The cin an was pwas cin serplatinpressintervfully in tab
The fthree sectiovelocfrictioequat
along the leplaced in a re
e 3. Cross sechannel and at nel showing th
channel was aspect ratio
provided by collected forries with thenum resistanure taps wervals, startingdeveloped f
ble 1.
fluid pumps pumps used
onal area of city of 0.629on factor of tion, the max
ength of the eservoir tank
ctions of the tea pressure tap
he developmen
w = 50.0 mm of 10.5 to 1up to three c
r reuse. Flow channel afte
nce thermomre located at g 660 mm froflow. A sum
are able to pd at once thethe channel 9 m/s, and a0.0401. Usiximum expe
channel. Fok and subme
est apparatus p location. Atnt length based
m wide and . Distilled w
centrifugal pw rate was mer the chann
meter, RTD, ithe center o
om the channmmary of the
push the fluid maximum fis 238.125 m
a maximum Ring this infor
ected pressur
8
or the duratioerged in the f
showing the dthe bottom of
d on the chann
h ≈ 4.7 mm water was uspumps and afmeasured by nel exit. Fluiimmersed in of the side wanel inlet to eequipment u
d at rates upflow rate shomm2 resultinRe number ormation alonre drop along
on of the expfluid.
different layerf the figure is nel height and
(= 3/16 in) sed as the wofter exiting ta paddle typid temperatuthe fluid ex
alls of the chensure that thused in the e
p to 3 L/min,ould be aroung in a maximof 6155, whing with the Dg the channe
periment, the
rs at a typical a scale pictur
d pressure tap
in height, working fluid.the apparatupe flowmeterure was measxiting the FMhannel, at 75hey were expexperiment c
which meanund 9 L/min. mum averagich corresponDarcy-Weisbel is 914.68 P
e apparatus
location alongre of the p locations.
hich results . Fluid flow
us the fluid r, FM, placesured by a
M. Six 5 mm posed to can be found
ns that with The cross
ge fluid nds to a bach Pa/m.
g
w
d
d

E
P
D
D
F
O
T
O
P
A
P
I
I
D
N
Table
Fluiddirectopenimm (beforexperfirst ptimes(25.5
Figurlocatio
Equipment
Pressure Tra
Druck LPX1
Druck LPM9
Flow Meter
Omega FPR3
Temperature
Omega HH80
Power Supply
Acopian DB
Pump
SMATEC B
SMATEC M
DAQ Board
NI USB 6259
1. Summary
d from the puted towards ings in the to(3/8 in) openre being direriment setuppressure tap s the channel in), and the
e 4. Diagram ons.
ansducer
110
9481
301
Sensor
04U
ly
12-20
BVP-Z (x2)
MV-Z/DDZ
9
of the equipm
umps was cothe channel.op two apparnings in the tcted toward
p detailing selocation wal height (Wh
e first pressur
of the experim
Range
0.0 to 0
±0.1 in
0.27 to
-200.0
-12 V,
ment used for
ombined in a. Fluid enterratus layers top two layerthe FM and
ensor locatios placed assu
hite, 1986). re tap was p
ment setup, sh
9
0.5 inH2O
nH2O
18.9 L/min
to 800 °C
+12V, 0.2 A
the experimen
a manifold tored the chanand similarlrs. Then it w
d back into reon and manifuming a maxThis results laced 660 m
howing the ma
Un
±0
±0
±0
±(0
A ± 0
nt.
o balance thennel through ly exited the was combineeservoir tankfold design iximum devein a develop
mm (26 in) fr
anifolds, pump
ncertainty
0.0025 inH2O
0.0025 inH2O
0.05134 L/m
0.05% + 0.2
0.0014 V
e flow rate btwo 9.52 mmchannel from
ed in anothek. A diagrams shown in f
elopment lenpment lengthrom the chan
p locations, an
O
O
min
2 °C)
before being m (3/8 in) m two 9.52 r manifold
m of the figure 4. Thngth of 138 h of 648 mmnnel inlet.
nd sensor
he
m

10
FunctionalModelFor this study, four materials (see table 1 for a list of materials), including one control material, were tested over a range of hydraulic Re numbers from 350 to 5900. Quantification of surface drag reduction was obtained with pressure drop measurements along the channel. Multiple data collection sessions were performed for each material. Pressure was measured with two pressure transducers, which have ranges of ± 0.1 inH20 and 0.0-0.5 inH2O. Placement of the pressure transducers was based on the expected pressure drop between the pressure tap locations and using the total range of the transducer to maximize the measurement resolution. This required splitting the data collection into a low speed session, using a larger spacing between pressure tap locations, and a high speed session, using a smaller spacing between pressure tap locations. Flow was set by sending a random control signal to the pumps and then the resulting flow rate was measured with the FM. The flow was randomly set, instead of swept, to reduce the effect of hysteresis error. The diaphragm of the pressure transducers are an elastic material and, therefore, subject to path dependence. Sweeping the flow rates allows the pressure transducer output to remain deterministic. Re numbers were calculated using measurements from the FM and RTD.
The hydraulic Re number is calculated using the fluid density, ρ, dynamic viscosity, µ, average velocity, uavg, and the hydraulic diameter of the channel, Dh, as shown in eq. 16. Using Dh as the characteristic length enables the use of the logarithmic law to calculate friction factors based on Re numbers for comparison to empirical results (White, 1986). The fluid viscosity and density decrease in a non-linear trend as fluid temperature increases. The temperature of the fluid was not controlled, but with the measurements from the RTD, viscosity and density can be analytically calculated. The viscosity was calculated using the Fulcher equation, which is a three parameter relation between viscosity and temperature, shown in eq. 17 (Fulcher, 1992). The density was calculated with the five parameter Thiesen formula, shown in eq. 18 (Tanaka, Girard, Davis, Peuto, & Bignell, 2001).
h
avg hD
u D T 2 VRe
T w h
16
2
3
b
T 273.15 b
1T b 10
17
2
1 25
3 4
T a T aT a 1
a T a
18
The functional model for the experiment, shown in eq. 19, is derived from the Navier-Stokes, N-S, equation for conservation of momentum in the direction along the length of the channel. The assumptions used to simplify the N-S equations are that: when the fluid reaches the pressure transducers it will be time invariant and fully developed, the fluid only moves in the direction along the channel length, and there are no external forces acting on the fluid. The remaining terms in the equation are for the pressure gradient and the viscous diffusion. The viscous diffusion term is a linear, second order, homogeneous differential equation that is solved to find the fluid velocity along the length of the

11
channel as a function of distance from the channel half height. Two boundary conditions are needed to solve the velocity equation and are found in assuming that the flow rate is at its maximum at centerline, and in the no-slip condition at the channel wall. The stress tensor inside of the viscous diffusion term is written in terms of the shear stress at the wall using Newton’s law of viscosity. The pressure gradient is expressed as a difference quotient, using the pressure drop between two pressure tap locations divided by the distance between those pressure tap locations. This results in an equation that directly relates the pressure drop along the channel to the shear stress at the wall.
h
w
Dp 1 p wh
x 4 2 w h
19
The apparatus layers were assembled under water to achieve a fully wetted material surface during the experiment. The pressure transducers were purged of air and set aside to eventually connect to the channel pressure taps. The pumps were primed and the inlet lines and manifolds were purged of air before being connected to the channel. This was to prevent air from entering the channel and sticking to the material surface, which could create a shear free layer or produce an artificial pressure drop and invalidate testing the hypothesis that the surface is fully wetted in the Wenzel state. The inlet lines were connected to channel while the pumps were running to prevent air from entering the channel and to purge air from the outlet lines and FM. The pumps were stopped and, once the fluid came to rest, the pressure transducers were placed in the flow loop and their output voltage was zeroed using an onboard potentiometer. Low speed flow rate tests were performed using an automated control program written in LabVIEW. This program sent the voltage control signals to the pumps, acquired voltage signals from the pressure transducers and FM, and saved the data for analysis. The RTD had its own control software that was used to record direct temperature measurements. After performing low speed tests, the pressure transducer locations were adjusted to facilitate high speed flow measurements and their voltage output was zeroed. High speed flow tests were performed using the same software but the range of output voltages sent to the pumps was changed. There was some overlap of the flow rates between low speed tests, which went up to Re ≈ 3000, and high speed tests, which started at Re ≈ 2500. The overlap allows for a comparison of results that should be similar and ensures that there is not a gap in the system’s independent variable.
An uncertainty analysis of the functional model, used to calculate the Re and the WSS number, provided analytic equations to describe the bias uncertainty of the experiment results, shown in equations 20 & 21. The Re number was calculated using FM and RTD data and the channel dimensions. The uncertainty of the Re number, ΔReDh, is from uncertainties of the channel dimensions, FM, and RTD. The WSS relied on information from the pressure transducers as well as measurements of the channel dimensions. The uncertainty in the WSS, Δτw, is from the uncertainty of the pressure transducer and the channel dimensions. The total uncertainty in the Re number, URe, and the WSS, Uτw, is calculated by taking the square root of the sum of the squares of the bias uncertainty and the standard deviation, σ, of the measured values in time as shown in equations 22 & 23.
12
h h h h
h
2 2 2 2
D D D D2 2 2 2 2D
Re Re Re ReRe T V w h
T V w h
20
2 2 2 22 2 2 2 2w w w w
w p w hp w h
21
h
2 2Re D ReU Re 22
w
2 2wU 23
Results
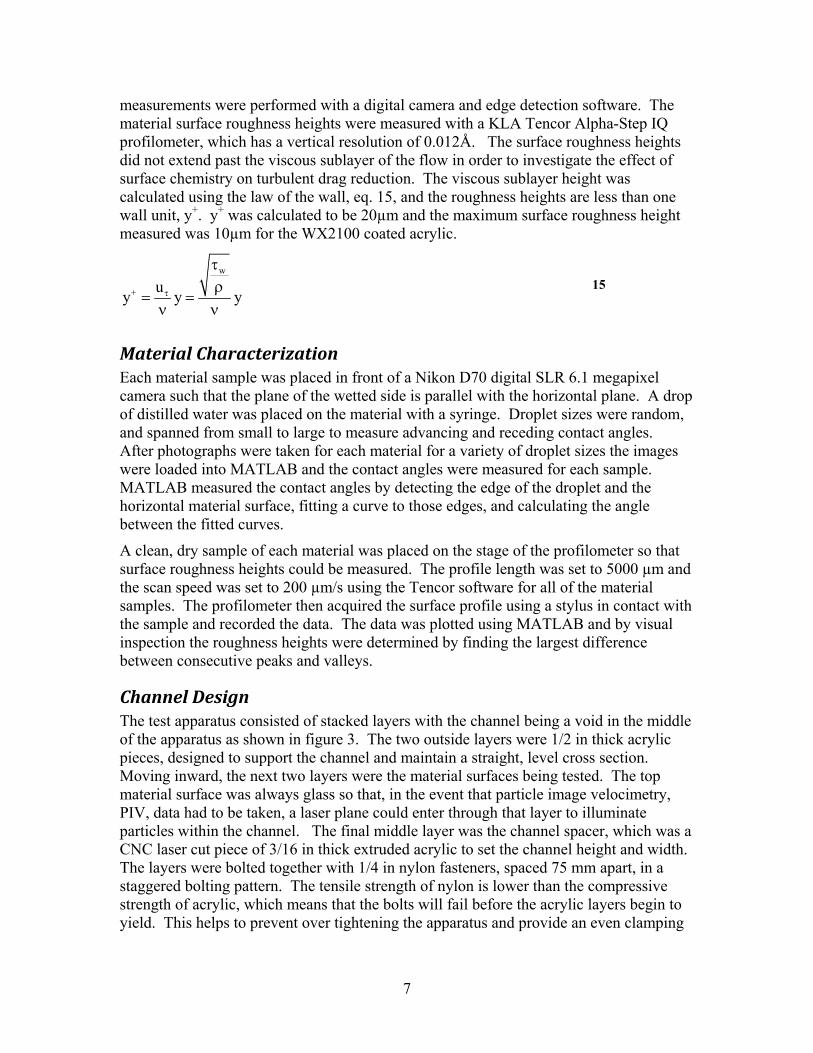
MaterialCharacterizationDataA summary of the data from the contact angle and surface roughness measurements can be found in table 2. There is a correlation between surface roughness and contact angle; as the roughness increases so do the contact angles. This is in agreement with previous work (Wenzel R. N., 1936). A typical photograph used for measuring contact angle is shown in figure 5 with a drop of distilled water sitting on top of a piece of acrylic coated with WX2100 showing θc ≈ 125°. In figure 6, direct measurements of surface roughness made with a stylus profilometer are shown for the materials tested in the experiment. As a result of an inclination of the stage of the profilometer there was a slope to the roughness data that was removed.
Material Roughness ContactAngle
Glass ~1 nm 45°‐55° Nylon 0.2-0.5 µm 30°-70° Teflon 2-3 µm 90°-110° WX2100 5-10 µm 105°-135°
Table 2. A summary of the surface roughness and contact angle measurements used for classifying the materials.

Figurthe co
Figurmeasu
e 5. A photogrontact angle of
e 6. A plot shured using a p
0-5
0
5
10
Surf
ace
heig
ht,
, [m
]
raph of a watef the material.
owing the surprofilometer.
500 1000
er drop on a p.
rface roughnes
1500 200
Stylus dista
13
piece of acrylic
ss of the mater
0 2500 30
ance from or
c coated with W
rials used for
000 3500
rigin, [m]
WX2100 used
the experimen
4000 4500
NylonTeflonWX21Glass
d to measure
nt, which wer
5000
00
re
ExpeThe pfigurethe Wa preexpecmaniflowmdurinin fig
Figur
DataThe Ware shWSSof thethe exof thepropemost hydro
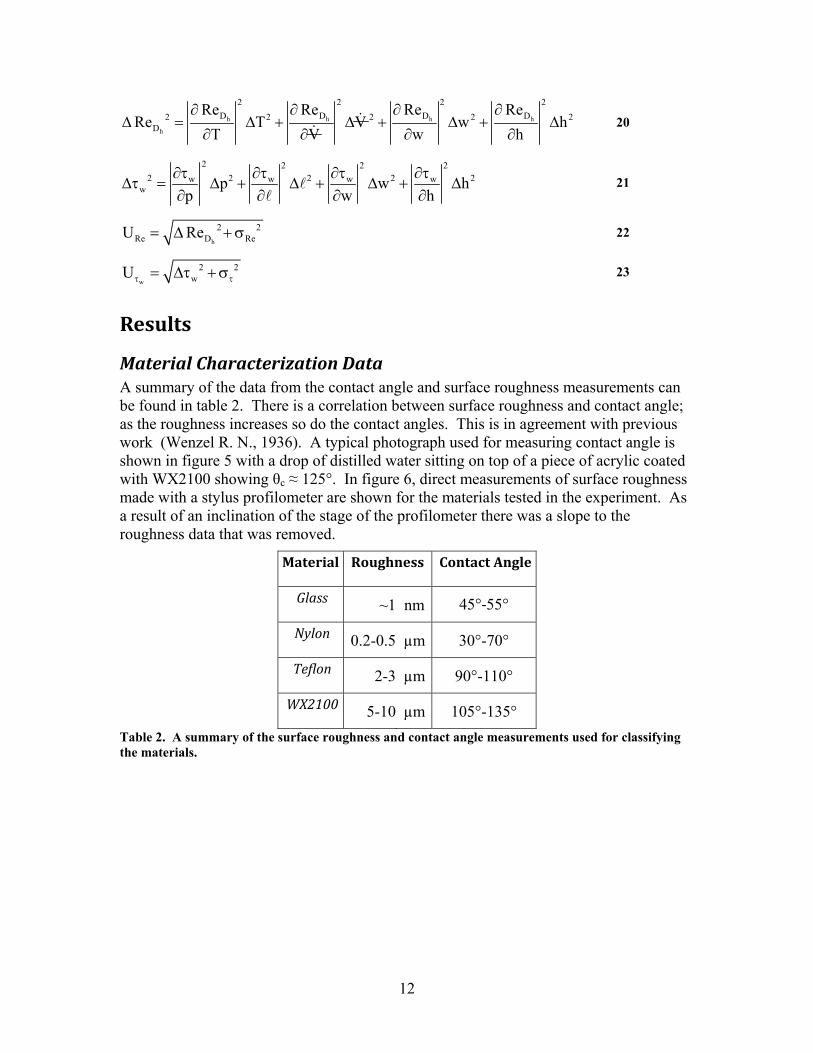
erimentalpressure drope 7. The ma
WX2100 coatssure drop pcted values bfolds used tometer. The png the experigure 7, and te
e 7. A plot of
aReductiWSS values,hown in figu values are pe Colebrook xperiment, ae theoretical erties. This hydrophobi
ophobic mat
lDatap between pr
aximum flowted surface,
per unit lengtby 22% whico transport thpressure droiment. The Wemperature d
the pressure d
on, resulting frure 8 for a raplotted alongequation at
assuming smvalues, and
is supportedc material, Werial actually
ressure tap lw rate measu
which correth of 839.9 Pch can be ache water betp and the floWSS values data from the
drop along th
rom pressureange of Re nug with theorethe maximu
mooth walls (do not show
d by the fact WX2100, hay having a h
14
locations is pured during thesponds to anPa/m. The flcounted for ween the resow rates are and Re nume RTD, with
e channel as a
e drop measuumbers betwetical valuesum and minim(White, 1986w any reductthat the mos
ave the closehigher WSS v
plotted as a fhe experimen average velow rates falby losses inservoir, pumthe raw data
mbers were ch equations 1
a function of th
urements aloween 350 ands calculated umum temper6). The resution in WSS st hydrophilist values of value for sim
function of fent was 6.999elocity of 0.4ll short of the
n the tubing amps, channel,a that was recalculated us16 & 19.
he flow rate.
ong differentd 5900. Theusing the Haratures meas
ults are withias a function
ic material, gWSS, with t
milar Re num
flow rate in 9 L/min with
4813 m/s ande maximum and , and
ecorded sing the data
t materials, e measured aaland form sured duringn the boundn of materiaglass, and ththe
mbers.
h d
g s
al he

15
Figure 8. The WSS is plotted as a function of Re number for the different materials. They are bounded by the theoretical WSS, which were calculated using friction factors at temperatures of 20 °C and 30°C.
A different method of representing the experimental data is with the Fanning friction factor, FFF, as shown in figure 9, which non-dimensionalizes the WSS with the dynamic pressure. Again, the Colebrook equation, for a smooth channel, is plotted for comparison. A deviation from the expected FFF is shown in the glass results, which are the second farthest from the theoretical curve for a smooth surface. The glass material has the smallest surface roughness but that is not shown in the plot of the FFF. A possible explanation is from the poor fit of the glass layers in the assembled test apparatus. The glass layers had a different thickness than the other materials, based on what was available for a channel of this size. Therefore a gasket was used around the glass layer so that an equal clamping force would be applied to this layer by the bolts holding the apparatus together. However, the reported values are within the accuracy of the Colebrook equation, therefore the data correlates with the expected values (White, 1986).
0 1000 2000 3000 4000 5000 6000 70000
0.5
1
1.5
2
2.5
3
3.5
Reynolds Number, ReDh
Wal
l She
ar S
tres
s, w
, [Pa
]
laminar theoryturbulent theoryglassnylonteflonWX2100

16
Figure 9. The WSS was non-dimensionalized using the dynamic pressure to derive the Fanning friction factor. The Fanning friction factor is temperature invariant.
RangeofUncertaintyThe results of the uncertainty analysis, which calculates the propagation of error through the WSS and Re number, are shown in figure 10 and figure 11. The overall uncertainty for all measurements is dominated by the uncertainty of the channel height. The maximum uncertainty in the WSS is less than 1%. The maximum uncertainty in Re number is less than 7%. The consistency of the results suggests that the measurements are reliable and the magnitude of the uncertainty indicates that the analysis is robust.
102
103
104
10-3
10-2
10-1
100
Reynolds Number, ReDh
Fann
ing
Fric
tion
Fac
tor,
Cf =
w
/ (1
/2U
2 )
laminar theoryturbulent theoryglassnylonteflonWX2100

17
Figure 10. The uncertainty in WSS as a function of WSS.
0 0.2 0.4 0.6 0.8 1 1.2 1.4 1.6 1.8 20
0.2
0.4
0.6
0.8
1
1.2
1.4
1.6
1.8
2x 10
-3
Wall Shear Stress, w, [Pa]
Unc
erta
inty
in W
SS, [
Pa]

18
Figure 11. The uncertainty in Re number as a function of Re number.
DiscussionThere are few experimental studies of hydrophobic drag reduction in macro-scale channel flow in the laminar or turbulent regimes. These results are consistent with previous studies that considered hydrophobic drag reduction in the laminar and turbulent regimes (Daniello, Waterhouse, & Rothstein, 2009). A possible explanation for the large apparent slip lengths found by (Choi, Westin, & Breuer, 2003) over smooth hydrophobic surfaces is dissolved gas bubbles coming out of the fluid near the wall. With the lack of a L-V interface in the fully wetted Wenzel state, drag reduction cannot be realized with surface chemistry modification alone. Drag reduction can only be realized if the apparent slip length is comparable to the channel height. In the macro-scale channel used for these experiments, this means that the maximum possible drag reduction is less than the inherent uncertainty of the system. These experiments are further proof of the importance of a L-V interface for increasing the shear free area to produce drag reduction.
The differences between this experiment and others measuring pressure drop over hydrophobic surfaces is the macro-scale conditions and the hydrophobic surfaces being fully wetted. Super-hydrophobic surfaces can be made hydrophilic by condensing water vapor on the surface before application of a water droplet (Wier & McCarthy, 2006). This effect decreases liquid mobility by creating a fully wetted surface so that droplets become pinned. A macro-scale experiment involving hydrophobic coatings and air
0 1000 2000 3000 4000 5000 6000 700050
100
150
200
250
300
Reynolds Number, ReDh
Unc
erta
inty
in R
eyno
lds
Num
ber

19
injection saw significant drag reduction on scaled ship models (Fukuda & Tokunaga, 2000). However, without a normalized parameter to describe the air thickness there is no way to know if this is a viable solution for normal scale ships. Similar to the micro-scale experiments this macro-scale experiment had an air layer between the surface and the liquid. The air layer was forced making this an active method of drag reduction.
When examining the arguments that are presented it is apparent that fundamentally surface tension is the controlling factor of the results. The viscosity of air is negligible compared to the viscosity of water. In experiments using micro-patterned roughness this means that the surface tension of the liquid is too high to generate enough capillary force to drive the liquid into the gas filled space. In this situation the liquid is not completely in contact with the surface, but hovering above pockets of gas wherever there is no roughness. Over the gaseous areas there is much less shearing stress than compared to the solid surfaces, which reduces the net shear stress over the whole S-V interface. Based on this net shear stress reduction some experimental studies have derived what they are calling a wall slip velocity. This derivation is based on the N-S equations without assuming no-slip at the wall. However, since the fluid is hovering over pockets of air and not completely in contact with the surface this cannot actually be called wall slip. Over a rough area the average velocity of the fluid may be higher or the average shear stress may be lower compared to a smooth area, but that is not indicative of wall slip because wall slip occurs at discrete, infinitesimal locations.
ConclusionThe hypothesis stating that drag reduction is possible over hydrophobic surfaces in the Wenzel state during laminar and turbulent flow was not supported by a channel flow experiment that used flow rate versus pressure drop measurements to compare the WSS values of surfaces with a range of θC values between 30° and 135°. Different assumptions about the representation of the velocity profile could alter the calculation of the results; however, the WSS of the materials as a function of Re have no discernable difference that could be explained by their θC. Other functional dependencies of the materials on the WSS measurements that were suggested, such as surface roughness, were ruled out after profilometer tests showed that the roughness heights were within one wall unit of the viscous sublayer height. Repeated pressure measurements using the same material provided consistent results, which matched the predicted results from using calculated friction factors.
A limitation in the original design of the experiment was the need to disassemble the apparatus to test the different materials. The scale of the channel, cross sectional area, and length required to ensure fully developed flow, made it difficult to achieve high flow rates (Re numbers) with the available pumps. Only knowing the average velocity across the channel and assuming a velocity profile is another experimental limitation. A slip velocity at the wall was not included in the functional model, which means that even if fluid did slip at the wall there would be no way of calculating apparent slip velocities. Difficulties in measuring wall velocities stem from different test apparatus material layers and not being able to assume that the apparent slip velocities at the top and bottom wall are the same. If the material layers and apparent slip velocities are the same, then the velocity profile could be integrated to derive the average velocity, which could then be

20
related to the apparent slip velocity. The same model was used for laminar and turbulent flows instead of developing a separate turbulent model using the Reynolds-averaged N-S equations. Future work could overcome these limitations by modifying the test apparatus; using a pressure vessel to increase flow rates; and changing data collection methods, i.e. include PIV measurements. This future work could include the addition of a shear-free air layer to reduce WSS and efforts to maintain this air layer at large static pressures, or imparting a controlled surface roughness to the materials to study surface optimization.

21
BibliographyBangham, D. H., & Razouk, R. I. (1937). Adsorption and the wettability of solid surfaces. Trans. Faraday Soc., 33, 1459-1463.
Bikerman, J. J. (1950). The surface roughness and contact angle. J. Phys. Chem., 54(5), 653-658.
Blake, T. D., Bracke, M., & Shikhmurzaev, Y. D. (1999). Experimental evidence of nonlocal hydrodynamic influence on the dynamic contact angle. Physics of Fluids, 11(8), 1995-2007.
Cassie, A. B., & Baxter, S. (1944). Wettability of porous surfaces. Trans. Faraday Soc, 40, 546-551.
Choi, C.-H., Westin, J. A., & Breuer, K. S. (2003). Apparent slip flows in hydrophilic and hydrophobic microchannels. Physics of Fluids, 15(10), 2897-2902.
Choi, H., Jeon, W.-P., & Kim, J. (2008). Control of Flow Over a Bluff Body. Annu. Rev. Fluid Mech., 113-139.
Daniello, R. J., Waterhouse, N. E., & Rothstein, J. P. (2009). Drag reduction in turbulent flows over superhydrophobic surfaces. Physics of Fluids, 21.
Day, M. A. (2004). The no-slip condition of fluid dynamics. Erkenntnis, 33(3), 285-296.
de Gennes, P. G. (1985, July). Wetting: statics and dynamics. Reviews of Modern Physics, 57(3), 827-863.
Fukuda, K., & Tokunaga, J. (2000). Frictional drag reduction with air lubricant over a super-water-repellent surface. Journal of Marine Science and Technology, 123-130.
Fulcher, G. S. (1992). Analysis of recent measurements of the viscosity of glasses. Journal of the American Ceramic Society, 75(5), 1043-1055.
Glauert, M. B., Walker, W. S., Raymer, W. G., & Gregory, N. (1952). Wind-Tunnel Tests on a Thick Suction Aerofoil with a Single Slot. Aeronautical Research Council Reports and Memoranda.
Johnson, R. E. (1959). Conflicts between Gibbsian Thermodynamics and Recent Treatments of Interfacial Energies in Solid-Liquid-Vapor. J. Phys. Chem., 63(10), 1655-1658.
Navier, C. L. (1823). Memoir. sur les lois du mouvement des fluides. Mem. Acad. R. Sci. Inst. France, 389-440.
Ou, J., Perot, B., & Rothstein, J. P. (2004, December). Laminar drag reduction in microchannels using ultrahydrophobic surfaces. Physics of Fluids, 16(12), 4635-4643.
Patterson, J. B., & Morris, E. C. (1994). Measurment of Absolute Water Density, 1 °C to 40 °C. Metrologia, 31, 277-288.
Pease, D. C. (1945). The significance of contact angle in relation to solid surface. J. Phys. Chem., 49(2), 107-110.

22
Pelofsky, A. H. (1966). Surface Tension-Viscosity Relation for Liquids. Journal of Chemical and Engineering Data, 11(3), 394-397.
Rothstein, J. P. (2010). Slip on Superhydrophobic Surfaces. Annu. Rev. Fluid Mech., 42, 89-109.
Seeton, C. J. (2006). Viscosity-temperature correlation for liquids. Tribology Letters, 22(1), 67-78.
Shuttleworth, R., & Bailey, G. L. (1948). The spreading of a liquid over a rough solid. Discuss. Faraday Soc., 3, 16-22.
Tanaka, M., Girard, G., Davis, R., Peuto, A., & Bignell, N. (2001). Recommended table for the density of water between 0 °C and 40 °C based on recent experimental reports. Metrologia, 38, 301-309.
Tiederman, W. G., Luchik, T. S., & Bogard, D. G. (1985). Wall-layer structure and drag reduction. J. Fluid Mech., 156, 419-437.
Tretheway, D. C., & Meinhart, C. D. (2002). Apparent fluid slip at hydrophobic microchannel walls. Physics of Fluids, 14(3), 9-12.
Virk, P. S. (1975). Drag Reduction Fundamentals. AIChE Journal, 21(4), 625-656.
Wehrmann, O. H. (1968, January 9). Patent No. 3,362,663. United States.
Wenzel, R. N. (1936). Resistance of solid surfaces to wetting by water. Ind. Eng. Chem., 28(8), 988-994.
Wenzel, R. N. (1949). Surface roughness and contact angle. J. Phys. Chem., 53(9), 1466-1467.
White, F. M. (1986). Fluid Mechanics (2nd ed.). New York: McGraw-Hill, Inc.
Wier, K. A., & McCarthy, T. J. (2006). Condensation on Ultrahydrophobic Surfaces and Its Effect on Droplet Mobility. Langmuir, 22(6), 2433-2436.
Wolf, F. G., dos Santos, L. O., & Phillippi, P. C. (2009). Modeling and simulation of the fluid-solid interaction in wetting. Journal of Statistical Mechanics: Theory and Experiment, 1-21.
Young, T. (1805). An Essay or the Cohesion of Fluids. Phil. Trans. Roy. Soc., 95, 65-87.


![Shear stress-induced pathological changes in endothelial ... · 1/7/2020 · Fluid shear stress induced [Ca2 +]i overload is force and time dependent . Shear stress is a physiological](https://img.pdfslide.net/doc/110x75/606ea5e1c71f9c48290448a9/shear-stress-induced-pathological-changes-in-endothelial-172020-fluid-shear.jpg)