Embed Size (px)
Citation preview

This article was downloaded by: [Florida Atlantic University]On: 15 November 2014, At: 20:19Publisher: Taylor & FrancisInforma Ltd Registered in England and Wales Registered Number: 1072954 Registered office: Mortimer House,37-41 Mortimer Street, London W1T 3JH, UK
Journal of Intelligent Transportation Systems:Technology, Planning, and OperationsPublication details, including instructions for authors and subscription information:http://www.tandfonline.com/loi/gits20
Expert Knowledge-Guided Travel Demand Estimation:Neuro-Fuzzy ApproachSeyedehsan Seyedabrishami a & Yousef Shafahi aa Department of Civil Engineering , Shraif University of Technology , Tehran, IranPublished online: 13 Feb 2011.
To cite this article: Seyedehsan Seyedabrishami & Yousef Shafahi (2011) Expert Knowledge-Guided Travel Demand Estimation:Neuro-Fuzzy Approach, Journal of Intelligent Transportation Systems: Technology, Planning, and Operations, 15:1, 13-27
To link to this article: http://dx.doi.org/10.1080/15472450.2011.544576
PLEASE SCROLL DOWN FOR ARTICLE
Taylor & Francis makes every effort to ensure the accuracy of all the information (the “Content”) containedin the publications on our platform. However, Taylor & Francis, our agents, and our licensors make norepresentations or warranties whatsoever as to the accuracy, completeness, or suitability for any purpose of theContent. Any opinions and views expressed in this publication are the opinions and views of the authors, andare not the views of or endorsed by Taylor & Francis. The accuracy of the Content should not be relied upon andshould be independently verified with primary sources of information. Taylor and Francis shall not be liable forany losses, actions, claims, proceedings, demands, costs, expenses, damages, and other liabilities whatsoeveror howsoever caused arising directly or indirectly in connection with, in relation to or arising out of the use ofthe Content.
This article may be used for research, teaching, and private study purposes. Any substantial or systematicreproduction, redistribution, reselling, loan, sub-licensing, systematic supply, or distribution in anyform to anyone is expressly forbidden. Terms & Conditions of access and use can be found at http://www.tandfonline.com/page/terms-and-conditions

Journal of Intelligent Transportation Systems, 15(1):13–27, 2011Copyright C©© Taylor and Francis Group, LLCISSN: 1547-2450 print / 1547-2442 onlineDOI: 10.1080/15472450.2011.544576
Expert Knowledge-Guided TravelDemand Estimation: Neuro-FuzzyApproach
SEYEDEHSAN SEYEDABRISHAMI and YOUSEF SHAFAHIDepartment of Civil Engineering, Shraif University of Technology, Tehran, Iran
Travel demand estimation is a complicated process because it is highly influenced by human perceptions and behaviorsembedded in travelers’ decision making. In addition, some variables in travel demand estimation models have inexactvalues, especially the ones that are required for future estimation of travel demand. This article offers and applies anexpert-guided algorithm to incorporate expert knowledge into Adaptive Network-Based Fuzzy Inference System (ANFIS) forhandling travel demand estimation uncertainties. ANFIS is an appropriate hybrid intelligent system combining fuzzy logicand neural networks. The ANFIS rule base structure facilitates integration of qualitative knowledge acquired from expertsand quantitative information from observational data. An expert-guided algorithm in conjunction with ANFIS, called expert-guided ANFIS (EGANFIS), is presented to compensate data insufficiency caused by uncertainties. The EGANFIS is appliedto a real-world problem for estimating trip production, attraction, distribution, and modal split in Shiraz, a large city in Iran.The comparison of results with traditional models and ANFIS shows that EGANFIS increases performance of travel demandestimation models in terms of learning and indicates that the model is accurate enough to provide meaningful informationand to enable generalization of the findings. Furthermore, rule base structure of EGANFIS enhances its interpretability incomparison with traditional models.
Keywords Expert Knowledge; Fuzzy Logic; Neuro-Fuzzy; Travel Demand Estimation; Uncertainty
INTRODUCTION
Transportation planning is gaining further weight and impor-tance in large cities to address traffic related concerns. Traveldemand modeling mainly aims at predicting the number of tripsspecified by trip purpose, origin, destination, and mode is asignificant component of transportation planning.
Many researches try to construct appropriate models to esti-mate travel demand; however, uncertainties as a result of traveldemand characteristics make the estimation process very diffi-cult. Modelers try to take account of uncertainties in models’structures to decrease its negative effect on demand estimation.In this process, probabilistic and statistical methods are used toconstruct demand estimation model.
Appearance of new tools in modeling concepts has persuadedmodelers to improve current demand estimation models or sug-gest new ones. One of these new tools in modeling is the fuzzy
Address correspondence to Seyedehsan Seyedabrishami, Department ofCivil Engineering, Shraif University of Technology, Azadi Avenue, Tehran,Iran, P.O. Box: 11155-9313. E-mail: [email protected]
set theory suggested by Zadeh (1965). Many researchers tendto study travel demand estimation on the basis of fuzzy ap-proaches (Teodorovic, 1999). In other words, they try to applyfuzzy concepts for taking uncertainties in travel demand intoconsideration. But the question is whether fuzzy methods cansubstitute for probability-based methods in considering uncer-tainties embedded in travel demand, or fuzzy sets can com-plement probability methods? To answer this question at first,the differences and similarities of fuzzy and probability the-ories should be specified. In Zadeh’s (1995, 1996) works, hehas pointed out that the probability theory is very useful whendealing with uncertainty inherent in measurements or objectsthat can be measured; however, it is not useful for dealing withthe uncertainty embedded in perceptions of humans. The for-mer issue involves crisp sets, while the latter involves fuzzysets (Ross, Booker, & Parkinson, 2002). According to Zadeh’s(1995, 1996) idea, highlighting where uncertainties originateshould be the first step of taking uncertainties into considerationin travel demand estimation. However, dealing with uncertaintyas well as deciding on appropriate tool is important as well. This
13
Dow
nloa
ded
by [
Flor
ida
Atla
ntic
Uni
vers
ity]
at 2
0:19
15
Nov
embe
r 20
14

14 S. SEYEDABRISHAMI AND Y. SHAFAHI
article aims at studying related issues of uncertainties in traveldemand estimation.
UNCERTAINTY IN TRAVEL DEMAND ESTIMATION
Travel demand are estimated at aggregate level or disaggre-gate level but used for aggregate level forecasting. The formerusually used zonal data for calibration and the latter needs house-hold or individual data for calibration (Meyer & Miller, 1984).
Two kinds of uncertainties may occur as a result of travelers’individual perception and randomness of behavior at disaggre-gate level of estimation. Uncertainty of individual perceptionarises from different perceptions of travelers in regard to similarreality. For example, actual travel time between pair of originand distribution may differently perceive by travelers. Uncer-tainty of travelers’ randomness of behavior arises from differ-ent behaviors of travelers even with the same perceptions. Forexample, two similar travelers with the same perception of des-tination attractiveness may choose different destination. Fuzzytheory may be an appropriate tool of taking individual percep-tion into consideration; however, randomness of behavior willbe properly considered by probability theory.
Aggregate level encounters two kinds of uncertainty includ-ing people perceptions (group perceptions) and variables withinexact values. Fuzzy theory can apply membership functionsfor defining variables perceived by travelers and assigning lin-guistic terms to these variables. Inexact quality of values forsome influential variables on travel demand estimation espe-cially while these variables should be estimated for future fore-casting may be taken into account using probability or fuzzytheory.
This article offers a travel demand estimation model at ag-gregate level in which people perception and inexact variablesresulted in uncertainties that are taken into account using fuzzytheory. Fuzzy aggregate models are usually created in rule basestructure. This rule base structure that presented by a set of rulesapplies linguistic terms defined by fuzzy membership functionsin rules’ antecedents (if parts).
In continuation, as a literature review, first subsection explaintraditional deterministic and statistical model and second sub-section brings some important previous research apply fuzzytheory for travel demand estimation.
Traditional Deterministic and Statistical Models
Years of experimentation and development have resulted ina general structure that has been called the classic transportmodel. The classical model is presented as a sequence of onthe other submodels: trip generation, distribution, modal split,and assignment (Ortuzar & Willumsen, 2001). The first threesubmodels are used to estimate travel demand between varioustraffic zones. In the fourth submodel, trip assignment, the traveldemand is equilibrated with the travel supply; therefore, the
loading onto transportation networks are acquired. Some inputsof the latter submodels are the former submodels’ outputs.
Trip generation aims to predict the total number of trips gen-erated by (trip production) or attracted to (trip attraction) eachzone of the study area (Ortuzar & Willumsen, 2001). Accuracyin trip generation prediction is important because errors hereare carried out through the entire four submodels and invalidatework on subsequent submodels (Shafahi & Abrishami, 2005).Usually, growth factor, linear or multiple linear regression mod-els, cross-classification models have been used to predict tripgeneration. Growth factor model basic equation is Ti = Fi · ti ;where Tiand tiare respectively future and current trips in zonei, and Fi is a growth factor. The only problem of this methodis the estimation of growth factor which is normally relatedto variables such as population, income and car ownership(Ortuzar & Willumsen, 2001). In a regression model, zonal tripgeneration is assumed to be a function of some zonal socioeco-nomic variables such as population, average car ownership, andnumber of employees. The cross-classification method is basedon estimating the response (e.g. the number of trip productionsper household for a given purpose) as a function of householdattributes. Its basic assumption is that trip generation rates arerelatively stable over time for certain household stratification(Ortuzar & Willumsen, 2001). The socioeconomic character-istics are models’ inputs and the number of trip generated ismodels’ outputs.
Trip distribution models connect the trip origins and desti-nations estimated by the trip generation models. Growth factormodeling, synthetic or gravity models, entropy-maximizing ap-proach, and intervening opportunity are usually used to estimatetrip distribution. The models distribute trips between origins anddestinations based on a travel impedance function between ori-gin and destination and the origin and destination’s related fac-tors impact on trip production and attraction. Modal split modelallows the analyst to determine what mode of transport (auto ortransit) will be used. Multinomial logit model, hierarchical logitmodel, and diversion curves are the most common methods inmodal split modeling (Ortuzar & Willumsen, 2001). Assign-ment methods select a path from transportation network thatconnects origin to destination. Generally, assignment methodsassume that user equilibrium principle is satisfied. It means userschoose the best path for trip and no user may lower its traveltime by changing the selected path. In other words, trip timesof parallel used paths between origin and destination are equaland less than trip times of unused parallel paths. Dependingon the transportation network size, different methods that in-clude all-or-nothing assignment, stochastic methods, Wardrop’sequilibrium, hard and soft speed-change methods, incrementalassignment, and method of successive average are developed(Ortuzar & Willumsen, 2001).
The Fuzzy Approaches
Existing aggregate fuzzy models of travel demand estimationfollow the traditional models mentioned in previous subsection,
intelligent transportation systems vol. 15 no. 1 2011
Dow
nloa
ded
by [
Flor
ida
Atla
ntic
Uni
vers
ity]
at 2
0:19
15
Nov
embe
r 20
14
NEURO-FUZZY APPROACH 15
but the models’ structure is changed to fuzzy rule base in whichfuzzy variables are used.
Here some recent works in this field are mentioned. Forsolving trip generation problem, Kalic and Teodorovic used afuzzy inference system (Kalic & Teodorovic, 2002), Shafahiand Farzaneh (2002) used ANFIS to predict number of trip pro-duction. Shafahi and Abrishami (2006) used Adaptive-network-based fuzzy inference system for school trip production, Shafahiand Abrishami (2005) used ANFIS to predict the number ofschool trip attraction. Xu and Chan (1993a, 1993b) produced anorigin–destination trip distribution matrix using fuzzy weights.Quadrado and Quadrado (1996) determined the accessibility ofdifferent vehicle modes by fuzzy modeling. Kalic and Teodor-ovic (2003) used fuzzy logic and genetic algorithm for tripdistribution modeling, and Shafahi, Nourbakhsh, and Seyedabr-ishami (2008) presented fuzzy rule base distribution model toestimate discretionary trip. Shafahi and Nazari (2006) presentedand compared a neural-fuzzy and genetic-fuzzy distributionmodel for estimating work trip. Models presented for trip assign-ment usually use fuzzy arithmetic to equilibrate travel demandand supply. Teodorovic and Kikuchi (1991) suggested a vehiclerouting algorithm using fuzzy set theory, Akiyama and Tsuboi(1996) used a multistage fuzzy reasoning for description of routechoice behavior, Lotan and Koutsopoulos (1993) used conceptsfrom fuzzy control and approximate reasoning for route choicein presence of information, Teodorovic and Kalic (1995) pre-sented a fuzzy route choice model for air transportation, VincentHenn (2000, 2005) compared fuzzy numbers according to someindexes to find out shortest path and then route choice modeling,and Shafahi and Ramezani (2007) presented a fuzzy model fortraffic assignment. Teodorvic reviewed the fuzzy travel demandmodels in reference (Teodorovic & Vukadinovic, 1998).
This article offers and applies an expert-guided algorithm toincorporate expert knowledge into fuzzy travel demand aggre-gate estimation models. A neural network structure is used forfuzzy model calibration. In fact, an adaptive network-based in-ference system (ANFIS) model, which is an appropriate hybridintelligent system, combining fuzzy logic and neural network,for handling travel demand estimation uncertainties is used.Fuzzy rule base structure of ANFIS facilitating integration ofqualitative knowledge acquired from experts and quantitativeinformation from observational data. The model can offer es-timates of the travel demand, especially in the short term, butexact values of influential variables are not readily available.The estimation of the travel demand has been used as inputto several programs such as the Intelligent Transportation Sys-tem Deployment Analysis System (Federal Highway Adminis-tration, 2003) or the Process for Regional Understanding andEvaluation of Integrated Intelligent Transportation System Net-works (U.S. Department of Transportation, 2002) to evaluatethe intelligent transportation system investment. Furthermore,some applications addressed by intelligent transportation sys-tem programs, such as transit and road network management,especially in operations and fleet management, transportationdemand management, and parking management, can use expert-
guided ANFIS (EGANFIS) for their short-term travel demandestimations.
EXPERT-GUIDED TRAVEL DEMAND ESTIMATIONRULE BASE
Aggregate model can be well suited for expert guide becauseexpert knowledge often provides general guides for modeling(mostly in form of rules with linguistic terms). Analyzing datauncertainty to find out where the expert knowledge is neededis essential to well use general viewpoints of experts. ANFISthat has a rule base structure is more convinced for consideringexpert guides in travel demand estimation models.
ANFIS is a kind of fuzzy inference system, which is one ofthe most famous applications of fuzzy logic and fuzzy set the-ory (Zadeh, 1965). A fuzzy inference system includes a numberof if-then rules that simulate real-world rules’ behavior. Theserules are generated using real-world observation data and ex-pert experience. Rule generation is composed of two sequentialsteps: rule induction and rule-base optimization. In other words,fuzzy inference system is a kind of fuzzy rule-based system thathas the ability of incorporating human expert knowledge, aswell as expressing the behavior of the system in an interpretableway for humans (Guillaume & Magdalena, 2006).
According to Serge Guillaume classification (Guillaume,2001), there are three main methods for rule induction: (a) fuzzysets’ shared partitioning; (b) number of fuzzy sets dynamicallychosen; and (c) hybrid methods. Hybrid methods integrate manydifferent tools; the most famous and widely used is the geneticalgorithm and neural networks. While these tools usually usenumerical data for training and optimization, many modelersthink that these tools are useful when no expert knowledge isavailable and semantic concepts are not a prime concern. How-ever, a few works attempt (Mitra & Hayashi, 2000), (Mitra, De,& Pal, 1997) to use neural networks with human interpretabilityand legibility (Guillaume, 2001).
In this article, hybrid method is applied because of threereasons: (a) hybrid method is applied for rule-based optimizationin addition to rule induction; (b) hybrid methods (especiallyANFIS) use powerful training algorithm; and (c) it has the abilityto perform nonlinear mappings between inputs and outputs.
ANFIS method is a neuro-fuzzy system that was proposed byJyh-Shing (1993). There are two kinds of neuro-fuzzy systems:cooperative neuro-fuzzy system and hybrid neuro-fuzzy system.In a cooperative neuro-fuzzy system, fuzzy system and neuralnetworks are independently implemented, and usually neuralnetworks help to find suitable parameters for fuzzy systems.Unlike the cooperative neuro-fuzzy system, hybrid neuro-fuzzysystem defines a homogeneous structure usually composedof neural network architecture and fuzzy concepts (Nauck,Klawonn, & Kruse, 1997). ANFIS is a hybrid neuro-fuzzy sys-tem and represents a Sugeno-type fuzzy system in the spe-cial five-layer feed-forward network architecture. This systemintegrates fuzzy system into a neural network structure to use
intelligent transportation systems vol. 15 no. 1 2011
Dow
nloa
ded
by [
Flor
ida
Atla
ntic
Uni
vers
ity]
at 2
0:19
15
Nov
embe
r 20
14
16 S. SEYEDABRISHAMI AND Y. SHAFAHI
neural network training capability in order to optimize fuzzyinference system parameters, including rule adjustment factors,coefficients of membership functions. ANFIS algorithm com-bines the gradient method and least squares estimate to adjustthe fuzzy inference system parameters. Each epoch of the learn-ing iterative procedure is composed of a forward pass and abackward pass. In forward pass, input data and functional sig-nals go forward to calculate node outputs and parameters areidentified by the sequential least square method. After identi-fying parameters, the functional signals keep going forward tillthe error measure calculated. In the backward pass, the errorrates propagate from the output end toward the input end, andthe parameters are updated according to gradient method. Theinference operations upon fuzzy if-then rules include four steps:
1. The input variables compare with membership functions onrules’ antecedent parts to obtain membership values of eachlinguistic term
2. One of t-norm operators (like minimization) is used to getfiring strength (rules’ weights)
3. The qualified consequents from each rule generate4. Aggregate the qualified consequents using rules’ weights
(Jyh-Shing, 1993).
Therefore, ANFIS is presented by a rule base system containseveral if-then rules, a class of membership functions definelinguistic terms assigned to fuzzy variables and used in rules’antecedents, and an inference algorithm.
ANFIS model training is sensitive to acquisition data cover-age of learning space; using inadequate data has caused imper-fect training and therefore a flawed model. The expert can guideANFIS structures in two ways. In the first way, the expert canset incomplete rules1 to add to ANFIS rule base for compen-sating data inadequacy. In the second way, expert judgment canemploy some methods to compensate for data inadequacy. Infact, the first way of guidance is done through expert experienceand the second one is done through expert judgments. Actually,compensating data is dictating some incomplete rules to rulebase.
The algorithm of EGANIS is as follows:
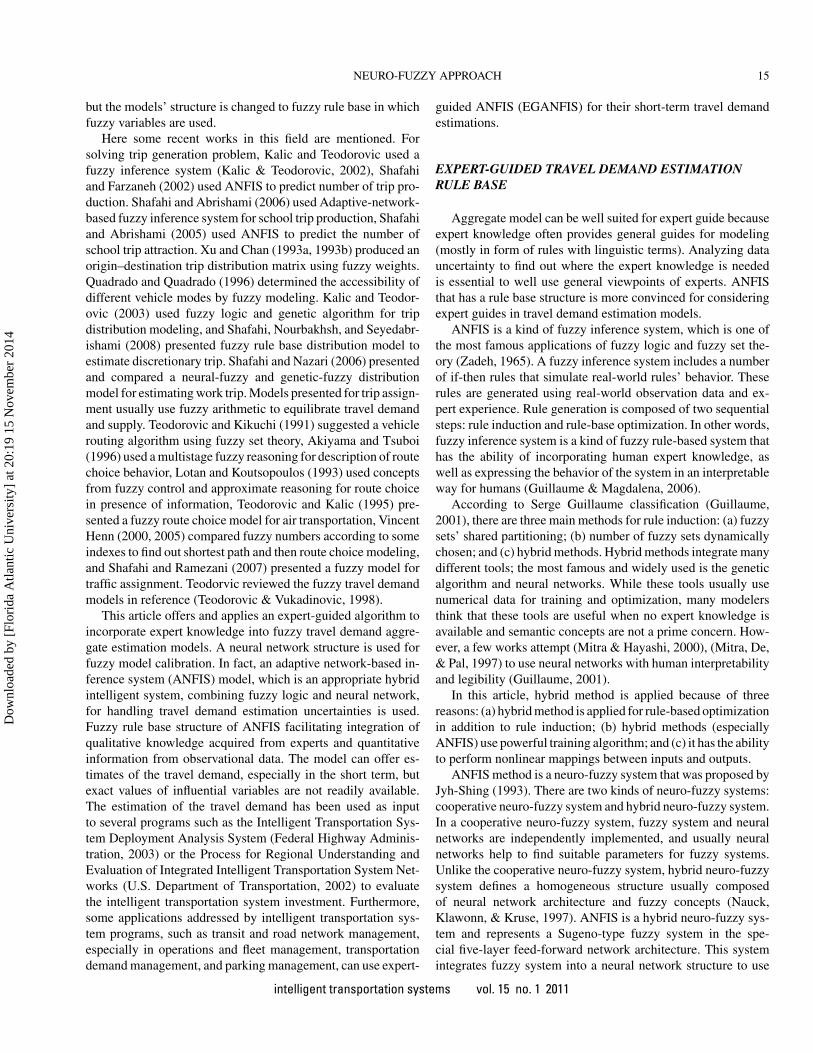
Step 1: The number of fuzzy attribute and membership func-tion of each input are defined based on expert experi-ence. For example, one can define two fuzzy attributes(short and long) for perceived travel time. On the ba-sis of the fuzzy attributes defined for each input, thelearning space is divided into a number of partitionswhich are called regions as illustrated in Figure 1. Thenumber of fuzzy attribute is usually specified accord-ing to experts’ common sense, but the coefficients ofmembership functions, which define membership func-tions related to each attribute, can be computed throughANFIS calibration. In fact, membership functions’ pa-
1A fuzzy rule is called an incomplete rule if its premise is defined by a subsetof the available inputs.
Figure 1 Learning space partitions.
rameters are tuned to increase ANFIS model learningcapability.
Step 2: The ANFIS model is created using all rules, includingall combinations of fuzzy attributes that have been de-fined in step 1. ANFIS rule base is trained using allobservation data. For example, if there are three inputsand one output, and three fuzzy attributes are consideredfor two of inputs and two attributes for the rest input,then eighteen rules will exist in ANFIS rule base. TheANFIS rules’ outputs are assumed to be crisp values sothat no fuzzy attribute defines for outputs.
Step 3: Expert judgment guidance is used to select a techniqueto identify regions in which data is inadequate and thus,data pattern is hardly recognized. This technique maybe a qualitative or a quantitative one. In continuationtwo example techniques are presented.
For example, we may assume that the ANFIS predictionerrors conform to a probability distribution that has been iden-tified with variance and mean values. The error distributionof all data predicted with ANFIS model, created in Step (2),(ET ≈ �
(µT
E, σ TE
))is statistically compared with the error
distribution of predicted data in a region with ANFIS model(Eri ≈ �
(µri
E , σ riE
)). The means of error distributions are com-
puted as follows:
µTE =
n∑k=1
|yk − yk|n
(3–1)
µriE =
nri∑k=1
∣∣yrik − yri
k
∣∣nri
(3–2)
where:µT
E = Mean of the ANFIS prediction error distribution fortotal data
n = Number of all observation datayk = kth observation pointyk = ANFIS predicted value for kth pointµri
E = Mean of the ANFIS prediction error distribution fordata in region i(ri)
intelligent transportation systems vol. 15 no. 1 2011
Dow
nloa
ded
by [
Flor
ida
Atla
ntic
Uni
vers
ity]
at 2
0:19
15
Nov
embe
r 20
14

NEURO-FUZZY APPROACH 17
nri = Number of observation data points in region i(ri)yri
k = kth observation point in region i(ri)yri
k = ANFIS prediction for kth point in region i(ri)The variances of error distributions are computed as follows:
σTE =
n∑k=1
(|yk − yk| − µTE
)2
n(3–3)
σ riE =
nri∑k=1
(∣∣yrik − yri
k
∣∣ − µriE
)2
nri
(3–4)
where:σT
E = Variance of the ANFIS prediction error distributionfor total data
σ riE = Variance of the ANFIS prediction error distribution
for data in region i(ri)The statistical method uses means and variances of two dis-
tributions and also a two-sided confidence interval to comparethe mean performance measure (MPM) for each distribution(Banks, Carson, & Nelson, 1995). The MPM shows ANFISprediction error for total data (MPMT ) and prediction error in aregion (MPMri).
According to this method, if the confidence interval for(MPMT –MPMri) is totally to the right of zero or it containszero, then there is strong evidence that MPMT ≥ PMri and theregions are called noncritical. But if this interval is totally tothe left of zero, then it can be said that the MPM for a regionis significantly greater than MPM for all data so the region iscalled critical region. We can logically assume that the error dis-tribution conforms to a t-distribution; therefore, the confidenceinterval for (MPMT –MPMri) is computed as follows:(
µTE − µri
E
) − tα/2,ν × s.e.(µT
E − µriE
) ≤ MPMT − MPMri
≤ (µT
E − µriE
) + tα/2,ν × s.e.(µT
E − µriE
)(3–5)
where
α = 1 − confidence level100
ν = Degrees of freedom that is computed using the followingequation:
ν =(σT
E /n+σ riE /nri
)2[(σT
E /n)2
/(n − 1)] + [(
σ riE /nri
)2/(nri − 1)
] (3–6)
tα/2,ν = Percentage points of t distribution with ν degrees offreedom.
s.e.(µT
E − µriE
) = standard error of the estimate that is givenby:
s.e.(µT
E − µriE
) =√
σTE
n+ σ ri
E
nri
(3–7)
The second technique suggested to identify model defectsbrings in an example. Suppose a work trip attraction modelin which the number of work trips attracted by each zone ispredicted. Zones are categorized according to their potency toattract work trips, zones’ accessibility and zone geographicallocation. Zone potency is defined by the number of employees,salesmen and work units in each zone. The zone accessibility isa function of public transport system and quality of arterial tothe zone. Zone geographical location explains zone’s vicinity tocentral business district (CBD).
Zones are categorized according three characteristics be-cause this categorization facilitates taking account of expertviewpoints. On the basis of attractiveness potency, three fuzzyattributes including high, medium, and low potency are defined.Zone accessibility is described by two fuzzy attributes, high andlow accessible and, according to zone geographical location,zones are categorized in three groups including: completely lo-cated in CBD, partially located in CBD, and not located in CBD.ANFIS rule base for work trip attraction model is constructed us-ing model inputs’ categorizations mentioned earlier. A completerule base contains all combinations of inputs’ categorizations isprovided. An example rule of the rule base is as follows:
If a zone has high potency of work trip attraction & the zoneis high accessible & the zone completely located in CBD thennumber of work trip attraction = A (a value computed throughANFIS rule base calibration)
Eighteen rules are derived through combinations of fuzzyattributes assigned to inputs. In other words, eighteen is themultiplication of three fuzzy attributes assigned to attractivenesspotency, two fuzzy attributes assigned to zone accessibility, andthree fuzzy attributes assigned to zone geographical locationin regard to CBD. Rule base parameters including coefficientsof membership functions, output values and rule weights, arecomputed using observational data. One of these parameters isrule weight. Weight of some rules may be zero because of datainadequacy. Regions relate to rules with zero weight can becalled critical regions. This is another method for identifyingcritical region.Step 4: Expert knowledge is used to compensate for data in-
adequacy in critical regions by qualitative method likeexperts’ incomplete rules with linguistic terms, or quan-titative methods such as using analytical models forcritical regions. In the former, expert knowledge andjudgments create some rules, usually incomplete rules.In the latter, some data are acquired by methods sug-gested by experts to use for ANFIS parameter opti-mization. Depending on the problem, different methodscan be used, including simulation algorithms, analyti-cal models, or experiments in laboratory. Experts canalso judge which technique is used to guide ANFIS incritical region.
For example, extrapolation and interpolation estimationcan be used to acquire data from expert judgment. In the
intelligent transportation systems vol. 15 no. 1 2011
Dow
nloa
ded
by [
Flor
ida
Atla
ntic
Uni
vers
ity]
at 2
0:19
15
Nov
embe
r 20
14

18 S. SEYEDABRISHAMI AND Y. SHAFAHI
extrapolation (or interpolation), complementary data for crit-ical region are constructed outside (or within the range of) aset of known data points of neighbor regions or all observationdata. The expert experiences select neighbor regions or all ob-servation data for constructing new data points. Data obtainedfrom expert knowledge add to the ANFIS training data set thatis declared in Step 5. However in some cases the incompleterules also should be used. An example for incomplete rules canbe presented in continuation for work trip attraction problemexplained in previous step. The expert knowledge guides themodel through eliminating rules with zero weight and addingincomplete rules. The following is an example of incompleterule:
If a zone is low accessible and the zone not located in CBD,then number of work trip attracted by the zone = B (a relativelysmall number)
Incomplete rules may calibrate using available data to com-pute its parameters. For incomplete rules that no related obser-vation data exist, parameters of rules may logically be predictedaccording to expert experience. For example, if there is no ob-servation data for the aforementioned incomplete rule, we canassume a relatively small value close to zero for rule output.
The experts should also add some rules that check rule baseconsistency, for example:
If a zone accessibility change from low to high and the zonelocation change from not located in CBD to located in CBDthen rule’s output will be greater than before (when both inputsare low and not located in CBD respectively).
Step 5: The EGANFIS with training data set improved withcomplementary data or rule base with new incomplete rulesis created. The model should be precisely evaluated, so thatproper criteria are needed. The criteria should check themodel learning and generalization capabilities. An evalua-tion method is presented as follows.
The observation data are randomly divided into two sets,training data set and test data set. For example, two thirds ofobservation data are included in training data set and the rest intest data set. The complementary data (or incomplete rules) inStep 5 add to the training data set (or rule base structure). TheEGANFIS parameters are estimated using training data set, andthen generalization capability of EGANFIS models is testedusing data in test set. It is also possible to verify EGANFISmodel fitness using training data set as an input for ANFISmodel and compare its outputs with real ones.
The two criteria, including EGANFIS model learning andgeneralization capabilities, are appropriate to compare EGAN-FIS with ANFIS and traditional models. These capabilities areverified through computing model prediction error for training
and test data set:
Etest =
ntest∑i=1
(y test
i − y testi
)2
ntest(3–8)
whereEtest = ANFIS model error for test data set (shows general-
ization capability)ntest = Number of test data set elementsy test
i = ith element of test data sety test
i = ANFIS model prediction for ith element of test dataset
By replacing the test set with training set in the aforemen-tioned formula, Etrain will be computed, and it shows models’learning capability.
The overall structure illustrates the proposed algorithm pro-cess represented in Figure 2.
EGANFIS inference algorithm has briefly explained in twosteps:
Step 1 (rule’s weight computation) - inputs’ membership de-grees in rules’ antecedents are calculated and the minimummembership degrees assume to be rule weight. Total rules’weights should be computed. Assume there are n rules in rulebase thus for each input a vector with n elements show the ruleweights indicated by wi(ith rule weight)
Step 2 (computation final output from rule base) - the finaloutput is computed using rules’ weights and rules’ consequentwhich is a crisp value. The final output is a weighted averagevalue of rules’ consequent crisp values. Assume ith consequentsis shown by Ci then the final rule base output shown by O is asfollows:
O =
n∑i=1
wi × Ci
n∑i=1
wi
(3–9)
EGANFIS shows a procedure for taking uncertainties intoconsideration in travel demand models, however it is necessaryto note that taking uncertainties into account depends on pur-pose of models’ application. In this article, we aimed to increasemodels’ confidence in different regions’ learning space; thus, wefocused on regions of learning space in which enough data forpattern reorganization is not available. These regions may causeoverall or partial defects in models’ estimation. In particular,when future travel demand estimation because of usual growthof future inputs (such as population or zonal car ownership) maylie inside some regions in which available data is not enough toproperly calibrate the model. Expert knowledge aims at com-pensating for data inadequacy in these regions. For example,only a few number of populated traffic zones in suburban maybe available in current observational data, thus the estimationmodel may weakly recognized pattern of trip production, attrac-tion, distribution, and model split for such zones. So if we useestimation models for future transportation planning and designwhen number of such zones increase, the estimation results may
intelligent transportation systems vol. 15 no. 1 2011
Dow
nloa
ded
by [
Flor
ida
Atla
ntic
Uni
vers
ity]
at 2
0:19
15
Nov
embe
r 20
14

NEURO-FUZZY APPROACH 19
Observation data
Expert experience and judgment
Fuzzy logic
Training method
Probability theory
Assign fuzzy concept to input variables
ANFIS model creation
Modeler judgments based on experience (statistical comparison
can be used)
Identify critical region
Improve critical regions by providing incomplete rules or/and complementary data
using different methods
Final evaluation of EGANFIS
Knowledge source Processing tools Algorithm steps
Figure 2 Overall structure of the proposed algorithm.
not be reliable. If expert-guided algorithm identify the regionof learning space included such zones, therefore the models’defect by expert knowledge can be repaired. In this article thecomparison of estimation error in each region with overall pre-diction error assume to be an index for identification of regionswith low confidence.
NUMERICAL EXAMPLES
EGANFIS models are constructed for estimation of trip gen-eration, distribution, and modal split. The performances of thesemodels are compared with traditional non-fuzzy models andANFIS models without expert’s guide. The former compari-son indicates fuzzy rule base capability in travel demand es-timation and the latter displays expert influences on models’performance. Separate models are constructed for different trippurposes: work, shopping, recreation, and school. These fourpurposes approximately cover more than 90% of nonreturn ur-ban trips. Independent variables for all models including tradi-tional, ANFIS, and EGANFIS are the same. These variables areselected between different variables to give the best traditionalmodel. Implementation details for one of models (work trip at-traction model that has only two inputs) is presented to moreclarify the proposed method, for the sake of saving the paper
space for the rest of models only a brief explanation accompa-nied by comparison results are described. Traffic assignment isa problem with special structure because of interrelation of trav-elers’ decision-makings for route choice and interdependenciesbetween network characteristics (supply) and travel demand.Thus, traffic assignment requires special considerations in addi-tion to procedure proposed in this paper. An initial fuzzy appli-cation in traffic assignment is presented in reference (Shafahi &Ramezani, 2007).
Real data obtained from Shiraz Comprehensive Transporta-tion Study in 2000 are used in this study. The study area is20550 km2. It includes 1.98 million people. The study areais divided into 156 zones. An origin/destination survey withhouse interviewing was conducted in the Shiraz Comprehen-sive Transportation Study area in 2000. Data were gatheredfrom 4% of the households and were validated by observationfrom four screen lines in the study area (Poorzahedey, Ashtiani,Shafahi, Tabatabaee, & Kermanshah, 2000). Some informationsuch as population in each region, and employment was gatheredthrough Iranian national census.
Trip generation includes trip production and attraction. Ac-cording to home-based trip definition, production is defined asthe home end of home-based trip or the origin of a non–home-based trip and attraction is defined as the non–home end of ahome-based trip or the destination of a non–home-based trip.
intelligent transportation systems vol. 15 no. 1 2011
Dow
nloa
ded
by [
Flor
ida
Atla
ntic
Uni
vers
ity]
at 2
0:19
15
Nov
embe
r 20
14
20 S. SEYEDABRISHAMI AND Y. SHAFAHI
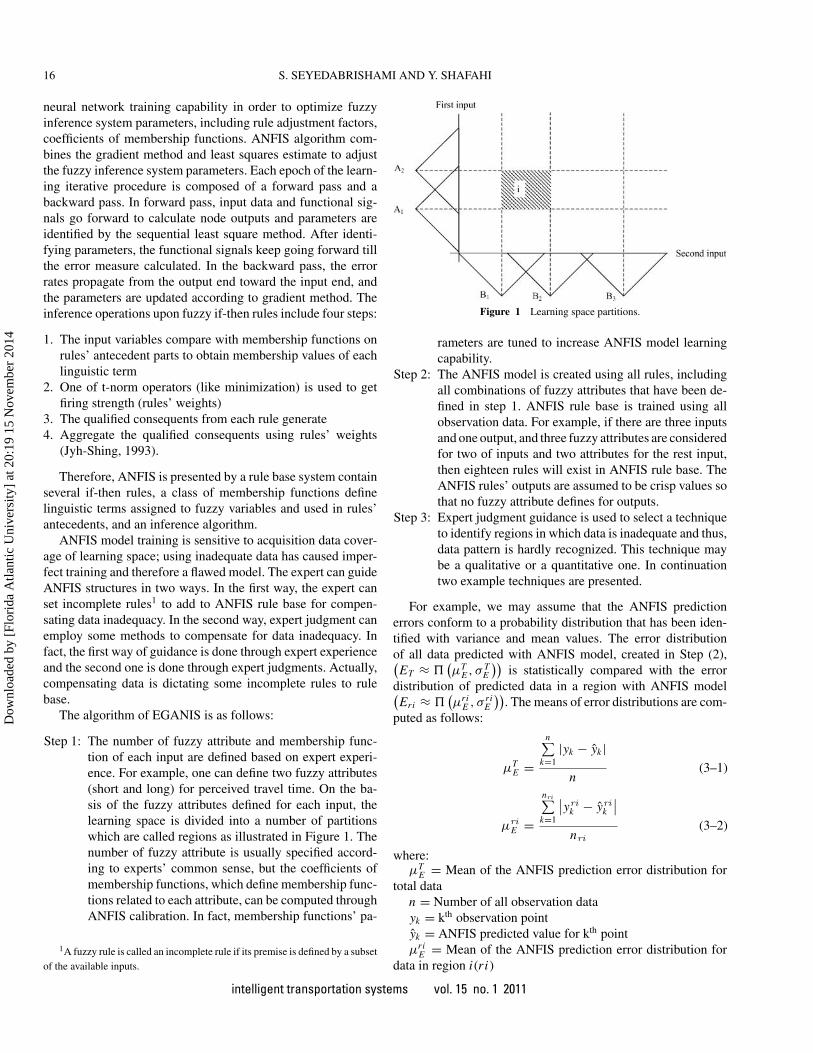
Figure 3 Distribution pattern of observation data and complementary data acquired from expert judgment for work trip attraction.
Experiences indicate that regression models are an appropriatemethod to predict trip production, but it is not appropriate fortrip attraction because of their variables’ characteristics. Tripproduction’s effective variables are more distinctive than nu-merous variables that affect trip attraction. Thus, in trip demandestimation, trip production is considered as the base of analysisand trip attraction is balanced with regard to trip production,if there is no balance between trip production and attraction instudy area. Therefore, trip attraction modeling is a challengingproblem in transportation planning regard to trip production.
The two selected variables among variables affect work tripattraction are number of employees and number of salesclerksand craftsmen. Real data are used to create EGANFIS models.
The EGANFIS construction for work trip attraction estima-tion model is as follows:
Step 1: According to expert experience, three fuzzy concepts(low, medium, and high) are defined for number ofemployees and number of salesclerks and craftsmen. Atriangular membership function is considered for eachconcept. Figure 3 shows the model learning space, x
axis for number of employees and y axis for number
Table 1 ANFIS and EGANFIS Model for Work Trip Attraction Estimation.
“if” conditions “then” output
Rule Number Number of Employees NSC ANFIS EGANFIS
1 Low Low 17 02 Low Medium 2036 22363 Low Large 7274 55844 Medium Low 2199 29035 Medium Medium 7282 62366 Medium Large 4170 78557 Large Low 5735 43058 Large Medium 6724 76129 Large Large 9704 11400
of salesclerks and craftsmen. As shown, the learningspace is divided into four regions.
Step 2: An ANFIS model using all observation data is cre-ated. The ANFIS model consists of (3 × 3 = ) 9 rules.Table 1 shows the ANFIS model’s rules contain “if”antecedents and crisp values for “then” part (conse-quents).
Step 3: The ANFIS model is applied for prediction in eachregion. The number of data points in each region, meanand variance values of errors are computed, and theresults are presented in Table 2.
Assume a 95% confidence level for (MPMT -MPMri), usingEquation (3–6) and tdistribution result in the following:
t0.025,58 = 2.00
The standard error for region 4 has been computed usingEquation (3–7):
s.e.(µT
E − µr4E
) = 23.40
Therefore, the confidence interval for (MPMT -MPMr4) ac-cording to Equation (3–5) is as follows:
−493.80 ≤ MPM T − MPM r4 ≤ −400.2
Table 2 Mean and Variance Values for Each Region and All Data.
ANFIS EGANFIS
Region Number of Mean Variance Mean VarianceNumber Elements (n) (µE ) (σE) (µE ) (σE )
1 138 342 7.25 × 10⁴ 352 7.78 × 10⁴
2 13 452 7.91 × 10⁴ 306 5.55 × 10⁴
3 3 355 9.12 × 10⁴ 506 6.43 × 10⁴
4 2 805 1.21 × 10² 256 5.96 × 10⁴
Total data 156 358 7.60 × 10⁴ 340 7.20× 10⁴
intelligent transportation systems vol. 15 no. 1 2011
Dow
nloa
ded
by [
Flor
ida
Atla
ntic
Uni
vers
ity]
at 2
0:19
15
Nov
embe
r 20
14

NEURO-FUZZY APPROACH 21
NE1762 3524
1
0 Mem
bers
hip
Deg
ree
Low
Medium
Large
NSC1371 2700
1
0Mem
bers
hip
Deg
ree
Low
Medium
Large
Figure 4 Membership functions of work trip attraction models’ inputs.
The computation indicates that the confidence interval is innegative zone so that MPMT < MPMr4. On the other hand, themean error value for region 4 is statistically more than the totalmean error; therefore, region 4 is called a critical region. Thedata in this region should be improved by expert knowledgeand experience. This computation is also done to compare themean error for the rest of regions with total mean error. The finalresults prove that only region 4 is a critical region.
Step 4: Select region 4 as the critical region. According toan expert’s judgment, an analytical method is used to add com-plementary data to region 4. This analytical method is extrapo-lation. It means a line constructed through all observation datais used to compute output for inputs in the limit range of region4. The two inputs’ range of region 4 is divided into segments(number of salesclerks and craftsmen and number of employeesare respectively divided into four and three segments) and themiddle of each segment is computed. The outputs for all com-bination of segments’ middle values (4 × 3 = 12) are computedusing line constructed before. These outputs with related inputs(segments’ middle values) are added to training set to coverdata inadequacy. Figure 3 shows the data acquired from expertjudgment added to region 4 beside observational data.
Step 5: EGANFIS is created after completing learning spaceinformation about work trip attraction using complementarydata. Table 1 indicates the EGANFIS model’s rules in com-parison with ANFIS model before application of expert-guidealgorithm. For example EGANFIS rule no. 3:
If number of employees in a zone is low & number of salesclerksand craftsmen in the zone is high then number of work attractedtrips to the zone is 5584.
As Table 1 shows some rules’ crisp values of outputs in AN-FIS are obviously in conflict with some other rules because ofdata inadequacy. Expert-guided algorithm is used to compensatefor improving conflicts between rules. For example, comparerule no. 5 and 6 in which number of salesclerks and craftsmenchanges from “medium” to “large” but the crisp value of outputdecreases. After application of expert-guided algorithm, rules’outputs (especially for rules no. 5 and 6) are adjusted as it shownin last column of Table 1.
Table 2 shows how the mean and variance of estimationerror in each region vary for EGANFIS model. The last row
of this Table indicates that mean and variance of ANFIS esti-mation errors for total data decrease after using expert-guidedalgorithm.
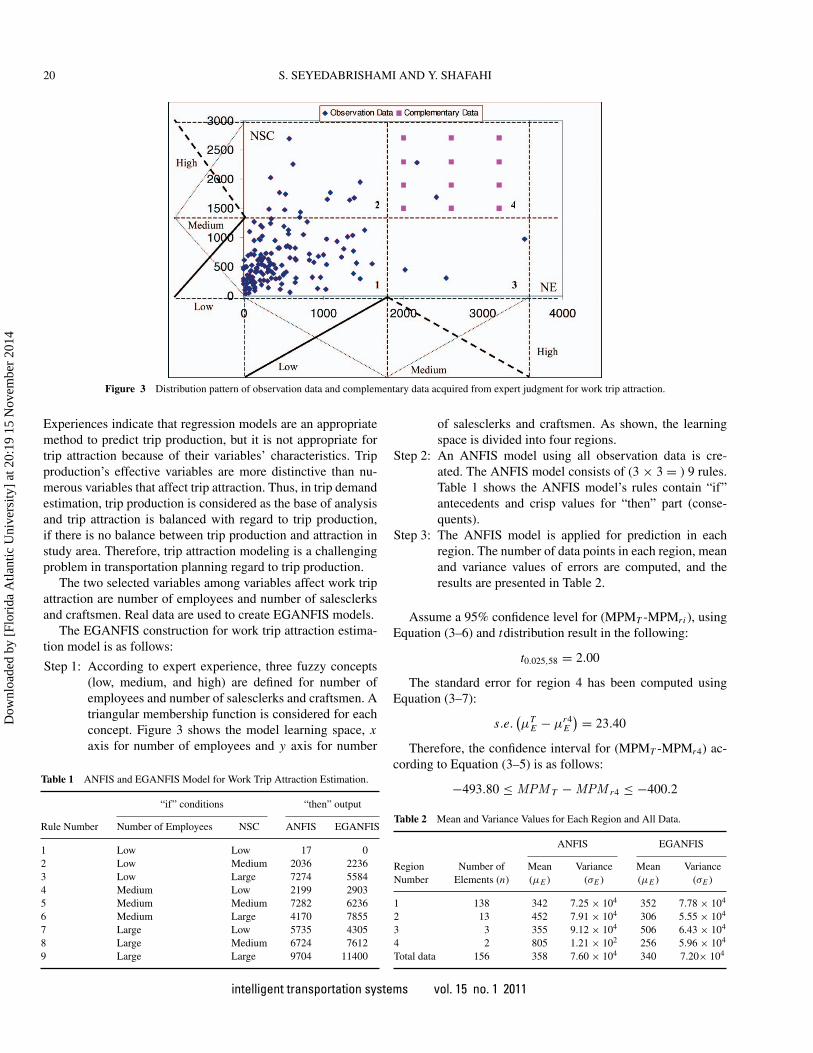
The inputs membership functions optimized by learning pro-cess are presented in Figure 4. The membership functions areassumed to be triangular; thus, three parameters (left, middle,and right points) are required to specify the membership func-tions. These parameters are computed through learning processfrom observational data. These values for both number of em-ployees and number of salesclerks and craftsmen membershipfunctions are shown in Figure 4.
The inference process for EGANFIS model shows in Fig-ure 5. The figure illustrates how rule firing strengths (rules’weights) are computed for an example input (number of em-ployees = 800, NSC = 2200). As it is shown, model’s outputis usually influenced by more than two rules. Model output forthe example input based on Equation (3–9) is equal to 5582.6.
Etest for both models, ANFIS and EGANFIS, is computed asfollows:
EtestANFIS = 3.24 × 10⁵
EtestEGANFIS = 1.93 × 10⁵
Etest values show that the model estimation error for test datais reduced by one-third in EGANFIS model.
A conventional trip attraction regression model is used forcomparison with the new fuzzy models, ANFIS and EGAN-FIS. The first work trip attraction model was a regression modelwith a constant. Table 3 displays the summary and statisticsof the model. The adjusted R2, 0.916, and coefficient t values,18.460 and 19.899, are reasonable, though the constant t value,1.164, is not. The constant significance is 0.247, which is notsignificant at the 95% confidence level. Thus, the constant waseliminated from the next regression model. Table 3 also dis-plays the summary and coefficients of regression for the modelwithout a constant. The regression coefficients with t valuesof 19.340 and 26.747 are significant. Therefore, the regressionmodel without a constant was selected for comparison with thenew fuzzy models.
Getting a visual comparison of the different work trip attrac-tion models, Figure 6 shows diagrams (x axis: observationaldata and y axis: model estimation) and the value R2 is obtainedfrom a linear trend line. An increase in R2 value shows the
intelligent transportation systems vol. 15 no. 1 2011
Dow
nloa
ded
by [
Flor
ida
Atla
ntic
Uni
vers
ity]
at 2
0:19
15
Nov
embe
r 20
14

22 S. SEYEDABRISHAMI AND Y. SHAFAHI
Figure 5 Inference from work trip attraction EGANFIS for an example input (number of employees = 800, number of salesclerks and craftsmen = 2200).
high precision of models’ estimations. As the R2 values show,the model learning and generalization capability is improvedby expert knowledge used in modeling regard to traditional ap-proach (regression model) and also ANFIS model without ex-pert knowledge. Comparing R2 values in Figures 6(a), 6(c) and6(e) for model estimation for training data set and Figures 6(b),
6(d) and 6(f) for model estimation for test data set reveals thatestimations’ accuracy is enhanced in EGANFIS.
Figure 7 shows ANFIS and EGANFIS outputs versus twoinputs in a three dimensional graph. EGANFIS presents asmoother surface than ANFIS. It means small changes in twoinputs causes small changes in EGANFIS output whereas
intelligent transportation systems vol. 15 no. 1 2011
Dow
nloa
ded
by [
Flor
ida
Atla
ntic
Uni
vers
ity]
at 2
0:19
15
Nov
embe
r 20
14

NEURO-FUZZY APPROACH 23
Figure 6 Observation data and estimation comparison for (a) regression model training dataset, (b) regression model test data set, (c) ANFIS model trainingdata set, (d) ANFIS model test data set, (e) EGANFIS model training data set, and (f) EGANFIS model test data set.
sudden large unacceptable changes in ANFIS output in regardto small changes in inputs is shown in Figure 7.
The sensitivity analysis of the data acquired from expertjudgment investigates the variations of outputs’ accuracy if ex-
pert’s viewpoints have been changed. The values of data whichare added by expert to the system (expert’s viewpoints) havebeen increased 2, 5, and 10 percents and also decreased by thesame percents and the models’ evaluating criteria have been
Figure 7 EGANFIS and ANFIS models’ outputs versus two inputs for work trip attraction. (Figure available in color online).
intelligent transportation systems vol. 15 no. 1 2011
Dow
nloa
ded
by [
Flor
ida
Atla
ntic
Uni
vers
ity]
at 2
0:19
15
Nov
embe
r 20
14

24 S. SEYEDABRISHAMI AND Y. SHAFAHI
Table 3 Summary and Coefficients of Regression Model for Work TripAttraction.
Regression Model With Constant
Variable Coefficients B t p
Constant 93.814 — 1.164 .247Number of employees 1.555 0.562 18.460 .000Number of salesclerks and craftsmen 1.962 0.605 19.899 .000Summary statistics:Number of observations:156Adjusted R2: 0.916F value: 563.6F Value significance: 0.000
Regression Model Without ConstantNumber of employees 1.579 0.450 19.340 .000Number of salesclerks and craftsmen 2.036 0.076 26.747 .000Summary statistics:Number of obs.:156Adjusted R2: 0.970F value: 1667.5Sig. F: 0.000
indicated in Table 4. As the results show, the evaluating crite-ria have been inconsiderably changed. The sensitivity analysisshows that expert viewpoints absolute values may not greatlychange EGANFIS results, but experts provide general guide forANFIS in regions in which patterns are hardly recognized. AsFigure 7 illustrates the expert general viewpoints restore ANFISsurface breakpoints, however its slope and outputs’ values donot greatly changed compare to EGANFIS.
The summary results of other EGANFIS models developedfor trip attraction prediction with shopping, recreation andschool purpose; and for trip production prediction with fourmajor purposes are shown in Table 5.
The explanatory variables used to predict these purposes ofattraction and production are as follows:• Shopping trip attraction: number of salesclerks and crafts-
men, specific zone for shopping (zone with large and variousshopping centers)
• Recreation trip attraction: zone population,2 existing recre-ation area in a zone
• School trip attraction: number of university and high schoolstudents, ratio of school students to population in each zone
• Work trip production: number of employees and car owner-ship in each zone
• Shopping trip production: zone population, car ownership ineach zone
• Recreation trip production: zone population, car ownership ineach zone
• School trip production: number of inhabitant student and carownership in each zone
2Since trips for friend and relative visits considered as recreation trip in Shi-raz comprehensive transportation study so that zone population is a meaningfulexplanatory variable for recreation trip attraction modeling.
Table 4 Work Trip Attraction EGANFIS Model Sensitivity Analysis onExpert Viewpoints.
R2 EVariation ofExpert Viewpoints Train Test Train Test
0% 0.9648 0.9289 1.72 × 10⁵ 2.30 × 10⁵
+2% 0.9655 0.9299 1.70 × 10⁵ 2.03 × 10⁵
+5% 0.9646 0.9305 1.75 × 10⁵ 1.95 × 10⁵
+10% 0.9619 0.9307 1.87 × 10⁵ 1.95 × 10⁵
–2% 0.9655 0.9292 1.70 × 10⁵ 2.00 × 10⁵
–5% 0.9646 0.9292 1.76 × 10⁵ 2.01 × 10⁵
–10% 0.9609 0.9290 1.93 × 10⁵ 2.00 × 10⁵
The evaluation and comparisons of these models withtraditional approach and ANFIS model indicate EGANFISability to improve learning and generalization capabilities ofestimation model specially in trip attraction models becauseas mentioned before because of various effective variables inattraction, improvements of these models are more consider-able. Table 5 shows the summary of results. Since regressionmodels’ performance for trip production estimation is usuallybetter than trip attraction estimation, the superiority of EGAN-FIS in attraction compare to regression is noticeable. Theresults indicate more improvement in EGANFIS models com-pare to traditional models when traditional models have poorperformance.
The trip distribution models including gravity model as atraditional one and ANFIS and EGANFIS are constructed us-ing Shiraz data. Three influential factors including number ofproduced and attracted trips in each zone as well as average cartravel time between zones are used to build the trip distributionmodels. The expert knowledge-guided models’ performance iscompared to traditional models and ANFIS models accordingto two criteria: R2 and E with the same definition presentedbefore. Table 6 shows results that reveal better performance ofEGANFIS models rather than the other two models.
EGANFIS is also constructed for modal split in aggregatelevel. The aggregate modal split predicts the probability of se-lecting different transportation modes for trips between pair oforigin and destination. The influential factors for modal splitmodel for different trip purposes are: zone average car owner-ship (ZC) and car travel time between pair of origin and des-tination (CT) for work purpose, zone average car ownershipand shortest distance between pair of origin and destination forschool, shopping, and recreation purposes. The same influentialfactors are used for constructing EGANFIS, ANFIS, and multi-nomial logit model (MNL). The modes are categorized intopublic and private modes. Table 7 shows the MNL parametersfor the work trip modal split as a sample conventional model.The transit mode is assumed to be the base outcome. The MNLcomputes the probability of selecting a private mode for thework trip. The positive sign of ZC shows that private choiceutility increases when the traveler lives in a zone with higheraverage car ownership. The negative sign of CT demonstrates
intelligent transportation systems vol. 15 no. 1 2011
Dow
nloa
ded
by [
Flor
ida
Atla
ntic
Uni
vers
ity]
at 2
0:19
15
Nov
embe
r 20
14
NEURO-FUZZY APPROACH 25
Table 5 Comparison of Proposed Models with Traditional Model for Trip Generation.
R2 E
Purpose Model Train Test Train Test
Trip Attraction Work Regression 0.9177 0.9241 2.02 × 10⁵ 2.56 × 10⁵
ANFIS 0.9258 0.8861 1.58 × 10⁵ 6.97 × 10⁵
EGANFIS 0.9648 0.9289 1.72 × 10⁵ 2.03 × 10⁵
Shopping Regression 0.8723 0.7615 1.70 × 10⁵ 1.98 × 10⁵
ANFIS 0.9044 0.7537 1.50 × 10⁵ 1.46 × 10⁵
EGANFIS 0.9055 0.8652 1.16 × 10⁵ 1.26 × 10⁵
Recreation Regression 0.4590 0.2676 9.40 × 10⁴ 1.85 × 10⁵
ANFIS 0.6206 0.0682 6.37 × 10⁴ 3.76 × 10⁵
EGANFIS 0.7626 0.6157 5.92 × 10⁴ 8.82 × 10⁴
School Regression 0.5354 0.4346 1.11 × 10⁶ 1.85 × 10⁶
ANFIS 0.6850 0.016 6.38 × 10⁵ 8.16 × 10⁶
EGANFIS 0.8429 0.6973 1.06 × 10⁶ 1.83 × 10⁶
Trip Production Work Regression 0.9240 0.9624 1.2 × 10⁵ 9.88 × 10⁴
ANFIS 0.9380 0.9327 9.86 × 10⁴ 2.20 × 10⁵
EGANFIS 0.9660 0.9649 9.08 × 10⁴ 9.13 × 10⁴
Shopping Regression 0.8203 0.8348 3.64 × 10⁴ 3.96 × 10⁴
ANFIS 0.8479 0.7795 3.00 × 10⁴ 5.25 × 10⁴
EGANFIS 0.8621 0.8391 2.77 × 10⁴ 2.84 × 10⁴
Recreation Regression 0.7833 0.8399 5.93 × 10⁴ 6.46 × 10⁴
ANFIS 0.8033 0.7463 4.52 × 10⁴ 1.07 × 10⁵
EGANFIS 0.8846 0.8552 4.70 × 10⁴ 5.27 × 10⁴
School Regression 0.8791 0.9287 1.22 × 10⁵ 9.54 × 10⁴
ANFIS 0.9449 0.1603 5.54 × 10⁴ 3.53 × 10⁵
EGANFIS 0.9804 0.9304 5.56 × 10⁴ 9.40 × 10⁴
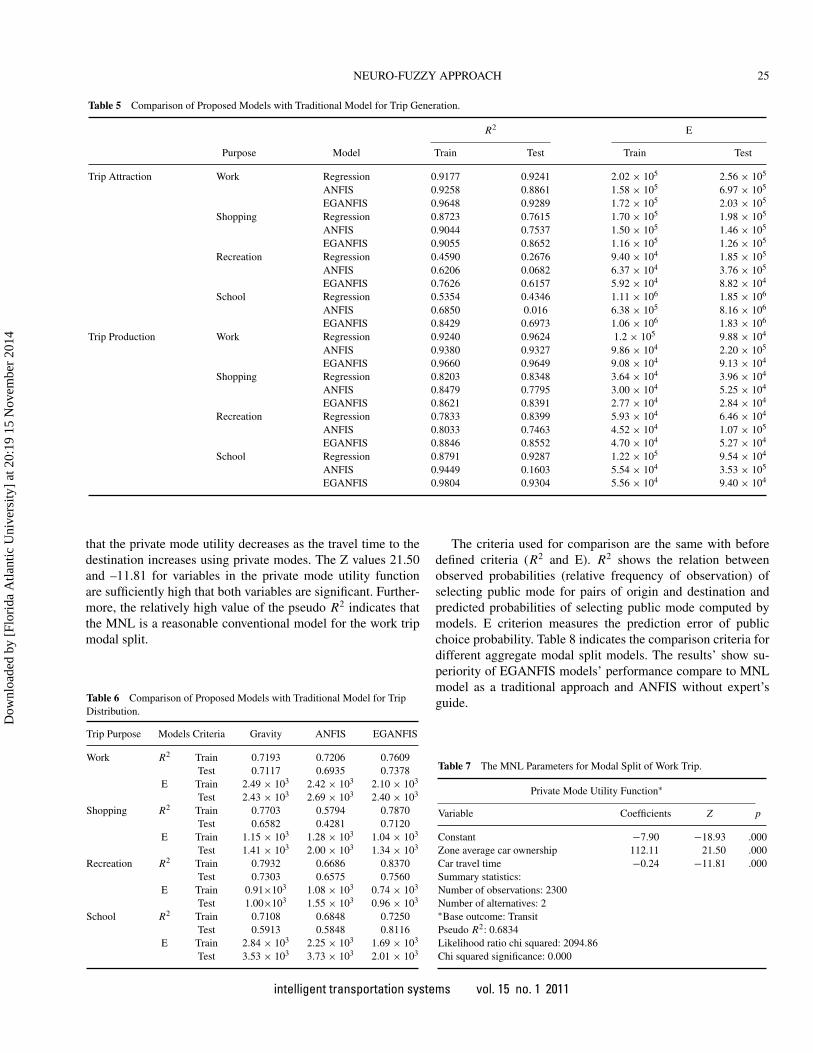
that the private mode utility decreases as the travel time to thedestination increases using private modes. The Z values 21.50and –11.81 for variables in the private mode utility functionare sufficiently high that both variables are significant. Further-more, the relatively high value of the pseudo R2 indicates thatthe MNL is a reasonable conventional model for the work tripmodal split.
Table 6 Comparison of Proposed Models with Traditional Model for TripDistribution.
Trip Purpose Models Criteria Gravity ANFIS EGANFIS
Work R2 Train 0.7193 0.7206 0.7609Test 0.7117 0.6935 0.7378
E Train 2.49 × 10³ 2.42 × 10³ 2.10 × 10³
Test 2.43 × 10³ 2.69 × 10³ 2.40 × 10³
Shopping R2 Train 0.7703 0.5794 0.7870Test 0.6582 0.4281 0.7120
E Train 1.15 × 10³ 1.28 × 10³ 1.04 × 10³
Test 1.41 × 10³ 2.00 × 10³ 1.34 × 10³
Recreation R2 Train 0.7932 0.6686 0.8370Test 0.7303 0.6575 0.7560
E Train 0.91×10³ 1.08 × 10³ 0.74 × 10³
Test 1.00×10³ 1.55 × 10³ 0.96 × 10³
School R2 Train 0.7108 0.6848 0.7250Test 0.5913 0.5848 0.8116
E Train 2.84 × 10³ 2.25 × 10³ 1.69 × 10³
Test 3.53 × 10³ 3.73 × 10³ 2.01 × 10³
The criteria used for comparison are the same with beforedefined criteria (R2 and E). R2 shows the relation betweenobserved probabilities (relative frequency of observation) ofselecting public mode for pairs of origin and destination andpredicted probabilities of selecting public mode computed bymodels. E criterion measures the prediction error of publicchoice probability. Table 8 indicates the comparison criteria fordifferent aggregate modal split models. The results’ show su-periority of EGANFIS models’ performance compare to MNLmodel as a traditional approach and ANFIS without expert’sguide.
Table 7 The MNL Parameters for Modal Split of Work Trip.
Private Mode Utility Function∗
Variable Coefficients Z p
Constant −7.90 −18.93 .000Zone average car ownership 112.11 21.50 .000Car travel time −0.24 −11.81 .000Summary statistics:Number of observations: 2300Number of alternatives: 2∗Base outcome: TransitPseudo R2: 0.6834Likelihood ratio chi squared: 2094.86Chi squared significance: 0.000
intelligent transportation systems vol. 15 no. 1 2011
Dow
nloa
ded
by [
Flor
ida
Atla
ntic
Uni
vers
ity]
at 2
0:19
15
Nov
embe
r 20
14

26 S. SEYEDABRISHAMI AND Y. SHAFAHI
Table 8 Comparison of Proposed Models with Traditional Model for ModalSplit.
Trip Purpose Models Criteria MNL ANFIS EGANFIS
Work R2 Train 0.8315 0.8939 0.9131Test 0.8043 0.8996 0.9072
E Train 5.5 × 10⁻³ 0.93 × 10⁻³ 0.85 × 10⁻³
Test 2.5 × 10⁻³ 1.4 × 10⁻³ 1.0 × 10⁻³
Shopping R2 Train 0.6846 0.8527 0.9107Test 0.7280 0.8792 0.8985
E Train 9.89 × 10⁻² 0.22 × 10⁻² 0.18 × 10⁻²
Test 9.94 × 10⁻² 0.18 × 10⁻² 0.20 × 10⁻²
Recreation R2 Train 0.2301 0.3005 0.5411Test 0.2970 0.3669 0.5335
E Train 2.91 × 10⁻² 0.99 × 10⁻² 0.83 × 10⁻²
Test 2.71 × 10⁻² 0.93 × 10⁻² 0.87 × 10⁻²
School R2 Train 0.1341 0.3756 0.5565Test 0.1318 0.3785 0.5135
E Train 9.9 × 10⁻² 0.44 × 10⁻² 0.37 × 10⁻²
Test 10.0 × 10⁻² 0.45 × 10⁻² 0.39 × 10⁻²
CONCLUSION
An aggregate travel demand estimation taking uncertain-ties bring about people’s perception and variables with inexactvalues into account is constructed and applied to a real-worldproblem. The model uses an expert-guided algorithm in ANFISstructure to deal with uncertainties in travel demand estima-tion. The algorithm aims at compensating for data inadequacyin learning space partitions. Rule base structure of ANFIS fa-cilitates application of expert knowledge usually expressed byrules with linguistic terms in the rules’ antecedents (if part).
The EGANFIS algorithm divides learning space into someregions based on fuzzy linguistic terms defined by experts.According to expert judgment, qualitative or quantitative tech-niques are used to identify regions in which data is inadequate.In this paper, a statistical comparison of ANFIS estimation errorin each region with total ANFIS estimation error is assumed tobe a criterion for identification of critical regions. The expertsusually provide incomplete rules to add to EGANFIS rule baseor analytically use some quantitative methods to support data insome critical regions.
Numerical examples validate the implementation of EGAN-FIS and its’ superior performance regard to traditional and AN-FIS models. These examples show how the algorithm enhancesmodel learning and generalization capabilities for estimatingtrip production, attraction, distribution, and modal split. Besidebetter EGANFIS models’ performance, EGANFIS applicationof fuzzy linguistic terms in if-then rule structure makes modelssimply interpretable in regard to conventional models.
REFERENCES
Akiyama, T., and Tsuboi, H. (1996). Description of route choice be-havior by multi-stage fuzzy reasoning. Conference on Highways tothe Next Century, Hong Kong, November 1996.
Banks, J., Carson, J. S., and Nelson, B. L. (1995). Discrete-event systemsimulation (4th ed.). New Jersey: Prentice-Hall.
Federal Highway Administration. (2003). Intelligent Transporta-tion System Deployment Analysis System (IDAS). Retrieved fromhttp://idas.camsys.com
Guillaume, S. (2001). Designing fuzzy inference system from data: Aninterpretability-oriented review. IEEE Transaction on Fuzzy Sys-tems, 9, 426–443.
Guillaume, S., and Magdalena, L. (2006). Expert guided integration ofinduced knowledge into fuzzy knowledge base. Soft Computing, 10,773–784.
Henn, V. (2000). Fuzzy rout choice model for traffic assignment. FuzzySets and Systems, 116, 77–101.
Henn, V. (2005). What is the meaning of fuzzy costs in fuzzytraffic assignment models? Transportation Research Part C, 13,107–119.
Jyh-Shing, R. J. (1993). ANFIS: Adaptive-network-based fuzzy infer-ence system. IEEE Transactions on Systems, Man, and Cybernetics,23, 665–685.
Kalic, M., and Teodorovic, D. (1997). Soft computing approachto trip generation modeling. Conference on Fuzzy Sets inTraffic and Transport Systems, Budva, Yugoslavia, September2002.
Kalic, M., and Teodorovic, D. (2003). Trip distribution modeling usingfuzzy logic and genetic algorithm. Transportation Planning andTechnology, 26, 213–238.
Lotan, T., and Koutsopoulos, H. (1993). Route choice in the pres-ence of information using concepts from fuzzy control and ap-proximate reasoning. Transportation Planning and Technology, 17,113–126.
Meyer, M. D., and Miller, E. J. (1984). Urban transportation planning:A decision-oriented approach (2nd ed.). Singapore: McGraw-Hill.
Mitra, S., and Hayashi, Y. (2000). Neuro-fuzzy rule generation: Sur-vey in soft computing framework. IEEE Transactions on NeuralNetworks, 11, 748–768.
Mitra, S., De, R. K., and Pal, S. K. (1997). Knowledge-based fuzzyMLP for classification and rule generation. IEEE Transactions onNeural Networks, 8, 1338–1350.
Nauck, D., Klawonn, F., and Kruse, R. (1997). Foundations of neuro-fuzzy systems (2nd ed.). London, England: Wiley.
Ortuzar, J. D., and Willumsen, L. G. (2001). Modeling transport (2nded.). London, England: Wiley.
Poorzahedey, H., Ashtiani, H., Shafahi, Y., Tabatabaee, N., andKermanshah, M. (2000). Production and attraction models. Reporton Shiraz Comprehensive Transportation Study. Sharif UniversityInstitute of Transportation Studies and Research.
Quadrado, J. C., and Quadrado, A. F. (1996). Fuzzy modeling of acces-sibility: Case study-Lisbon metropolitan area. Conference on Intelli-gent Techniques and Soft Computing, Aachen, Germany, September1996.
Ross, T. J., Booker, J. M., and Parkinson, W. J. (2002). Fuzzylogic and probability applications: Bridging the gap. Philadelphia,PA: Society for Industrial and Applied Mathematics, ASASIAM.
Shafahi, Y., and Abrishami, E. S. (2005). School trip attraction mod-eling using neural and fuzzy-neural approaches. IEEE Conferenceon Intelligent Transportation Systems, Vienna, Austria, September2005.
Shafahi Y., and Abrishami, S. E. (2006). School trip production mod-eling using an improved adaptive-network-based fuzzy inference
intelligent transportation systems vol. 15 no. 1 2011
Dow
nloa
ded
by [
Flor
ida
Atla
ntic
Uni
vers
ity]
at 2
0:19
15
Nov
embe
r 20
14

NEURO-FUZZY APPROACH 27
system. IEEE Conference on Intelligent Transportation Systems,Toronto, Ontario, Canada, September 2006.
Shafahi, Y., and Farzaneh, M. R. (2002). Application of NNS and NFSin forecasting trip demand in large cities. Transportation ResearchBoard Conference, Washington DC.
Shafahi, Y., and Nazari, S. (2006). Disaggregate mode choice analysisfor work trip using genetic-fuzzy and neuro-fuzzy systems. Con-ference on Artificial Intelligence and Soft Computing, Palma deMallorca, Spain, August 2006.
Shafahi, Y., Nourbakhsh, S. M., and Seyedabrishami, S. (2008). Fuzzytrip distribution models for discretionary trips. IEEE Conference onIntelligent Transportation Systems, Beijing, China, October 2008.
Shafahi, Y., and Ramezani, H. (2007). Application of fuzzy theoryfor traffic assignment. Conference on Modeling and Simulation,Montreal, Quebec, Canada, June 2007.
Teodorovic, D. (1999). Fuzzy logic systems for transportation engi-neering: The state of the art. Transportation Research Part A, 33,337–364.
Teodorovic, D., and Kikuchi, S. (1991). Application of fuzzy sets theoryto the saving based vehicle routing algorithm. Civil EngineeringSystems, 8, 87–93.
Teodorovic, D., and Kalic, M. (1995). A fuzzy route choice model forair transportation networks. Transportation Planning and Technol-ogy, 19, 109–119.
Teodorovic, D., and Vukadinovic, K. (1998). Traffic control and trans-port planning, a fuzzy sets and neural networks approach. Mas-sachusetts: Kluwer Academic Publisher.
U.S. Department of Transportation. (2002). Incorporating intelligenttransportation systems into planning analysis (FHWA-OP-02-031EDL#13605). Washington, DC.
Xu, W., and Chan, Y. (1993a). Estimating an origin-destination matrixwith fuzzy weights. Part 1: Methodology. Transportation Planningand Technology, 17, 127–144.
Xu, W., and Chan, Y. (1993b). Estimating an origin-destination matrixwith fuzzy weights. Part 2: Case studies. Transportation Planningand Technology, 17, 145–164.
Zadeh, L. (1965). Fuzzy sets. Information and Control, 8, 338–353.Zadeh, L. (1995). Discussion: Probability theory and fuzzy logic are
complementary rather than competitive. Technometrics, 37, 271–276.
Zadeh, L. (1996). Fuzzy logic = computing with words. IEEE Trans-actions on Fuzzy Systems, 177, 103–111.
intelligent transportation systems vol. 15 no. 1 2011
Dow
nloa
ded
by [
Flor
ida
Atla
ntic
Uni
vers
ity]
at 2
0:19
15
Nov
embe
r 20
14