Embed Size (px)
Citation preview

WORKING PAPER 220
Andrej Cupak, Pirmin Fessler, Maria Silgoner, Elisabeth Ulbrich
Exploring differences in financial literacy across countries: the role of individual characteristics and institutions

The Working Paper series of the Oesterreichische Nationalbank is designed to disseminate and to provide a platform for Working Paper series of the Oesterreichische Nationalbank is designed to disseminate and to provide a platform for Working Paper series of the Oesterreichische Nationalbankdiscussion of either work of the staff of the OeNB economists or outside contributors on topics which are of special interest to the OeNB. To ensure the high quality of their content, the contributions are subjected to an international refereeing process. The opinions are strictly those of the authors and do in no way commit the OeNB.
The Working Papers are also available on our website (http://www.oenb.at) and they are indexed in RePEc (http://repec.org/).
Publisher and editor Oesterreichische Nationalbank Otto-Wagner-Platz 3, 1090 Vienna, AustriaPO Box 61, 1011 Vienna, [email protected] (+43-1) 40420-6666Fax (+43-1) 40420-046698
Editorial Board Doris Ritzberger-Grünwald, Ernest Gnan, Martin Summerof the Working Papers
Coordinating editor Coordinating editor Coordinating editor Martin Summer
Design Communications and Publications Division
DVR 0031577
ISSN 2310-5321 (Print)ISSN 2310-533X (Online)
© Oesterreichische Nationalbank, 2018. All rights reserved.

Exploring differences in financial literacy
across countries: the role of individual
characteristics and institutions*
Andrej Cupak�, Pirmin Fessler�, Maria Silgoner�, Elisabeth Ulbrich
February 2018
Abstract
We examine recently compiled microdata from the OECD/INFE survey covering in-
formation on the �nancial literacy of adult individuals from twelve countries around the
globe. We �nd large di�erences in �nancial literacy across countries and decompose them
into those explainable by di�erences in individual characteristics and those that cannot be
explained by such di�erences. We show that individual characteristics matter with regard
to di�erences in average �nancial literacy, but do not fully explain the observed di�er-
ences. We further relate the unexplained di�erences in our microeconometric analysis to
institutional di�erences across countries. We �nd strong relationships between the di�er-
ences in �nancial literacy not explained by individual characteristics and life expectancy,
social contribution rate, PISA math scores, internet usage, and to a lesser degree by GDP
per capita, the gross enrolment ratio and stock market capitalization. Our results suggest
that there is room for harmonization of economic environments across countries regarding
decreasing inequality in the population's �nancial literacy.
JEL Classi�cations: D14, D91, I20
Key Words: �nancial literacy gaps, inequality, decomposition analysis, counterfactual meth-
ods, personal �nance, survey data
*We are grateful to the OECD/INFE working group for granting access to the individual-level data. Wewould like to thank Alyssa Schneebaum and an anonymous referee for helpful comments and suggestions.We are also grateful to audiences at the following seminars and conferences: Oesterreichische Nationalbankresearch seminar (Vienna, 2017); National Bank of Slovakia research seminar (Bratislava, 2017); HFCS networkmeeting at the ECB (Frankfurt, 2017); Joint ECB and Banque de France conference on household �nance andconsumption (Paris, 2017); and Slovak Economic Association annual conference (Kosice, 2017). The viewsexpressed in the paper do not necessarily re�ect the views of the Oesterreichische Nationalbank, the NationalBank of Slovakia, the Eurosystem, or the LIS: Cross-National Data Center in Luxembourg. Andrej Cupak wasa visiting researcher at the Oesterreichische Nationalbank when he started this research project.
�Research Department, National Bank of Slovakia; and LIS: Cross-National Data Center in Luxembourg,[email protected].
�Economic Analysis and Research Department, Oesterreichische Nationalbank, [email protected].�Foreign Research Division, Oesterreichische Nationalbank, [email protected].¶Financial Education Unit, Oesterreichische Nationalbank, [email protected].

Non-technical summary
Modern life is full of �nancial choices. These vary from basic day-to-day decisions such as
organizing budgets to more complex ones such as taking a loan, participating in private pension
savings schemes, or investing in sophisticated �nancial instruments. Recent literature has
shown that along with standard socio-economic characteristics that vary across individuals,
�nancial literacy is a relevant ingredient for making sound �nancial decisions. Being �nancially
literate is not only important for the wellbeing of consumers themselves, but also for the
�nancial system as a whole. Consumers' informed and sound �nancial choices are important
for �nancial stability. If better �nancial literacy also leads to more sound �nancial behavior,
we can expect fewer �nancial problems and ultimately fewer shortfalls in �nancial payments.
Generally, the risk-bearing capacity of households and the �nancial system as a whole would
increase with greater �nancial literacy.
Average �nancial literacy di�ers markedly across countries. What was missing in the literature
until now, though, has been an understanding of why there are these observed di�erences. Is
�nancial literacy higher in one country because its population has certain characteristics (such
as higher education), or is there something else at play? In this study, we estimate which
di�erences in the gap are explainable by individual characteristics (age, education, household
size, working status, and others) and which remain attributable to factors we cannot observe.
Learning what is behind the gap in �nancial literacy across countries is important because
the �ndings might suggest di�erent policy conclusions. Imagine a gap in observed �nancial
literacy between two countries. On the one hand, this gap may exist even within education
groups; this would be the case if �nancial literacy di�ered among the highly educated across
the two countries. On the other hand, the gap could exist across countries even if the �nancial
literacy within education groups across countries were the same; this could be the case if
the share of highly educated individuals is higher in one country. From a policy perspective,
these two cases need to be dealt with di�erently. Whereas the �rst raises the question of why
similarly educated groups have di�erent �nancial literacy across countries, the second case can
be addressed by increasing educational attainment.
Our results show that di�erences in individual characteristics matter considerably. We also
show that di�erent socioeconomic environments across countries might play a role in explaining
varying levels of �nancial literacy. We conclude that individual characteristics should be taken
into account when comparing �nancial literacy across countries, speci�cally when the countries
are ranked based on their populations' level of �nancial literacy, as in the OECD/INFE (e.g.
OECD, 2016) report. It is rather important to have an �apples to apples� comparison to design
policies in an informed way.

1 Introduction
The importance of �nancial literacy as a main ingredient of informed choices and sound �nan-
cial behavior of consumers has recently been recognized in the literature (see e.g. Campbell,
2006; Jappelli, 2010; Hastings et al., 2013; Fernandes et al., 2014; Lusardi and Mitchell, 2014).
Moreover, the literature shows that poor outcomes in household �nance and questionable in-
vestment decisions mostly occur for households with low levels of income and �nancial literacy
(Campbell, 2006; Badarinza et al., 2016).
We observe large di�erences in average �nancial literacy across countries (Lusardi and
Mitchell, 2014; Standard and Poor's, 2014). The policy implications of this �nding are, how-
ever, unclear since this depends on the homogeneity of the populations. It remains unknown
how much of the observed di�erence is country-speci�c and how much is driven by di�erences
in the individual characteristics of the (sampled) population. We deliver estimates of how
much of this di�erence is due to di�erences in the characteristics of the population.
We seek to answer the following research questions in this paper: How large are �nancial
literacy gaps across countries? Are the observed di�erences in �nancial literacy mainly due
to di�erences in observable individual characteristics? Do institutional factors play a role in
explaining �nancial literacy gaps across countries?
These fundamental questions are relevant for potential policies aimed at increasing �nan-
cial awareness. To illustrate why it is important to not only use unconditional comparisons
such as those presented in the existing literature on di�erences in �nancial literacy across
countries (e.g. OECD, 2016), we point to an example with regard to educational attainment.
On the one hand, a gap in average �nancial literacy may exist across countries within edu-
cation groups; this would be the case if �nancial literacy di�ered among the highly educated
in country A versus country B. On the other hand, a gap could exist across countries even if
the �nancial literacy within education groups is the same across countries if the share of, say,
highly educated individuals is higher in country A than in country B. From a policy perspec-
tive these gaps need to be dealt with di�erently. Whereas the �rst raises the question of why
similarly educated groups have di�erent �nancial literacy across countries, the second case can
be addressed by increasing educational attainment.
Furthermore, we investigate whether the links between individual characteristics and �-
nancial literacy di�er for individuals with low (basic) and high (advanced) levels of �nancial
literacy. Whereas educational attainment might be key to basic �nancial literacy, its relevance
might be less in the case of more advanced �nancial literacy.
1

Finally, we ask which di�erences in institutions are correlated with cross-country di�er-
ences in �nancial literacy that cannot be explained by individual characteristics. Character-
istics might explain part of the gap, but their interplay with di�erent environments across
countries is potentially relevant when explaining �nancial literacy gaps. One potentially rele-
vant institutional di�erence related to �nancial literacy may be di�erent welfare state regimes.
In some countries (such as Brazil, Russia, or the UK), investing privately for old age provision
or other precautionary motives is more important than in others (such as Austria, Finland,
or Germany). Moreover, the supply of �nancial services is di�erent in di�erent countries. In
some countries, the intermediation of banks is stronger (such as in continental Europe) than
in others (such as the UK).
In the previous literature, researchers have analyzed di�erences in �nancial literacy across
countries and groups of individuals primarily in a descriptive way. For example, according to
the Standard and Poor's (2014) survey, the average percentage of adults that answered three
out of four �nancial literacy questions correctly is 56% in the old EU member states; 63% in
Australia, the USA, and Canada; and 45% in the Central and Eastern European (CEE) new
EU member states. Likewise, results of the OECD PISA survey show worse results for high-
school students from CEE countries compared to other Western European countries (OECD,
2013). Recently, the OECD (2016) showed substantial di�erences in the �nancial literacy of
the adult population across the world as well as across European countries. Other examples of
descriptive studies on cross-country �nancial literacy gaps include Atkinson and Messy (2011)
and Lusardi and Mitchell (2011). An exception is a study by Jappelli (2010), who analyzes
the relationship between macroeconomic variables and economic literacy using international
panel data on 44 countries over the period 1998-2008. Despite the identi�cation of important
factors driving di�erences in economic literacy across countries, the main shortcoming of Jap-
pelli (2010)'s study is that the level of economic literacy of the particular country is proxied
by the economic literacy of business leaders, hence o�ering a potentially biased picture.
Thus, until now, the di�erences in the observed distribution of �nancial literacy across
households and individuals have not been studied in a cross-country framework using compa-
rable individual-level survey data. We deliver such an analysis by answering the question of
what (possibly) determines the observed di�erences in �nancial literacy of individuals between
countries by employing microeconometric tools from the policy-evaluation and decomposition
literature.
Our study makes several contributions to the empirical literature on �nancial literacy and
household �nances. To our knowledge, we are the �rst to do a detailed analysis of the newest
2

wave of the OECD/INFE database on �nancial competencies of individuals. These data were
made available for research in the summer of 2017. The advantage of this database is its broad
set of questions, focusing on an extended set of �nancial knowledge questions as well as aspects
of �nancial attitudes and behavior. We are also the �rst to employ counterfactual decompo-
sition techniques to analyze the observed di�erences in �nancial literacy in a cross-country
perspective. In our framework, we consider individuals from Finland as a benchmark (refer-
ence) for �nancial literacy of individuals from other countries available in our dataset (namely
Austria, Brazil, Canada, Croatia, Hong Kong, Hungary, Germany, Jordan, The Netherlands,
Russia, and the UK).1 Our �ndings help to better understand the potential determinants of
gaps in �nancial literacy between countries, which are sometimes substantial � nearly 20%
in some cases (e.g. Finland vs. Croatia or Russia). We devise a two-step empirical strategy
to �rst decompose the di�erences into those due purely to di�erent individual characteristics
across countries and the remainder. Then, we use these remaining parts to analyze the poten-
tial linkage to institutions and a country's macroeconomic environment. Our methodological
framework builds on the existing literature of Christelis et al. (2013) and Bover et al. (2016).
The rest of this paper is structured as follows. Section 2 introduces the data. Section 3
includes the empirical strategy. Section 4 presents empirical results. Section 5 concludes.
2 Data
The data used for the analysis of �nancial literacy gaps across countries come from the
OECD/INFE (International Network for Financial Education) survey of adult �nancial lit-
eracy competencies. While the survey was conducted in more than 30 countries around the
world, only a few countries made the data available for research purposes. Hence, we have man-
aged to access individual-level data from Austria, Brazil, Canada, Croatia, Finland, Germany,
Hong Kong, Hungary, Jordan, The Netherlands, Russia, and the UK accounting together for
more than 15,000 observations. A unique feature of this survey is that the questions are asked
in a harmonized way across countries, making the results comparable, a major advantage as
compared to previous surveys on �nancial literacy. Also, the set of �nancial literacy questions
is much broader than in previous studies. In the earlier surveys, usually three/four basic �-
nancial literacy questions on interest rates, in�ation and diversi�cation/riskiness were asked
(Lusardi and Mitchell, 2014). In the OECD/INFE survey, questions include concepts such as
time value of money, interest paid on loans, interest and principal, compound interest, risk
1The choice of Finland as a reference category is reasonable not only for the data availability, but also forother reasons. For example, the Finnish population (both adults and high-school students) rank among thebest in di�erent �nancial literacy surveys (e.g. OECD, 2013, 2016) compared to the population from otherEuropean countries. Furthermore, Finnish households show an intense interaction with �nancial markets, asnearly 39% of households hold risky �nancial assets in their portfolios (Bover et al., 2016).
3

and return, in�ation, and risk diversi�cation. The data also contains standard socio-economic
characteristics.
Table 1 shows basic information with regard to the data collection in the countries were data
is already accessible. In 8 of the 12 countries face-to-face personal computer assisted interviews
were conducted. In one of them (Russia) some interviews were also conducted via telephone.
Two other countries used purely telephone interviews (Canada and Germany) whereas two
gathered the data via online interviews (The Netherlands and the United Kingdom). The
sample size ranges from 1,000 (Hong Kong and the United Kingdom) to 2,002 (Brazil). In many
countries the national central banks were responsible for gathering the data and delivering it
to the OECD/INFE. In others also universities, ministries or other governmental institutions
also conducted the harmonized survey developed by the OECD/INFE.
[Enter Table 1 here]
For our analysis we use a set of variables which is fully harmonized in all countries shown
in Table 2. It consists of our main variable of interest, the �nancial literacy score, which is
itself calculated from the answers given to a set of seven questions examining the �nancial
literacy of respondents. They deal with the understanding of in�ation, interest, interest plus
principal, compound interest, the relationship between risk and return and diversi�cation.
The detailed questions are listed in Appendix A. The �nancial literacy score of individuals
is computed similarly to the extant literature on �nancial literacy (e.g. Lusardi and Mitchell,
2014). Hence, the �nancial literacy score (as also used by the OECD/INFE) is computed as
a sum of all (seven) correctly answered questions asked in the survey.
In our empirical analysis, we �rst use a set of exogenous socio-economic individual char-
acteristics as predictors for the stock of �nancial literacy. In Appendix B, we also include a
set of endogenous variables capturing the experience of respondents with �nancial products
and �nancial planning. As individual characteristics we use age category dummies, a gender
dummy, a dummy for marital status, a dummy for university education and dummy variables
for di�erences in employment status. Furthermore we use a variable on the income bu�er
indicating that the individual has a �nancial bu�er of at least three times the monthly net
income, which therefore is also a crude measure of �nancial wealth. To cover experience in
Appendix B we use dummies on having a budget plan, being an active saver, holding risky
assets and engaging in long-term �nancial planning.
[Enter Table 2 here]
4

Figure 1 shows the distributions of the �nancial literacy score across all countries covered
in our analysis. In most countries the majority of individuals are able to answer 5 or more
questions correctly, in some countries the distribution is more skewed than in others.
[Enter Figure 1 here]
Table 3 shows descriptive statistics (means and standard deviations) for all countries and
all variables used in our empirical analysis. Note, that while the mean �nancial literacy score
varies substantially across countries, it still lies above 4.1 and below 5.2 (out of 7) correctly
answered questions in all countries. Also individual characteristics X vary substantially. In
some countries (Brazil) less than 10% of the population have university degrees while in others
(Canada, Jordan, The Netherlands and the UK) the share is above 30%. Also the proxy for
�nancial wealth, i.e. the income bu�er variable identifying individuals with at least 3 month
of their monthly income in �nancial assets, varies substantially. While in Russia only 24%
report having such a �nancial bu�er, 69% of Canadians do so. Also shares of singles and
employment status show remarkable di�erences. Regarding the individual characteristics we
use to capture experience in Appendix B, we �nd that the shares of individuals holding risky
assets is rather di�erent across countries. But also the softer measures of having a budget,
being an active saver as well as �nancial planning reveal substantial di�erences which might
potentially explain di�erences in �nancial literacy scores.
[Enter Table 3 here]
3 Empirical strategy
To study di�erences in �nancial literacy we employ di�erent empirical tools. In this section we
lay out our empirical approach. First, we present means of �nancial literacy across di�erent
socioeconomic groups across countries in subsection 3.1. Second, we estimate a conditional ex-
pectation function of �nancial literacy, controlling for country level �xed e�ects in subsection
3.2. Third, we decompose observed di�erences in �nancial literacy across countries and types
of individuals by employing standard counterfactual decomposition techniques (Blinder, 1973;
Oaxaca, 1973) in subsection 3.3. This step also includes use of the framework of unconditional
quantile regressions (Firpo et al., 2007, 2009) to extend our approach beyond the mean in
subsection 3.4. Finally, we correlate the unexplained parts of the gaps in �nancial literacy
with selected aggregate macroeconomic indicators which have been shown to in�uence �nan-
cial literacy at the country-level in subsection 3.5. The last step of our empirical framework
builds on the previous studies of Jappelli (2010), Christelis et al. (2013), and Bover et al.
5

(2016).
3.1 Average �nancial literacy across socioeconomic characteristics and coun-
tries
Formally, we observe a cross section of draws from country distribution functions F c of coun-
tries c ∈ C, of the matrix (L,X), where L denotes �nancial literacy and X a vector of individ-
ual characteristics such as education and age or indicators denoting experiences with �nancial
products. Let us think of �nancial literacy as an outcome variable and individual character-
istics as covariates. We calculate simple (conditional) means across di�erent subgroups and
countries. These descriptive results are discussed in subsection 4.1.
3.2 Estimation of the conditional expectation function
As a preliminary step to our empirical framework, we estimate the population conditional
expectation function (CEF) E(L∣X). If the CEF is linear, than the population regression
function is the population CEF. But even if it is not linear, the population regression function
is the best linear predictor of the population CEF in a minimum mean squared error sense.
Therefore we use a weighted linear regression to estimate the population CEF:
L = α + β′X + γI + ε, (1)
where α denotes a constant, X contains the predictors, β the slope parameters, I includes
country �xed e�ects with parameter vector γ and ε is the error term. The estimates for the
predictive e�ects β of di�erent socioeconomic characteristics on �nancial literacy are discussed
in subsection 4.2.
3.3 Decomposition analysis
As we are interested in explaining the di�erences in observed �nancial literacy across coun-
tries, we decompose them by means of the Blinder-Oaxaca (B-O) framework (Blinder, 1973;
Oaxaca, 1973). The B-O decomposition technique has been predominantly used in the labor
economics literature to study gaps in wages and employment. Recently, this method has also
been applied in the �eld of household �nance to study di�erences in stock-holdings between US
and euro-area households (Christelis et al., 2013), wealth di�erences across euro-area countries
(Mathä et al., 2017), or to study �nancial literacy gaps between male and female populations
in the US (Fonseca et al., 2012).
6

In our case, the B-O decomposition de�nes the mean di�erence in �nancial literacy scores
of individuals from the particular country studied and individuals from the reference group,
Finland. The mean di�erence is divided into two main parts � one explained by group di�er-
ences in observable individual characteristics under consideration, and another that cannot be
accounted for by di�erences in observed individual characteristics � i.e. di�erences in coe�-
cients, or how literacy is �produced� in the particular country.
Formally, we want to answer the question of how much of the mean di�erence in �nancial
literacy is accounted for by di�erences in characteristics of individuals between a benchmark
country c = j (Finland) and countries c ∈ C. The mean di�erence can be written as
△ µLc = E(Lc=j) −E(Lc). (2)
We can rewrite this di�erence based on regression parameters and decompose it into a part
explained by di�erences in characteristics X and an unexplained part,
△ µLc = [E(Xc=j) −E(Xc)]′ βc=j + [E(Xc)
′(βc=j − βc)] , (3)
where βc=j and βc are coe�cient vectors from regressions including only individuals of the
reference country c = j and country c, respectively. The �rst part [E(Xc=j) −E(Xc)]′ βc=j is
then the part of the di�erence that is due to di�erences in the individual characteristics X.
ˆ△µLc can then be estimated as,
ˆ△µLc = (X̄c=j − X̄c)′β̂c=j
´¹¹¹¹¹¹¹¹¹¹¹¹¹¹¹¹¹¹¹¹¹¹¹¹¹¹¹¹¹¹¹¹¹¹¹¹¹¹¹¹¹¹¹¹¸¹¹¹¹¹¹¹¹¹¹¹¹¹¹¹¹¹¹¹¹¹¹¹¹¹¹¹¹¹¹¹¹¹¹¹¹¹¹¹¹¹¹¹¹¹
explained
+ X̄ ′c(β̂c=j − β̂c)´¹¹¹¹¹¹¹¹¹¹¹¹¹¹¹¹¹¹¹¹¹¹¹¹¹¹¹¹¹¹¹¹¸¹¹¹¹¹¹¹¹¹¹¹¹¹¹¹¹¹¹¹¹¹¹¹¹¹¹¹¹¹¹¹¹¹
unexplained
, (4)
where X̄c=j and X̄c are covariate group means of the reference country c = j and country
c, respectively. Finally, we denote the estimate of the unexplained part for each country c,
E(Xc)′(βc=j − βc), which we use in a further step of our analysis by
χc = X̄′
c(β̂c=j − β̂c). (5)
We discuss the results of our decomposition in subsection 4.3.
3.4 Decomposition beyond the mean
The reasons for di�erences in average �nancial literacy might be di�erent for those in the lower
or higher parts of the distribution. Whereas in the lower part it is mostly about very basic
math (cognitive) skills (e.g. interest calculation), it is rather knowledge about the functioning
of certain sophisticated �nancial products at the top of the distribution. Basic schooling might
7

be important in the lower, but not important at all in the upper part. Therefore, to examine
whether the result of our decomposition holds also beyond the mean, we employ recently de-
veloped tools from the microeconometric decomposition literature.
We decompose distributions in the �nancial literacy scores between individuals from the
benchmark country c = j and country c by using recentered in�uence function (RIF) regres-
sions along with the B-O technique (Firpo et al., 2007, 2009).2 To do so we basically replace
the country level regressions underlying our approach with RIF-regressions. An RIF-regression
is similar to a standard regression, except that the dependent variable is replaced by the re-
centered in�uence function of the statistic of interest (see Firpo et al., 2009).
For the readers' convenience we summarize the basic approach. For our case of quantiles
of �nancial literacy scores L, the IF (L,Qτ) is given as (τ − 1{L ≤ Qτ}/fL(Qτ), where 1{⋅}
is an indicator function, fL(⋅) is the density of the marginal distribution of L, and Qτ is the
population τ -quantile of the unconditional distribution of L. The RIF (L;Qτ) is then equal
to Qτ + IF (L,Qτ), and can be written as
RIF (l;Qτ) = Qτ +τ − 1{l ≤ Qτ}
fL(Qτ)= c1,τ ⋅ 1{l > Qτ} + c2,τ , (6)
where c1,τ = 1/fL(Qτ) and c2,τ = Qτ − c1,τ ⋅ (1 − τ). As E[1{l > Qτ}] = Pr(L > Qτ) = 1 − τ , it
follows that E[RIF (l;Qτ)] = c1,τPr(L > Qτ)+ c2,τ = Qτ . By the law of iterated expectations,
we have
E[RIF (l;Qτ)] = EX{E[RIF (l;Qτ)]∣X}, (7)
which justi�es running a linear regression of the binary outcome variable 1{l > Qτ} on X (see
Fortin et al. (2011) and Firpo et al. (2009) for details). We run RIF-regressions for the 10th
(τ = 0.1) and 90th (τ = 0.9) percentiles Qτ as well as the median (τ = 0.5). This decomposition
at di�erent points of the distribution of �nancial literacy score allows us to investigate whether
individual characteristics and institutions matter in di�erent ways across the �nancial literacy
distribution. See subsections 4.3 and 4.4 for a discussion of results.
3.5 Coe�cient e�ects and institutions
In this stage of our framework, we correlate the unexplained parts of the gaps, estimated
from the B-O analysis χc, with selected macroeconomic indicators that have been shown to be
relevant for the �nancial literacy at the country-level (Jappelli, 2010). Our chosen aggregate
2An alternative way to perform a quantile decomposition analysis, which has been applied in severalempirical papers, is the approach suggested by Machado and Mata (2005).
8

indicators include GDP per capita, share of internet users, life expectancy, (gross) enrolment
ratio to secondary school, stock market capitalization, PISA match test score, and social
contributions rate (a proxy for welfare state). For a detailed description, see Table 4. Formally,
we can write this country-level relationship as a regression of our estimated unexplained parts
on macroeconomic indicators,
χ = α + φz + ε, ∀z ∈ Z, (8)
where α is a constant, z refers to one country level macroeconomic indicator of indicators Z,
and φ is the according slope parameter. φ̂ is then our estimate of the relationship between
unexplained parts χ and macroeconomic variable z ∈ Z. See subsection 4.4 for results and
discussion of this step.
[Enter Table 4 here]
4 Results
In this section we �rst discuss average �nancial literacy across countries and socioeconomic
characteristics in subsection 4.1. We then present our estimates of the conditional expecta-
tion function of �nancial literacy, controlling for country level �xed e�ects in subsection 4.2.
Subsection 4.3 includes the core of our analysis, the decomposition of cross-country di�erences
in �nancial literacy into parts explainable by individual characteristics and an unexplained
part. We also decompose beyond the mean at the 10th and 90th percentile of the �nancial
literacy distribution and the median. We employ the unexplained parts to correlate them with
macroeconomic and institutional variables to shed further light on potential drivers of di�er-
ences in �nancial literacy in subsection 4.4. In Appendix B we deliver a robustness check, in
which we add the potentially endogenous variables capturing experience presented in section
2 to the analyses.
4.1 Socioeconomic characteristics
Table 5 shows average �nancial literacy by socioeconomic characteristics and countries. In all
countries men � on average � obtained higher �nancial literacy scores than women. Higher
education goes along with higher �nancial literacy scores in all countries as well. Financial
literacy seems to increase initially with age and to decrease again for the elderly. However,
this pattern does not prevail in all countries (Brazil and Jordan). Regarding employment, in
many countries (8 out of 12) the self-employed have marginally higher �nancial literacy than
the employed.
9

[Enter table 5 here]
4.2 Determinants of �nancial literacy
Table 6 shows di�erent estimates of the conditional expectation function (CEF) of �nancial
literacy. It can be interpreted as a predictive production function of �nancial literacy. We
estimate two speci�cations with basic socio-economic characteristics (see Table 3) as explana-
tory variables: (1) without country �xed e�ects, (2) with country �xed e�ects. Note, that
due to missing values in some of the explanatory variables our sample reduces from 15,388
observations to 12,298.
The results with regard to the predictive e�ects of individual characteristics are robust to
adding country �xed e�ects. The income bu�er dummy, which is a raw measure of �nancial
wealth is positively related to �nancial literacy and translates to about 0.3 to 0.6 (depending
on speci�cation) correct answers (out of the 7) more for households with a �nancial bu�er of
3 monthly incomes or more. The gender gap usually found in work on �nancial literacy is
clearly visible. Women score on average about 0.4 points less. Singles also tend to have slightly
lower scores. However, the coe�cients are not always statistically and more importantly never
economically signi�cant. Individuals with university degrees score about 0.4 to 0.7 questions
better. The hump shaped age pattern we found in the descriptive tables is con�rmed in the
estimation of the CEF. The lowest age category scores lower than the oldest, but the age
category between 50-69 scores even higher. Whereas the employed score signi�cantly higher
than people not working this is less clear for the self-employed and the retired. However, the
coe�cients of employed and self-employed are not signi�cantly di�erent from each other.
[Enter Table 6 here]
4.3 Decomposition analysis
Results from the Blinder-Oaxaca (B-O) decomposition analysis are shown in Table 7.3 As
outlined in section 3, we use Finland as a reference country. The largest gaps (larger than
3Note that the means of �nancial literacy are slightly di�erent from the unconditional means due to themissing information on individual characteristics and experience. However, given the fact that the total samplesize is still 12,298 observations in the case of individual characteristics and 10,810 observations in the case ofindividual characteristics and experience (see Appendix B), the missing pattern is not highly correlated withour covariate set and our covariate set contains exclusively dummy variables, which means that we do not have alarge amount of linear extrapolation but rather look at a set of conditional group speci�c means of combinationsof dummies, and we are con�dent using the standard listwise deletion approach. Our RIF-regression basedapproach for the median serves as a robustness check as the median is a robust statistic in the sense that ithas a bounded in�uence function, which means that it is less exposed to missing observations.
10

15%) are observed in Croatia, Russia, Jordan and Brazil. But also the UK and Hungary show
relatively large gaps compared to Finland (larger than 10%). Austria and Canada still show
gaps above 5%, whereas Germany and the Netherlands hardly show relevant deviations. Hong
Kong exceeds average �nancial literacy in Finland.
In some countries di�erences in observable individual characteristics with Finland signif-
icantly dampen the gap (Canada, Jordan, The Netherlands and the UK), while for other
countries the gap is signi�cantly larger because of di�erences in individual characteristics
(Austria, Brazil, Croatia, Hungary and Russia). In the case of these countries between about
11% (Russia) and 60% (Austria) is explained by di�erences in individual characteristics. That
means that if di�erences due to di�erences in the share of characteristics in the population
are �ltered out and only within characteristic di�erences are considered, the gap reduces by
this amount. In the same way the gap widens for countries where characteristics dampen
the unconditional observed di�erences. In Germany the gap is not signi�cantly di�erent from
Finland, whereas in Hong Kong individual characteristics do not signi�cantly explain part of
the higher score in Hong Kong.
All in all, it is rather obvious that individual characteristics matter when comparing �nan-
cial literacy across countries. It is rather important to have �apples to apples� comparison to
design policies in an informed way. In the case of di�erences in educational attainment this is
rather obvious. On the one hand, a gap in average �nancial literacy may exist across countries
within education groups; this would be the case if �nancial literacy di�ered among the highly
educated in country A versus country B. On the other hand, a gap could also exist across
countries even if the �nancial literacy within education groups is the same across countries.
This could be the case if the share of, say, highly educated individuals is higher in country
A than in country B. From a policy perspective these gaps need to be dealt with di�erently.
Whereas the �rst raises the question of why similarly educated groups have di�erent �nancial
literacy, given the second �nancial literacy might just be increased by increasing educational
attainment.
[Enter Table 7 here]
Given the di�erent distributions of the �nancial literacy score across countries (Figure 1),
we decompose these distributions by means of RIF-regressions as outlined in subsection 3.5.
Results of the RIF-regression based B-O quantile decomposition analysis (for the 10th, 50th,
and 90th percentile) are presented in Table 8. The RIF-regression based approach for the
median serves also as a robustness check for the standard B-0 decomposition at the mean, as
11

the median is a robust statistic in the sense that it has a bounded in�uence function, which
means that it is less exposed to missing observations.
[Enter Table 8 here]
The B-O decomposition analysis at the median of �nancial literacy (Table 8) con�rms
the results of the decomposition at the mean (Table 7). However, results di�er substantially
for the upper (90th percentile) and lower (10th percentile) part of the distributions of the
�nancial literacy score, pointing towards di�erent mechanisms in place at di�erent points of
the distribution. Gaps in percentage are larger and individual characteristics can explain fewer
of these observed gaps at the bottom (p10) than at the top (p90). Especially interesting is
the fact that the additional explanatory power of experience tends to explain relatively more
of the gap at higher levels of �nancial literacy and especially for countries which lag behind
literacy levels of Finland (see tables B.2 and B.3).
4.4 Unexplained gaps of �nancial literacy and the role of institutions
In this section we examine the role of institutions in explaining the unexplained parts (neither
by individual characteristics nor by experience) of the gaps in �nancial literacy score across
the countries compared. Following Christelis et al. (2013), we correlate the unexplained parts
(coe�cient e�ects) obtained from the mean and quantile B-O decomposition analysis with the
selected macroeconomic variables in�uencing populations' �nancial literacy. We consider a set
of aggregate indicators which have been shown as important determinants of �nancial literacy
at country-level. Following Jappelli (2010), we consider GDP per capita, share of internet
users, (gross) enrolment ratio to secondary school, life expectancy, PISA math test scores,
stock market capitalization, and social contributions rate.
Similarly to Christelis et al. (2013), we argue that the unexplained component of the gap
in �nancial literacy might be attributed to di�erent economic environments of countries. As
an example, one could think of the education system's quality in the particular country which
can have important implications for the population's �nancial literacy, which we proxy by an
indicator on the PISA math test. According to Ciaian and Pokriv£ák (2005), crucial sectors
for economic development and human capital accumulation including the development of ed-
ucation systems in many transition countries have been lagging behind compared to Western
European countries during the transition from a centrally-planned to a market economy. The
unexplained part could also be interpreted as impacts of historic (behavioral) experiences of
the market economy which in turn could in�uence the �nancial literacy of individuals � prox-
ied by an indicator on the stock market capitalization (e.g. Jappelli, 2010).
12

Having a glance at Figure 2 one can infer the main �nding from the distributional analy-
sis (see subsection 4.3) and its relation to institutional di�erences. Overall, the unexplained
part of the gaps estimated from the B-O analysis at the mean decreases with countries being
institutionally closer to our benchmark category, Finland. This �nding holds for the whole
distribution of the �nancial literacy score, the 10th, 50th, and 90th percentile (see �gures B.1
and B.2 in Appendix B). For a detailed discussion on how experience might matter di�erently
across the distribution of �nancial literacy see Appendix B.
[Enter Figure 2 here]
As the last step of our empirical analysis, we examine which institutions matter the most
for explaining the coe�cient e�ects (the unexplained part of the gaps) estimated from the
B-O analysis. To do so, we regress the unexplained part of the gaps estimated from the mean
and quantile decomposition analysis, on a set of macroeconomic indicators whose values have
been standardized (i.e. de-meaned and divided by their standard deviations).
A ranking of the importance of di�erent institutions with regards to explaining the coef-
�cient e�ects is presented in Table 9. Overall, we can see that all the macroeconomic and
institutional variables under consideration are negatively correlated with unexplained di�er-
ences in �nancial literacy. The higher the GDP per capita, enrolment to secondary school
ratio, share of internet users, life expectancy, social contributions, PISA math results, and
stock market capitalization, the lower the unexplained di�erences with Finland. As Finland
also ranks among the highest in all these country level indicators, one can also interpret this
result as unexplained di�erences in �nancial literacy being lower if institutional di�erences are
smaller (results including experience presented in Appendix B , Table B.4).
[Enter Table 9 here]
Life expectancy shows the largest correlation with the unexplained part of the �nancial
literacy gaps. Life expectancy, as well as GDP per capita, can be considered as indicators
for the general level of development. Also the share of internet users is predictive for the size
of the unexplained gaps. The PISA math test score � an indicator which proxies the quality
of education system in the particular country � also turns out to be highly important for
explaining �nancial literacy gaps.
All in all, these results point to the importance of the environment when discussing cross-
country di�erences in �nancial literacy. Environment not only matters in a direct way, by
13

in�uencing �nancial literacy or creating more need � in the case of a smaller welfare state �
for �nancial literacy, but also indirectly, by allowing individual characteristics to translate in
di�erent ways to �nancial literacy. As an example one can imagine that an individual with
higher educational attainment might be able to acquire �nancial literacy at lower cost with
internet access rather than without. Or as another example, the need to engage in �nancial
markets might be higher in a country where the need for private pension savings is higher.
14

5 Conclusion
The literature observes large di�erences in average �nancial literacy across countries (Lusardi
and Mitchell, 2014; Standard and Poor's, 2014). While these observed di�erences arguably
in�uence policies, the populations in the di�erent countries are not homogenous. So far, it
had been unknown to what extent the observed di�erences are country-speci�c or driven by
di�erences in the individual characteristics of the (sampled) population. To design the right
policies, it is of the utmost importance to understand the reasons for observed di�erences of
cross-country �nancial literacy gaps.
By examining recently compiled harmonized OECD/INFE microdata on the �nancial lit-
eracy of individuals in 12 countries along with country level indicators, we delivered estimates
of how much of these observed di�erences are due to di�erences in the characteristics of the
population.
Results indicate that di�erences in individual characteristics matter considerably. In some
countries, di�erences in observable individual characteristics dampen much of the gap com-
pared to Finland (in particular, Canada, Jordan, The Netherlands, and the UK). For other
countries, the gap is signi�cantly larger because of di�erences in individual characteristics (in
this case, Finland versus Austria, Brazil, Croatia, Hungary, and Russia). In the latter set of
countries, between about 11% (Russia) and 60% (Austria) of the gap is explained by di�er-
ences in individual characteristics. That means that if di�erences in �nancial literacy due to
di�erences in the population's characteristics were �ltered out and only within-characteristic
di�erences were considered, the gap would be reduced by this amount. We conclude that
individual characteristics should be taken into account when countries are compared and
speci�cally when they are ranked as in the OECD/INFE report. It is rather important to
have an �apples to apples� comparison to design policies in an informed way.
A variety of robustness checks including extensions of the set of controls by potentially
endogenous variables covering experience as well as analyses beyond the mean for di�erent
points of the distribution of �nancial literacy con�rmed our results.
In the second stage of the analysis, we correlated the unexplained parts of the �nancial
literacy gaps (not explained by varying individual characteristics) obtained from decomposi-
tion analysis with macroeconomic and institutional country-level indicators. Following Jap-
pelli (2010), we considered a set of indicators such as GDP per capita, share of internet users,
(gross) enrolment ratio to secondary school, life expectancy, stock market capitalization, PISA
math test score, and social contributions rate (proxy for welfare state). Con�rming the �nd-
15

ings of Jappelli (2010), our results point to the importance of a country's institutional context
when discussing cross-country di�erences in �nancial literacy. However, while Jappelli (2010)
based his analysis on a subset of individuals (working in management), our analysis is based
on representative samples of individuals. That allows us to show that the importance of
institutions is di�erent for individuals with di�erent levels of �nancial literacy. Those with
lower �nancial literacy are generally not engaged with more complex �nancial products such
as stocks and have less need to make sophisticated �nancial decisions. For them, �nancial
decisions are instead related to taking loans and making basic day-to-day decisions. Other
individuals with higher �nancial literacy might more likely hold substantial amounts of their
wealth in more complex �nancial products. Targeted policies might di�er for these two groups.
It is important to emphasize that the country-level results obtained from the decomposition
analysis and consequent linking to di�erent economic environments do not necessarily imply
causality. Despite having this caveat in mind, our results o�er interesting policy implications.
Besides investing in individual-level factors important for human capital development (e.g.
education, basic training in �nance) it seems that there is room for harmonizing the economic
and institutional environment across countries to decrease inequality in �nancial literacy.
We conclude that taking di�erences in population characteristics into account when com-
paring �nancial literacy across countries is important. If this is not done, it is di�cult to
draw useful policy conclusions, as it is impossible to disentangle di�erences based on country-
speci�c variation from those based on variation in individual-level characteristics. Country
rankings such as those presented in the OECD/INFE report are not very meaningful with re-
gard to policy conclusions if di�erences stemming from basic individual characteristics cannot
be identi�ed.
16
References
Atkinson, Adele and Flore-Anne Messy, �Assessing �nancial literacy in 12 countries:
an OECD/INFE international pilot exercise,� Journal of Pension Economics and Finance,
2011, 10 (04), 657�665.
Badarinza, Cristian, John Y Campbell, and Tarun Ramadorai, �International com-
parative household �nance,� Annual Review of Economics, 2016, 8, 111�144.
Blinder, Alan S, �Wage discrimination: reduced form and structural estimates,� Journal of
Human Resources, 1973, 8 (4), 436�455.
Bover, Olympia, Martin Schürz, Jiri Slacalek, and Federica Teppa, �Eurosystem
Household Finance and Consumption Survey: Main Results on Assets, Debt, and Saving,�
International Journal of Central Banking, 2016, 12 (2), 1�13.
Campbell, John Y, �Household �nance,� The Journal of Finance, 2006, 61 (4), 1553�1604.
Christelis, Dimitris, Dimitris Georgarakos, and Michael Haliassos, �Di�erences in
portfolios across countries: Economic environment versus household characteristics,� Review
of Economics and Statistics, 2013, 95 (1), 220�236.
Ciaian, Pavel and Ján Pokriv£ák, �Why Some Sectors of Transition Economies are less
Reformed than Others? The Case of Research and Education,� Technical Report, EERI
Research Paper Series 2005.
Fernandes, Daniel, John G Lynch Jr, and Richard G Netemeyer, �Financial literacy,
�nancial education, and downstream �nancial behaviors,� Management Science, 2014, 60
(8), 1861�1883.
Firpo, Sergio, Nicole M. Fortin, and Thomas Lemieux, �Decomposing Wage Distribu-
tions using Recentered In�uence Function Regressions,� 2007.
, , and , �Unconditional quantile regressions,� Econometrica, 2009, 77 (3), 953�973.
Fonseca, Raquel, Kathleen J Mullen, Gema Zamarro, and Julie Zissimopoulos,
�What explains the gender gap in �nancial literacy? The role of household decision making,�
Journal of Consumer A�airs, 2012, 46 (1), 90�106.
Fortin, N., T. Lemieux, and S. Firpo, �Decomposition methods in economics,� Handbook
of Labor Economics, 2011, 4, 1�102.
Hastings, Justine S, Brigitte C Madrian, and William L Skimmyhorn, �Financial
Literacy, Financial Education, and Economic Outcomes,� Annual Review of Economics,
2013, 5 (1), 347�73.
17

Jappelli, Tullio, �Economic literacy: An international comparison,� The Economic Journal,
2010, 120 (548), F429�F451.
Lusardi, Annamaria and Olivia S Mitchell, �Financial literacy around the world: an
overview,� Journal of Pension Economics and Finance, 2011, 10 (04), 497�508.
and , �The economic importance of �nancial literacy: Theory and evidence,� Journal of
Economic Literature, 2014, 52 (1), 5�44.
Machado, José AF and José Mata, �Counterfactual decomposition of changes in wage
distributions using quantile regression,� Journal of Applied Econometrics, 2005, 20 (4),
445�465.
Mathä, Thomas Y, Alessandro Porpiglia, and Michael Ziegelmeyer, �Household
wealth in the euro area: The importance of intergenerational transfers, homeownership and
house price dynamics,� Journal of Housing Economics, 2017, 35, 1�12.
Oaxaca, Ronald, �Male-female wage di�erentials in urban labor markets,� International
Economic Review, 1973, 14 (3), 693�709.
OECD, �Results: Students and Money: Financial Literacy Skills for the 21st Century (Volume
VI), PISA,� 2013.
, OECD/INFE International Survey of Adult Financial Literacy Competencies, Organisation
for Economic Co-operation and Development, 2016.
Standard and Poor's, �Global Financial Literacy Survey,� 2014.
18

6 Figures and tables
Figure 1: Distribution of �nancial literacy score across countries
(a) Austria
0.1
.2.3
.4F
ract
ion
0 1 2 3 4 5 6 7
(b) Brazil
0.1
.2.3
.4F
ract
ion
0 1 2 3 4 5 6 7
(c) Canada
0.1
.2.3
.4F
ract
ion
0 1 2 3 4 5 6 7
(d) Croatia
0.1
.2.3
.4F
ract
ion
0 1 2 3 4 5 6 7
(e) Finland
0.1
.2.3
.4F
ract
ion
0 1 2 3 4 5 6 7
(f) Germany
0.1
.2.3
.4F
ract
ion
0 1 2 3 4 5 6 7
(g) Hong Kong
0.1
.2.3
.4F
ract
ion
0 1 2 3 4 5 6 7
(h) Hungary
0.1
.2.3
.4F
ract
ion
0 1 2 3 4 5 6 7
(i) Jordan
0.1
.2.3
.4F
ract
ion
0 1 2 3 4 5 6 7
(j) The Netherlands
0.1
.2.3
.4F
ract
ion
0 1 2 3 4 5 6 7
(k) Russia
0.1
.2.3
.4F
ract
ion
0 1 2 3 4 5 6 7
(l) UK
0.1
.2.3
.4F
ract
ion
0 1 2 3 4 5 6 7
Source: OECD/INFE international survey of adult �nancial literacy competencies
19

Figure 2: Estimated coe�cient e�ects from the mean B-O decomposition versus selectedmacroeconomic indicators (baseline)
(a) Internet
AT
BR
CA
HR
FIDE
HK
HU
JO
NL
RU UK
-.5
0.5
1C
oeffi
cien
t effe
cts
55 65 75 85 95Internet users (% of the total pop.)
linear fit
(b) Life expectancy
AT
BR
CA
HR
FIDE
HK
HU
JO
NL
RU UK
-.5
0.5
1C
oeffi
cien
t effe
cts
70 75 80 85Life expectancy (years)
linear fit
(c) Math in PISA
AT
BR
CA
HR
FIDE
HK
HU
JO
NL
RUUK
-.5
0.5
1C
oeffi
cien
t effe
cts
375 425 475 525 575Math score in PISA
linear fit
(d) Welfare state
AT
BR
CA
HR
FIDE
HU
JO
NL
RUUK
0.2
.4.6
.81
Coe
ffici
ent e
ffect
s
0 20 40 60Social contributions (% of revenue)
linear fit
Note: Austria (AT), Brazil (BR), Canada (CA), Croatia (HR), Finland (FI), Germany (DE), Hong Kong (HK),Hungary (HU), Jordan (JO), The Netherlands (NL), Russia (RU), the United Kingdom (UK).Source: OECD/INFE international survey of adult �nancial literacy competencies, World Bank data
20

Table 1: Survey details
Country Institution Date of survey Type of survey Sampling method Sample size
AustriaOesterreichische National-bank
2014 Face-to-face Strati�ed sampling 1,994
Brazil Banco Central do Brasil 2015 Face-to-face Strati�ed cluster sampling 2,002
CanadaFinancial ConsumerAgency of Canada
2015 Telephone interviewsNested quotas using ran-dom digit dialing
1,002
CroatiaCroatian National Bankand Croatian FinancialServices Agency
2015 Face-to-face Strati�ed sampling 1,049
FinlandUniversity of Tampere andUniversity of Vaasa
2014 Face-to-face Strati�ed cluster sampling 1,533
Germany Deutsche Bundesbank 2016 Telephone interviews Strati�ed sampling 1,001
Hong Kong Investor Education Center 2015 Face-to-face Strati�ed sampling 1,000
Hungary Magyar Nemzeti Bank 2015 Face-to-faceQuota sample from strat-i�ed probability startingpoint
1,000
Jordan INJAZ 2016 Face-to-face Strati�ed sampling 1,140
The Netherlands Money Wise 2015 Online interviews N.A. 1,018
RussiaMinistry of Finance of theRussian Federation
2015 Face-to-face Strati�ed sampling 1,649
UK Money Advice Service 201530% telephone, 70% onlineinterviews
Strati�ed random sampling 1,000
15,388
Source: OECD/INFE international survey of adult �nancial literacy competencies
21
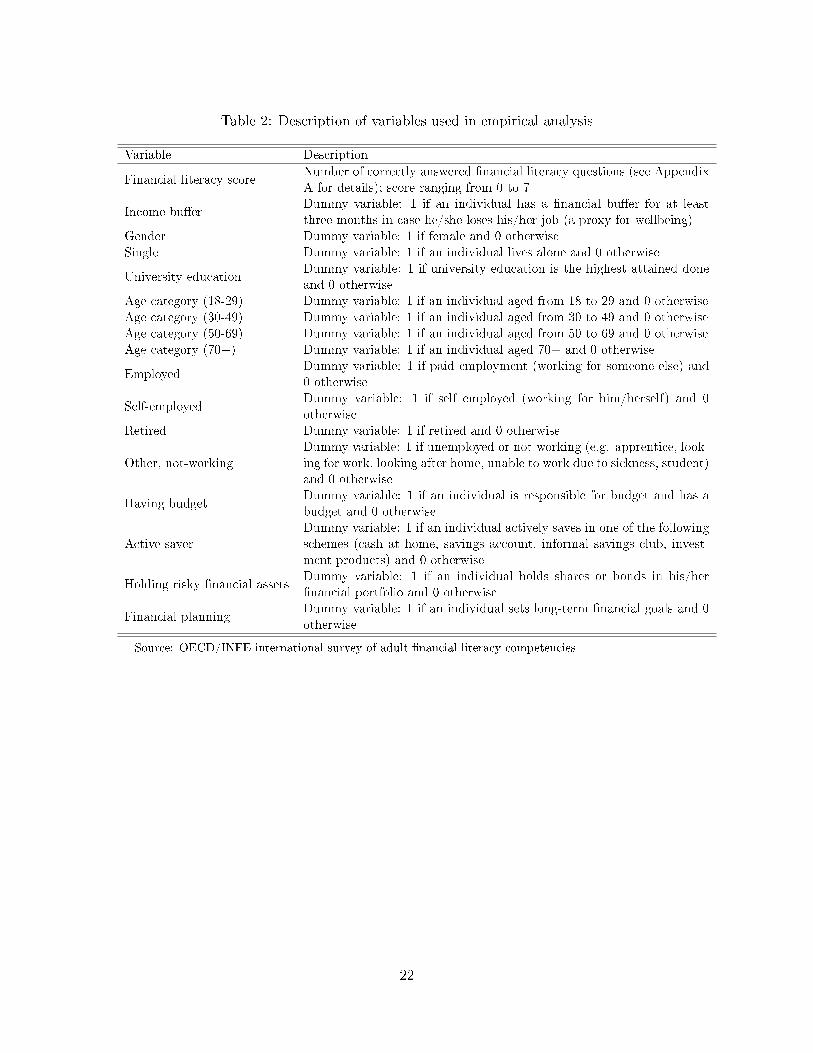
Table 2: Description of variables used in empirical analysis
Variable Description
Financial literacy scoreNumber of correctly answered �nancial literacy questions (see AppendixA for details); score ranging from 0 to 7
Income bu�erDummy variable: 1 if an individual has a �nancial bu�er for at leastthree months in case he/she loses his/her job (a proxy for wellbeing)
Gender Dummy variable: 1 if female and 0 otherwise
Single Dummy variable: 1 if an individual lives alone and 0 otherwise
University educationDummy variable: 1 if university education is the highest attained doneand 0 otherwise
Age category (18-29) Dummy variable: 1 if an individual aged from 18 to 29 and 0 otherwise
Age category (30-49) Dummy variable: 1 if an individual aged from 30 to 49 and 0 otherwise
Age category (50-69) Dummy variable: 1 if an individual aged from 50 to 69 and 0 otherwise
Age category (70+) Dummy variable: 1 if an individual aged 70+ and 0 otherwise
EmployedDummy variable: 1 if paid employment (working for someone else) and0 otherwise
Self-employedDummy variable: 1 if self employed (working for him/herself) and 0otherwise
Retired Dummy variable: 1 if retired and 0 otherwise
Other, not-workingDummy variable: 1 if unemployed or not-working (e.g. apprentice, look-ing for work, looking after home, unable to work due to sickness, student)and 0 otherwise
Having budgetDummy variable: 1 if an individual is responsible for budget and has abudget and 0 otherwise
Active saverDummy variable: 1 if an individual actively saves in one of the followingschemes (cash at home, savings account, informal savings club, invest-ment products) and 0 otherwise
Holding risky �nancial assetsDummy variable: 1 if an individual holds shares or bonds in his/her�nancial portfolio and 0 otherwise
Financial planningDummy variable: 1 if an individual sets long-term �nancial goals and 0otherwise
Source: OECD/INFE international survey of adult �nancial literacy competencies
22
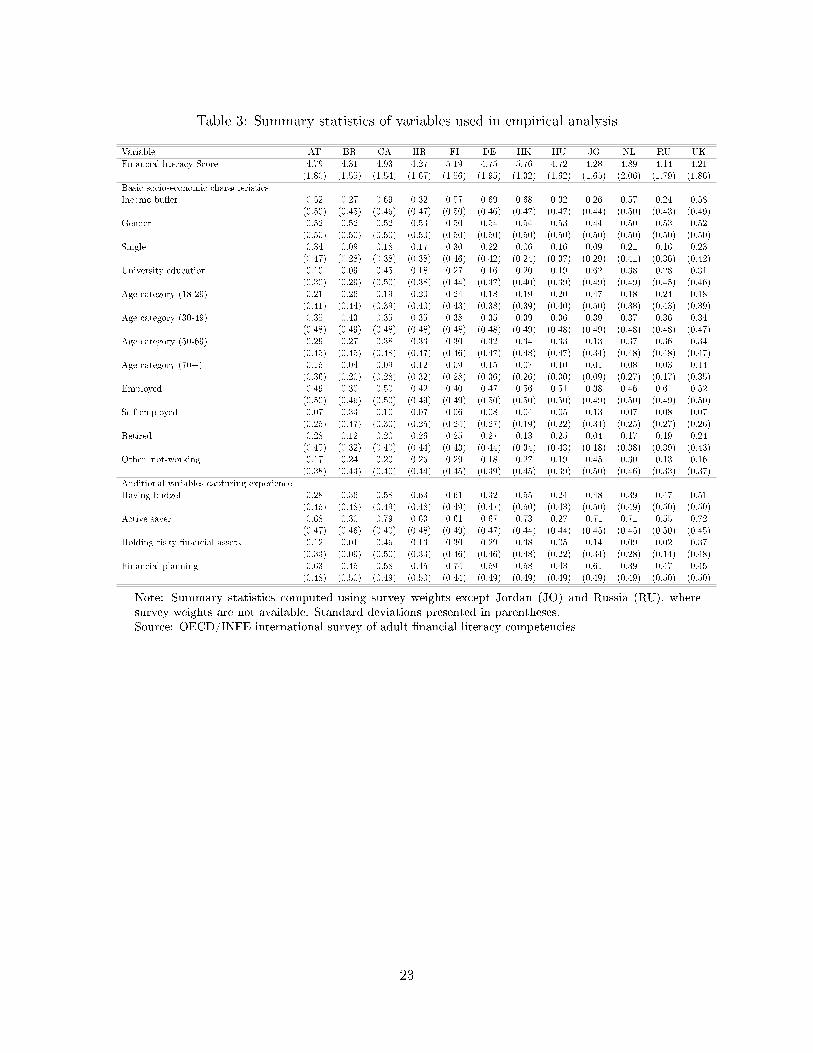
Table 3: Summary statistics of variables used in empirical analysis
Variable AT BR CA HR FI DE HK HU JO NL RU UK
Financial literacy Score 4.79 4.31 4.93 4.27 5.19 4.75 5.76 4.72 4.28 4.89 4.14 4.21(1.80) (1.55) (1.54) (1.67) (1.56) (1.95) (1.32) (1.62) (1.65) (2.06) (1.79) (1.86)
Basic socio-economic characteristicsIncome bu�er 0.52 0.27 0.69 0.32 0.57 0.69 0.68 0.32 0.26 0.57 0.24 0.58
(0.50) (0.45) (0.46) (0.47) (0.50) (0.46) (0.47) (0.47) (0.44) (0.50) (0.43) (0.49)
Gender 0.52 0.52 0.52 0.53 0.50 0.54 0.54 0.53 0.44 0.50 0.53 0.52(0.50) (0.50) (0.50) (0.50) (0.50) (0.50) (0.50) (0.50) (0.50) (0.50) (0.50) (0.50)
Single 0.34 0.09 0.18 0.17 0.30 0.22 0.06 0.16 0.09 0.21 0.16 0.23(0.47) (0.28) (0.38) (0.38) (0.46) (0.42) (0.24) (0.37) (0.29) (0.41) (0.36) (0.42)
University education 0.10 0.09 0.45 0.18 0.27 0.16 0.20 0.19 0.62 0.38 0.28 0.31(0.30) (0.29) (0.50) (0.38) (0.44) (0.37) (0.40) (0.39) (0.49) (0.49) (0.45) (0.46)
Age category (18-29) 0.21 0.26 0.19 0.20 0.24 0.18 0.19 0.20 0.47 0.18 0.24 0.18(0.41) (0.44) (0.39) (0.40) (0.43) (0.38) (0.39) (0.40) (0.50) (0.38) (0.43) (0.39)
Age category (30-49) 0.35 0.43 0.35 0.35 0.38 0.35 0.39 0.36 0.39 0.37 0.36 0.34(0.48) (0.49) (0.48) (0.48) (0.48) (0.48) (0.49) (0.48) (0.49) (0.48) (0.48) (0.47)
Age category (50-69) 0.29 0.27 0.38 0.33 0.30 0.32 0.34 0.33 0.13 0.37 0.36 0.34(0.45) (0.45) (0.48) (0.47) (0.46) (0.47) (0.48) (0.47) (0.34) (0.48) (0.48) (0.47)
Age category (70+) 0.15 0.04 0.09 0.12 0.09 0.15 0.07 0.10 0.01 0.08 0.03 0.14(0.36) (0.20) (0.28) (0.32) (0.28) (0.36) (0.26) (0.30) (0.09) (0.27) (0.17) (0.35)
Employed 0.49 0.30 0.50 0.42 0.40 0.47 0.56 0.51 0.38 0.46 0.61 0.52(0.50) (0.46) (0.50) (0.49) (0.49) (0.50) (0.50) (0.50) (0.49) (0.50) (0.49) (0.50)
Self-employed 0.07 0.33 0.10 0.07 0.06 0.08 0.04 0.05 0.13 0.07 0.08 0.07(0.25) (0.47) (0.30) (0.25) (0.24) (0.27) (0.19) (0.22) (0.34) (0.25) (0.27) (0.26)
Retired 0.28 0.12 0.20 0.26 0.25 0.27 0.13 0.25 0.04 0.17 0.19 0.24(0.45) (0.32) (0.40) (0.44) (0.43) (0.44) (0.34) (0.43) (0.18) (0.38) (0.39) (0.43)
Other, not-working 0.17 0.24 0.20 0.26 0.29 0.18 0.27 0.19 0.45 0.30 0.13 0.16(0.38) (0.43) (0.40) (0.44) (0.45) (0.39) (0.45) (0.39) (0.50) (0.46) (0.33) (0.37)
Additional variables capturing experienceHaving budget 0.28 0.36 0.58 0.63 0.61 0.32 0.55 0.24 0.48 0.39 0.47 0.51
(0.45) (0.48) (0.49) (0.48) (0.49) (0.47) (0.50) (0.43) (0.50) (0.49) (0.50) (0.50)
Active saver 0.68 0.30 0.79 0.63 0.61 0.67 0.73 0.27 0.71 0.71 0.55 0.72(0.47) (0.46) (0.40) (0.48) (0.49) (0.47) (0.44) (0.44) (0.45) (0.45) (0.50) (0.45)
Holding risky �nancial assets 0.12 0.01 0.46 0.13 0.30 0.29 0.38 0.05 0.14 0.09 0.02 0.37(0.33) (0.09) (0.50) (0.33) (0.46) (0.46) (0.48) (0.22) (0.34) (0.28) (0.14) (0.48)
Financial planning 0.63 0.45 0.58 0.45 0.74 0.59 0.58 0.43 0.61 0.39 0.47 0.45(0.48) (0.50) (0.49) (0.50) (0.44) (0.49) (0.49) (0.49) (0.49) (0.49) (0.50) (0.50)
Note: Summary statistics computed using survey weights except Jordan (JO) and Russia (RU), wheresurvey weights are not available. Standard deviations presented in parentheses.Source: OECD/INFE international survey of adult �nancial literacy competencies
23

Table 4: Selected country-level indicators relevant for �nancial literacy
CountryGDP per
capita (current$USD)
Internet users(% of thepopulation)
Lifeexpectancy(years)
Enrolmentratio, uppersecondary (%)
Stock markettotal value toGDP (%)
Socialcontributions(% of revenue)
Math score inthe PISAsurvey
Austria 43,665 83.93 81.84 95.75 7.33 32.33 497
Brazil 8,757 59.08 74.68 90.97 31.19 31.68 377
Canada 43,316 88.47 82.14 119.30 77.59 23.70 516
Croatia 11,580 69.80 77.28 97.66 1.25 35.32 464
Finland 42,405 92.65 81.39 115.23 56.61 33.67 511
Germany 41,177 87.59 81.09 106.68 38.25 54.61 506
Hong Kong 42,351 84.95 84.28 113.22 478.70 N.A. 548
Hungary 12,366 72.83 75.96 102.67 10.00 30.10 477
Jordan 4,096 53.40 74.20 77.88 10.73 0.27 380
The Netherlands 44,293 93.10 81.70 124.47 54.45 36.69 512
Russia 9,329 70.10 70.91 98.77 20.26 21.00 494
UK 43,930 92.00 81.60 83.20 103.06 21.23 492
Source: World Bank indicators; OECD PISA data
24

Table 5: Distribution of �nancial literacy score across selected socio-economic characteristics(by country)
AT BR CA HR FI DE HK HU JO NL RU UK
Overall 4.8 4.3 4.9 4.3 5.2 4.8 5.8 4.7 4.3 4.9 4.1 4.2
GenderMale 5.1 4.4 5.4 4.3 5.4 5.3 6.0 4.8 4.7 5.5 4.2 4.6
Female 4.5 4.2 4.5 4.2 4.9 4.3 5.6 4.6 3.8 4.3 4.1 3.8
EducationPrimary 3.8 3.9 3.8 3.9 N.A. 4.1 4.6 4.3 3.4 4.0 3.4 3.1
Secondary 4.9 4.5 4.6 4.3 5.0 5.0 5.9 4.7 3.9 4.5 4.1 4.0
Tertiary 5.6 5.2 5.4 4.8 5.8 5.7 6.1 5.4 4.6 5.6 4.5 5.0
Age category18-29 years 4.6 4.4 4.5 4.1 5.0 4.4 5.5 4.7 3.5 4.3 3.8 3.7
30-49 years 4.8 4.4 5.0 4.4 5.4 4.7 5.9 4.8 4.1 4.9 4.2 4.6
50-69 years 5.0 4.2 5.1 4.4 5.2 5.0 5.8 4.7 4.6 5.2 4.3 4.4
70+ years 4.6 4.1 4.7 3.7 4.9 4.5 5.2 4.5 4.7 5.0 4.2 3.4
Employment statusEmployed 4.9 4.6 5.0 4.4 5.4 5.1 6.0 4.8 4.8 5.1 4.3 4.5
Self-employed 5.1 4.3 5.4 4.6 5.6 5.6 5.7 5.2 4.8 5.6 4.2 4.6
Retired 4.8 4.0 5.1 4.0 4.9 4.7 5.4 4.4 4.6 5.2 3.8 3.9
Other not working 4.3 4.2 4.3 4.2 5.2 4.1 5.5 4.8 3.8 4.5 4.0 3.5
Note: Means are presented based on the sample of adult individuals aged 18-79. Weighted �gures exceptJordan (JO) and Russia (RU), where survey weights are not available.Source: OECD/INFE international survey of adult �nancial literacy competencies
25

Table 6: Baseline OLS estimates of determinants of �nancial literacy
(1) (2)
Income bu�er 0.621∗∗∗ 0.439∗∗∗
(0.030) (0.031)Gender -0.429∗∗∗ -0.452∗∗∗
(0.029) (0.028)Single -0.078∗∗ -0.131∗∗∗
(0.039) (0.039)University education 0.543∗∗∗ 0.655∗∗∗
(0.031) (0.033)Age category (18-29) -0.148∗∗ -0.015
(0.074) (0.074)Age category (30-49) 0.067 0.135∗
(0.070) (0.069)Age category (50-69) 0.247∗∗∗ 0.288∗∗∗
(0.061) (0.059)Employed 0.217∗∗∗ 0.239∗∗∗
(0.042) (0.041)Self-employed 0.088 0.188∗∗∗
(0.055) (0.056)Retired -0.048 0.023
(0.059) (0.058)Constant 4.507∗∗∗ 4.878∗∗∗
(0.079) (0.089)
Country �xed e�ects No Yes
Adjusted R2 0.099 0.144Observations 12,298 12,298
Note: Robust standard errors presented in parentheses. Dummy variables for Age category (70+), Not-working, and Finland are the baseline categories for the respective dummy sets. ∗ p < 0.10, ∗∗ p < 0.05, ∗∗∗
p < 0.01.Source: OECD/INFE international survey of adult �nancial literacy competencies
26

Table 7: Blinder-Oaxaca decomposition at mean (baseline)
AT BR CA HR DE HK HU JO NL RU UK
I. Di�erentialBenchmark (Finland) 5.270∗∗∗ 5.270∗∗∗ 5.270∗∗∗ 5.270∗∗∗ 5.270∗∗∗ 5.270∗∗∗ 5.270∗∗∗ 5.270∗∗∗ 5.270∗∗∗ 5.270∗∗∗ 5.270∗∗∗
(0.042) (0.042) (0.042) (0.042) (0.042) (0.042) (0.042) (0.042) (0.042) (0.042) (0.042)
Compared country 4.968∗∗∗ 4.510∗∗∗ 4.978∗∗∗ 4.371∗∗∗ 5.247∗∗∗ 5.778∗∗∗ 4.764∗∗∗ 4.483∗∗∗ 5.309∗∗∗ 4.430∗∗∗ 4.602∗∗∗
(0.040) (0.045) (0.044) (0.052) (0.053) (0.040) (0.050) (0.048) (0.055) (0.054) (0.054)
Di�erence (raw) 0.302∗∗∗ 0.759∗∗∗ 0.292∗∗∗ 0.899∗∗∗ 0.023 -0.509∗∗∗ 0.506∗∗∗ 0.787∗∗∗ -0.040 0.839∗∗∗ 0.667∗∗∗
(0.058) (0.061) (0.061) (0.067) (0.067) (0.058) (0.065) (0.064) (0.069) (0.068) (0.068)
Di�erence (%) 5.9% 15.5% 5.7% 18.6% 0.5% -9.2% 10.1% 16.1% -0.7% 17.3% 13.5
II. DecompositionExplained 0.179∗∗∗ 0.115∗∗ -0.207∗∗∗ 0.161∗∗∗ -0.036 -0.066 0.175∗∗∗ -0.289∗∗∗ -0.167∗∗∗ 0.094∗∗ -0.091∗∗∗
(0.032) (0.048) (0.037) (0.035) (0.035) (0.046) (0.042) (0.066) (0.050) (0.048) (0.033)
Unexplained 0.123∗ 0.644∗∗∗ 0.499∗∗∗ 0.738∗∗∗ 0.059 -0.443∗∗∗ 0.331∗∗∗ 1.076∗∗∗ 0.127 0.745∗∗∗ 0.758∗∗∗
(0.068) (0.080) (0.069) (0.078) (0.075) (0.074) (0.080) (0.091) (0.084) (0.085) (0.075)
Note: Only basic socio-economic characteristics (i.e. income bu�er, gender, age, education, and working status) used as explanatory variables in theunderlying regressions. Robust standard errors presented in parentheses. ∗ p < 0.10, ∗∗ p < 0.05, ∗∗∗ p < 0.01.Source: OECD/INFE international survey of adult �nancial literacy competencies
27

Table 8: RIF Blinder-Oaxaca quantile decomposition (baseline)
AT BR CA HR DE HK HU JO NL RU UK
RIF B-O decomposition for 10th percentileI. Di�erentialBenchmark (Finland) 3.407∗∗∗ 3.407∗∗∗ 3.407∗∗∗ 3.407∗∗∗ 3.407∗∗∗ 3.407∗∗∗ 3.407∗∗∗ 3.407∗∗∗ 3.407∗∗∗ 3.407∗∗∗ 3.407∗∗∗
(0.054) (0.054) (0.054) (0.054) (0.054) (0.054) (0.054) (0.054) (0.054) (0.054) (0.054)
Compared country 2.644∗∗∗ 2.438∗∗∗ 3.308∗∗∗ 2.508∗∗∗ 3.124∗∗∗ 4.203∗∗∗ 2.811∗∗∗ 2.696∗∗∗ 2.837∗∗∗ 2.344∗∗∗ 2.356∗∗∗
(0.062) (0.037) (0.049) (0.067) (0.092) (0.075) (0.070) (0.048) (0.124) (0.058) (0.091)
Di�erence (raw) 0.763∗∗∗ 0.969∗∗∗ 0.099 0.899∗∗∗ 0.283∗∗∗ -0.796∗∗∗ 0.595∗∗∗ 0.711∗∗∗ 0.570∗∗∗ 1.063∗∗∗ 1.051∗∗∗
(0.082) (0.066) (0.074) (0.086) (0.107) (0.093) (0.089) (0.072) (0.135) (0.080) (0.106)
Di�erence (%) 25.2% 33.2% 2.9% 30.4% 8.7% -20.9% 19.2% 20.3% 18.3% 37.0% 36.5%
II. DecompositionExplained 0.075∗ 0.093∗ -0.098∗∗ 0.084∗∗ -0.054 -0.052 0.103∗∗ -0.022 -0.109∗ 0.141∗∗ -0.030
(0.040) (0.052) (0.046) (0.042) (0.044) (0.058) (0.050) (0.086) (0.065) (0.060) (0.041)
Unexplained 0.688∗∗∗ 0.877∗∗∗ 0.197∗∗ 0.815∗∗∗ 0.337∗∗∗ -0.744∗∗∗ 0.492∗∗∗ 0.733∗∗∗ 0.679∗∗∗ 0.922∗∗∗ 1.081∗∗∗
(0.097) (0.091) (0.079) (0.102) (0.113) (0.107) (0.109) (0.111) (0.145) (0.109) (0.112)
RIF B-O decomposition for 50th percentileI. Di�erentialBenchmark (Finland) 6.035∗∗∗ 6.035∗∗∗ 6.035∗∗∗ 6.035∗∗∗ 6.035∗∗∗ 6.035∗∗∗ 6.035∗∗∗ 6.035∗∗∗ 6.035∗∗∗ 6.035∗∗∗ 6.035∗∗∗
(0.045) (0.045) (0.045) (0.045) (0.045) (0.045) (0.045) (0.045) (0.045) (0.045) (0.045)
Compared country 5.520∗∗∗ 4.840∗∗∗ 5.425∗∗∗ 4.782∗∗∗ 6.100∗∗∗ 6.422∗∗∗ 5.343∗∗∗ 4.825∗∗∗ 6.333∗∗∗ 4.999∗∗∗ 5.317∗∗∗
(0.031) (0.041) (0.055) (0.064) (0.078) (0.035) (0.052) (0.051) (0.074) (0.067) (0.084)
Di�erence (raw) 0.515∗∗∗ 1.195∗∗∗ 0.610∗∗∗ 1.253∗∗∗ -0.065 -0.387∗∗∗ 0.692∗∗∗ 1.210∗∗∗ -0.298∗∗∗ 1.036∗∗∗ 0.718∗∗∗
(0.054) (0.061) (0.071) (0.079) (0.090) (0.057) (0.069) (0.068) (0.087) (0.081) (0.095)
Di�erence (%) 8.9% 22.0% 10.6% 23.2% -1.1% -6.2% 12.2% 22.3% -4.8% 18.8% 12.6%
II. DecompositionExplained 0.172∗∗∗ 0.097∗ -0.175∗∗∗ 0.138∗∗∗ 0.003 -0.039 0.154∗∗∗ -0.337∗∗∗ -0.144∗∗∗ 0.045 -0.078∗∗
(0.035) (0.053) (0.038) (0.038) (0.037) (0.048) (0.044) (0.070) (0.051) (0.051) (0.034)
Unexplained 0.343∗∗∗ 1.097∗∗∗ 0.785∗∗∗ 1.114∗∗∗ -0.068 -0.348∗∗∗ 0.538∗∗∗ 1.547∗∗∗ -0.154 0.991∗∗∗ 0.796∗∗∗
(0.066) (0.082) (0.079) (0.088) (0.097) (0.074) (0.083) (0.096) (0.101) (0.095) (0.101)
RIF B-O decomposition for 90th percentileI. Di�erentialBenchmark (Finland) 7.486∗∗∗ 7.486∗∗∗ 7.486∗∗∗ 7.486∗∗∗ 7.486∗∗∗ 7.486∗∗∗ 7.486∗∗∗ 7.486∗∗∗ 7.486∗∗∗ 7.486∗∗∗ 7.486∗∗∗
(0.039) (0.039) (0.039) (0.039) (0.039) (0.039) (0.039) (0.039) (0.039) (0.039) (0.039)
Compared country 7.393∗∗∗ 6.825∗∗∗ 7.447∗∗∗ 7.038∗∗∗ 7.731∗∗∗ 7.549∗∗∗ 7.249∗∗∗ 6.883∗∗∗ 7.889∗∗∗ 7.050∗∗∗ 7.452∗∗∗
(0.036) (0.061) (0.050) (0.088) (0.049) (0.031) (0.065) (0.076) (0.050) (0.081) (0.073)
Di�erence (raw) 0.093∗ 0.660∗∗∗ 0.038 0.448∗∗∗ -0.245∗∗∗ -0.063 0.237∗∗∗ 0.602∗∗∗ -0.403∗∗∗ 0.435∗∗∗ 0.033(0.053) (0.072) (0.064) (0.097) (0.062) (0.050) (0.076) (0.086) (0.064) (0.090) (0.083)
Di�erence (%) 1.3% 9.2% 0.5% 6.2% -3.2% -0.8% 3.2% 8.4% -5.2% 6.0% 0.5%
II. DecompositionExplained 0.176∗∗∗ 0.063 -0.158∗∗∗ 0.116∗∗∗ 0.012 -0.048 0.131∗∗∗ -0.323∗∗∗ -0.118∗∗ 0.019 -0.065∗∗
(0.033) (0.047) (0.036) (0.034) (0.033) (0.043) (0.040) (0.060) (0.047) (0.044) (0.032)
Unexplained -0.083 0.598∗∗∗ 0.197∗∗∗ 0.332∗∗∗ -0.257∗∗∗ -0.015 0.106 0.926∗∗∗ -0.285∗∗∗ 0.416∗∗∗ 0.099(0.060) (0.086) (0.076) (0.101) (0.071) (0.067) (0.085) (0.107) (0.081) (0.100) (0.090)
Note: Only basic socio-economic characteristics (i.e. income bu�er, gender, age, education, and working status) used as explanatory variables in theunderlying regressions. Robust standard errors presented in parentheses. ∗ p < 0.10, ∗∗ p < 0.05, ∗∗∗ p < 0.01.Source: OECD/INFE international survey of adult �nancial literacy competencies
28

Table 9: Which institutions matter the most? (baseline)
Mean 10th percentile 90th percentileIndicator Standardized e�ect Rank Standardized e�ect Rank Standardized e�ect Rank
GDP per capita -0.289∗∗ 6 -0.222 5 -0.288∗∗∗ 4Gross enrolment ratio -0.293∗∗∗ 5 -0.292∗ 3 -0.233∗∗ 6Internet users -0.297∗∗∗ 4 -0.200 6 -0.338∗∗∗ 2Life expectancy -0.514∗∗ 1 -0.489∗ 1 -0.440∗∗ 1Math score in PISA -0.301∗∗∗ 3 -0.273∗ 4 -0.283∗∗∗ 5Social contributions rate -0.301∗∗∗ 2 -0.121∗ 7 -0.307∗∗∗ 3Stock market capitalization -0.247∗∗∗ 7 -0.368∗∗∗ 2 -0.078 7
Note: Country-level regressions of the unexplained parts of the gap (coe�cient e�ects) estimated from themean and quantile decomposition analysis on a set of aggregate indicators (one by one) which have beenstandardized (i.e. values demeaned and divided by their standard deviations). ∗ p < 0.10, ∗∗ p < 0.05, ∗∗∗
p < 0.01.Source: OECD/INFE international survey of adult �nancial literacy competencies; World Bank data
29

Appendix
A Financial literacy questions in the OECD/INFE survey
Below we provide the list of �nancial literacy knowledge questions (KQ) asked in the OECD/INFE
survey on �nancial literacy of adult individuals that were used for the calculation of the overall
�nancial knowledge score. For sake of space-saving, answer options such as �Don't know� or
�Refused to answer� are omitted.
� KQ1 Time-value of money: Imagine that �ve brothers are given a gift of EUR 1,000
and have to share the money equally. The brothers have to wait for one year to get their
share of the EUR 1,000 and in�ation stays at 2%. In one year's time, will they be able
to buy (a) more with their share of the money than they could today, (b) as much as
today, or (c) less than they could buy today? (correct answer: c)
� KQ2 Interest paid on a loan: You lend EUR 25 to a friend one evening and he gives
you EUR 25 back the next day. How much interest has he paid on this loan? (correct
answer: 0)
� KQ3 Interest plus principal: Suppose you put EUR 100 into a no-fee savings account
with a guaranteed interest rate of 2% per year. You do not make any further payments
into this account and you do not withdraw any money. How much would be in the
account at the end of the �rst year, once the interest payment is made? (correct answer:
102 EUR)
� KQ4 Compound interest: And how much would be in the account at the end of �ve
years? (a) More than EUR 110, (b) exactly EUR 110, (c) less than EUR 110, (d) It is
impossible to tell from the information given. (correct answer: a)
� KQ5 Risk and return: Is the following statement (a) true or (b) false? An investment
with a high return is likely to be high risk. (correct answer: a)
� KQ6 De�nition of in�ation: Is the following statement (a) true or (b) false? High
in�ation means that the cost of living is increasing rapidly. (correct answer: a)
� KQ7 Diversi�cation: Is the following statement (a) true or (b) false? It is usually
possible to reduce the risk of investing in the stock market by buying a wide range of
stocks and shares. (correct answer: a)
30

B The importance of experience for �nancial literacy
As a robustness check, we extend our multivariate and decomposition analysis by considering
a set of variables capturing experience with �nance (see Table 2, for exact de�nition). The in-
clusion of these endogenous variables to better explain �nancial literacy gaps across countries
is justi�ed by the prior literature studying the reverse causality between �nancial knowledge
and �nancial outcomes of households and individuals (e.g. Fernandes et al., 2014).
B.1 Production function
The results on experience variables (presented in Table B.1) are remarkable in two dimensions.
First, with regard to having a budget. This dummy variable indicates whether an individual
is responsible for the budget, if the household has a budget at all and is used by the OECD in
their so called ��nancial behavior� score. However, it interestingly relates to marginally lower
�nancial literacy. This could be for two reasons. Either low-income, low-educated households
have a higher probability of having a budget as they have more need to do so. If so, it might
not be a good indicator for using it in a ��nancial behavior� score as it only captures a selection
issue and is a proxy for tight �nances. Or the less �nancially literate person in a household
typically is responsible for the households budget. That would be worrisome as it would lead
to less e�cient budgeting. In both cases it questions the de�nition and use in the OECD's
��nancial behavior score� in this combination of two variables, a household having a budget
and a person being responsible for that budget. Second all other experience variables are asso-
ciated with higher �nancial literacy. In particular, holding risky �nancial assets and �nancial
planning also have economically signi�cant e�ects of about 0.2 (�nancial planning) and 0.3
to 0.4 (holding risky assets). Of course these coe�cients should not be interpreted as causal
e�ects but rather as predictive e�ects or conditional correlations. We consider it likely that
individuals learn before and while they are dealing with certain �nancial products how to deal
with such products and thereby increase their �nancial knowledge which is partly covered by
our observed �nancial literacy scores.
31

Table B.1: OLS estimates of determinants of �nancial literacy (robustness check)
(1) (2) (3) (4)
Income bu�er 0.621∗∗∗ 0.439∗∗∗ 0.473∗∗∗ 0.306∗∗∗
(0.030) (0.031) (0.033) (0.034)Gender -0.429∗∗∗ -0.452∗∗∗ -0.387∗∗∗ -0.419∗∗∗
(0.029) (0.028) (0.030) (0.029)Single -0.078∗∗ -0.131∗∗∗ -0.023 -0.094∗∗
(0.039) (0.039) (0.040) (0.040)University education 0.543∗∗∗ 0.655∗∗∗ 0.452∗∗∗ 0.568∗∗∗
(0.031) (0.033) (0.032) (0.033)Age category (18-29) -0.148∗∗ -0.015 -0.236∗∗∗ -0.056
(0.074) (0.074) (0.077) (0.076)Age category (30-49) 0.067 0.135∗ -0.059 0.044
(0.070) (0.069) (0.073) (0.072)Age category (50-69) 0.247∗∗∗ 0.288∗∗∗ 0.092 0.156∗∗
(0.061) (0.059) (0.063) (0.062)Employed 0.217∗∗∗ 0.239∗∗∗ 0.133∗∗∗ 0.142∗∗∗
(0.042) (0.041) (0.043) (0.042)Self-employed 0.088 0.188∗∗∗ -0.043 0.087
(0.055) (0.056) (0.055) (0.056)Retired -0.048 0.023 -0.116∗ -0.045
(0.059) (0.058) (0.060) (0.060)Having budget -0.066∗∗ -0.005
(0.030) (0.031)Active saver 0.080∗∗ 0.072∗∗
(0.033) (0.033)Holding risky �nancial assets 0.392∗∗∗ 0.293∗∗∗
(0.037) (0.038)Financial planning 0.213∗∗∗ 0.174∗∗∗
(0.031) (0.031)Constant 4.507∗∗∗ 4.878∗∗∗ 4.662∗∗∗ 4.853∗∗∗
(0.079) (0.089) (0.084) (0.094)
Country �xed e�ects No Yes No Yes
Adjusted R2 0.099 0.144 0.107 0.148Observations 12,298 12,298 10,810 10,810
Note: Robust standard errors presented in parentheses. Dummy variables for Age category (70+), Not-working, and Finland are the baseline categories for the respective dummy sets. ∗ p < 0.10, ∗∗ p < 0.05, ∗∗∗
p < 0.01.Source: OECD/INFE international survey of adult �nancial literacy competencies
B.2 Decomposition
One might ask to what degree learning-by-doing which we capture by experience might further
explain the observed gaps between countries. We investigate this by adding the experience
covariates to our decomposition analysis.
The results of this part are summarized in Table B.2. In Canada, Jordan, The Netherlands
and the UK individual characteristics and experience still dampen the observed di�erences,
32

while for Austria, Brazil, Croatia, Hungary and Russia the gap appears still larger. The ro-
bustness of these results points towards the fact that di�erent missing patterns of individual
characteristics and experiences do not distort our analysis. Once experience is added the gap
is closed for Austria and almost closed (96% explained) for Hungary. It also reduces strongly
for Brazil (from 15% to 32% explained) and Russia (from 11% to 23 % explained), while it
stays almost the same for Croatia (about 18% explained). Canada is driven even further away,
meaning that when comparing now individuals with similar �experience� and characteristics in
Canada and Finland, the within group gap to Finland is even larger. The same, but to a lesser
degree is true for the UK. The Netherlands and Jordan almost stay the same. In Germany
the slightly higher scores (in this setting) are fully explained by experience and also in Hong
Kong about 28% are explained by experience.
All in all, we can see that experience matters in the case of �nancial literacy. With our
observational framework, we can not clearly identify the causal pathway: Does experience lead
people to learn more about �nancial products or do they learn more and then decide to apply
the things they learned by changing their investment behavior? However, it is important to
know that some of the di�erences between countries are explainable by varying experience of
individuals with �nancial products. One reason could be di�erent welfare state regimes. In
some countries (e.g. Brazil, Russia or the UK) investing privately for old age provision or
other precautionary motives is more important than in other countries (e.g. Austria, Finland
or Germany). Also supply is di�erent in di�erent countries. In some countries, intermediation
of banks is stronger (continental Europe) than in others (e.g. the UK). All of these might
induce more experience and therefore change �nancial literacy as well as the need for �nancial
literacy. We discuss in more detail the importance of institutions in subsection 4.4.
Note that experience might matter more for sophisticated than for basic �nancial literacy.
That is why we engage in a decomposition exercise at di�erent points of the distribution of
�nancial literacy.
33

Table B.2: B-O decomposition at mean (robustness check)
AT BR CA HR DE HK HU JO NL RU UK
I. Di�erentialBenchmark (Finland) 5.282∗∗∗ 5.282∗∗∗ 5.282∗∗∗ 5.282∗∗∗ 5.282∗∗∗ 5.282∗∗∗ 5.282∗∗∗ 5.282∗∗∗ 5.282∗∗∗ 5.282∗∗∗ 5.282∗∗∗
(0.041) (0.041) (0.041) (0.041) (0.041) (0.041) (0.041) (0.041) (0.041) (0.041) (0.041)
Compared country 5.246∗∗∗ 4.510∗∗∗ 5.273∗∗∗ 4.545∗∗∗ 5.473∗∗∗ 5.778∗∗∗ 4.993∗∗∗ 4.603∗∗∗ 5.309∗∗∗ 4.437∗∗∗ 4.915∗∗∗
(0.040) (0.044) (0.047) (0.055) (0.053) (0.039) (0.055) (0.049) (0.054) (0.053) (0.057)
Di�erence (raw) 0.036 0.772∗∗∗ 0.010 0.737∗∗∗ -0.191∗∗∗ -0.496∗∗∗ 0.289∗∗∗ 0.679∗∗∗ -0.027 0.846∗∗∗ 0.367∗∗∗
(0.058) (0.061) (0.063) (0.069) (0.067) (0.057) (0.069) (0.064) (0.068) (0.067) (0.071)
Di�erence (%) 0.7% 15.8% 0.2% 15.0% -3.6% -9.0% 5.6% 13.7% -0.5% 17.4% 7.2%
II. DecompositionExplained 0.123∗∗∗ 0.246∗∗∗ -0.365∗∗∗ 0.134∗∗∗ -0.131∗∗∗ -0.141∗∗∗ 0.278∗∗∗ -0.264∗∗∗ -0.145∗∗ 0.191∗∗∗ -0.203∗∗∗
(0.047) (0.057) (0.046) (0.044) (0.047) (0.049) (0.057) (0.067) (0.061) (0.054) (0.047)
Unexplained -0.087 0.525∗∗∗ 0.375∗∗∗ 0.604∗∗∗ -0.060 -0.355∗∗∗ 0.011 0.943∗∗∗ 0.117 0.655∗∗∗ 0.569∗∗∗
(0.076) (0.086) (0.073) (0.083) (0.080) (0.073) (0.092) (0.092) (0.090) (0.089) (0.082)
Note: In addition to basic socio-economic characteristics, variables capturing experience with �nance (i.e. having budget, having savings products,holding risky �nancial assets, and engaging in �nancial planning) are considered in the underlying regressions. Robust standard errors presented inparentheses. ∗ p < 0.10, ∗∗ p < 0.05, ∗∗∗ p < 0.01.Source: OECD/INFE international survey of adult �nancial literacy competencies34

Table B.3: RIF B-O quantile decomposition (robustness check)
AT BR CA HR DE HK HU JO NL RU UK
RIF B-O decomposition for 10th PercentileI. Di�erentialBenchmark (Finland) 3.430∗∗∗ 3.430∗∗∗ 3.430∗∗∗ 3.430∗∗∗ 3.430∗∗∗ 3.430∗∗∗ 3.430∗∗∗ 3.430∗∗∗ 3.430∗∗∗ 3.430∗∗∗ 3.430∗∗∗
(0.053) (0.053) (0.053) (0.053) (0.053) (0.053) (0.053) (0.053) (0.053) (0.053) (0.053)
Compared country 2.902∗∗∗ 2.438∗∗∗ 3.499∗∗∗ 2.641∗∗∗ 3.363∗∗∗ 4.203∗∗∗ 2.931∗∗∗ 2.791∗∗∗ 2.837∗∗∗ 2.362∗∗∗ 2.681∗∗∗
(0.053) (0.037) (0.040) (0.062) (0.074) (0.075) (0.068) (0.039) (0.123) (0.057) (0.081)
Di�erence (raw) 0.528∗∗∗ 0.992∗∗∗ -0.069 0.789∗∗∗ 0.066 -0.773∗∗∗ 0.498∗∗∗ 0.639∗∗∗ 0.593∗∗∗ 1.068∗∗∗ 0.749∗∗∗
(0.075) (0.065) (0.067) (0.082) (0.091) (0.092) (0.086) (0.066) (0.134) (0.078) (0.097)
Di�erence (%) 16.7% 33.8% -2.0% 26.0% 2.0% -20.3% 15.7% 20.5% 18.9% 36.9% 24.5%
II. DecompositionExplained 0.028 0.172∗∗∗ -0.189∗∗∗ 0.055 -0.102 -0.091 0.190∗∗ -0.003 -0.112 0.199∗∗∗ -0.108∗
(0.062) (0.066) (0.060) (0.055) (0.063) (0.063) (0.074) (0.085) (0.079) (0.067) (0.063)
Unexplained 0.500∗∗∗ 0.820∗∗∗ 0.120 0.735∗∗∗ 0.169 -0.682∗∗∗ 0.308∗∗ 0.643∗∗∗ 0.706∗∗∗ 0.869∗∗∗ 0.857∗∗∗
(0.099) (0.104) (0.074) (0.102) (0.104) (0.105) (0.125) (0.107) (0.151) (0.115) (0.109)
RIF B-O decomposition for 50th PercentileI. Di�erentialBenchmark (Finland) 6.038∗∗∗ 6.038∗∗∗ 6.038∗∗∗ 6.038∗∗∗ 6.038∗∗∗ 6.038∗∗∗ 6.038∗∗∗ 6.038∗∗∗ 6.038∗∗∗ 6.038∗∗∗ 6.038∗∗∗
(0.045) (0.045) (0.045) (0.045) (0.045) (0.045) (0.045) (0.045) (0.045) (0.045) (0.045)
Compared country 5.704∗∗∗ 4.840∗∗∗ 5.735∗∗∗ 4.981∗∗∗ 6.377∗∗∗ 6.422∗∗∗ 5.572∗∗∗ 4.928∗∗∗ 6.333∗∗∗ 5.001∗∗∗ 5.726∗∗∗
(0.032) (0.041) (0.060) (0.067) (0.081) (0.034) (0.057) (0.052) (0.074) (0.067) (0.095)
Di�erence (raw) 0.335∗∗∗ 1.198∗∗∗ 0.304∗∗∗ 1.058∗∗∗ -0.338∗∗∗ -0.383∗∗∗ 0.467∗∗∗ 1.110∗∗∗ -0.294∗∗∗ 1.037∗∗∗ 0.313∗∗∗
(0.055) (0.061) (0.075) (0.081) (0.092) (0.056) (0.072) (0.069) (0.086) (0.081) (0.105)
Di�erence (%) 5.7% 22.0% 5.1% 19.2% -5.5% -6.2% 8.0% 20.2% -4.8% 18.8% 5.3%
II. DecompositionExplained 0.116∗∗ 0.220∗∗∗ -0.320∗∗∗ 0.128∗∗∗ -0.092∗ -0.111∗∗ 0.247∗∗∗ -0.316∗∗∗ -0.117∗ 0.136∗∗ -0.171∗∗∗
(0.051) (0.065) (0.049) (0.048) (0.051) (0.053) (0.061) (0.073) (0.068) (0.060) (0.051)
Unexplained 0.219∗∗∗ 0.978∗∗∗ 0.624∗∗∗ 0.930∗∗∗ -0.246∗∗ -0.272∗∗∗ 0.219∗∗ 1.426∗∗∗ -0.177 0.901∗∗∗ 0.484∗∗∗
(0.076) (0.090) (0.088) (0.094) (0.105) (0.077) (0.095) (0.098) (0.109) (0.101) (0.116)
RIF B-O decomposition for 90th PercentileI. Di�erentialBenchmark (Finland) 7.484∗∗∗ 7.484∗∗∗ 7.484∗∗∗ 7.484∗∗∗ 7.484∗∗∗ 7.484∗∗∗ 7.484∗∗∗ 7.484∗∗∗ 7.484∗∗∗ 7.484∗∗∗ 7.484∗∗∗
(0.039) (0.039) (0.039) (0.039) (0.039) (0.039) (0.039) (0.039) (0.039) (0.039) (0.039)
Compared country 7.509∗∗∗ 6.825∗∗∗ 7.600∗∗∗ 7.176∗∗∗ 7.857∗∗∗ 7.549∗∗∗ 7.395∗∗∗ 7.016∗∗∗ 7.889∗∗∗ 7.054∗∗∗ 7.626∗∗∗
(0.043) (0.061) (0.062) (0.102) (0.055) (0.030) (0.080) (0.081) (0.050) (0.080) (0.088)
Di�erence (raw) -0.025 0.659∗∗∗ -0.115 0.308∗∗∗ -0.373∗∗∗ -0.064 0.089 0.468∗∗∗ -0.404∗∗∗ 0.430∗∗∗ -0.142(0.058) (0.072) (0.073) (0.109) (0.068) (0.050) (0.089) (0.090) (0.064) (0.089) (0.097)
Di�erence (%) -0.3% 9.2% -1.5% 4.2% -4.9% -0.9% 1.2% 6.5% -5.3% 5.9% -1.9%
II. DecompositionExplained 0.115∗∗ 0.166∗∗∗ -0.272∗∗∗ 0.109∗∗∗ -0.067 -0.100∗∗ 0.198∗∗∗ -0.301∗∗∗ -0.088 0.096∗ -0.129∗∗∗
(0.045) (0.057) (0.045) (0.041) (0.045) (0.046) (0.054) (0.063) (0.059) (0.052) (0.045)
Unexplained -0.140∗ 0.493∗∗∗ 0.156∗ 0.199∗ -0.306∗∗∗ 0.035 -0.109 0.769∗∗∗ -0.317∗∗∗ 0.335∗∗∗ -0.013(0.073) (0.091) (0.089) (0.116) (0.082) (0.070) (0.102) (0.112) (0.088) (0.102) (0.108)
Note: In addition to basic socio-economic characteristics, variables capturing experience with �nance (i.e. having budget, having savings products,holding risky �nancial assets, and engaging in �nancial planning) are considered in the underlying regressions. Robust standard errors presented inparentheses. ∗ p < 0.10, ∗∗ p < 0.05, ∗∗∗ p < 0.01.Source: OECD/INFE international survey of adult �nancial literacy competencies
35
B.3 Unexplained gaps and the role of institutions
The results shown in �gures B.1 and B.2 suggest that at the 10th percentile of the �nancial
literacy score distribution, experience with �nancial products does not matter much as the solid
and dashed lines capturing the baseline and experience speci�cations are not far away from
each other, without slopes changing either. In other words, the �nancial literacy of individuals
in this part of the distribution is likely obtained by the basic channel (i.e. mainly education,
age, working status). On the other hand, at the 90th percentile of the �nancial literacy score
distributions, experience with �nancial products matters more in countries with less developed
institutions, being further away from the benchmark, Finland. In these countries, the gap in
�nancial literacy in the upper part of the distribution is strongly reduced if individuals are
compared within experience groups. In other words, this means that in these countries (i.e.
Brazil, Croatia, Hungary, Jordan, and Russia) the �nancial literacy of this group of people is
closer to their counterparts in countries with higher average �nancial literacy due to their own
experience. Table B.4 shows the results of the standardized ranking of institutions as shown
in subsection 4.4 but based on decomposition estimates including experience. Note that as
the unexplained parts are smaller once experience is included, the correlation to institutions
also has a tendency to be smaller.
36

Figure B.1: Estimated coe�cient e�ects from the mean B-O decomposition versus selectedmacroeconomic indicators (robustness check)
(a) Internet
AT
BR
CA
HR
FIDE
HK
HU
JO
NL
RU UK
AT
BR
CA
HR
FIDE
HK
HU
JO
NL
RUUK
-.5
0.5
1C
oeffi
cien
t effe
cts
55 65 75 85 95Internet users (% of the total pop.)
Baseline Baseline + experience
(b) Life expectancy
AT
BR
CA
HR
FIDE
HK
HU
JO
NL
RU UK
AT
BR
CA
HR
FIDE
HK
HU
JO
NL
RUUK
-.5
0.5
1C
oeffi
cien
t effe
cts
70 75 80 85Life expectancy (years)
Baseline Baseline + experience
(c) Math in PISA
AT
BR
CA
HR
FIDE
HK
HU
JO
NL
RUUK
AT
BR
CA
HR
FIDE
HK
HU
JO
NL
RUUK
-.5
0.5
1C
oeffi
cien
t effe
cts
375 425 475 525 575Math score in PISA
Baseline Baseline + experience
(d) Welfare state
AT
BR
CA
HR
FIDE
HU
JO
NL
RUUK
AT
BR
CA
HR
FIDE
HU
JO
NL
RUUK
-.5
0.5
1C
oeffi
cien
t effe
cts
0 20 40 60Social contributions (% of revenue)
Baseline Baseline + experience
Note: Austria (AT), Brazil (BR), Canada (CA), Croatia (HR), Finland (FI), Germany (DE), Hong Kong (HK),Hungary (HU), Jordan (JO), The Netherlands (NL), Russia (RU), the United Kingdom (UK).Source: OECD/INFE international survey of adult �nancial literacy competencies, World Bank data
37

Figure B.2: Estimated coe�cient e�ects from the RIF B-O quantile decomposition versusselected macroeconomic indicators (robustness check)
(a) Internet
AT
BR
CA
HR
FI
DE
HK
HU
JO NL
RU
UK
AT
BR
CA
HR
FI
DE
HK
HU
JONL
RU UK
-1-.
50
.51
Coe
ffici
ent e
ffect
s
55 65 75 85 95Internet users (% of the total pop.)
Baseline Baseline + experience
10th percentile
AT
BR
CA
HR
FI
DE
HK
HU
JO
NL
RU
UK
AT
BR
CAHR
FI
DE
HK
HU
JO
NL
RU
UK
-.5
0.5
1C
oeffi
cien
t effe
cts
55 65 75 85 95Internet users (% of the total pop.)
Baseline Baseline + experience
90th percentile
(b) Life expectancy
AT
BR
CA
HR
FI
DE
HK
HU
JO NL
RU
UK
AT
BR
CA
HR
FI
DE
HK
HU
JONL
RU UK
-1-.
50
.51
Coe
ffici
ent e
ffect
s
70 75 80 85Life expectancy (years)
Baseline Baseline + experience
10th percentile
AT
BR
CA
HR
FI
DE
HK
HU
JO
NL
RU
UK
AT
BR
CAHR
FI
DE
HK
HU
JO
NL
RU
UK
-.5
0.5
1C
oeffi
cien
t effe
cts
70 75 80 85Life expectancy (years)
Baseline Baseline + experience
90th percentile
(c) Math in PISA
AT
BR
CA
HR
FI
DE
HK
HU
JO NL
RU
UK
AT
BR
CA
HR
FI
DE
HK
HU
JONL
RUUK
-1-.
50
.51
Coe
ffici
ent e
ffect
s
375 425 475 525 575Math score in PISA
Baseline Baseline + experience
10th percentile
AT
BR
CA
HR
FI
DE
HK
HU
JO
NL
RU
UK
AT
BR
CAHR
FI
DE
HK
HU
JO
NL
RU
UK
-.5
0.5
1C
oeffi
cien
t effe
cts
375 425 475 525 575Math score in PISA
Baseline Baseline + experience
90th percentile
Note: Austria (AT), Brazil (BR), Canada (CA), Croatia (HR), Finland (FI), Germany (DE), Hong Kong (HK),Hungary (HU), Jordan (JO), The Netherlands (NL), Russia (RU), the United Kingdom (UK).Source: OECD/INFE international survey of adult �nancial literacy competencies, World Bank data
38

Table B.4: Which institutions matter the most? (robustness check)
Mean 10th percentile 90th percentileIndicator Standardized e�ect Rank Standardized e�ect Rank Standardized e�ect Rank
GDP per capita -0.253∗∗ 5 -0.217∗ 5 -0.237∗∗ 5Gross enrolment ratio -0.242∗∗∗ 6 -0.243∗ 4 -0.189∗ 6Internet users -0.264∗ 4 -0.196 6 -0.289∗∗∗ 2Life expectancy -0.452∗∗ 1 -0.474∗∗ 1 -0.360∗∗ 1Math score in PISA -0.265∗∗∗ 3 -0.258∗ 3 -0.238∗∗∗ 4Social contributions rate -0.288∗∗∗ 2 -0.123∗ 7 -0.279∗∗∗ 3Stock market capitalization -0.184∗∗∗ 7 -0.326∗∗∗ 2 -0.036 7
Note: Country-level regressions of the unexplained parts of the gap (coe�cient e�ects) estimated from themean and quantile decomposition analysis on a set of aggregate indicators (one by one) which have beenstandardized (i.e. values demeaned and divided by their standard deviations). ∗ p < 0.10, ∗∗ p < 0.05, ∗∗∗
p < 0.01.Source: OECD/INFE international survey of adult �nancial literacy competencies; World Bank data
39

Index of Working Papers: March 5, 2015
Jonas Dovern, Martin Feldkircher, Florian Huber
200 Does Joint Modelling of the World Economy Pay Off? Evaluating Global Forecasts from a Bayesian GVAR
May 19, 2015
Markus Knell
201 The Return on Social Security with Increasing Longevity
June 15, 2015
Anil Ari
202 Sovereign Risk and Bank Risk-Taking
June 15, 2015
Matteo Crosignani
203 Why Are Banks Not Recapitalized During Crises?
February 19, 2016
Burkhard Raunig
204 Background Indicators
February 22, 2016
Jesús Crespo Cuaresma, Gernot Doppelhofer, Martin Feldkircher, Florian Huber
205 US Monetary Policy in a Globalized World
March 4, 2016
Helmut Elsinger, Philipp Schmidt-Dengler, Christine Zulehner
206 Competition in Treasury Auctions
May 14, 2016
Apostolos Thomadakis
207 Determinants of Credit Constrained Firms: Evidence from Central and Eastern Europe Region
July 1, 2016
Martin Feldkircher, Florian Huber
208 Unconventional US Monetary Policy: New Tools Same Channels?
November 24, 2016
François de Soyres 209 Value Added and Productivity Linkages Across Countries
November 25, 2016
Maria Coelho 210 Fiscal Stimulus in a Monetary Union: Evidence from Eurozone Regions
January 9, 2017
Markus Knell, Helmut Stix
211 Inequality, Perception Biases and Trust

January 31, 2017
Steve Ambler, Fabio Rumler
212 The Effectiveness of Unconventional Monetary Policy Announcements in the Euro Area: An Event and Econometric Study
May 29, 2017
Filippo De Marco 213 Bank Lending and the European Sovereign Debt Crisis
June 1, 2017
Jean-Marie Meier 214 Regulatory Integration of International Capital Markets
October 13, 2017
Markus Knell 215 Actuarial Deductions for Early Retirement
October 16, 2017
Markus Knell, Helmut Stix
216 Perceptions of Inequality
November 17, 2017
Engelbert J. Dockner, Manuel Mayer, Josef Zechner
217 Sovereign Bond Risk Premiums
December 1, 2017
Stefan Niemann, Paul Pichler
218 Optimal fiscal policy and sovereign debt crises
January 17, 2018
Burkhard Raunig 219 Economic Policy Uncertainty and the Volatility of Sovereign CDS Spreads
February 21, 2018
Andrej Cupak, Pirmin Fessler, Maria Silgoner, Elisabeth Ulbrich
220 Exploring differences in financial literacy across countries: the role of individual characteristics and institutions