Embed Size (px)
Citation preview
University of Pennsylvania University of Pennsylvania
ScholarlyCommons ScholarlyCommons
Real Estate Papers Wharton Faculty Research
2-2008
Exploring the Detailed Location Patterns of UK Manufacturing Exploring the Detailed Location Patterns of UK Manufacturing
Industries Using Microgeographic Data Industries Using Microgeographic Data
Gilles Duranton University of Pennsylvania
Henry G. Overman
Follow this and additional works at: https://repository.upenn.edu/real-estate_papers
Part of the Economics Commons, Manufacturing Commons, and the Real Estate Commons
Recommended Citation Recommended Citation Duranton, G., & Overman, H. G. (2008). Exploring the Detailed Location Patterns of UK Manufacturing Industries Using Microgeographic Data. Journal of Regional Science, 48 (1), 213-243. http://dx.doi.org/10.1111/j.1365-2966.2006.0547.x
This paper is posted at ScholarlyCommons. https://repository.upenn.edu/real-estate_papers/39 For more information, please contact [email protected].

Exploring the Detailed Location Patterns of UK Manufacturing Industries Using Exploring the Detailed Location Patterns of UK Manufacturing Industries Using Microgeographic Data Microgeographic Data
Abstract Abstract We use a point-pattern methodology to explore the detailed location patterns of U.K. manufacturing industries. In particular, we consider the location of entrants and exiters versus continuing establishments, domestic- versus foreign-owned, large versus small, and affiliated versus independent. We also examine colocalization between vertically-linked industries. Our analysis provides a set of new stylized facts and confirmation for others.
Keywords Keywords localisation, location patterns, clusters, K-density, spatial statistics
Disciplines Disciplines Economics | Manufacturing | Real Estate
This journal article is available at ScholarlyCommons: https://repository.upenn.edu/real-estate_papers/39
Exploring the Detailed Location Patterns ofUK Manufacturing Industries using
Microgeographic Data∗
Gilles Duranton∗University of Toronto
Henry G. Overman‡
London School of Economics
23 August 2006
ABSTRACT: We use a point-pattern methodology to explore the de-tailed location patterns of UK manufacturing industries. In particular,we consider the location of entrants and exiters vs. continuing estab-lishments, domestic- vs. foreign-owned, large vs. small, and affiliatedvs. independent. We also examine co-localisation between vertically-linked industries. Our analysis provides a set of new stylised facts andconfirmation for others.
Key words: Localisation, Location patterns, Clusters, K-density, Spatial Statistics.JEL classification: C19, R12, L70.
∗Thanks to Koji Nishikimi and seminar participants at Kyoto University for comments. Financialsupport from the Economic and Social Research Council (ESRC Grant R000239878) is gratefullyacknowledged. This work contains statistical data from ONS which is Crown copyright and re-produced with the permission of the controller of HMSO and Queen’s Printer for Scotland. The useof the ONS statistical data in this work does not imply the endorsement of the ONS in relation tothe interpretation or analysis of the statistical data. This work uses research datasets which may notexactly reproduce National Statistics aggregates.
∗Department of Economics, University of Toronto, 150 Saint George Street, Toronto, Ontario,Canada M5S 3G7. Also affiliated with the Centre for Economic Policy Research, and the Centrefor Economic Performance at the London School of Economics, [email protected],http://individual.utoronto.ca/gilles/default.html.
‡Department of Geography and Environment, London School of Economics, Houghton Street,London WC2A 2AE, United Kingdom. Also affiliated with the Centre for Economic Policy Research,and the Centre for Economic Performance at the London School of Economics, [email protected], http://personal.lse.ac.uk/OVERMAN.
1. Introduction
The tendency of industries to cluster in some areas is well-known since at least Alfred
Marshall’s (1890) Principles. More recently, a renewed interest in spatial issues has led
to the development of empirical approaches to measure this phenomenon (Ellison and
Glaeser, 1997; Maurel and Sédillot, 1999; Devereux, Griffith, and Simpson, 2004a; Dur-
anton and Overman, 2005; Mori, Nishikimi, and Smith, 2005). Empirical progress has
been accompanied by the development of new theoretical models able to replicate the
major stylised facts (see Duranton and Puga, 2004, for a recent survey). Although there is
still much work to be done — for instance not much is known about developing countries
— our understanding of the localisation of industries is now much more sophisticated. We
are also converging towards a consensus view regarding the broad picture: the tendency
for industries to localise is quite widespread, though extreme concentration is exceptional;
localisation often occurs at the scale of metropolitan areas and follows broad sectoral
patterns.
Given our understanding of the broader picture, this paper sets out to explore more de-
tailed patterns of industry location for which our knowledge is still very patchy. To conduct
our analysis, we generalise the spatial point-pattern approach developed in Duranton
and Overman (2005). The basic idea of the geo-computations in that paper is to compare
the distribution of distances between pairs of establishments in an industry to that of
hypothetical industries with the same number of establishments randomly distributed
across all manufacturing sites. This provides a test for industry localisation (i.e., the
tendency for industries to cluster relative to overall manufacturing). In this paper, we
develop this approach further to test for both localisation of sub-groups within an industry
and for co-localisation between industries.
The first issue that we consider concerns the location patterns of establishments en-
tering and exiting different industries. It is often thought that industry location is very
persistent over time. However, some recent literature questions this conventional wisdom
and documents instead pervasive spatial mobility of industries (Dumais, Ellison, and
1
Glaeser, 2002). We ask two important questions: whether entrants cluster in the same
way as existing establishments (and exiters as continuing establishments) and, if they do,
whether it is in the same locations. For the UK, our results show that in about two thirds of
industries entrants and exiters are not located differently from continuing establishments.
The remaining third is roughly evenly divided between industries for which entrants
and exiters are localised within the industry and industries for which they are dispersed.
Given that these are year to year changes, our results suggest there is a fair amount of
mobility in location patterns with some interesting dynamics including cases of increased
clustering or dispersion as well as cases where clusters are moving.
The methods that we use to consider entry and exit can also be used to examine the loc-
ation of other sub-groups of industries. We next consider two specific issues: The location
patterns of plants from multi-establishment firms relative to unaffiliated (or independent)
plants and of foreign-owned establishments relative to domestic-owned. These compar-
isons are interesting because differences in location patterns may inform us about factors
driving location. For example, if foreign-owned firms have access to different information
from domestic firms, findings about location patterns would be suggestive regarding the
importance of knowledge spillovers in determining location. From a policy perspective,
the success of policies aimed at attracting particular types of firms to particular locations
is likely to hinge crucially on how strongly these firms cluster and whether they tend to
cluster with similar firms.
For multi-establishment firms, we find a strong tendency for establishments that belong
to the same firm to cluster close to each other at a metropolitan scale (less than 50 km). In
contrast affiliated establishments of different firms show no tendencies to cluster with one
another. Neither do they widely co-locate with unaffiliated plants. For foreign-owned
establishments, we find that in a majority of industries their location patterns are not
significantly different from those of the rest of the industry. In a small number of cases,
the overall industry is clustered but foreign-owned establishments show an even stronger
tendency to cluster and appear to seek the proximity of domestic establishments. In a
2

small number of industries, the opposite occurs.
Our analysis also revisits issues first raised by Holmes and Stevens (2002) to ask
whether larger establishments are more localised than smaller. We find that large es-
tablishments are frequently located close to each other and we also often find small
establishments nearby. There are also a significant number of clusters driven by small
establishments. We also consider new issues concerning establishment size, in particular
the role of ‘appropriate’ sites (if for instance large establishments can only locate in sites
large enough to host them). We find that site size constraints do not affect the tendency
of manufacturing industries to cluster suggesting that land use restrictions may not have
adverse effects on the clustering of industries as is sometimes suggested (Department of
the Environment, Transport and the Regions, 2000).
Finally, our analysis turns to the patterns of co-localisation between vertically-linked
industries. This provides a unique window to look at theories of regional development
based on input-output linkages (e.g., Krugman and Venables, 1995). The major difficulty
is to distinguish empirically between localised industries that independently cluster close
to each other and systematic co-location that is driven by establishments in the different
industries actively choosing to locate together. We call the first outcome joint-localisation
to distinguish it from the co-localisation in which we are actually interested. In Duranton
and Overman (2005), we looked at patterns of co-localisation of industries that belong
to the same industrial branch. This paper extends that approach to the analysis of
vertically-linked industries. We find that, at small spatial scales, establishments tend
to locate closer to establishments in their own industry than they do to establishments
in industries with which they have important input-output linkages. However at the
’regional scale’ (around 150 km), the opposite occurs and there is a strong tendency to
be located closer to establishments in vertically-linked industries than to establishments
in one’s own industry. This type of pattern is consistent with the existence of regional
agglomerations that are functionally linked through input-output linkages.
The rest of the paper is organised as follows. The next section discusses the data we use,
3
while section 3 presents the main methodology. The following five sections apply our ap-
proach to entries and exits (section 4), affiliated and unaffiliated establishments (section 5),
domestic and foreign establishments (section 6), small and large establishments (section
7), and vertically-linked industries (section 8). Finally the last section concludes.
2. Data
As in Duranton and Overman (2005), our analysis uses exhaustive establishment level
data from the Annual Respondent Database (ARD) which underlies the Annual Census
of Production in the UK. For ease of comparison with the results in that paper we once
again focus on data from 1996. The data set is collected by the Office for National Statistics
(ONS) and covers all UK establishments (see Griffith, 1999, for a detailed description of this
data).1 For every establishment, we know its postcode, four-digit industrial classification,
employment, status (affiliated or independent), and the nationality of its main owner
(domestic or foreign). We restrict our attention to production establishments in manufac-
turing industries using the Standard Industrial Classification (SIC) 92 (SIC15000 to 36639)
for the whole country except Northern Ireland. Establishments are assigned a unique
identifier which is not supposed to be reused if the establishment exits. Thus, using these
identifiers and the 1995 and 1997 data from the ARD, we can divide establishments in 1996
in to new entrants, exiters and continuers (i.e., plants that exist for the three year period).2
In the UK postcodes are very useful for locating plants because they typically refer to
one property or a very small group of properties. See Raper, Rhind, and Shepherd (1992)
for a complete description. The CODE-POINT data set from the Ordnance Survey (OS)
gives very precise spatial coordinates for all UK postcodes. For 99.99% of them, the OS
acknowledges a potential location error below 100 metres. For the remaining observa-
1We use the terms establishment and plant interchangeably.2We may get some false entry and exit if multi-establishment firms change the way that they report on
their establishments. Checking the data we find that only 5% of entry occurs within multi-establishmentfirms at a site (i.e., postcode) that also experiences exit. Of course, some of this churn may be genuine asfirms change the configuration of sites. Given the small numbers involved we do not consider this matterfurther.
4
tions, the maximum error is a few kilometres. Thus, by merging this data together with
the ARD we can generate very detailed information about the geographical location of all
UK manufacturing establishments. In so doing, we could directly establish the Eastings
and Northings for around 90% of establishments. These give the grid reference for any
location taking as the origin a point located South West of the UK.
The main problem in matching the remaining 10% relates to postcode updates which
occur when postcodes are revised in a particular area. To reduce this source of systematic
error to a minimum, we checked our data against all postcode updates since 1992. This
left us with 5% of establishments that could not be given a grid reference due, we believe,
to random reporting mistakes. This left us with a population of 176,106 establishments.
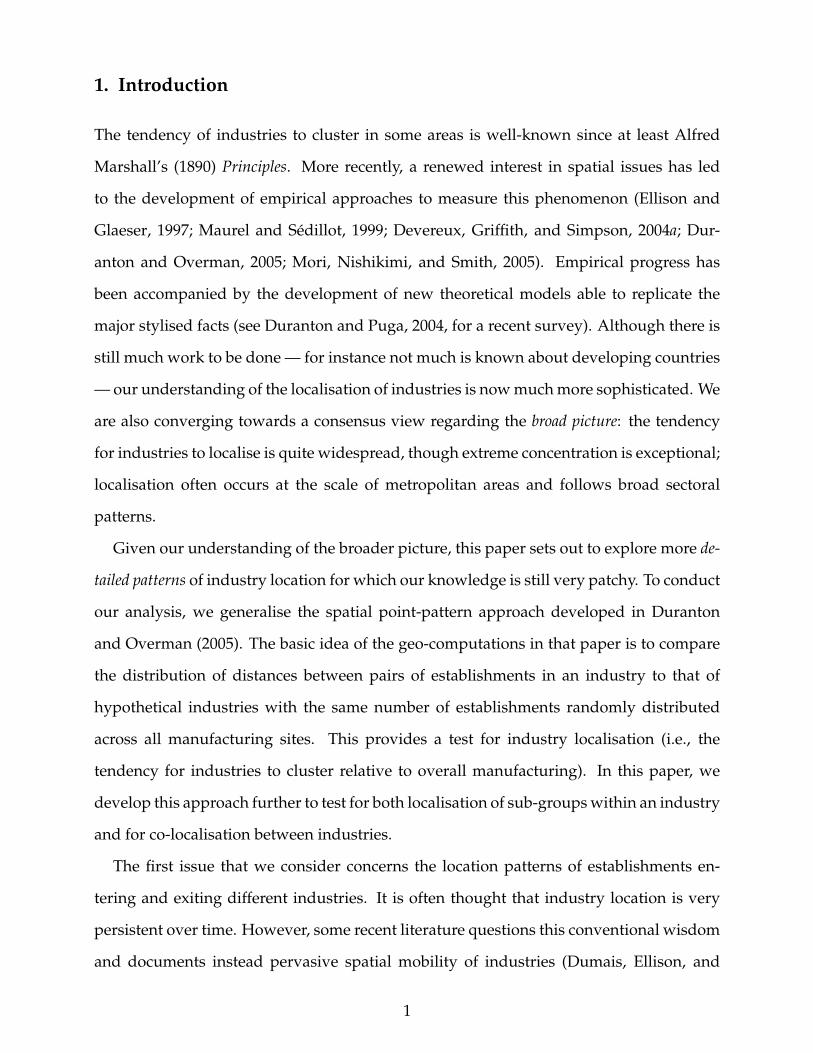
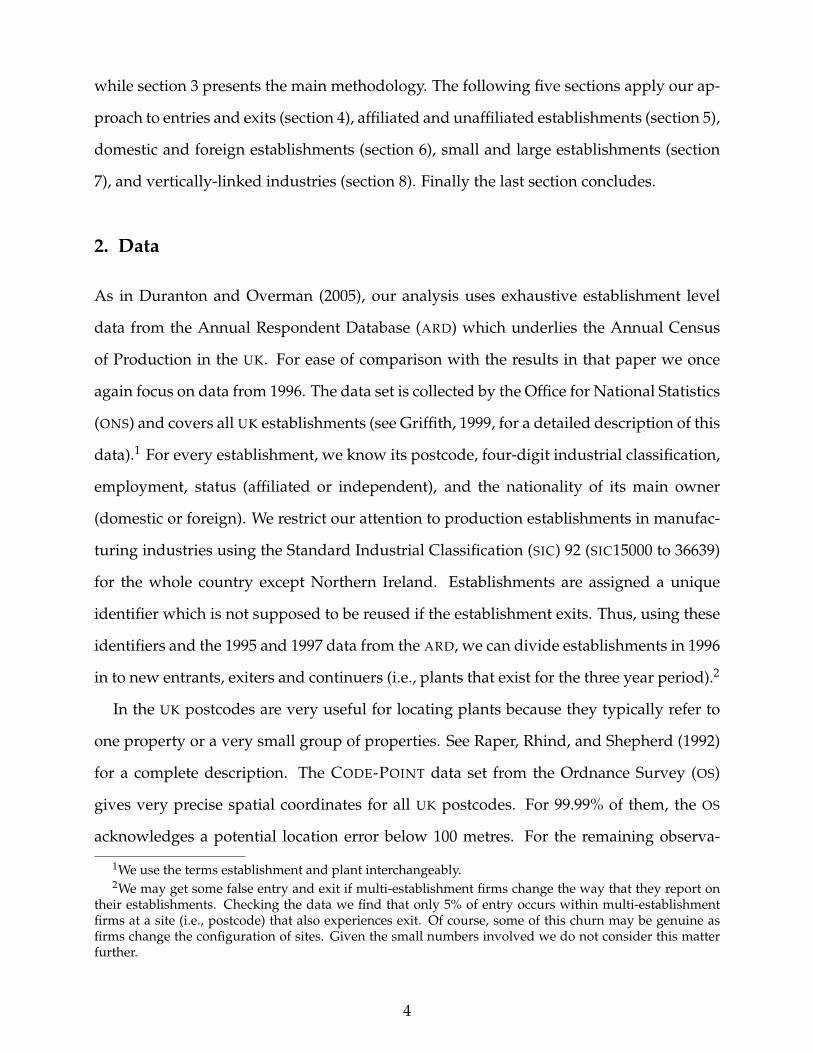
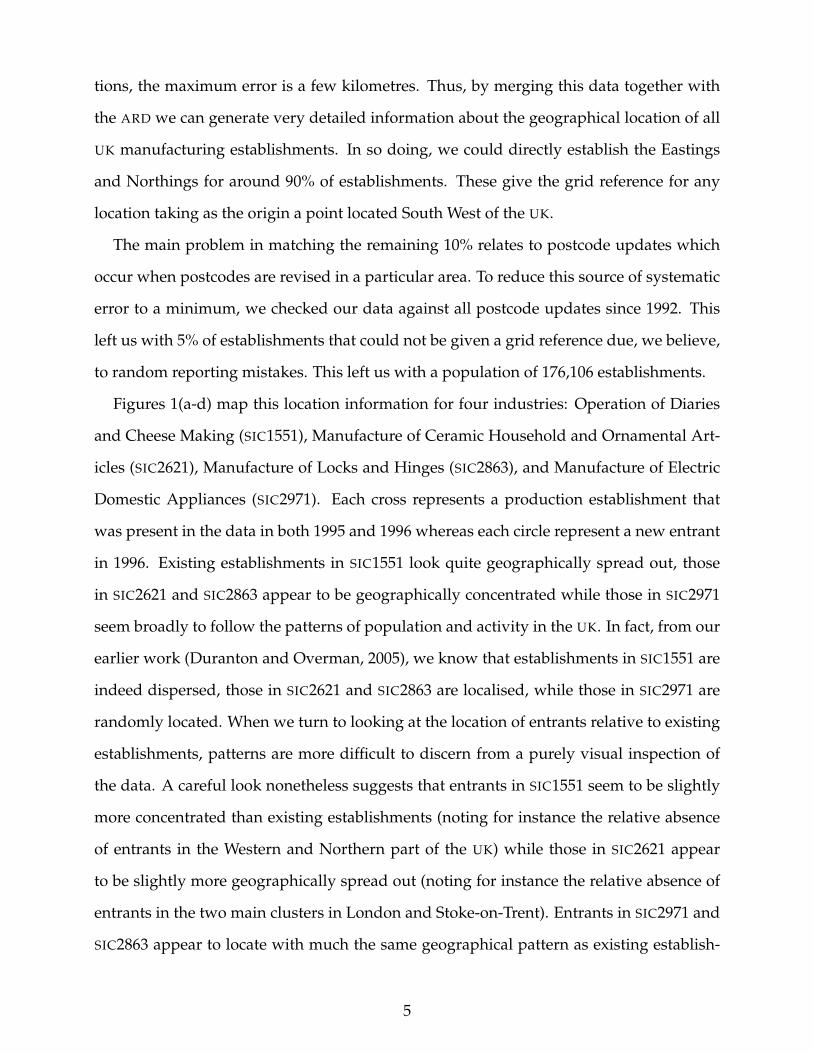
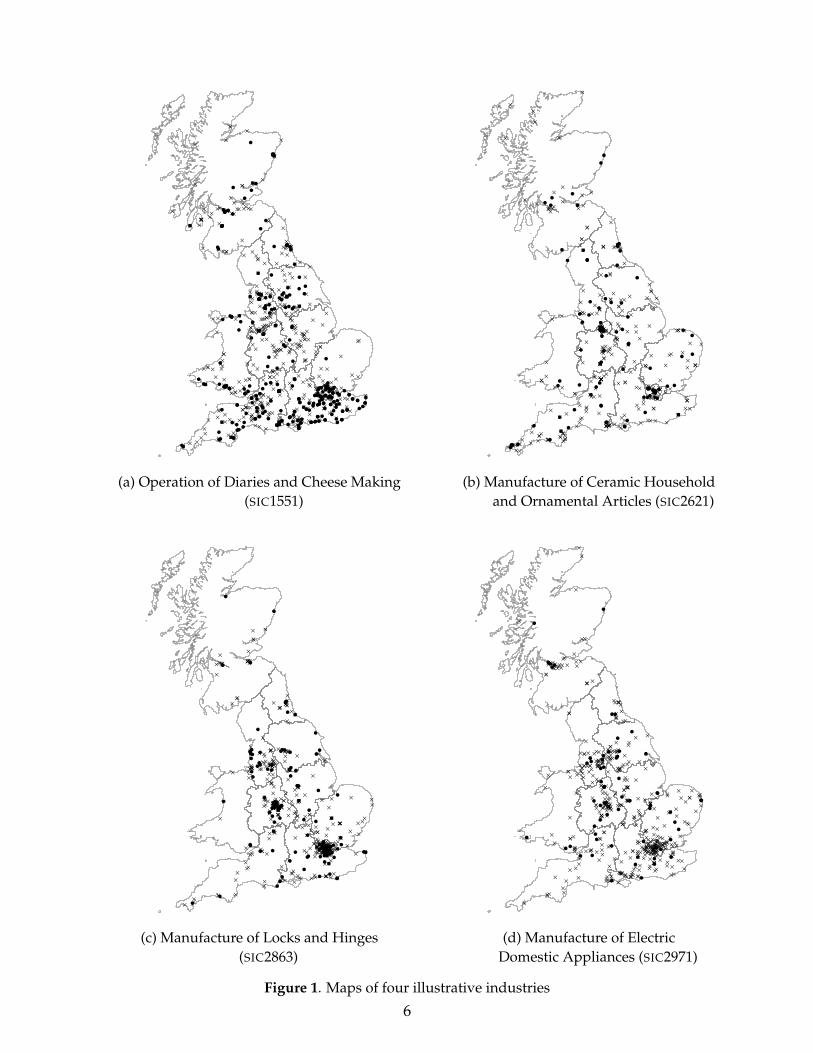
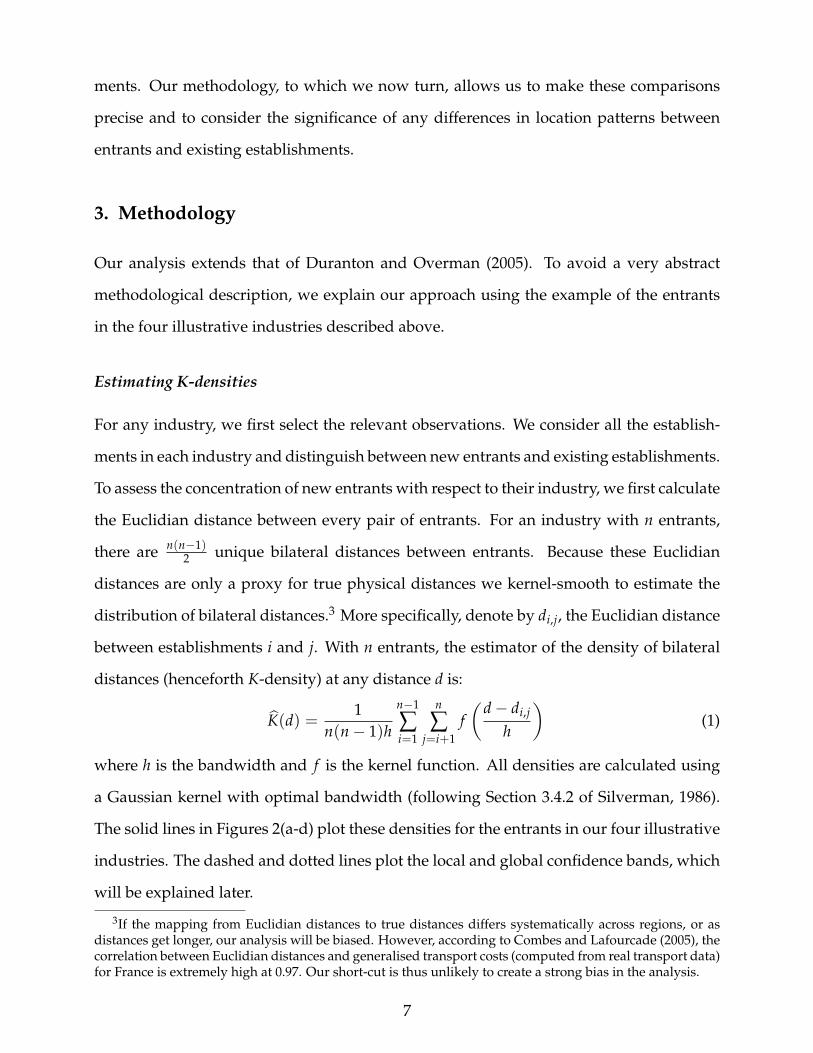
Figures 1(a-d) map this location information for four industries: Operation of Diaries
and Cheese Making (SIC1551), Manufacture of Ceramic Household and Ornamental Art-
icles (SIC2621), Manufacture of Locks and Hinges (SIC2863), and Manufacture of Electric
Domestic Appliances (SIC2971). Each cross represents a production establishment that
was present in the data in both 1995 and 1996 whereas each circle represent a new entrant
in 1996. Existing establishments in SIC1551 look quite geographically spread out, those
in SIC2621 and SIC2863 appear to be geographically concentrated while those in SIC2971
seem broadly to follow the patterns of population and activity in the UK. In fact, from our
earlier work (Duranton and Overman, 2005), we know that establishments in SIC1551 are
indeed dispersed, those in SIC2621 and SIC2863 are localised, while those in SIC2971 are
randomly located. When we turn to looking at the location of entrants relative to existing
establishments, patterns are more difficult to discern from a purely visual inspection of
the data. A careful look nonetheless suggests that entrants in SIC1551 seem to be slightly
more concentrated than existing establishments (noting for instance the relative absence
of entrants in the Western and Northern part of the UK) while those in SIC2621 appear
to be slightly more geographically spread out (noting for instance the relative absence of
entrants in the two main clusters in London and Stoke-on-Trent). Entrants in SIC2971 and
SIC2863 appear to locate with much the same geographical pattern as existing establish-
5
!
!
!
!
!
!
!
!
!
!!
!
!
!
!
!
!
!
!
!
!
!
!
!!
!!
!
!
!
!!
!!
!
!
!
!
!
!
!
!
!!!!!
!
!
!
!
!
!
!!!!
!!
!
!!
!
!
!
!!!!! !!
!
!
!
!!
!
!
!! !!
!
!
!!!
!!
!!!!
!
!!
!!
!!
!!!!
!
!!
!!!!
!!
!
!!
!
!!
!!
!
!!
!!!
!!
!!
!!
!!
!!!!
!!!
!!
!!!!
!!
!
!!!
!
!!
!
!!
!!
!!
!!
!!!
!
!!
!!! !!
!!
!
!!
!! !!
!!
!
!!
!
!!
!
!
!! !
!
!
!!
!
!
!!
!
!!
!
!
!
!!
!
! !
!
!
!
!!
!!
!
!!
!
!!
!
!!
!
!
!
!
!
!!
!
!
!
!!
!
!
!!
!
!
!
!
!
!
!
!
!
!
!
!
!
!
!
!
!!
!
!
!
!
!
!!!
!
!
!
!
!
!
!
!!
!
!
!!
!
!
!
!
!
! !!
!
!!
!
!
!
!
!
DD D
DD DDDD DD D
DD DD DD DDDD DDD DD DD DDDDD DDDD D DD DDD DDD DD DDDD DD DD DDD DDDD DD DD DDD DD D DD DD DDDDDDD DD DD DDD D DD DDD DD DD DD DD D DDD DD DD D D DD DDDD DDD D DD DD D DD DDD DDD DDD D DDD DD DD DD DD D DDD DD DD DDD DDDD D D DDD D DD DDD DDD DDDDD DDD DDD DDD DDD DD DDD D DD D D
DD DDD DDDDD D DDDD DDDDDD DD DD DDDDDD DD DD DD
D DD DD DD DDDD DDDD DDD D DDDDDDDD D D D DDDD DDD DD D D DDD DDD D
D DDDD DDD DD DDDDD D DD DDDDD DD DDD DD DD DDD DD DDDDDDD D DD DDD DDDDDD DDD DDD DDD D DD
DDD DDD D DD DDD
DD DDD DDDDD DDD DDD DDD DDD DDD
DD
DDD D D
DDDDDDD
DD DDD DDD DDD DD DDD DDDD
D
DDD DDD
DD
DD D
DDD
!!
!
!!
!!
!!
!
!
!!
!
!
!
!
!
!
!
!!
!
!
!
!
!
!
!
!
!!
!
!
!
!
!
!
!
!
!
!
!
!
!
!
!
!
!
!!
!
!
!
!
!
!
!
!
!
!
!
!
!
!
!
!
!
!
!
!
!
!
!
!
!!
! !
!
!
!
!
!
!
!
!
!
!
!
!
!
!!
D
DD
D
D
D
D
D
D
D
D
D
D
D
D
D
D
DD
D
D
D
DD
D
D
D
D
D
D
D
D
D
D
DD
D
D
D
D
D
DD
D
D
DD
D
D
D
D
D
D
DD
D
D
D
D
D
D
D
D
DDDD
D
D
D
DDDDDDDD
D
D
D
D
D
D
D
DD
DD
D
D
DD
D
D
D
D
D
D
D
D
D
D
D
D
D
D
D
DDD
D
D
D
D
D
D
D
DDDD
D
D
D
DDD
D
D
DD
D
D
D
DD
D
D
DD
D
D
DD
D
D
D
D
DD
DD
D
D
D
D
D
D
DD
D
D
D
D
D
D
D
D
D
D
D
D
DDD
D
D
D
D
D
D
D
D
D
D
DD
D
D
D
D
D
DD
D
D
D
D
D
DDDDDDDDDDDDDDDDDD
D
DD
D
DDDDDDDD
D
D
D
D
DDD
D
D
D
D
DD
D
DD D
D
D
D
D
DDDD
D
D
D
DDD
D
D
D
D
D
D
D
D
D
DD
D
D
D
D
D
D
D
D
D
D
D
D
D
DD
D
DDDDDD
D
DD
D
D
DDDD
DD
D
D
D
D
D
D
D
DDDDDD
D
D
D
D
D
D
D
D
D
D
D
D
D
D
D
D
D
D
D
D
DD
D
D
D
D
D
D
DDD
D
D
D
D
D
D
D
D
DD
D
D
DDDDDD
D
D
D
D
D
DD
D
D
D
D
D DDD
D
D
D
D
D
D
D
D
D
D
D
D
D
D
D
D
D
D
DD
D
DDD
D
D
D
D
(a) Operation of Diaries and Cheese Making (b) Manufacture of Ceramic Household(SIC1551) and Ornamental Articles (SIC2621)
!
!
!!!!
!!!!
!!
!
!!
!!!
!
!
!!
!!
!!
!
!
!!
!
!
!!
!!!!
!
!
!
!
!
!
!
!
!
!
!
!
!!!
!
!
!
!
!!
!
!
!
!
!
!
!
!
!
!
! !
!
!
!
!
!
!
!
!
!
!
!
!
!
!
!
!
!
!
!
!
!
!
!
!
!
!
!
!
!!
!
!
!
!
!
!
!!
!
!
!
!
!
!
!
!!
!
!!!!
!
!
!
!
!
!
!
! !!
!D
D
D
D D
D
D
D
D
DD
D
D
DDDD
DD
DD
D
D
D
D
DD
DD
D
DD
D
DD
DD
DD
DD
D
DD
D
D
DD DDD
D
D
D
D
D
DD
D
D
D
D
D
DD
DD
DDDD
D D
DD
D
D
D
D
D
DD
DD
D
D
D
D
D
DD
D
DD
D
D
D
D
D
D
D
D
D
D
DD
DDDDDDDDDDDDDDDDDDD
D
D
D
D
D
D
D
D
D
D
DD
D
DD
D
D
D
DDDD
D
D D
D
D
D
DD
D
DD
D
D
D
D
D
DD
DD
D
D
D
D
D
D
D
D
DD
D
D
D
D
DD
D
D
D
D
DD
D
DDDDD
DDD
D
DD
D
D
DDD
D
DD
D
DD
D
DDD
D
D
DDDDD
D
DDDDD
D
DDDDD
D
D
D
D
D
D
D
D
D
D
D
D
D
D
D
D
D
D
D
D
D
D
DD
D
D DD
D
D
D
D
D
D
D
D
D
D
D
D
D
D
D
D
D
D
D
D
DD
D
D
D
D
DD
D
D
DD
D
D
DD
D
D
DD
D
D
D
D
D
D
D
DD
DD
D
D
D
D
DDDD
DD
D
D
D
D
D D
D
DD
D
D
D
D
D
DD
D
D
DD
D
D
D
D
DD
D
DDDD
DD
D
D
D
D
D
D
D D
D
D
D
D
D
D
DD
D
D
D
D
D
D
D
D
D
D
D
D
D
D
D
D
D
D
D
D
D
D
DD
D
D
D
D
DD
!!!!
!!
!!!
!
!
!
!
!
!
!!
!
!
!
!
!
!!
!
!
!
!!
!
!
!
!
!
!
!
!
!
!
!
!
!
!
!
!
!
!
!
!
!
!
!!
!
!
!
!
!
!
!
!
!
!
!
!
!
!
D
D
D
D
D
D
D
D
D
D
D
D
D
D
D
D
D
DD
D
D
D
D
D
D
D
D
D
DD
D
D
D
D
D
D
D
D
D
D
D
D
D
D
D
D
D
D
D
D
D
D
D
DD
DD
D
D
DD
D
D
DDD
DD
D
D
D
D
D
D
DD
D
D
D
D
D
D
D
D
D
D
DD
D
D
D
D
DDD
DD
D
D
DD
D
D
D
DD
D
D
DD
D
D
D
D
D
D
D
D
D
D
D
D
D
D
D
D
D
D
D
D
D
DD
D
D
D
D
D
D
D
D
D
D
D
DD
D
D
D
DD
DD
D
D
D
DD
D
DDD
D
DDD
DD
DD
D
DDDDDDD DD
D
D D
D
D
D
D
D
D
D
D
D
D
D
D
D
D
D
D
D
D
D
D
D
D
D
D
D
D
D
D
D
DD
D
D
D
D
DD
D
D
D
D
D
D
D
D
DD
D
D
D
D
D
D
D
D
D
D
D
D
D
D
D
DD
D
D
D
D
D
D
D
D
DD
D
D
D
D
D
DD
D
D
D
D
D
D
D
D
DD
D
D
D
D
D
D
D
D
D
D
D
D
D
D
D
D
D
D
D
D
D
D
D D
D
D
D
D
D
D
D
D
DD
D
D
D
DD
D
D
D
D
D
DD
DD
D
D
D
D
D
D
D
D
D
D
D
D
D
D
D
D
D
D
D
D
DD
DD
D
DD
D
D
DD
D
D
D
DD
D
D
D
D
D
D D
DD
D
D
D
D
D
D
D
D
D
D
DDDDD
D
D
DD
D
D
D
D
D
D
D
D
D
D
D
D
D
D
D
DD
D
D
D
DD
D
D
D
D
D
DD
D
D
D
D
D
D
D
DD
D
D
D
D
D
D
D
D
D
D
D
D
D
D
D
D
D
D
D
D
D
D
D
DD
D
D
D
D
D
D
D
D
D
D
D
D
D
DD
DD
D
D
D
DD
D
D
(c) Manufacture of Locks and Hinges (d) Manufacture of Electric(SIC2863) Domestic Appliances (SIC2971)
Figure 1. Maps of four illustrative industries
6
ments. Our methodology, to which we now turn, allows us to make these comparisons
precise and to consider the significance of any differences in location patterns between
entrants and existing establishments.
3. Methodology
Our analysis extends that of Duranton and Overman (2005). To avoid a very abstract
methodological description, we explain our approach using the example of the entrants
in the four illustrative industries described above.
Estimating K-densities
For any industry, we first select the relevant observations. We consider all the establish-
ments in each industry and distinguish between new entrants and existing establishments.
To assess the concentration of new entrants with respect to their industry, we first calculate
the Euclidian distance between every pair of entrants. For an industry with n entrants,
there are n(n−1)2 unique bilateral distances between entrants. Because these Euclidian
distances are only a proxy for true physical distances we kernel-smooth to estimate the
distribution of bilateral distances.3 More specifically, denote by di,j, the Euclidian distance
between establishments i and j. With n entrants, the estimator of the density of bilateral
distances (henceforth K-density) at any distance d is:
K̂(d) =1
n(n− 1)h
n−1
∑i=1
n
∑j=i+1
f(
d− di,j
h
)(1)
where h is the bandwidth and f is the kernel function. All densities are calculated using
a Gaussian kernel with optimal bandwidth (following Section 3.4.2 of Silverman, 1986).
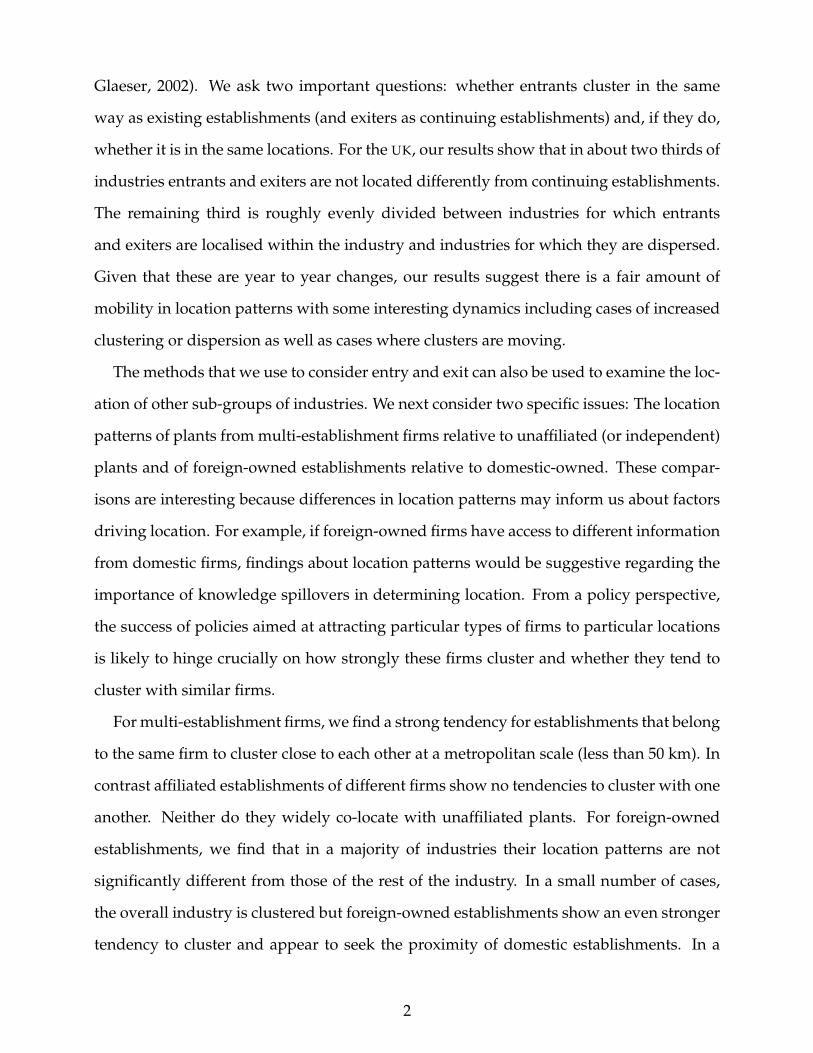
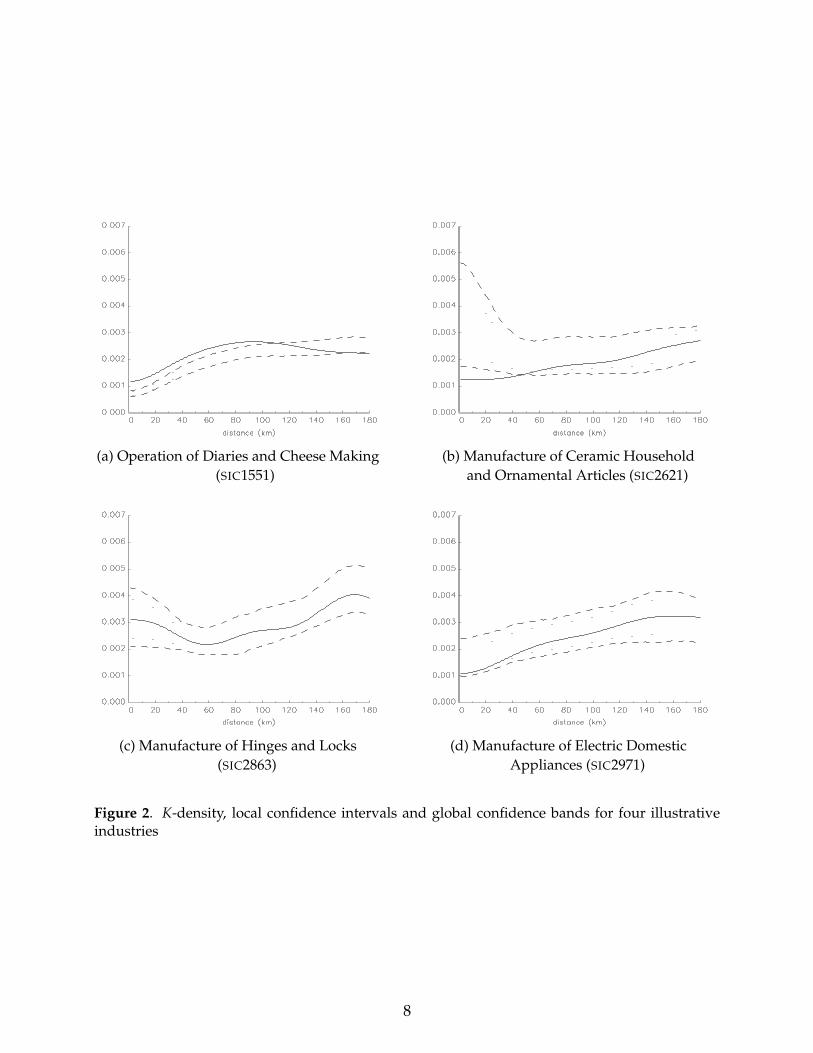
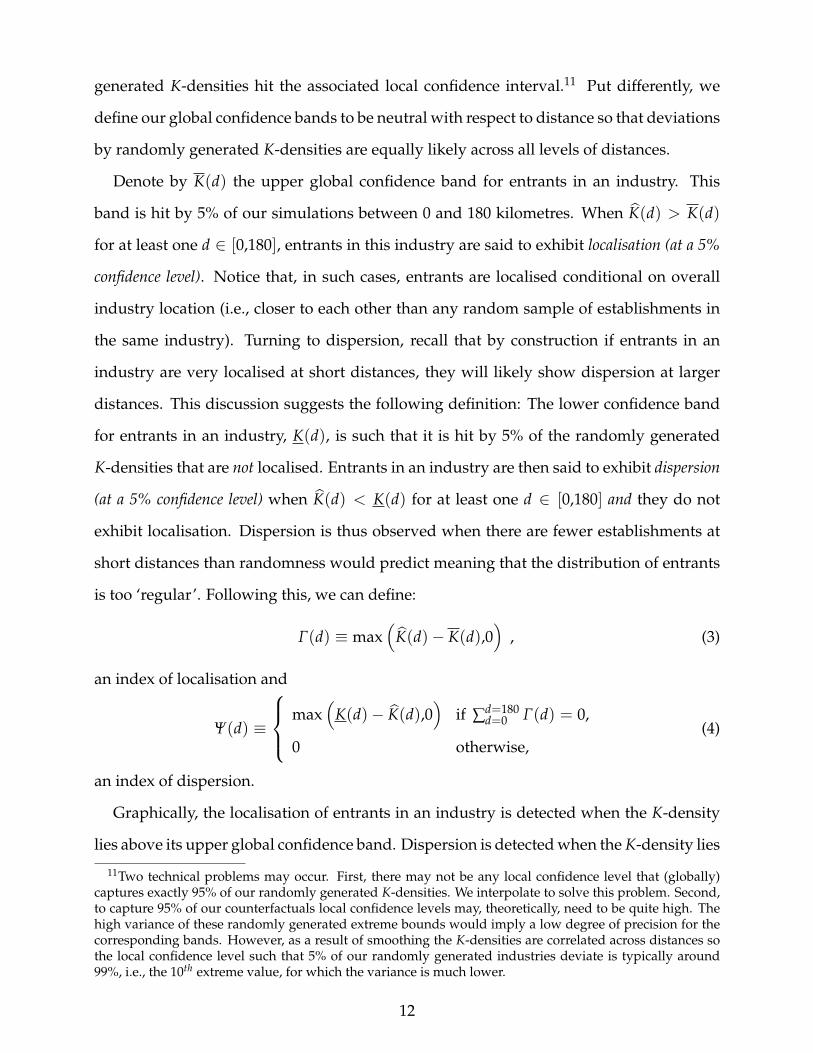
The solid lines in Figures 2(a-d) plot these densities for the entrants in our four illustrative
industries. The dashed and dotted lines plot the local and global confidence bands, which
will be explained later.
3If the mapping from Euclidian distances to true distances differs systematically across regions, or asdistances get longer, our analysis will be biased. However, according to Combes and Lafourcade (2005), thecorrelation between Euclidian distances and generalised transport costs (computed from real transport data)for France is extremely high at 0.97. Our short-cut is thus unlikely to create a strong bias in the analysis.
7
(a) Operation of Diaries and Cheese Making (b) Manufacture of Ceramic Household(SIC1551) and Ornamental Articles (SIC2621)
(c) Manufacture of Hinges and Locks (d) Manufacture of Electric Domestic(SIC2863) Appliances (SIC2971)
Figure 2. K-density, local confidence intervals and global confidence bands for four illustrativeindustries
8
Considering the distribution of bilateral distances between entrants will allow us to
assess whether they show similar location patterns to existing establishments. A related,
but distinct question, is to consider whether entrants locate near to (or far from) existing
establishments. To do this, we calculate the distribution of bilateral distances between
entrants and all existing establishments. With n entrants and m continuing establishments,
there are n m unique bilateral distances. In this case, the K-density at any point d is:
K̂(n,m)(d) =1
n m h
n
∑i=1
m
∑j=1
f(
d− di,j
h
). (2)
With respect to these two estimators, there are three estimation issues to be discussed.
First, to prevent the smoothed density from taking non-zero values for negative distances
we adopt the reflection method proposed in Section 2.10 of Silverman (1986).4 Second, be-
cause our data are a census of the entire industry population rather than a random sample
of that population we do not need to worry about statistical variation in the estimation
of the actual K-density (see Efron and Tibshirani, 1993; Quah, 1997; Davison and Hinkley,
1997). Third, there is strong dependence between bilateral distances generated from a set
of points even when the underlying points are independently distributed.5 As a result we
can not derive the limiting distributions of our two estimators (1) and (2), and instead rely
on Monte-Carlo simulations.
Counterfactuals
We construct counterfactuals by randomly drawing points from some chosen group of
establishments.6 Then three questions must be answered. What group should we draw
points from? How many should we draw? How many times should the exercise be
repeated?
4If the original data set for an industry is X1, X2, ... the reflected data set is X1,−X1, X2,−X2.... We thenestimate K̂∗(d) using this augmented data set and define K̂(d) = 2K̂∗(d) if d > 0 and K̂(d) = 0 if d ≤ 0.
5For instance, with three points, two short distances, x and y, imply that the third distance, z, must alsobe short because in a triangle z ≤ x + y. See Cressie (1993) and Diggle (2003) for further discussion.
6We sample points not distances because of the strong dependence discussed above. See Duranton andOverman (2005) for further discussion.
9
To answer the first two questions, it is fundamental to ask ourselves what a random
location pattern would look like for the establishments that we are studying. In this
section, we are looking at the location patterns of entrants in an industry relative to
the location patterns of that industry. Thus a natural counterfactual to consider is a
hypothetical industry that, overall, locates in the same way as the actual industry, that
has the same number of existing establishments and entrants but where we know that
entrants locate no differently from existing establishments. To construct such a counter-
factual industry we draw, without replacement, the same number of entrants from the
population of sites occupied by the industry.7 This is equivalent to randomly relabelling
all the establishments in the industry as either entrants or existing establishments while
holding the share of both groups fixed. Counterfactuals constructed in this way allow us
to assess the location patterns of entrants in an industry conditional on (i) the size of that
industry, (ii) its overall location tendencies and (iii) its rate of entry. We believe that these
counterfactuals are the most natural for our analysis aimed at highlighting stylised facts.8
To answer the third question above, we run 1000 simulations for each industry.9 For each
counterfactual in each industry, we then estimate its K-density function exactly as we did
for the actual industry.
Confidence bands
We now need to compare the actual K-densities to the counterfactuals. The first question
is over what range of distances should the comparisons be made. We could perform our
comparison over all possible distances (in UK manufacturing: 0− 1000 km). Then for short
7A site is where one establishment is located – when two establishments share the same postcode, twodifferent sites are distinguished.
8These counterfactuals can also be justified further by the following simple model. In each industry,every year, there is a set of new entrepreneurs who each have to choose a location. All available sites can beranked by quality so that the actual sites occupied by the industry are the preferred sites for that industry.Of course, more sophisticated models implying different counterfactuals could be devised. We view thedevelopment of such models that could then be tested using the type of methodology we use here as thefundamental next step. It would be difficult however to derive empirically relevant models on these issueswithout the results we here presented. Quah and Simpson (2003) make some progress in this direction usinga spatial point pattern approach that builds on principles slightly different from ours.
9Running more simulations leads to similar results.
10
distances (i.e., small d), ‘abnormally’ high values for the distance density, K̂(d) could be
interpreted as localisation while ‘abnormally’ low values could be interpreted as dispersion.
For large distances, this interpretation would need to be reversed since an abnormally
low K̂(d) for large distances means localisation (because there are too few establishments
located far from each other). However, as the K-density needs to sum to unity over the
range of distances, information on long distances is redundant if we know what happens
at short distances. This suggests using all distances to calculate the K-density, but then
imposing a distance threshold when classifying industries as localised or dispersed. To
make comparison easier across industries we choose a common threshold of 180 kilo-
metres which corresponds to the median distance between any two establishments in UK
manufacturing.
As discussed in Duranton and Overman (2005), it is possible to define and compute
local confidence levels for each distance. For instance, a 5% local upper confidence level
for distance d would be such that 5% of our randomly generated K-densities lie above it
at distance d (and similarly for the local lower confidence level). Unfortunately, such local
confidence intervals only allow us to make statements for a given level of distance. It is
more interesting to be able to make statements about deviations over the entire range of
distances we consider.10 Thus we want to draw global confidence bands (between 0 and
180 kilometres) such that 95% of our randomly drawn industries lie above or below those
bands.
To define those global confidence bands we look for the local confidence levels such
that, when looking across all distances between 0 and 180 km, only 5% of our randomly
10When distances are considered independently, as when computing local confidence intervals, there isa high probability of observing some deviation for at least one level of distance. This is the same typeof problem as in regression analysis where some of a large number of random independent variables willappear significant if one conducts independent significant tests on each coefficient in turn.
11
generated K-densities hit the associated local confidence interval.11 Put differently, we
define our global confidence bands to be neutral with respect to distance so that deviations
by randomly generated K-densities are equally likely across all levels of distances.
Denote by K(d) the upper global confidence band for entrants in an industry. This
band is hit by 5% of our simulations between 0 and 180 kilometres. When K̂(d) > K(d)
for at least one d ∈ [0,180], entrants in this industry are said to exhibit localisation (at a 5%
confidence level). Notice that, in such cases, entrants are localised conditional on overall
industry location (i.e., closer to each other than any random sample of establishments in
the same industry). Turning to dispersion, recall that by construction if entrants in an
industry are very localised at short distances, they will likely show dispersion at larger
distances. This discussion suggests the following definition: The lower confidence band
for entrants in an industry, K(d), is such that it is hit by 5% of the randomly generated
K-densities that are not localised. Entrants in an industry are then said to exhibit dispersion
(at a 5% confidence level) when K̂(d) < K(d) for at least one d ∈ [0,180] and they do not
exhibit localisation. Dispersion is thus observed when there are fewer establishments at
short distances than randomness would predict meaning that the distribution of entrants
is too ‘regular’. Following this, we can define:
Γ(d) ≡ max(
K̂(d)− K(d),0)
, (3)
an index of localisation and
Ψ(d) ≡
max(
K(d)− K̂(d),0)
if ∑d=180d=0 Γ(d) = 0,
0 otherwise,(4)
an index of dispersion.
Graphically, the localisation of entrants in an industry is detected when the K-density
lies above its upper global confidence band. Dispersion is detected when the K-density lies
11Two technical problems may occur. First, there may not be any local confidence level that (globally)captures exactly 95% of our randomly generated K-densities. We interpolate to solve this problem. Second,to capture 95% of our counterfactuals local confidence levels may, theoretically, need to be quite high. Thehigh variance of these randomly generated extreme bounds would imply a low degree of precision for thecorresponding bands. However, as a result of smoothing the K-densities are correlated across distances sothe local confidence level such that 5% of our randomly generated industries deviate is typically around99%, i.e., the 10th extreme value, for which the variance is much lower.
12
below the lower global confidence band and never lies above the upper global confidence
band. For our four illustrative industries, the local confidence intervals are represented by
the faint dotted lines and global confidence bands by the dashed lines in Figures 2(a-d).
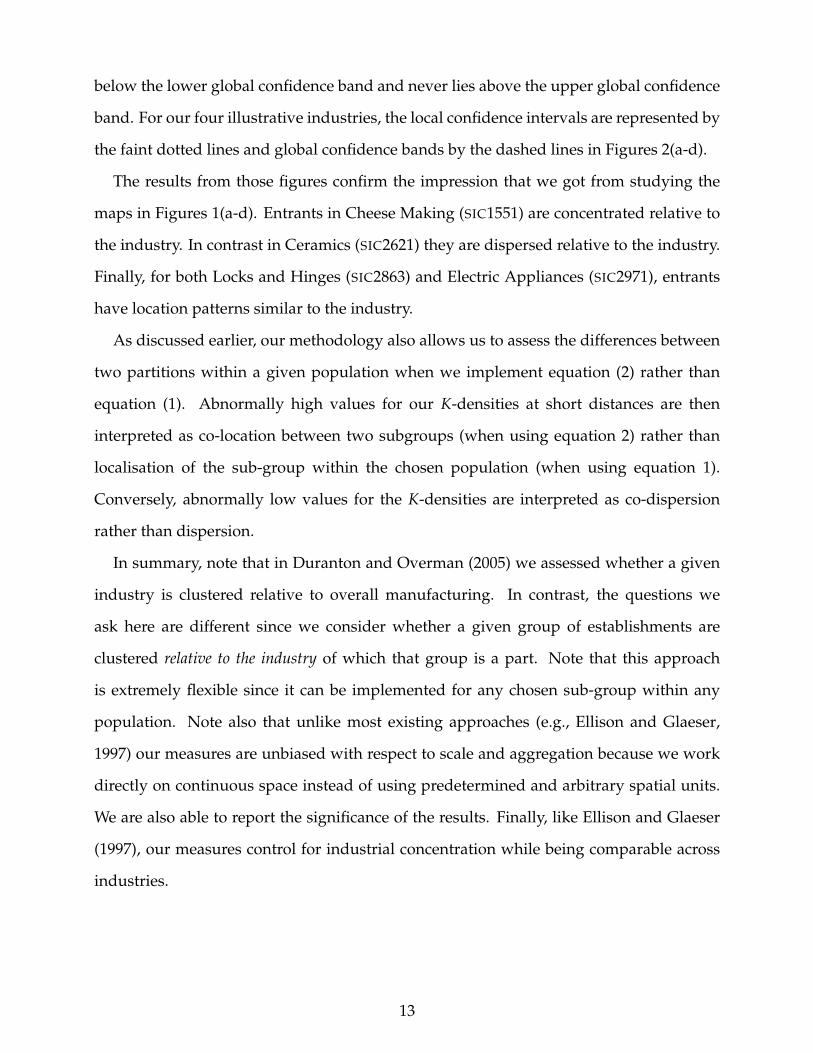
The results from those figures confirm the impression that we got from studying the
maps in Figures 1(a-d). Entrants in Cheese Making (SIC1551) are concentrated relative to
the industry. In contrast in Ceramics (SIC2621) they are dispersed relative to the industry.
Finally, for both Locks and Hinges (SIC2863) and Electric Appliances (SIC2971), entrants
have location patterns similar to the industry.
As discussed earlier, our methodology also allows us to assess the differences between
two partitions within a given population when we implement equation (2) rather than
equation (1). Abnormally high values for our K-densities at short distances are then
interpreted as co-location between two subgroups (when using equation 2) rather than
localisation of the sub-group within the chosen population (when using equation 1).
Conversely, abnormally low values for the K-densities are interpreted as co-dispersion
rather than dispersion.
In summary, note that in Duranton and Overman (2005) we assessed whether a given
industry is clustered relative to overall manufacturing. In contrast, the questions we
ask here are different since we consider whether a given group of establishments are
clustered relative to the industry of which that group is a part. Note that this approach
is extremely flexible since it can be implemented for any chosen sub-group within any
population. Note also that unlike most existing approaches (e.g., Ellison and Glaeser,
1997) our measures are unbiased with respect to scale and aggregation because we work
directly on continuous space instead of using predetermined and arbitrary spatial units.
We are also able to report the significance of the results. Finally, like Ellison and Glaeser
(1997), our measures control for industrial concentration while being comparable across
industries.
13
4. Entries and exits
We begin our systematic analysis with entry and exit. We first use equation (1) to look
at the location patterns of entries and ask whether entrants are essentially a random
sub-sample of all establishments in the industry. As a reminder, to do this we proceed
as described in the previous section, first computing the K-density in each industry for
the bilateral distances between all entrants in the industry. The counterfactuals are then
produced by creating hypothetical industries with the same number of establishments and
the same proportion of entrants but with entrants and existing establishments randomly
reallocated across all sites used by the industry.
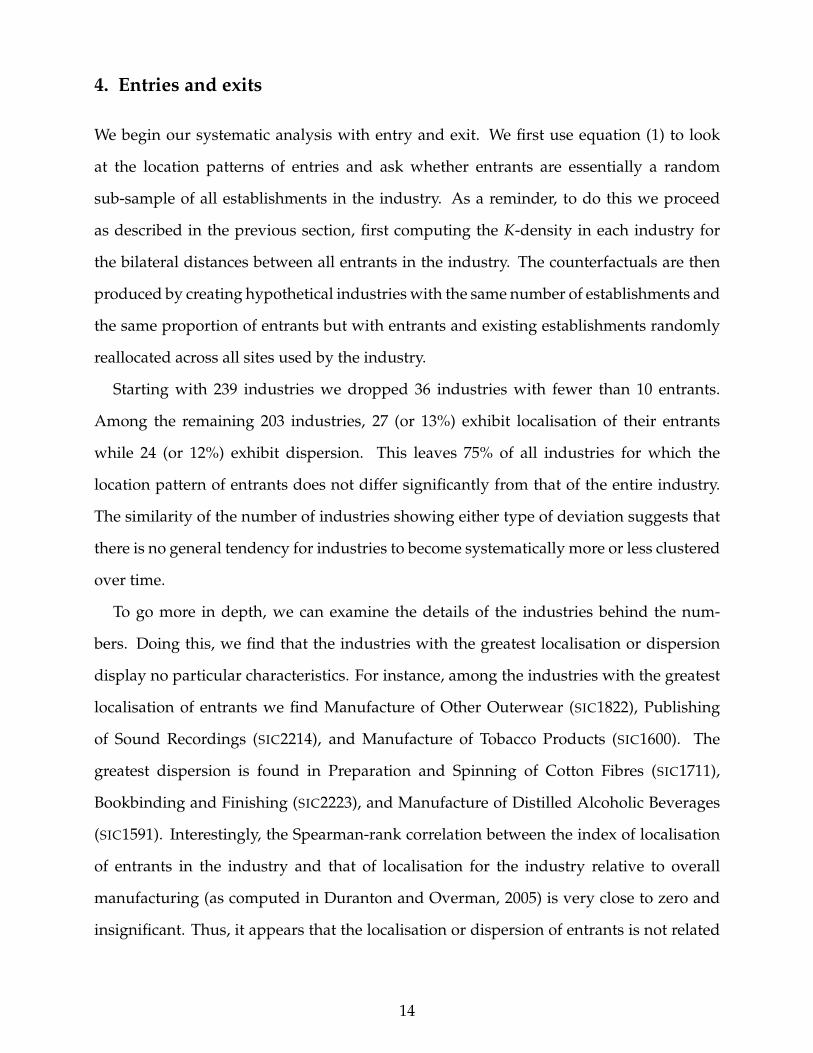
Starting with 239 industries we dropped 36 industries with fewer than 10 entrants.
Among the remaining 203 industries, 27 (or 13%) exhibit localisation of their entrants
while 24 (or 12%) exhibit dispersion. This leaves 75% of all industries for which the
location pattern of entrants does not differ significantly from that of the entire industry.
The similarity of the number of industries showing either type of deviation suggests that
there is no general tendency for industries to become systematically more or less clustered
over time.
To go more in depth, we can examine the details of the industries behind the num-
bers. Doing this, we find that the industries with the greatest localisation or dispersion
display no particular characteristics. For instance, among the industries with the greatest
localisation of entrants we find Manufacture of Other Outerwear (SIC1822), Publishing
of Sound Recordings (SIC2214), and Manufacture of Tobacco Products (SIC1600). The
greatest dispersion is found in Preparation and Spinning of Cotton Fibres (SIC1711),
Bookbinding and Finishing (SIC2223), and Manufacture of Distilled Alcoholic Beverages
(SIC1591). Interestingly, the Spearman-rank correlation between the index of localisation
of entrants in the industry and that of localisation for the industry relative to overall
manufacturing (as computed in Duranton and Overman, 2005) is very close to zero and
insignificant. Thus, it appears that the localisation or dispersion of entrants is not related
14
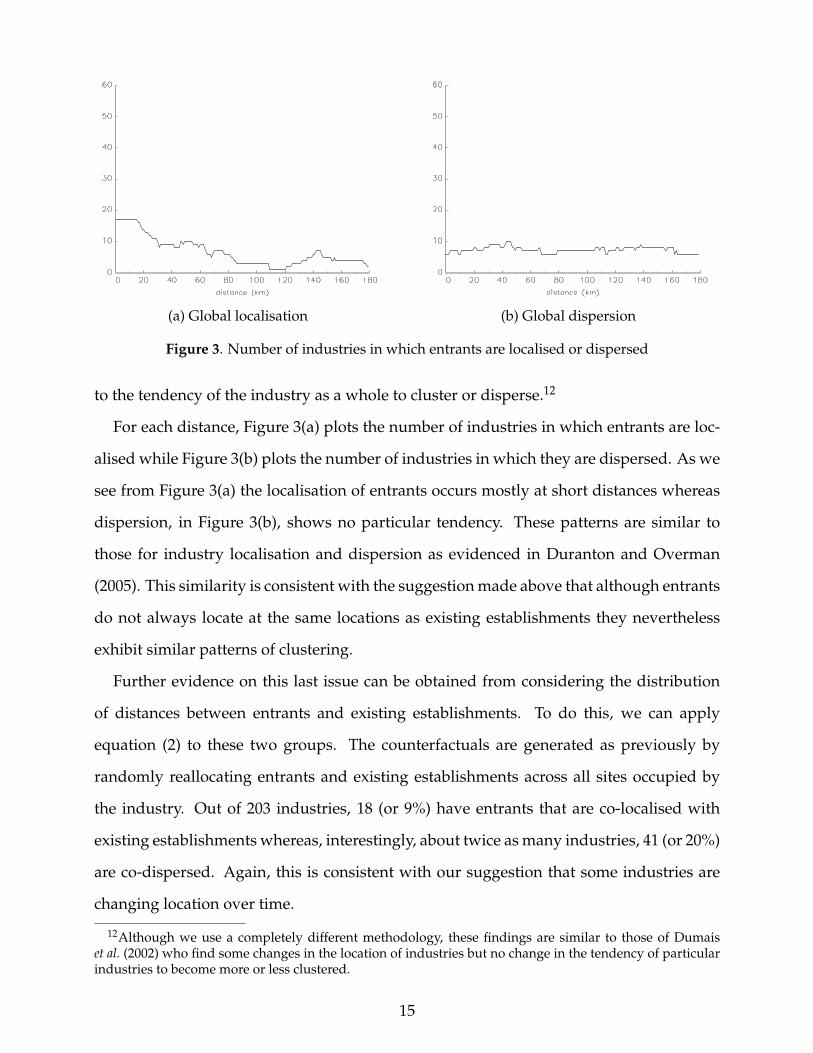
(a) Global localisation (b) Global dispersion
Figure 3. Number of industries in which entrants are localised or dispersed
to the tendency of the industry as a whole to cluster or disperse.12
For each distance, Figure 3(a) plots the number of industries in which entrants are loc-
alised while Figure 3(b) plots the number of industries in which they are dispersed. As we
see from Figure 3(a) the localisation of entrants occurs mostly at short distances whereas
dispersion, in Figure 3(b), shows no particular tendency. These patterns are similar to
those for industry localisation and dispersion as evidenced in Duranton and Overman
(2005). This similarity is consistent with the suggestion made above that although entrants
do not always locate at the same locations as existing establishments they nevertheless
exhibit similar patterns of clustering.
Further evidence on this last issue can be obtained from considering the distribution
of distances between entrants and existing establishments. To do this, we can apply
equation (2) to these two groups. The counterfactuals are generated as previously by
randomly reallocating entrants and existing establishments across all sites occupied by
the industry. Out of 203 industries, 18 (or 9%) have entrants that are co-localised with
existing establishments whereas, interestingly, about twice as many industries, 41 (or 20%)
are co-dispersed. Again, this is consistent with our suggestion that some industries are
changing location over time.
12Although we use a completely different methodology, these findings are similar to those of Dumaiset al. (2002) who find some changes in the location of industries but no change in the tendency of particularindustries to become more or less clustered.
15
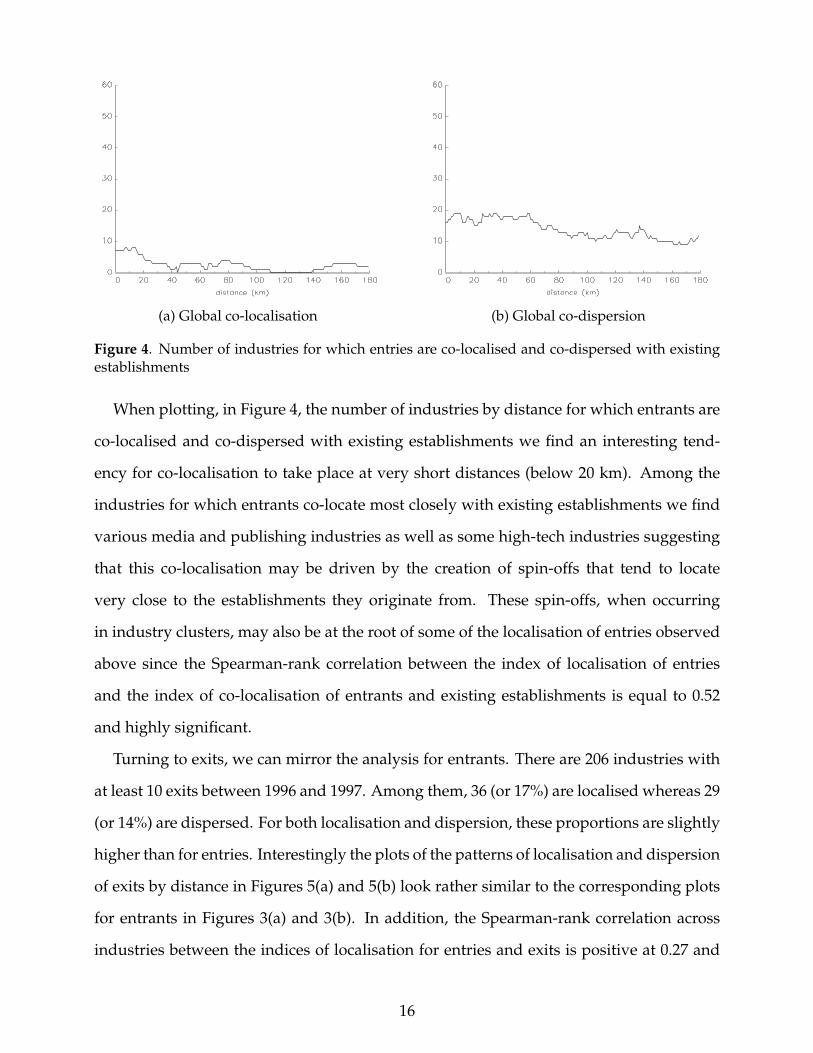
(a) Global co-localisation (b) Global co-dispersion
Figure 4. Number of industries for which entries are co-localised and co-dispersed with existingestablishments
When plotting, in Figure 4, the number of industries by distance for which entrants are
co-localised and co-dispersed with existing establishments we find an interesting tend-
ency for co-localisation to take place at very short distances (below 20 km). Among the
industries for which entrants co-locate most closely with existing establishments we find
various media and publishing industries as well as some high-tech industries suggesting
that this co-localisation may be driven by the creation of spin-offs that tend to locate
very close to the establishments they originate from. These spin-offs, when occurring
in industry clusters, may also be at the root of some of the localisation of entries observed
above since the Spearman-rank correlation between the index of localisation of entries
and the index of co-localisation of entrants and existing establishments is equal to 0.52
and highly significant.
Turning to exits, we can mirror the analysis for entrants. There are 206 industries with
at least 10 exits between 1996 and 1997. Among them, 36 (or 17%) are localised whereas 29
(or 14%) are dispersed. For both localisation and dispersion, these proportions are slightly
higher than for entries. Interestingly the plots of the patterns of localisation and dispersion
of exits by distance in Figures 5(a) and 5(b) look rather similar to the corresponding plots
for entrants in Figures 3(a) and 3(b). In addition, the Spearman-rank correlation across
industries between the indices of localisation for entries and exits is positive at 0.27 and
16
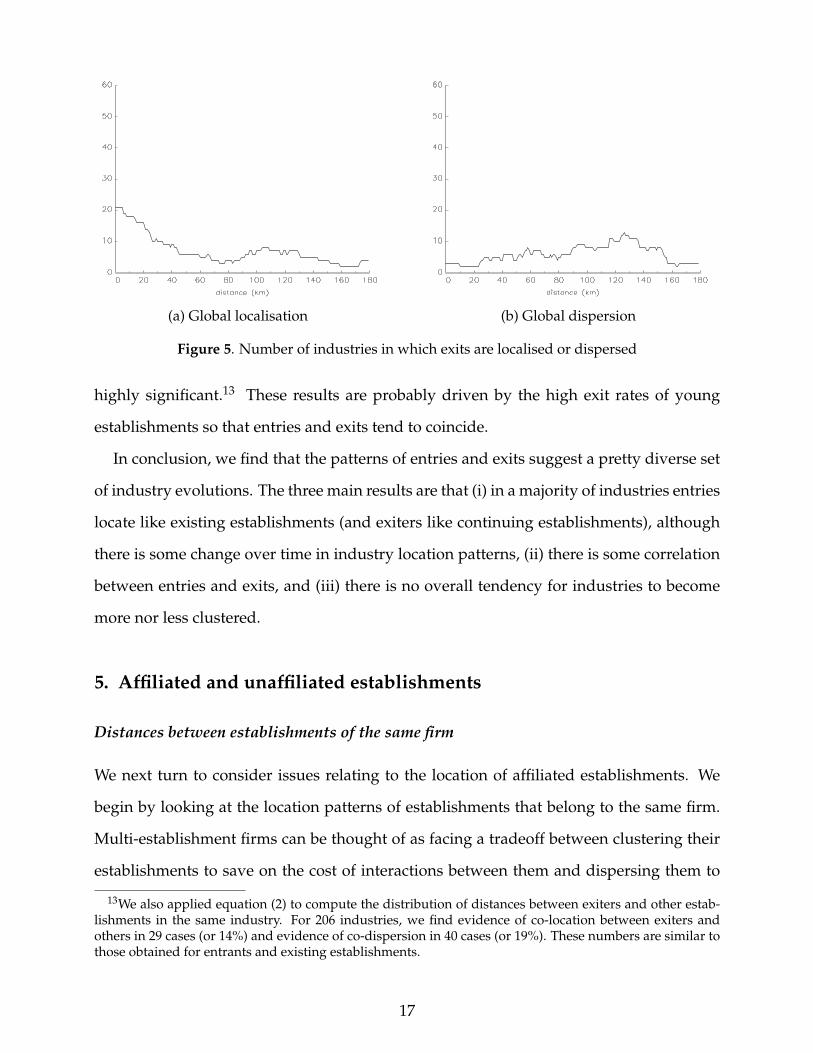
(a) Global localisation (b) Global dispersion
Figure 5. Number of industries in which exits are localised or dispersed
highly significant.13 These results are probably driven by the high exit rates of young
establishments so that entries and exits tend to coincide.
In conclusion, we find that the patterns of entries and exits suggest a pretty diverse set
of industry evolutions. The three main results are that (i) in a majority of industries entries
locate like existing establishments (and exiters like continuing establishments), although
there is some change over time in industry location patterns, (ii) there is some correlation
between entries and exits, and (iii) there is no overall tendency for industries to become
more nor less clustered.
5. Affiliated and unaffiliated establishments
Distances between establishments of the same firm
We next turn to consider issues relating to the location of affiliated establishments. We
begin by looking at the location patterns of establishments that belong to the same firm.
Multi-establishment firms can be thought of as facing a tradeoff between clustering their
establishments to save on the cost of interactions between them and dispersing them to
13We also applied equation (2) to compute the distribution of distances between exiters and other estab-lishments in the same industry. For 206 industries, we find evidence of co-location between exiters andothers in 29 cases (or 14%) and evidence of co-dispersion in 40 cases (or 19%). These numbers are similar tothose obtained for entrants and existing establishments.
17
cover the market better. Considering the location patterns of establishments that belong
to the same firm allows us to assess which of these two forces dominate.
Performing this analysis requires a slight modification of equation (1). First to compute
the K-densities, we only considered the distances between establishments that belong to
the same firm. Second, to generate our counterfactuals, we created hypothetical industries
with the same number of firms and the same distribution of number of establishments
across firms. We then randomly reallocated establishments across the sites used by the
actual industry. This done, we constructed the counterfactual K-densities by considering
the distances between establishments that belong to the same hypothetical firms. This
analysis tells us whether two establishments that belong to the same firm are closer to
each other than to any random pair of establishments in the industry. Note that this is
a powerful test since it controls for both the industrial structure of industries and their
tendency to localise or disperse. Thus, as previously, all the statements in this section are
conditional on the overall patterns of industry location and structure.
Starting with 239 industries we dropped all sectors for which multi-establishment firms
account for less than 10 plants. This left us with 213 industries. Overall we find that
152 industries (or 71%) exhibit localisation of establishments that belong to the same firm
while 23 (or 11%) exhibit dispersion. Overall, in light of the above tradeoff, our results
strongly suggest that economising on interaction costs dominates the forces that push
towards dispersion in a large majority of industries.
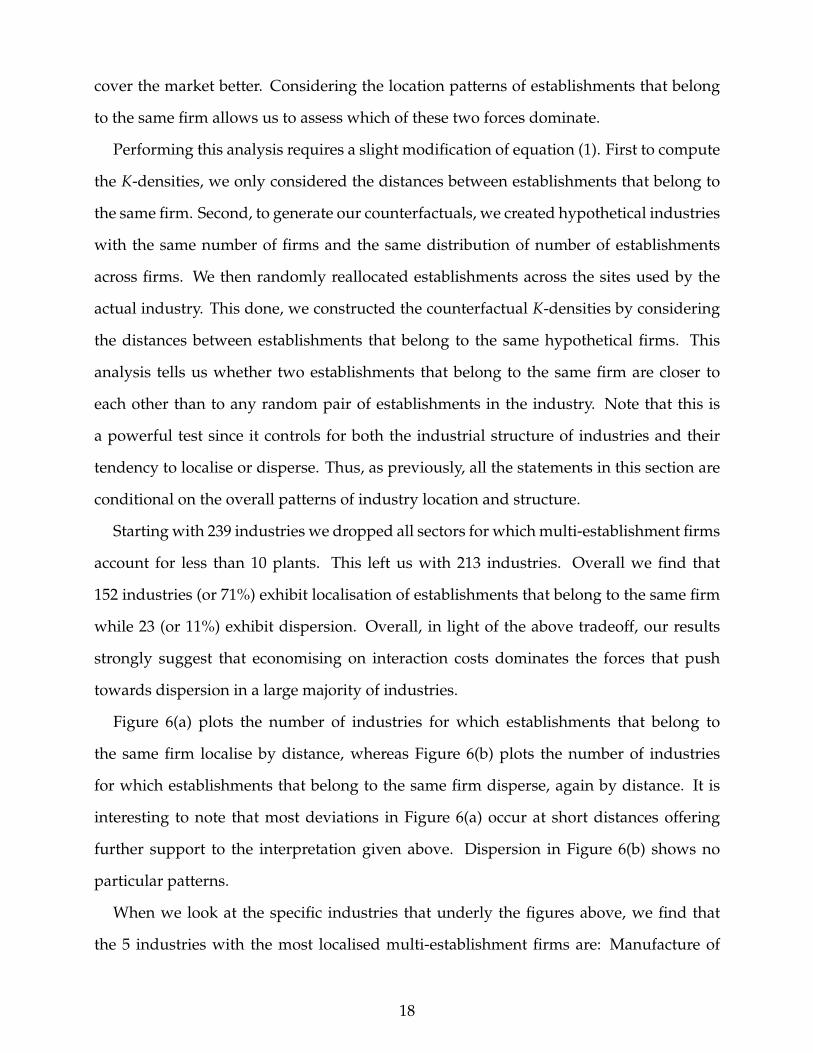
Figure 6(a) plots the number of industries for which establishments that belong to
the same firm localise by distance, whereas Figure 6(b) plots the number of industries
for which establishments that belong to the same firm disperse, again by distance. It is
interesting to note that most deviations in Figure 6(a) occur at short distances offering
further support to the interpretation given above. Dispersion in Figure 6(b) shows no
particular patterns.
When we look at the specific industries that underly the figures above, we find that
the 5 industries with the most localised multi-establishment firms are: Manufacture of
18
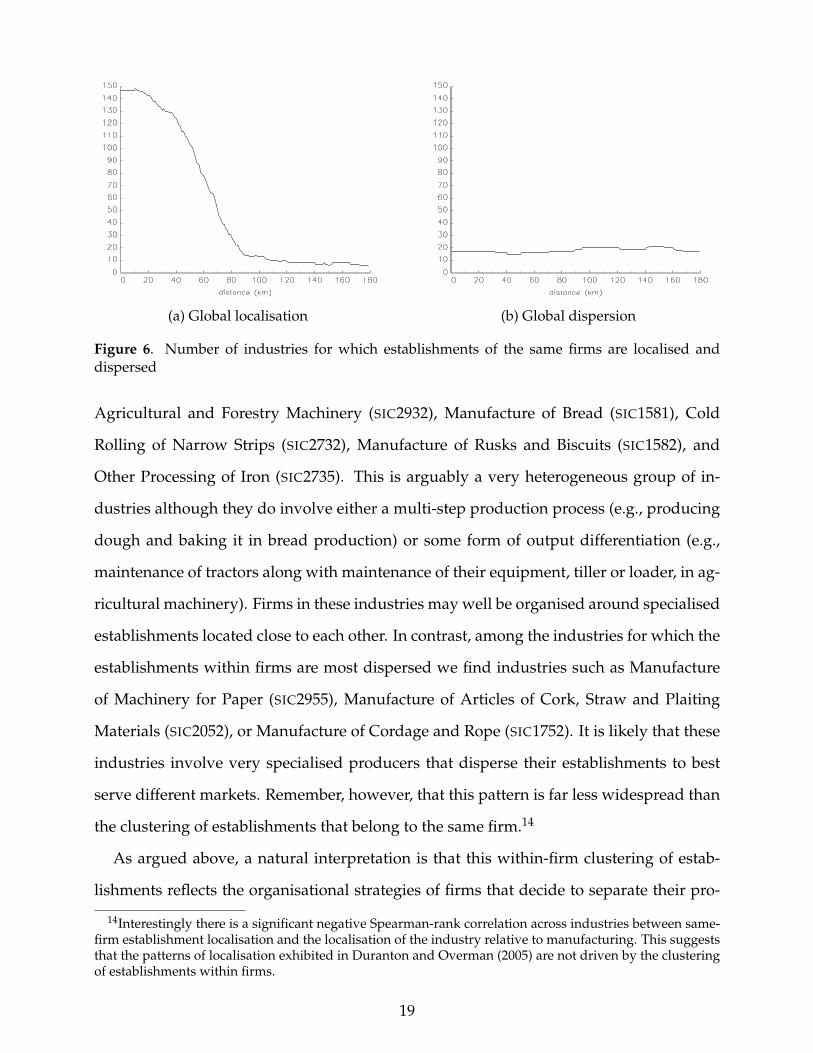
(a) Global localisation (b) Global dispersion
Figure 6. Number of industries for which establishments of the same firms are localised anddispersed
Agricultural and Forestry Machinery (SIC2932), Manufacture of Bread (SIC1581), Cold
Rolling of Narrow Strips (SIC2732), Manufacture of Rusks and Biscuits (SIC1582), and
Other Processing of Iron (SIC2735). This is arguably a very heterogeneous group of in-
dustries although they do involve either a multi-step production process (e.g., producing
dough and baking it in bread production) or some form of output differentiation (e.g.,
maintenance of tractors along with maintenance of their equipment, tiller or loader, in ag-
ricultural machinery). Firms in these industries may well be organised around specialised
establishments located close to each other. In contrast, among the industries for which the
establishments within firms are most dispersed we find industries such as Manufacture
of Machinery for Paper (SIC2955), Manufacture of Articles of Cork, Straw and Plaiting
Materials (SIC2052), or Manufacture of Cordage and Rope (SIC1752). It is likely that these
industries involve very specialised producers that disperse their establishments to best
serve different markets. Remember, however, that this pattern is far less widespread than
the clustering of establishments that belong to the same firm.14
As argued above, a natural interpretation is that this within-firm clustering of estab-
lishments reflects the organisational strategies of firms that decide to separate their pro-
14Interestingly there is a significant negative Spearman-rank correlation across industries between same-firm establishment localisation and the localisation of the industry relative to manufacturing. This suggeststhat the patterns of localisation exhibited in Duranton and Overman (2005) are not driven by the clusteringof establishments within firms.
19
duction activities across different establishments located close to each other. The charac-
teristics of the industries with the most localised same-firm establishments and the spatial
scale at which this clustering takes place are certainly supportive of this interpretation.
However, it may also be that firms located in clusters also have more establishments.
In this case the clustering of establishments within the same firm would partly reflect a
broader tendency for multi-establishments firms to be more clustered. It is to this issue
that we now turn.
Distances between all affiliated establishments
To investigate this idea in more depth, we can compute K-densities using the distances
between all affiliated establishments without restricting ourselves to within-firm dis-
tances. We compare this to the corresponding counterfactual K-densities obtained by
randomly reallocating affiliated establishments across all sites used by the industry. The
results of the analysis indicate whether affiliated establishments are closer to each other
than any random pair of establishments in the industry.
Out of 213 industries, we find that 69 (or 32%) exhibit localisation of their affiliated
establishments while 35 (or 16%) exhibit dispersion. When excluding distances between
affiliated establishments that belong to the same firm (i.e., considering only the distances
between affiliated establishments that belong to different firms), we find that 52 industries
in 213 (or 24%) exhibit localisation while 66 (or 31%) are dispersed. Hence affiliated
establishments that belong to different multi-establishment firms have a mild tendency
towards dispersion rather than localisation.15 Returning to our discussion that motivated
this part of the analysis, the results suggest that within-firm localisation of establishments
is likely to be driven more by the organisational strategies of firms than the tendency of
firms located in clusters to have more establishments.15A few media industries (Manufacture of Sound Recordings, SIC2231, or Publishing of Books, SIC2211)
exhibit a particularly interesting pattern which leads affiliated plants to be localised. Specifically,these industries are organised around a number of large multi-establishments firms and smaller mono-establishments firms with the multi-establishment firms having most of their establishments clusteredaround London whereas single plants are dispersed in the rest of the country.
20
Since affiliated establishments that belong to different firms tend to mildly repel each
other this naturally raises the question of whether affiliated establishments are instead
attracted by single plants, i.e., whether affiliated and single establishments co-locate.
To examine this we constructed K-densities using all the distances between affiliated
establishments and single plants before comparing them to their corresponding coun-
terfactual K-densities (still obtained by randomly reallocating establishments across the
sites occupied by the industry). Out of 213 industries, we find that 48 (or 22%) show
some co-localisation between affiliated and single establishments while 59 (or 28%) exhibit
co-dispersion. This suggests that affiliated establishments are no more attracted by single
plants than by affiliated establishments from other firms.
In conclusion, the general picture that emerges for the location patterns of affiliated
and single plants is the following. On the one hand, there is a very strong tendency
for establishments that belong to the same firms to cluster. On the other hand, there is
no particular tendency for multi-establishment firms to cluster together or for affiliated
establishments to cluster with single plants.
6. Foreign vs. domestic-owned establishments
We now turn to questions relating to the location of foreign versus domestically owned
establishments. We start by considering whether foreign-owned establishments locate
closer to each other than any random pair of establishment in the industry. To do this, we
look at the distribution of distances between foreign-owned establishments as opposed
to distances between randomly chosen establishments in the industry. That is, we apply
equation (1) to distances between foreign-owned establishments and generate our coun-
terfactuals by randomly reallocating foreign ownership of plants within the industry.
To perform our analysis, we retained the 106 industries with at least 10 foreign owned
establishments. We find that only 11 industries (or 10%) exhibit localisation of foreign-
owned establishments while 24 (or 23%) exhibit dispersion. Figure 7(a) plots the number
of industries for which foreign-owned establishments localise by distance. There is no
21
(a) Global localisation (b) Global dispersion
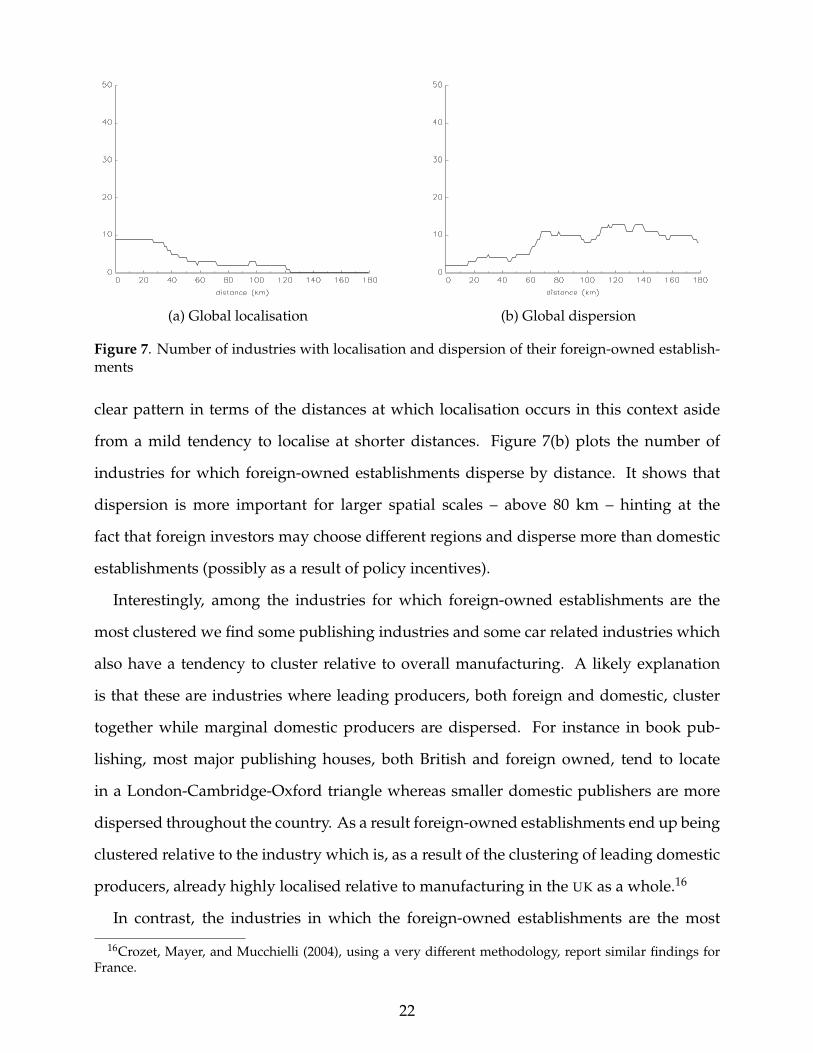
Figure 7. Number of industries with localisation and dispersion of their foreign-owned establish-ments
clear pattern in terms of the distances at which localisation occurs in this context aside
from a mild tendency to localise at shorter distances. Figure 7(b) plots the number of
industries for which foreign-owned establishments disperse by distance. It shows that
dispersion is more important for larger spatial scales – above 80 km – hinting at the
fact that foreign investors may choose different regions and disperse more than domestic
establishments (possibly as a result of policy incentives).
Interestingly, among the industries for which foreign-owned establishments are the
most clustered we find some publishing industries and some car related industries which
also have a tendency to cluster relative to overall manufacturing. A likely explanation
is that these are industries where leading producers, both foreign and domestic, cluster
together while marginal domestic producers are dispersed. For instance in book pub-
lishing, most major publishing houses, both British and foreign owned, tend to locate
in a London-Cambridge-Oxford triangle whereas smaller domestic publishers are more
dispersed throughout the country. As a result foreign-owned establishments end up being
clustered relative to the industry which is, as a result of the clustering of leading domestic
producers, already highly localised relative to manufacturing in the UK as a whole.16
In contrast, the industries in which the foreign-owned establishments are the most
16Crozet, Mayer, and Mucchielli (2004), using a very different methodology, report similar findings forFrance.
22
dispersed tend to be assembly industries like Manufacture of Electronic Valves and Tubes
(SIC3210), Manufacture of Computers (SIC3002), or Manufacture of Televisions and Radios
(SIC3230). These industries are relatively footloose and only have weak tendencies to
localise relative to overall manufacturing. Within these industries, foreign-owned es-
tablishments are even more dispersed possibly because of policy incentives, or because
they may value characteristics (such as ease of access from the mother country) that are
irrelevant to domestic plants. In the absence of a strong clustering force pulling estab-
lishments together, these slightly different location priorities can lead to very different
location patterns for foreign-owned establishments. Our results suggest that this actually
happens in a relatively small number of industries.
So far, we have been considering whether foreign-owned establishments locate dif-
ferently from the overall industry. Our finding of some systematic differences, begs the
question of whether foreign-owned establishments then tend to locate close to, or far from,
domestic plants. To investigate this issue, we computed K-densities using the distances
between foreign and domestic establishments and compared this to the corresponding
counterfactual K-densities obtained again by randomly reallocating foreign ownership
across all sites used by the industry. That is, we consider whether foreign-owned estab-
lishments have a tendency to co-locate with domestic plants.
We find that among 106 industries, 20 (or 19%) exhibit some co-localisation of foreign-
owned and domestic establishments whereas 27 (or 25%) exhibit co-dispersion. Unsur-
prisingly, and consistent with the interpretation given above, the industries for which
co-localisation between foreign-owned and domestic establishments is strongest are also
those for which the localisation of foreign-owned establishments is strongest. Similarly,
the industries with the strongest patterns of co-dispersion between domestic and foreign-
owned plants are also those with the strongest patterns of dispersion of foreign-owned
plants.17
In conclusion, foreign-owned establishments do not appear to have very different loc-
17The Spearman-rank correlation between the index of co-localisation of domestic and foreign-ownedplants and the index of localisation for foreign-owned plants is highly significant and equal to 0.61.
23
ation patterns from domestic establishments. In more than half of the cases their location
patterns are not statistically different from those of the industry. In a small proportion
of cases, such as publishing, foreign owned establishments tend to cluster with domestic
leaders who are themselves clustered relative to the industry as whole.18 Slightly more
common, although hardly ubiquitous, are cases of assembly industries where foreign-
owned establishments seem to disperse more than domestic plants.
Surprisingly, the similarity between the location patterns of domestic and foreign
owned establishments has received relatively little attention from the very large literature
concerned with the determinants of of foreign direct investment (see Shatz and Venables,
2000, for a recent review). It is also interesting given that successive UK governments
have implemented policies that try to systematically distort the location choices of foreign-
owned establishments towards particular areas.19
7. Small vs. large establishments
Distances between establishments by size classes
We now turn to the location patterns of establishments as a function of their size. The
main aim here is to understand what type of establishment (if any) is driving industry
localisation. Using the Ellison-Glaeser index (Ellison and Glaeser, 1997), Holmes and
Stevens (2002) suggest that clustering in the US is driven mostly by large establishments.
In our previous analysis of localisation in UK manufacturing industries (Duranton and
Overman, 2005), we found that, when excluding the smaller establishments from the
analysis, localisation tends to become stronger in some industries but weaker in others.
To shed more light on this issue, we perform a number of exercises using equations
(1) and (2). We start by asking whether the largest establishments are clustered within
industries. To answer this question, we compare the distribution of distances between
18From a policy perspective it is interesting to note that in such industries, it may be very hard to affectthe location of foreign-owned plants, since they seem to value highly the proximity of domestic leaders.
19See, for example, Devereux, Griffith, and Simpson’s (2004b) analysis of the effects of the UK govern-ment’s Regional Selective Assistance on the location of greenfield foreign direct investment.
24
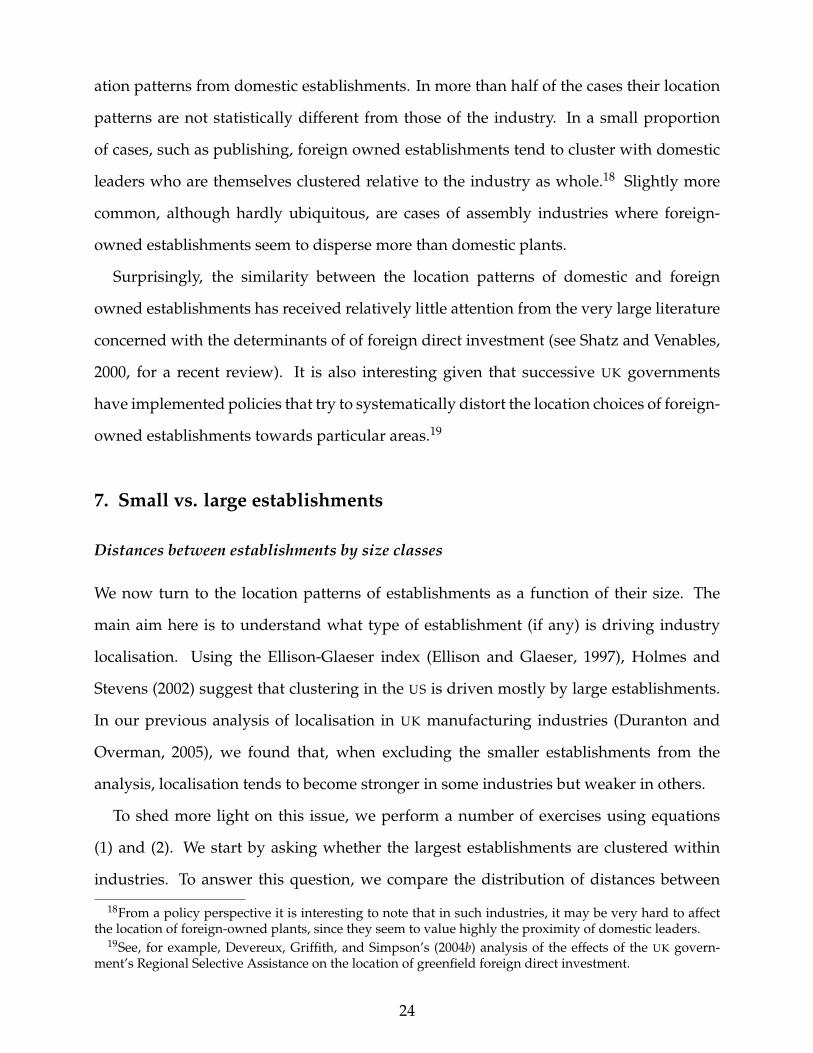
(a) Global co-localisation (b) Global co-dispersion
Figure 8. Number of industries with localisation and dispersion of their top decile of largestestablishments
these large establishments to the same distribution in counterfactual industries obtained
by randomly reallocating these large establishments across sites occupied by the industry.
To begin, we defined large establishments as those in the top decile of employment in
their industry. We considered the 172 industries with at least 10 firms in their top decile of
employment. We find that large establishments are localised in 91 industries (or 53%) and
dispersed in only 26 (or 15%). Figure 8 shows that the localisation of large establishments
has a mild tendency to occur at small spatial scales, below 50 km. By contrast, there is no
obvious spatial scale at which dispersions occur.
When looking at the reality that underlies the figures above we find a very het-
erogeneous group of industries for which the localisation of the largest establishments
is strongest: Reproduction of Video Recordings (SIC2232), Manufacture of Ceramics
(SIC2621), Manufacture of Hosiery (SIC1771), Manufacture of Locks (SIC2863), and Manu-
facture of Distilled Potable Beverages (SIC1591). Despite their heterogeneity, what all these
industries have in common is the fact that they are, themselves, highly localised relative
to overall UK manufacturing. This finding, however, does not hold more generally: The
Spearman-rank correlation between the index of localisation for the largest establishments
within the industry and the index of localisation for the entire industry relative to overall
manufacturing (as computed in Duranton and Overman,2005) is small and insignificant.
25
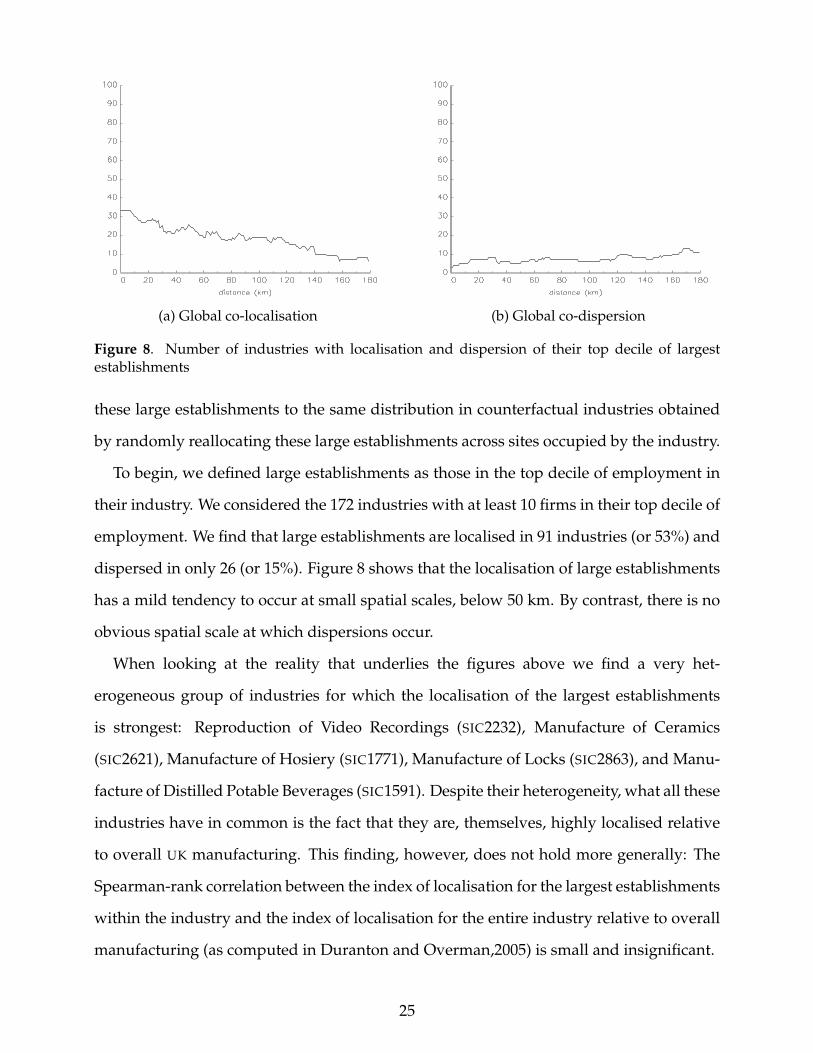
(a) Global co-localisation (b) Global co-dispersion
Figure 9. Number of industries with localisation and dispersion of their top quartile of largestestablishments
We replicated the exercise, this time for establishments in the top quartile rather than
the top decile. Out of 211 industries (with at least 10 establishments in their top quartile),
121 (or 57%) have localised top-quartile establishments while 24 (or 11%) exhibit disper-
sion. As shown by Figure 9, the spatial pattern of localisation is even more marked than
in Figure 8. This suggests that the tendency of large establishments to localise is not the
preserve of the very largest establishments. Quite the opposite, the establishments with
the strongest tendency to agglomerate tend to be those in the top quartile but not in the top
decile. As for the top decile, the Spearman-rank correlation with the index of localisation
is insignificant showing that industries where the larger firms localise are not necessarily
localised overall.
This localisation of larger establishments is not the entire story. When we performed
the same exercise, but this time for the decile of smallest establishments, we find that 89
industries in 194 (or 46%) exhibit localisation of their smallest establishments while 29 (or
15%) exhibit dispersion.20 Very similar figures are obtained when looking at the bottom
quartile: 99 industries in 213 (or 46% again) experience localisation of their bottom quartile
establishments whereas 37 (or 17%) experience dispersion of their smaller establishments.
20The number of industries is not the same as with the top decile because the existence of many establish-ments at the cut-off size allowed us to keep a number of industries with fewer than 100 establishments (butwith nonetheless 10 or more establishments in their bottom ‘decile’ after rounding).
26
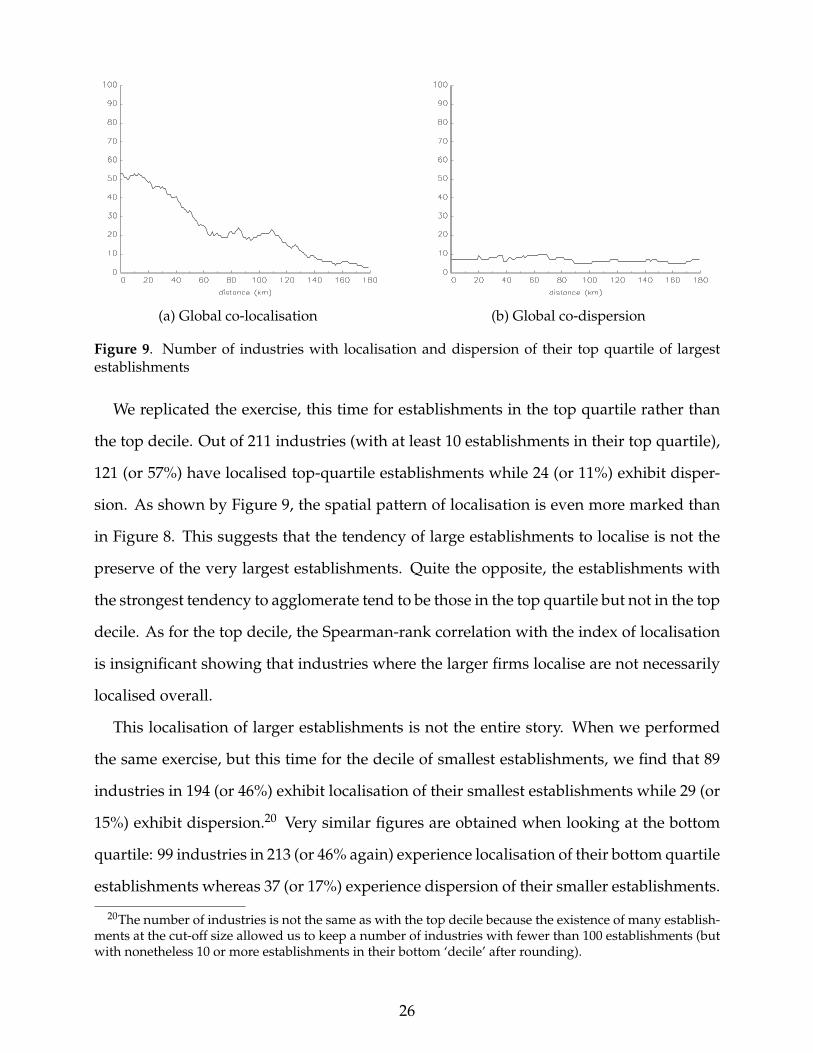
(a) Global co-localisation (b) Global co-dispersion
Figure 10. Number of industries with localisation and dispersion of their bottom decile of smallestestablishments
Overall these findings suggest that small-establishment also cluster within their industry,
but that this clustering is weaker than the clustering tendency of large establishments.
In Figure 10, we plot the number of localised and dispersed industries for establish-
ments in the bottom decile by distance.21 These two figures differ quite a lot from those in
Figure 8. More specifically, the pattern for localisation in Figure 10(a) is hump-shaped
with an increase between 0 and 30 km followed by a decrease before reaching a low
plateau. For dispersion, we observe a mild decrease between 0 and 60 km followed by a
low plateau in Figure 10(b). These patterns are intriguing. Our interpretation is that small
establishments may locate close to large establishments at very short distances (as a result,
for instance, of spin-offs). This can make them look weakly localised or even dispersed
depending on whether large establishments are themselves localised or dispersed at these
short distances as reflected in Figure 10. It is only for slightly larger distances that the
tendency for small establishments to locate close to each other dominates.
Distances between establishments across size classes
The above results suggest that some interaction may be happening between large and
small establishments. This can be substantiated by an analysis of the co-location patterns
21The patterns for the bottom quartile are the same.
27
of large and small establishments using (2) for distances between establishments in the
top quartile and those in the other three quartiles.22 Again the counterfactuals were
constructed by randomly reallocating the actual distribution of establishment employ-
ment across sites occupied by the industry. Among 211 industries (with more than 10
establishments in their top quartile), 59 (or 28%) exhibit co-localisation between large and
small establishments whereas 43 (or 20%) exhibit co-dispersion. These results appear
to give some support to the conjecture above that large establishments help explain the
location patterns of small establishments. Further support is given by the Spearman-rank
correlation across industries of top-quartile establishment localisation versus top and
bottom-three quartile co-localisation: It is high at 0.66 and very significant. However the
number of industries with co-localisation between large and small establishments is not
large enough to explain fully the tendency for small establishments to localise.23
In conclusion it appears that large establishments mildly drive industry clustering in
two different ways. First they directly foster clustering by locating close to each other.
In a majority of industries large establishments are clustered even after controlling for
the location patterns of the industry. More subtly, large establishments also appear to
foster clustering indirectly by attracting small establishments in nearby locations. How-
ever these clustering effects of large establishment are not strong enough to drive the
localisation of their entire industries. The picture is further complicated by evidence of
some residual small-establishment localisation. This weak clustering tendency of small
establishments seems consistent with the patterns of industry mobility observed in section
4 and the formation of new clusters around new (and smaller) establishments. Overall
these findings appear to confirm the preliminary findings of Duranton and Overman
(2005). The role of large establishments appears less important than that suggested by
22Performing the same exercise between top-decile establishments and those in the bottom nine yieldssimilar results.
23Besides, the significant negative Spearman-rank correlation across industries between top-quartile andbottom-quartile establishments localisation suggests that there is an autonomous tendency in some indus-tries for small establishments to cluster.
28
Holmes and Stevens (2002) for the US.24
Accounting for site size constraints
Our analysis so far has assumed that establishments, regardless of their size, face no
restrictions on their location choice. The fact that large establishments require large sites
to host them is, in practice, a binding constraint which prevents large manufacturing
establishments from locating in many areas such as the central part of most cities, etc.
These constraints may arise as a result of the workings of land markets (i.e., through
prices) or as a result of government policy (e.g., zoning). These constraints could affect
the results above and limit the opportunities for large establishments to cluster. More
generally, the overall location patterns of industries could be affected by the availability
of sites for their larger establishments.25
To investigate this issue in greater depth, we assess whether site size constraints affect
the observed clustering of industries. To do this we compare results for the clustering of
industries ignoring such constraints (taken from Duranton and Overman, 2005) to new
results that do impose a form of site size constraint. For the unconstrained results we
computed the distribution of distances between all establishments in a particular industry
and compared it to counterfactuals obtained by reallocating establishments across all UK
manufacturing sites. For the constrained results, establishments are also reallocated ran-
domly across UK manufacturing sites but we only allow establishments to be reallocated
to a site actually occupied by an establishment in the same employment size class. We use
five size classes: 1− 4, 5− 19, 20− 49, 50− 249, and more than 250 employees.
For the unconstrained results, Duranton and Overman (2005) reported that 122 indus-
tries out of 234 (or 52%) were localised while 57 (or 24%) were dispersed. When consid-
ering the site size constraint above, we find that 120 industries out of 234 (or 51%) are
localised whereas 54 (or 23%) are dispersed. Hence site size constraints do not appear to
24It is however beyond the scope of this paper to compare the methodology of Holmes and Stevens (2002)(itself inspired by Ellison and Glaeser, 1997) and ours. In Duranton and Overman (2005), we compare resultswith those obtained using the Ellison-Glaeser index.
25We are grateful to Will Strange for raising this issue with us.
29
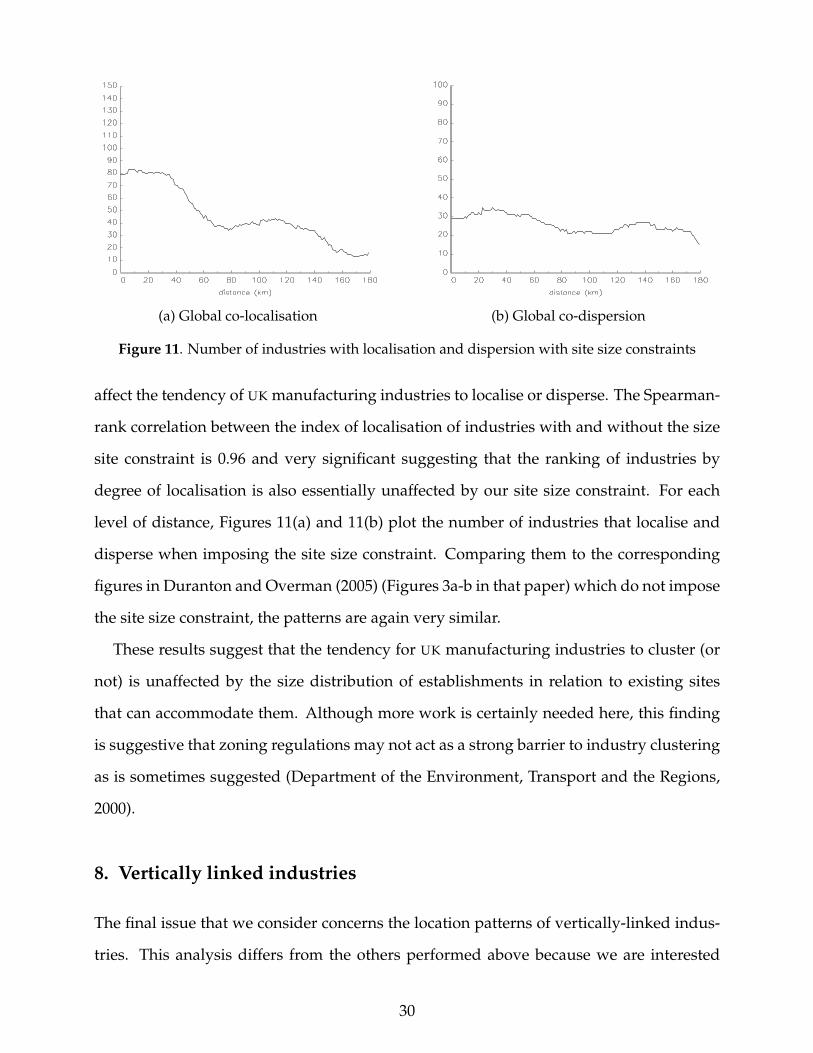
(a) Global co-localisation (b) Global co-dispersion
Figure 11. Number of industries with localisation and dispersion with site size constraints
affect the tendency of UK manufacturing industries to localise or disperse. The Spearman-
rank correlation between the index of localisation of industries with and without the size
site constraint is 0.96 and very significant suggesting that the ranking of industries by
degree of localisation is also essentially unaffected by our site size constraint. For each
level of distance, Figures 11(a) and 11(b) plot the number of industries that localise and
disperse when imposing the site size constraint. Comparing them to the corresponding
figures in Duranton and Overman (2005) (Figures 3a-b in that paper) which do not impose
the site size constraint, the patterns are again very similar.
These results suggest that the tendency for UK manufacturing industries to cluster (or
not) is unaffected by the size distribution of establishments in relation to existing sites
that can accommodate them. Although more work is certainly needed here, this finding
is suggestive that zoning regulations may not act as a strong barrier to industry clustering
as is sometimes suggested (Department of the Environment, Transport and the Regions,
2000).
8. Vertically linked industries
The final issue that we consider concerns the location patterns of vertically-linked indus-
tries. This analysis differs from the others performed above because we are interested
30
in the location patterns of two industries rather than those of a particular sub-group
within one industry. Following Duranton and Overman (2005) we distinguish between
joint-localisation and co-localisation.26 Joint-localisation refers to a situation where two in-
dustries whose establishments locate independently happen to end up close to each other.
This can occur for two reasons. First, it may be that the two industries are clustered and
their clusters happen to be located ‘close’ to each other.27 Alternatively, the two industries
may be attracted by locations with similar characteristics following, for instance, some
localised natural advantage. In contrast, co-location occurs when establishments in an
industry deliberately decide to locate close to establishments in related industries. Thus,
in the particular case we consider here, co-location occurs if the location patterns of one
industry’s establishments directly depends on those of another set of establishments in
a industry with which it has strong vertical linkages (and vice-versa). This distinction
is important because with joint-localisation the proximity of two industries is fortuitous
whereas co-localisation is the outcome of interactions between the location decisions of
establishments in different industries.28
In the context of vertically-linked industries, it is tempting to use equation (2) to
test whether pairs of establishments across the two industries are closer than randomly
chosen pairs of establishments in manufacturing. This test, however, would be of limited
interest since it cannot identify co-localisation separately from joint-localisation. To repeat,
this is because both co-localisation and joint-localisation entail some proximity between
establishments in vertically-linked industries. Instead, we adapt (2) to assess whether
establishments in a given industry are closer to those in a vertically-linked industry than
other establishments in their own industry. Put differently, we computed the distribution
of bilateral distances between establishments in vertically-linked industries and compared
it to counterfactuals generated by randomly reallocating industry labels across the sites
26Duranton and Overman (2005) apply this distinction to look at the co-localisation of four-digit industriesthat are part of the same three-digit industry.
27Of course proximity between clusters may or may not be a random outcome. Our methodology has notbeen extended to deal with this type of issue though we suspect it could be so extended.
28To our knowledge, this fundamental distinction is ignored in the rest of the literature concerned withthese issues (e.g., Ellison and Glaeser, 1997; Barrios, Bertinelli, and Strobl, 2006).
31
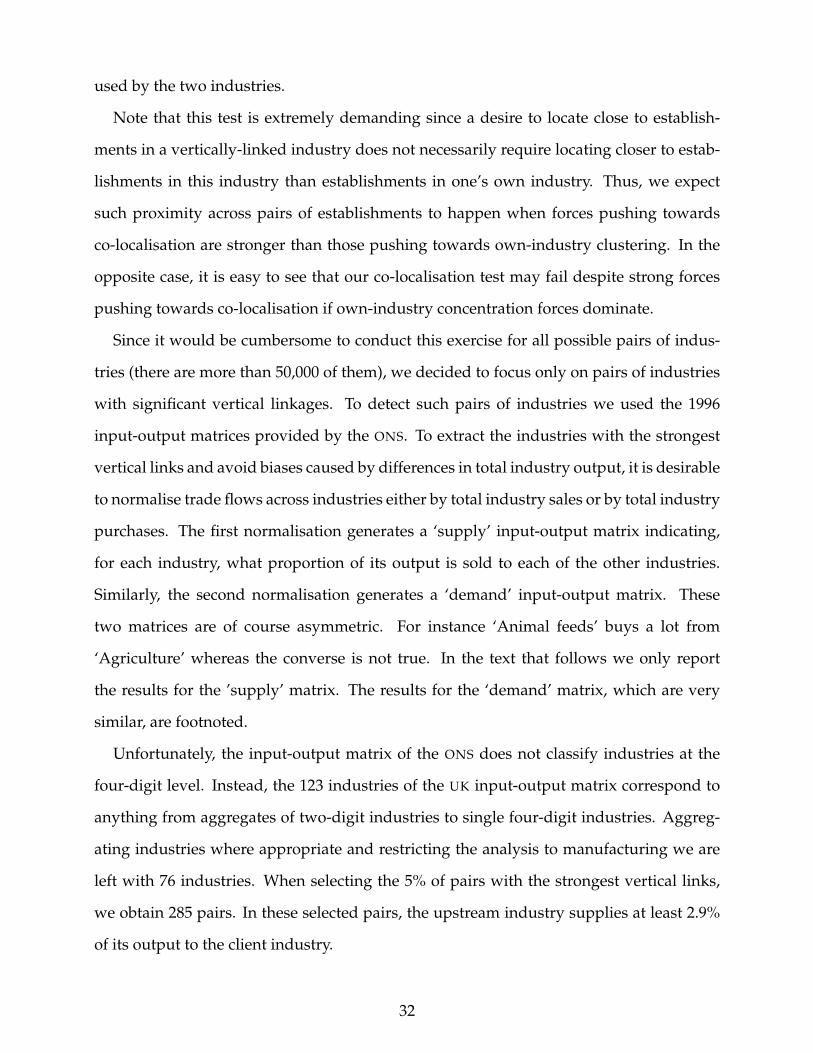
used by the two industries.
Note that this test is extremely demanding since a desire to locate close to establish-
ments in a vertically-linked industry does not necessarily require locating closer to estab-
lishments in this industry than establishments in one’s own industry. Thus, we expect
such proximity across pairs of establishments to happen when forces pushing towards
co-localisation are stronger than those pushing towards own-industry clustering. In the
opposite case, it is easy to see that our co-localisation test may fail despite strong forces
pushing towards co-localisation if own-industry concentration forces dominate.
Since it would be cumbersome to conduct this exercise for all possible pairs of indus-
tries (there are more than 50,000 of them), we decided to focus only on pairs of industries
with significant vertical linkages. To detect such pairs of industries we used the 1996
input-output matrices provided by the ONS. To extract the industries with the strongest
vertical links and avoid biases caused by differences in total industry output, it is desirable
to normalise trade flows across industries either by total industry sales or by total industry
purchases. The first normalisation generates a ‘supply’ input-output matrix indicating,
for each industry, what proportion of its output is sold to each of the other industries.
Similarly, the second normalisation generates a ‘demand’ input-output matrix. These
two matrices are of course asymmetric. For instance ‘Animal feeds’ buys a lot from
‘Agriculture’ whereas the converse is not true. In the text that follows we only report
the results for the ’supply’ matrix. The results for the ‘demand’ matrix, which are very
similar, are footnoted.
Unfortunately, the input-output matrix of the ONS does not classify industries at the
four-digit level. Instead, the 123 industries of the UK input-output matrix correspond to
anything from aggregates of two-digit industries to single four-digit industries. Aggreg-
ating industries where appropriate and restricting the analysis to manufacturing we are
left with 76 industries. When selecting the 5% of pairs with the strongest vertical links,
we obtain 285 pairs. In these selected pairs, the upstream industry supplies at least 2.9%
of its output to the client industry.
32
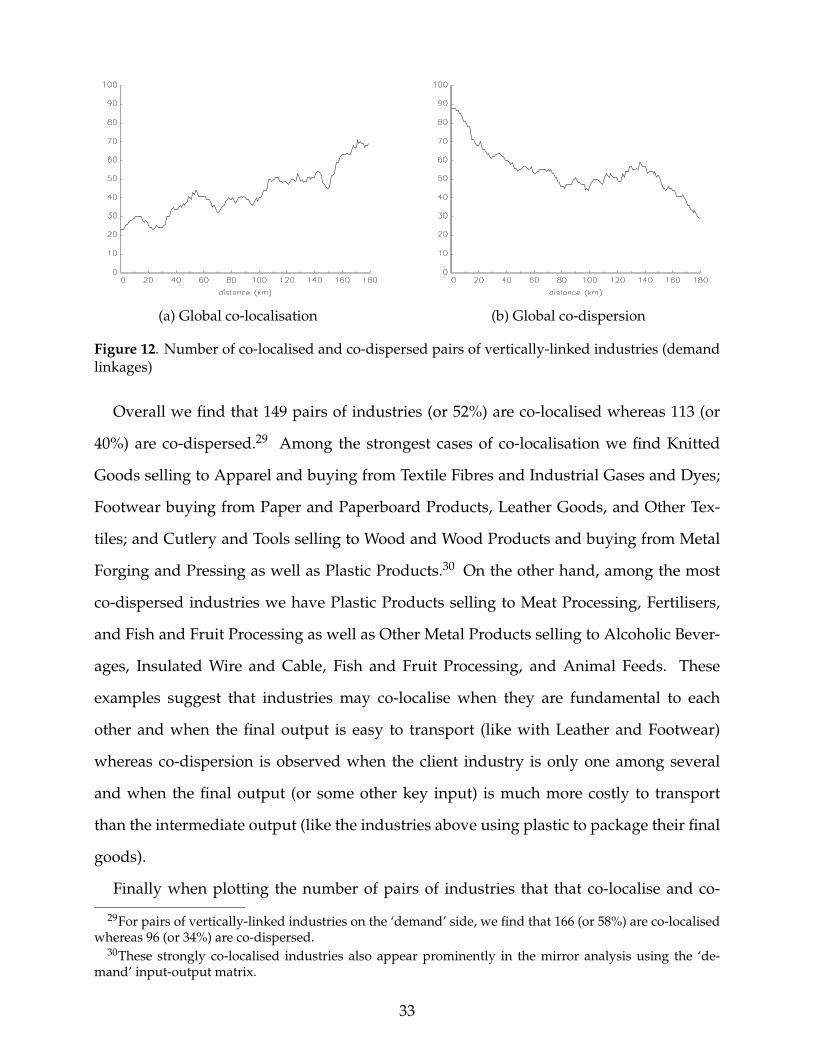
(a) Global co-localisation (b) Global co-dispersion
Figure 12. Number of co-localised and co-dispersed pairs of vertically-linked industries (demandlinkages)
Overall we find that 149 pairs of industries (or 52%) are co-localised whereas 113 (or
40%) are co-dispersed.29 Among the strongest cases of co-localisation we find Knitted
Goods selling to Apparel and buying from Textile Fibres and Industrial Gases and Dyes;
Footwear buying from Paper and Paperboard Products, Leather Goods, and Other Tex-
tiles; and Cutlery and Tools selling to Wood and Wood Products and buying from Metal
Forging and Pressing as well as Plastic Products.30 On the other hand, among the most
co-dispersed industries we have Plastic Products selling to Meat Processing, Fertilisers,
and Fish and Fruit Processing as well as Other Metal Products selling to Alcoholic Bever-
ages, Insulated Wire and Cable, Fish and Fruit Processing, and Animal Feeds. These
examples suggest that industries may co-localise when they are fundamental to each
other and when the final output is easy to transport (like with Leather and Footwear)
whereas co-dispersion is observed when the client industry is only one among several
and when the final output (or some other key input) is much more costly to transport
than the intermediate output (like the industries above using plastic to package their final
goods).
Finally when plotting the number of pairs of industries that that co-localise and co-
29For pairs of vertically-linked industries on the ‘demand’ side, we find that 166 (or 58%) are co-localisedwhereas 96 (or 34%) are co-dispersed.
30These strongly co-localised industries also appear prominently in the mirror analysis using the ‘de-mand’ input-output matrix.
33
disperse in Figures 12(a) and 12(b) some interesting patterns emerge. Starting with
Figure 12(b), it is interesting to note that the cases of co-dispersion decline when larger
distances are considered. Recall that these are situations for which establishments are
closer to other establishments in the same industry than establishments in the companion
vertically-linked industry. Since industry localisation is observed at distances below 60
km (Duranton and Overman, 2005), this graph may not be very surprising and is likely
to reflect the tendency of industries to localise at small spatial scales. Put differently,
co-dispersion between industries at small spatial scales may be the counterpart of industry
localisation. The first part of the graph on the left (in Figure 12a) is more interesting since
it shows that co-localisation tends to become more important at larger spatial scales, i.e.,
at the regional level.
This result is certainly consistent with many of the modelling assumptions of the ‘New
Economic Geography’ (e.g., Krugman, 1991; Krugman and Venables, 1995) which insist
on the importance of pecuniary externalities and trade costs between vertically-linked
industries leading to the broad concentration of manufacturing at pretty large spatial
scales. In this respect, the upstream and downstream linkages for Cutlery and Tools
documented above make it easy to understand how a number of steel-related industries
have come to agglomerate in Northern England.31
9. Conclusions
In this paper we extend the point pattern methodology of Duranton and Overman (2005)
to explore detailed patterns of manufacturing locations. This leads to a rich harvest
of facts. In summary, we find that entrants and exiters mostly follow their industry
location pattern. There is, however, some mild evidence of location mobility that can
be traced through location differences between entrants, exiters, and continuing firms.
With affiliated establishment we find strong evidence that establishments part of the same
31Duranton and Overman (2005) also document a tendency for four-digit industries part of the sameindustrial branch to have similar patterns of localisation.
34

firm locate together. Otherwise, there are no major differences between affiliated and
non-affiliated plants. In the same vein, foreign-owned plants do not appear to locate
differently from domestic plants. In contrast, when cutting the data by plant size we find
quite a lot of action. Large plants appear to drive clustering in many industries though
sometimes so too do small plants. Finally there is good evidence of co-localisation of
vertically-linked industries at the regional scale.
Some of these stylised facts confirm previous findings (e.g., the role of large plants in
clustering). Others appear to run against established, but hitherto untested, wisdom (e.g.,
the absence of major differences between foreign-owned and domestic plants). Finally
some are entirely new (e.g., the regional co-localisation of vertically-linked industries).
Some of the evidence presented here, particularly the results by plant size and the patterns
of entry and exit also hint at interesting industry dynamics (with the reproduction of
existing patterns through spin-offs and/or the emergence of new clusters).
To go further on these conjectures, purely descriptive evidence may no longer suffice.
Instead, precise theoretical hypotheses will need to be articulated. Hopefully further
developments of our empirical approach should allow one to test them.
35
References
Barrios, Salvador, Luisito Bertinelli, and Eric Strobl. 2006. Coagglomeration andspillovers. Regional Science and Urban Economics (forthcoming).
Combes, Pierre-Philippe and Miren Lafourcade. 2005. Transport costs: Measures, de-terminants, and regional policy implications for France. Journal of Economic Geography(forthcoming).
Cressie, Noel A. C. 1993. Statistics for Spatial Data. New York: John Wiley.
Crozet, Matthieu, Thierry Mayer, and Jean-Louis Mucchielli. 2004. How do firms ag-glomerate? a study of fdi in france. Regional Science and Urban Economics 34(1):27–54.Available at http://ideas.repec.org/a/eee/regeco/v34y2004i1p27-54.html.
Davison, Anthony C. and David V. Hinkley. 1997. Bootstrap Methods and their Application.Cambridge: Cambridge University Press.
Department of the Environment, Transport and the Regions. 2000. Planning for Clusters: AResearch Report. London: DETR.
Devereux, Michael P., Rachel Griffith, and Helen Simpson. 2004a. The geographic distribu-tion of production activity in the UK. Regional Science and Urban Economics 35(5):533–564.
Devereux, Michael P., Rachel Griffith, and Helen Simpson. 2004b. Agglomeration, regionalgrants and firm location. Working Paper 04/06, Institute for Fiscal Studies.
Diggle, Peter J. 2003. Statistical Analysis of Spatial Point Patterns. New York: OxfordUniversity Press.
Dumais, Guy, Glenn Ellison, and Edward L. Glaeser. 2002. Geographic concentration as adynamic process. Review of Economics and Statistics 84(2):193–204.
Duranton, Gilles and Henry G. Overman. 2005. Testing for localization using micro-geographic data. Review of Economic Studies 72(4):1077–1106.
Duranton, Gilles and Diego Puga. 2004. Micro-foundations of urban agglomeration eco-nomies. In Vernon Henderson and Jacques-François Thisse (eds.) Handbook of Regionaland Urban Economics, volume 4. Amsterdam: North-Holland, 2063–2117.
Efron, Bradley and Robert J. Tibshirani. 1993. An Introduction to the Bootstrap. New York:Chapman and Hall.
Ellison, Glenn and Edward L. Glaeser. 1997. Geographic concentration in US manufactur-ing industries: A dartboard approach. Journal of Political Economy 105(5):889–927.
Griffith, Rachel. 1999. Using the ARD establishment level data: an application to estimat-ing production functions. Economic Journal 109(456):F416–F442.
Holmes, Thomas J. and John J. Stevens. 2002. Geographic concentration and establishmentscale. Review of Economics and Statistics 84(4):682–690.
36
Krugman, Paul R. 1991. Geography and Trade. Cambridge, MA: MIT Press.
Krugman, Paul R. and Anthony J. Venables. 1995. Globalization and the inequality ofnations. Quarterly Journal of Economics 110(4):857–880.
Marshall, Alfred. 1890. Principles of Economics. London: Macmillan.
Maurel, Françoise and Béatrice Sédillot. 1999. A measure of the geographic concentrationof french manufacturing industries. Regional Science and Urban Economics 29(5):575–604.
Mori, Tomoya, Koji Nishikimi, and Tony E. Smith. 2005. A divergent statistic for industriallocalization. Review of Economics and Statistics 87(4):635–651.
Quah, Danny and Helen Simpson. 2003. Spatial cluster empirics. Work in progress,London School of Economics.
Quah, Danny T. 1997. Empirics for growth and distribution: Stratification, polarization,and convergence clubs. Journal of Economic Growth 2(1):27–59.
Raper, Jonathan F., David W. Rhind, and John W. Shepherd. 1992. Postcodes : The NewGeography. Harlow, Essex: Longman Scientific and Technical.
Shatz, Howard J. and Anthony J. Venables. 2000. The geography of international invest-ment. In Gordon L. Clark, Maryann P. Feldman, and Meric S. Gertler (eds.) The OxfordHandbook of Economic Geography. New York: Oxford University Press.
Silverman, Bernard W. 1986. Density Estimation for Statistics and Data Analysis. New York:Chapman and Hall.
37