Embed Size (px)
Citation preview
Exporters’ Association Of
Sri Lanka
Annual Report &
Accounts
2018-2019
EASL Annual Report 2018/2019 Page 1
OFFICE BEARERS 2018/ 2019
CHAIRMAN Mr. Harin De Silva Eastern Merchants Plc
1st VICE CHAIRMAN Mr. Chrisso De Mel Hayleys Plc
2nd VICE CHAIRMAN Mr. Imdadh Marikar
Expolanka (Pvt) Ltd
SECRETARIAT THE CEYLON CHAMBER OF COMMERCE
50, Nawam Mawatha, Colombo 2
TEL : +94 11 5588871
FAX : +94 11 2449352
EMAIL : [email protected]
WEBSITE : www.exporterssrilanka.net
EASL Annual Report 2018/2019 Page 2
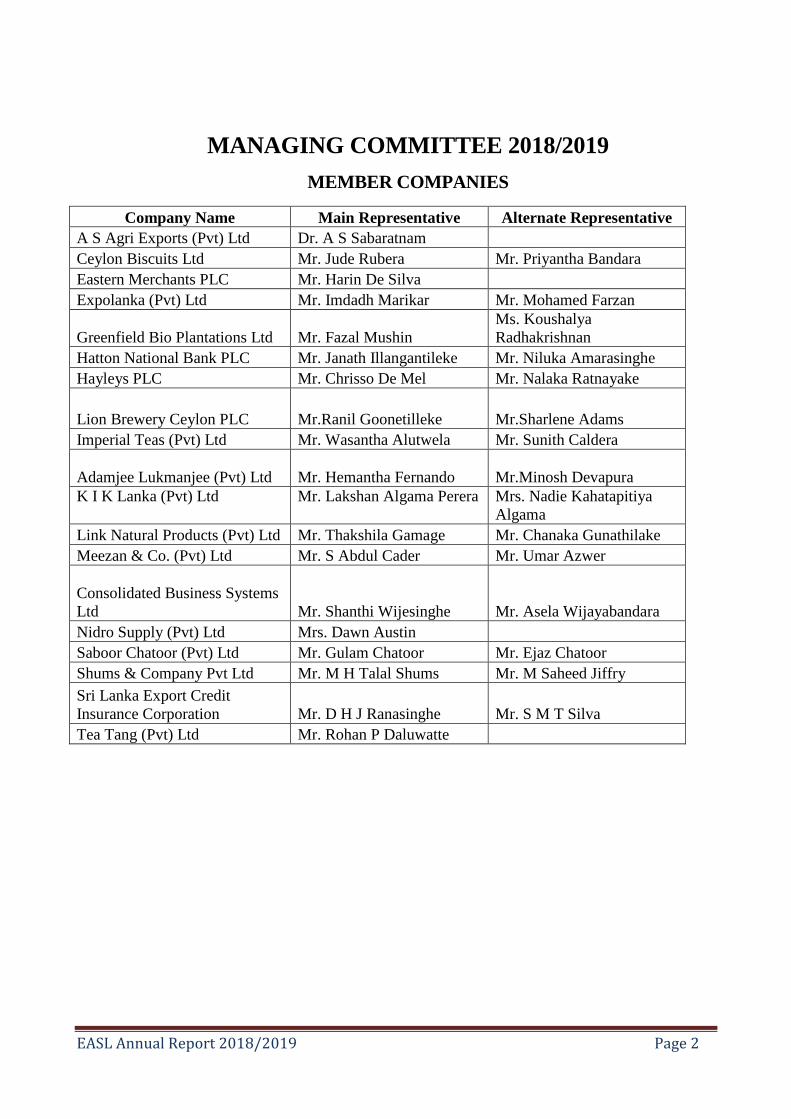
MANAGING COMMITTEE 2018/2019
MEMBER COMPANIES
Company Name Main Representative Alternate Representative
A S Agri Exports (Pvt) Ltd Dr. A S Sabaratnam
Ceylon Biscuits Ltd Mr. Jude Rubera Mr. Priyantha Bandara
Eastern Merchants PLC Mr. Harin De Silva
Expolanka (Pvt) Ltd Mr. Imdadh Marikar Mr. Mohamed Farzan
Greenfield Bio Plantations Ltd Mr. Fazal Mushin
Ms. Koushalya
Radhakrishnan
Hatton National Bank PLC Mr. Janath Illangantileke Mr. Niluka Amarasinghe
Hayleys PLC Mr. Chrisso De Mel Mr. Nalaka Ratnayake
Lion Brewery Ceylon PLC Mr.Ranil Goonetilleke Mr.Sharlene Adams
Imperial Teas (Pvt) Ltd Mr. Wasantha Alutwela Mr. Sunith Caldera
Adamjee Lukmanjee (Pvt) Ltd
Mr. Hemantha Fernando
Mr.Minosh Devapura
K I K Lanka (Pvt) Ltd
Mr. Lakshan Algama Perera
Mrs. Nadie Kahatapitiya
Algama
Link Natural Products (Pvt) Ltd Mr. Thakshila Gamage Mr. Chanaka Gunathilake
Meezan & Co. (Pvt) Ltd Mr. S Abdul Cader Mr. Umar Azwer
Consolidated Business Systems
Ltd
Mr. Shanthi Wijesinghe Mr. Asela Wijayabandara
Nidro Supply (Pvt) Ltd Mrs. Dawn Austin
Saboor Chatoor (Pvt) Ltd Mr. Gulam Chatoor Mr. Ejaz Chatoor
Shums & Company Pvt Ltd Mr. M H Talal Shums Mr. M Saheed Jiffry
Sri Lanka Export Credit
Insurance Corporation Mr. D H J Ranasinghe Mr. S M T Silva
Tea Tang (Pvt) Ltd Mr. Rohan P Daluwatte
EASL Annual Report 2018/2019 Page 3
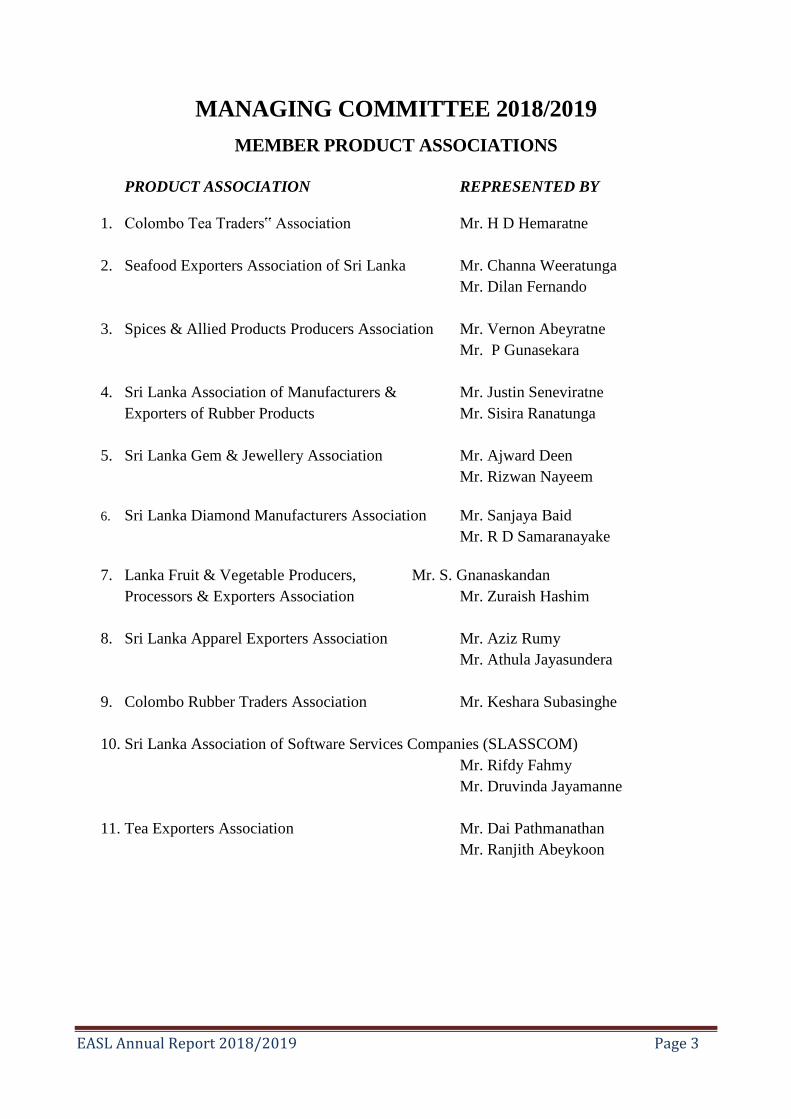
MANAGING COMMITTEE 2018/2019
MEMBER PRODUCT ASSOCIATIONS
PRODUCT ASSOCIATION REPRESENTED BY
1. Colombo Tea Traders‟ Association Mr. H D Hemaratne
2. Seafood Exporters Association of Sri Lanka Mr. Channa Weeratunga
Mr. Dilan Fernando
3. Spices & Allied Products Producers Association Mr. Vernon Abeyratne
Mr. P Gunasekara
4. Sri Lanka Association of Manufacturers & Mr. Justin Seneviratne
Exporters of Rubber Products Mr. Sisira Ranatunga
5. Sri Lanka Gem & Jewellery Association Mr. Ajward Deen
Mr. Rizwan Nayeem
6. Sri Lanka Diamond Manufacturers Association Mr. Sanjaya Baid
Mr. R D Samaranayake
7. Lanka Fruit & Vegetable Producers, Mr. S. Gnanaskandan
Processors & Exporters Association Mr. Zuraish Hashim
8. Sri Lanka Apparel Exporters Association Mr. Aziz Rumy
Mr. Athula Jayasundera
9. Colombo Rubber Traders Association Mr. Keshara Subasinghe
10. Sri Lanka Association of Software Services Companies (SLASSCOM)
Mr. Rifdy Fahmy
Mr. Druvinda Jayamanne
11. Tea Exporters Association Mr. Dai Pathmanathan
Mr. Ranjith Abeykoon
EASL Annual Report 2018/2019 Page 4
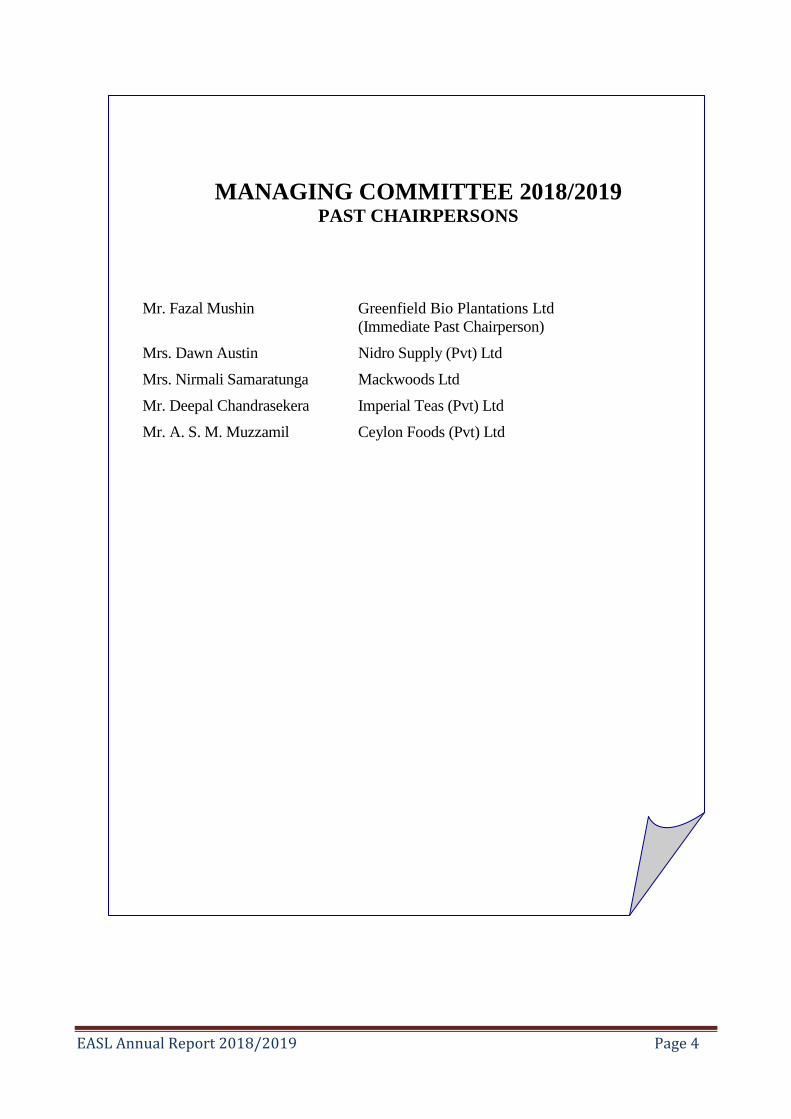
MANAGING COMMITTEE 2018/2019
PAST CHAIRPERSONS
Mr. Fazal Mushin Greenfield Bio Plantations Ltd
(Immediate Past Chairperson)
Mrs. Dawn Austin Nidro Supply (Pvt) Ltd
Mrs. Nirmali Samaratunga Mackwoods Ltd
Mr. Deepal Chandrasekera Imperial Teas (Pvt) Ltd
Mr. A. S. M. Muzzamil Ceylon Foods (Pvt) Ltd
EASL Annual Report 2018/2019 Page 5
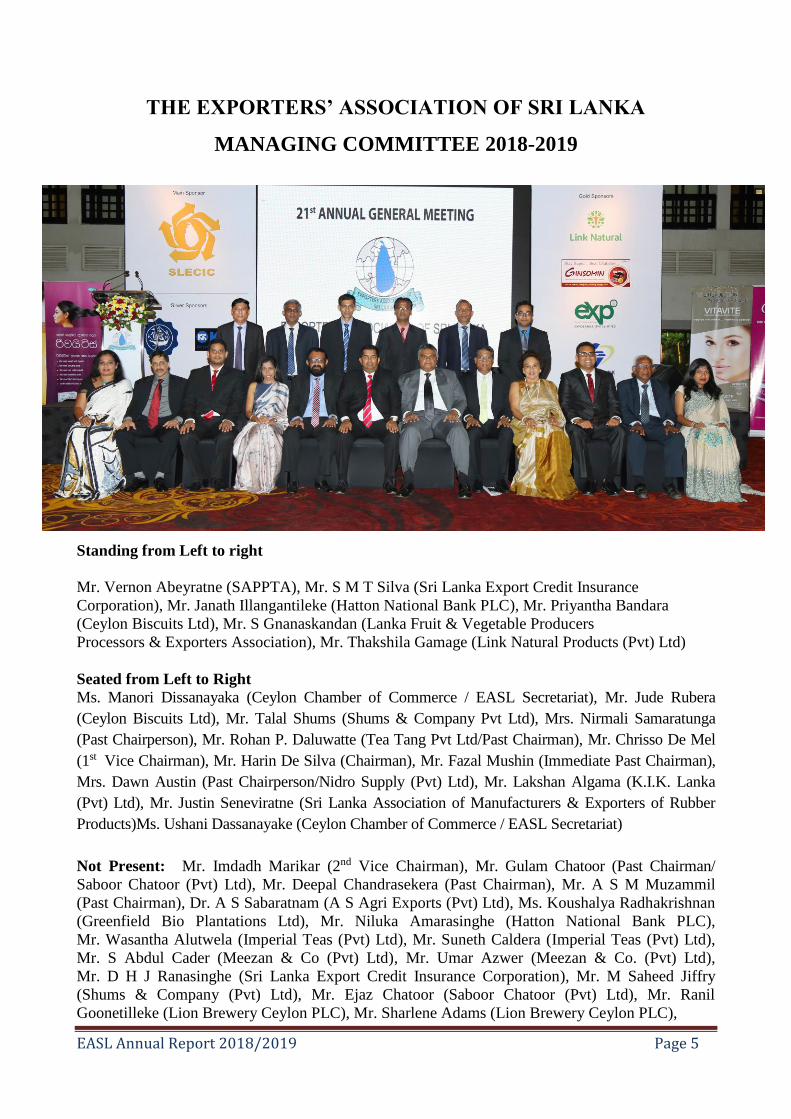
THE EXPORTERS’ ASSOCIATION OF SRI LANKA
MANAGING COMMITTEE 2018-2019
Standing from Left to right
Mr. Vernon Abeyratne (SAPPTA), Mr. S M T Silva (Sri Lanka Export Credit Insurance
Corporation), Mr. Janath Illangantileke (Hatton National Bank PLC), Mr. Priyantha Bandara
(Ceylon Biscuits Ltd), Mr. S Gnanaskandan (Lanka Fruit & Vegetable Producers
Processors & Exporters Association), Mr. Thakshila Gamage (Link Natural Products (Pvt) Ltd)
Seated from Left to Right
Ms. Manori Dissanayaka (Ceylon Chamber of Commerce / EASL Secretariat), Mr. Jude Rubera
(Ceylon Biscuits Ltd), Mr. Talal Shums (Shums & Company Pvt Ltd), Mrs. Nirmali Samaratunga
(Past Chairperson), Mr. Rohan P. Daluwatte (Tea Tang Pvt Ltd/Past Chairman), Mr. Chrisso De Mel
(1st Vice Chairman), Mr. Harin De Silva (Chairman), Mr. Fazal Mushin (Immediate Past Chairman),
Mrs. Dawn Austin (Past Chairperson/Nidro Supply (Pvt) Ltd), Mr. Lakshan Algama (K.I.K. Lanka
(Pvt) Ltd), Mr. Justin Seneviratne (Sri Lanka Association of Manufacturers & Exporters of Rubber
Products)Ms. Ushani Dassanayake (Ceylon Chamber of Commerce / EASL Secretariat)
Not Present: Mr. Imdadh Marikar (2nd Vice Chairman), Mr. Gulam Chatoor (Past Chairman/
Saboor Chatoor (Pvt) Ltd), Mr. Deepal Chandrasekera (Past Chairman), Mr. A S M Muzammil
(Past Chairman), Dr. A S Sabaratnam (A S Agri Exports (Pvt) Ltd), Ms. Koushalya Radhakrishnan
(Greenfield Bio Plantations Ltd), Mr. Niluka Amarasinghe (Hatton National Bank PLC),
Mr. Wasantha Alutwela (Imperial Teas (Pvt) Ltd), Mr. Suneth Caldera (Imperial Teas (Pvt) Ltd),
Mr. S Abdul Cader (Meezan & Co (Pvt) Ltd), Mr. Umar Azwer (Meezan & Co. (Pvt) Ltd),
Mr. D H J Ranasinghe (Sri Lanka Export Credit Insurance Corporation), Mr. M Saheed Jiffry
(Shums & Company (Pvt) Ltd), Mr. Ejaz Chatoor (Saboor Chatoor (Pvt) Ltd), Mr. Ranil
Goonetilleke (Lion Brewery Ceylon PLC), Mr. Sharlene Adams (Lion Brewery Ceylon PLC),

EASL Annual Report 2018/2019 Page 6
Mr. Hemantha Fernando (Adamjee Lukmanjee (Pvt) Ltd), Mr. Minosh Devapura (Adamjee
Lukmanjee (Pvt) Ltd), Mr. Shanthi Wijesinghe (Consolidated Business Systems Ltd) , Mr. Asela
Wijayabandara (Consolidated Business Systems Ltd) , Mr. Aziz Rumy (Sri Lanka Apparel
Exporters’ Association), Mr. Keshara Subasinghe (Colombo Rubber Traders’ Association), Mr. H
D Hemaratne (Colombo Tea Traders’ Association), Mr. Ajward Deen (Sri Lanka Gem & Jewellery
Association),Mr. Rizwan Nayeem , (Sri Lanka Gem & Jewellery Association) Mr. Channa
Weeratunga (Seafood Exporters’ Association of Sri Lanka), Mr. Rifdy Fahmy (Sri Lanka
Association of Software Services Companies (SLASSCOM), Mr. Sanjaya Baid (Sri Lanka
Diamond Manufacturers Association), Mr. Dai Pathmanathan (Tea Exporters Association) , Mr.
Ranjith Abeykoon (Tea Exporters Association)
Highlights of Post Business Session
Chief Guest: Chairman, The Ceylon Chamber of Commerce
Mr. Rajendra Theagarajah
Participants
Handing over the National Export Development Strategy (NEDVS 3)
Document to the Chief Guest
EASL Annual Report 2018/2019 Page 7
LIST OF MEMBER COMPANIES AS
AT 31ST MARCH 2018
A
A BAUR & COMPANY (PRIVATE) LIMITED
A F JONES (EXPORTERS) CEYLON LTD
A S AGRI EXPORTS (PVT) LTD
ADAMEXPO
AGSTAR EXPORTS (PVT) LTD
AITKEN SPENCE EXPORTS LTD
AKBAR BROTHERS (PVT) LTD
ANSELL LANKA (PVT) LTD
B
BANK OF CEYLON
BEIRA BRUSH LTD
BOGALA GRAPHITE LANKA PLC
C CEYLON BISCUITS LTD
CEYLON TEA MARKETING (PVT) LTD
CHAS P. HAYLEY & CO. LTD
CHEMANEX PLC
CIC HOLDINGS PLC
COCOTANA COCONUT PRODUCTS
COLOMBO RUBBER TRADERS' ASSCOCIATION COLOMBO RUBBER TRADERS'
COLOMBO TEA TRADERS ASSOCIATION COLOMBO TEA TRADERS ASSOCIATION
CONSOLIDATED BUSINESS SYSTEMS (PVT) LTD
EASL Annual Report 2018/2019 Page 8
D
DANKOTUWA PORCELAIN PLC
DELMEGE FORSYTH & CO. LTD
DIPPED PRODUCTS PLC
E
E B CREASY & CO. PLC
EASTERN MERCHANTS PLC
EDINBOROUGH PRODUCTS (PVT) LTD
ESWARAN BROTHERS EXPORTS (PVT) LTD
EURO-SCAN EXPORTS (PVT) LTD
EXPACK CORRUGATED CARTON (PVT) LTD
EXPOLANKA (PVT) LIMITED
EXPOLANKA FREIGHT (PVT) LTD
EXPORTERS ASSOCIATION OF COCONUT BASED SUBSTRATES
F FINLAYS COLOMBO PLC
G
GEORGE STEUART & CO. LTD
GLOBAL RUBBER INDUSTRIES PVT LTD
GORDON FRAZER & CO LTD
GREENFIELD BIO PLANTATIONS (PVT) LTD
EASL Annual Report 2018/2019 Page 9
H HAMEED BROTHERS COLOMBO (PVT) LTD
HARRISONS (COLOMBO) LTD
HATTON NATIONAL BANK PLC
HAYLEYS PLC
HELA CLOTHING (PVT) LTD
HELLMANN WORLDWIDE LOGISTICS (PVT) LTD
HEMACHANDRAS (KANDY) LTD
HIRDARAMANI INTERNATIONAL EXPORTS (PVT) LTD
I
IMPERIAL TEAS (PVT) LTD
INDUSTRIAL CLOTHINGS LTD
ISHANA SPICE EXPORTS
J
JAFFERJEE BROTHERS
JIFFY PRODUCTS S.L. (PVT) LTD
K K. I. K . LANKA (PVT) LTD
EASL Annual Report 2018/2019 Page 10
L LANKA BRUSH EXPORTS (PVT) LTD.
LANKA WALLTILES PLC
LANKEM CEYLON PLC
LINEA AQUA (PVT) LTD
LINK NATURAL PRODUCTS (PRIVATE) LTD
LION BREWERY (CEYLON) PLC
M
MABROC TEAS (PVT) LTD
MASCONS (PVT) LIMITED
MEEZAN & CO (PVT) LTD
MIAMI EXPORTS (PVT) LTD
MICROCELLS (PRIVATE) LTD
MONA PLASTICS (PVT) LTD
MORISON PLC J L
N NATIONS TRUST BANK PLC
NIDRO SUPPLY (PVT) LTD
EASL Annual Report 2018/2019 Page 11
P PATTAKANNUS (PVT) LTD
PREMIER NATURAL TEAS (PVT) LTD
PRINTCARE PLC
R
RANFER TEAS (PVT) LTD
RENUKA HOLDINGS PLC
RICHARD PEIRIS NATURAL FOAMS LTD
RILEYS (PVT) LTD
S
SABOOR CHATOOR (PRIVATE) LTD
SAMPATH BANK PLC
SEAFOOD EXPORTERS ASSC OF SRI LANKA
SHUMS & CO. LTD
SL ASSO.OF MANUFACTURURES & EXP OF RUBB PRDS SL ASSO.O
SL FRUITS & VEG. PRODS, PROCS, & EXP AS. SLFRUITS & VEGPRODSPROCS
SMITHKLINE BEECHAM (PVT) LTD
SPICE & ALLIED PRODUCTS, PRODUCERS' ASSC SPICE & ALLIED PRODUCTS,
SRI LANKA APPAREL EXPORTERS ASSOCIATION
SRI LANKA ASSOCIATION OF SOFTWARE AND SERVICE COMP
SRI LANKA DIAMOND MANUFACTURERS' ASSOCIATION
SRI LANKA EXPORT CREDIT INSURANCE CORPORATION
SRI LANKA GEM & JEWELLERY ASSOCIATION SL
STASSEN EXPORTS (PVT) LTD
EASL Annual Report 2018/2019 Page 12
T
TEA EXPORTERS ASSOCIATION OF SRI LANKA
TEA TANG (PVT) LTD
THE SWADESHI INDUSTRIAL WORKS PLC
TRELLEBORG LANKA (PVT) LTD
U
UNION COMMODITIES (PVT) LTD
V
VAN REES CEYLON LTD
EASL Annual Report 2018/2019 Page 13
LIST OF MEMBER PRODUCT ASSOCIATIONS AS AT 31ST MARCH 2018
1. Sri Lanka Fruit & Vegetable Producers, Processors & Exporters Association
2. Sri Lanka Apparel Exporters Association
3. Colombo Rubber Traders’ Association
4. Spices & Allied Products Producers Association
5. Colombo Tea Traders’ Association
6. Sri Lanka Association of Manufacturers & Exporters of Rubber Products
7. Sri Lanka Gem & Jewellery Association
8. Seafood Exporters Association of Sri Lanka
9. Sri Lanka Diamond Manufacturers Association
10. Sri Lanka Association of Software and Service Companies
11. Tea Exporters Association of Sri Lanka
PAST CHAIRPERSONS OF THE EXPORTERS’ ASSOCIATION OF SRI LANKA
Year
From 1993 to 1997 August - Mr Lyn Fernando
Chairman of the Export Section of the Ceylon Chamber of Commerce
- Mr. Gulam Chatoor
Chairman of the Federation of Exporters Association of Sri Lanka
August, 1997 The Export Section of the Ceylon Chamber of Commerce & the Federation of Exporters Association of Sri
Lanka merged to form EASL and the inaugural meeting of the Exporters' Association of Sri Lanka held on
August 22nd 1997, This meeting was chaired by Mr Gulam Chatoor as Chairman of Federation of
Exporters’ Association of Sri Lanka. Mr Lyn Fernando was elected as the Chairman of EASL.
Chairpersons from 1997 onwards;
1997-2000 - Mr. Lyn Fernando
2000-2003 - Mr. A S M Muzzammil
2003-2005 - Mr. Gratian Gunawardhana
2005-2007 - Mr. Mohan Mendis
2007-2008 - Mr. Deepal Chandrasekara
2008-2011 - Mrs. Nirmali Samaratunga
2011-2013 - Mrs. Dawn Austin
2013-2015 - Mr. Rohan P. Daluwatte
2015-2017 (February) - Mr. Fazal Mushin
EASL Annual Report 2018/2019 Page 14
THE EXPORTERS’ ASSOCIATION OF SRI LANKA
The formation of the Exporters Association of Sri Lanka brought a wide spectrum of exporters, under
one umbrella, and a strong platform was built to discuss and make representations on issues affecting
the Export Trade, with one voice. The Association now represents around 1000 Exporters through
direct and indirect membership, and contributes to over 80% of the total exports of the country.
History:
In 1973, Chamber Members who engaged in individual export trade initiated the formation of the
“Export Section of the Ceylon Chamber of Commerce”.
In 1987, the Export Development Board initiated the formation of the Federation of Exporters’
Associations of Sri Lanka (FEA), which was an umbrella organization of major export product specific
Associations.
It was observed that there was a duplication of activities of these individual Organizations and that
there would be more usefulness served if the two were merged to promote and protect the common
interests of Members, whilst making a significant contribution to the growth of the Export Industry of
Sri Lankan exporter.
In August 1997, Export Section of the Ceylon Chamber of Commerce (CCC) and the Federation of
Exporters’ Association (FEA) passed resolutions at specially convened General Meetings by the two
Institutions that the Institutions merge into one Association to be called the EXPORTERS
ASSOCIATION OF SRI LANKA.
The first Chairperson elected after the merger, was Mr. Lyn Fernando, with Mr. Gulam Chatoor
proposing his name from the chair. Mr. Lyn Fernando and Mr. Gulam Chatoor had both served as
Chairpersons of the Export Section of the Ceylon Chamber of Commerce and as the Chairpersons of
the FEA.
All members of both the Institutions took the membership of the EASL.
Membership The EASL now proudly represents practically the entire Export Sector of Sri Lanka through the
Membership of Companies and Exporter Associations. Eligibility to join the EASL being made up of
the following:
1. Any member of the Ceylon Chamber of Commerce engaged in or interested in export
2. Any properly constituted and functioning Association representing exporters of products and
services
3. Any individual member of such an Association referred to in (2) above
4. Any Company or Individual engaged in exports of goods and services who are registered with
Sri Lanka Export Development Board (SLEDB) or any respective Association duly constituted
and functional.
The EASL’s single platform representation structure is acknowledged by all authorities in both the
public and private sectors to be a responsible and credible voice of Exporters in Sri Lanka.
EASL Annual Report 2018/2019 Page 15
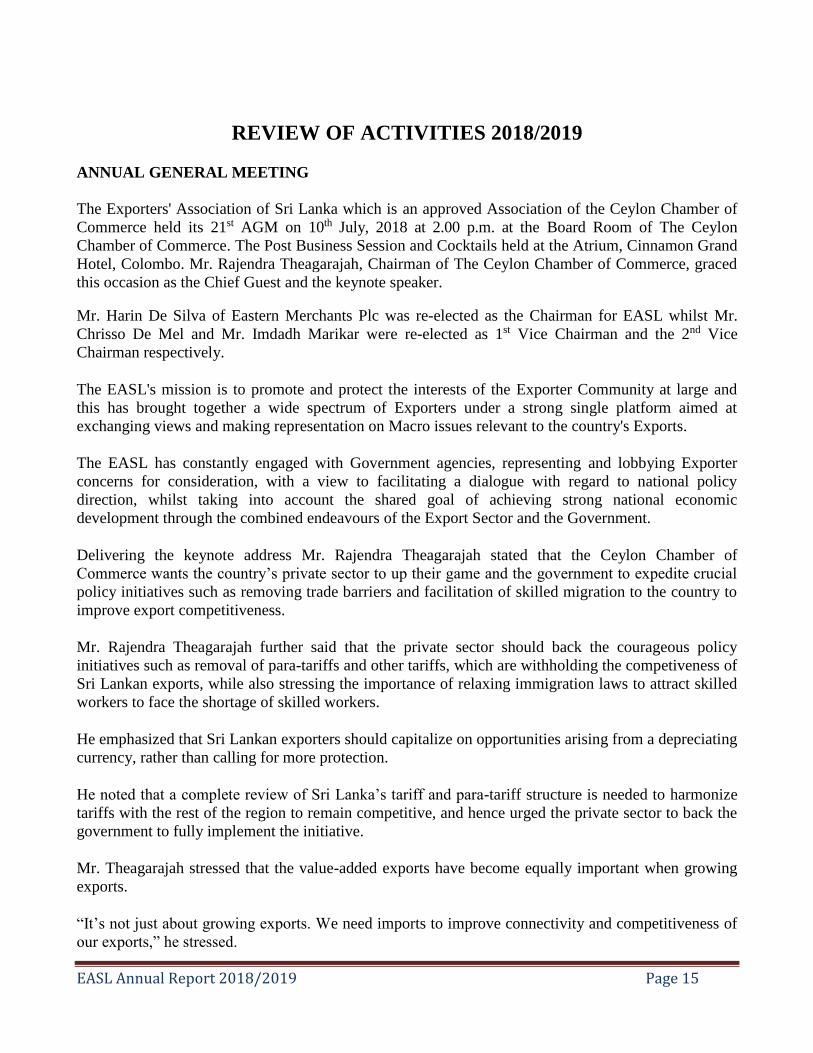
REVIEW OF ACTIVITIES 2018/2019
ANNUAL GENERAL MEETING
The Exporters' Association of Sri Lanka which is an approved Association of the Ceylon Chamber of
Commerce held its 21st AGM on 10th July, 2018 at 2.00 p.m. at the Board Room of The Ceylon
Chamber of Commerce. The Post Business Session and Cocktails held at the Atrium, Cinnamon Grand
Hotel, Colombo. Mr. Rajendra Theagarajah, Chairman of The Ceylon Chamber of Commerce, graced
this occasion as the Chief Guest and the keynote speaker.
Mr. Harin De Silva of Eastern Merchants Plc was re-elected as the Chairman for EASL whilst Mr.
Chrisso De Mel and Mr. Imdadh Marikar were re-elected as 1st Vice Chairman and the 2nd Vice
Chairman respectively.
The EASL's mission is to promote and protect the interests of the Exporter Community at large and
this has brought together a wide spectrum of Exporters under a strong single platform aimed at
exchanging views and making representation on Macro issues relevant to the country's Exports.
The EASL has constantly engaged with Government agencies, representing and lobbying Exporter
concerns for consideration, with a view to facilitating a dialogue with regard to national policy
direction, whilst taking into account the shared goal of achieving strong national economic
development through the combined endeavours of the Export Sector and the Government.
Delivering the keynote address Mr. Rajendra Theagarajah stated that the Ceylon Chamber of
Commerce wants the country’s private sector to up their game and the government to expedite crucial
policy initiatives such as removing trade barriers and facilitation of skilled migration to the country to
improve export competitiveness.
Mr. Rajendra Theagarajah further said that the private sector should back the courageous policy
initiatives such as removal of para-tariffs and other tariffs, which are withholding the competiveness of
Sri Lankan exports, while also stressing the importance of relaxing immigration laws to attract skilled
workers to face the shortage of skilled workers.
He emphasized that Sri Lankan exporters should capitalize on opportunities arising from a depreciating
currency, rather than calling for more protection.
He noted that a complete review of Sri Lanka’s tariff and para-tariff structure is needed to harmonize
tariffs with the rest of the region to remain competitive, and hence urged the private sector to back the
government to fully implement the initiative.
Mr. Theagarajah stressed that the value-added exports have become equally important when growing
exports.
“It’s not just about growing exports. We need imports to improve connectivity and competitiveness of
our exports,” he stressed.
EASL Annual Report 2018/2019 Page 16
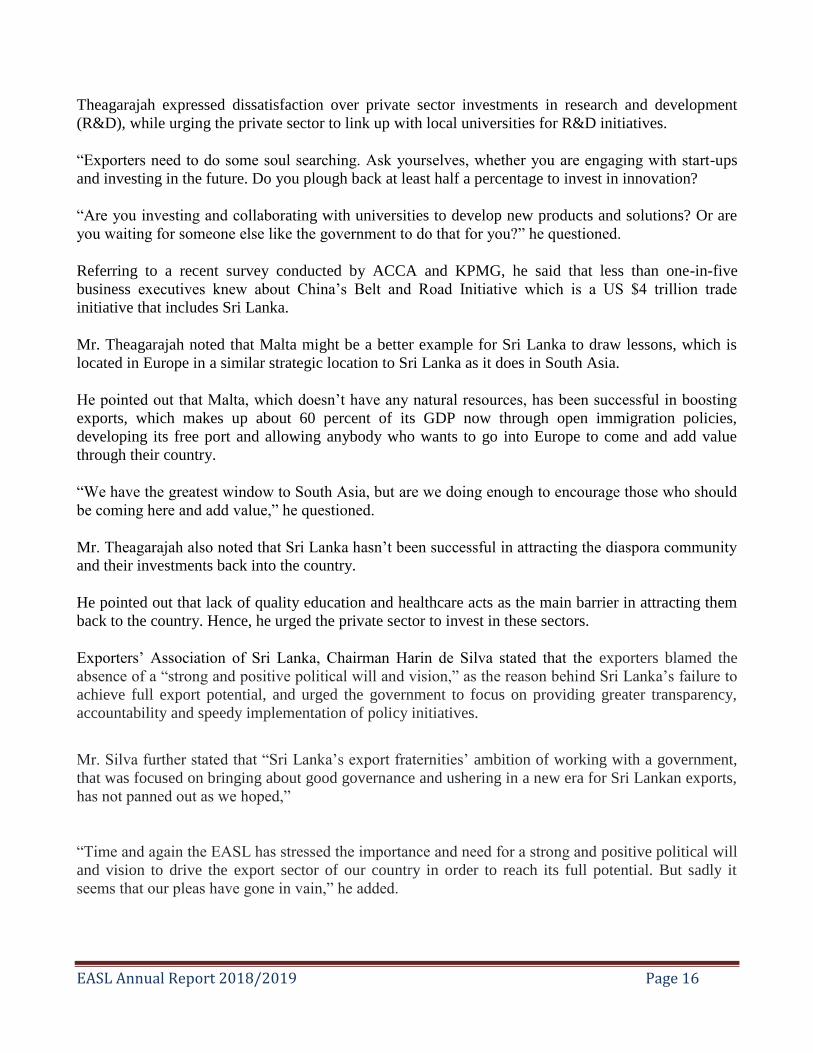
Theagarajah expressed dissatisfaction over private sector investments in research and development
(R&D), while urging the private sector to link up with local universities for R&D initiatives.
“Exporters need to do some soul searching. Ask yourselves, whether you are engaging with start-ups
and investing in the future. Do you plough back at least half a percentage to invest in innovation?
“Are you investing and collaborating with universities to develop new products and solutions? Or are
you waiting for someone else like the government to do that for you?” he questioned.
Referring to a recent survey conducted by ACCA and KPMG, he said that less than one-in-five
business executives knew about China’s Belt and Road Initiative which is a US $4 trillion trade
initiative that includes Sri Lanka.
Mr. Theagarajah noted that Malta might be a better example for Sri Lanka to draw lessons, which is
located in Europe in a similar strategic location to Sri Lanka as it does in South Asia.
He pointed out that Malta, which doesn’t have any natural resources, has been successful in boosting
exports, which makes up about 60 percent of its GDP now through open immigration policies,
developing its free port and allowing anybody who wants to go into Europe to come and add value
through their country.
“We have the greatest window to South Asia, but are we doing enough to encourage those who should
be coming here and add value,” he questioned.
Mr. Theagarajah also noted that Sri Lanka hasn’t been successful in attracting the diaspora community
and their investments back into the country.
He pointed out that lack of quality education and healthcare acts as the main barrier in attracting them
back to the country. Hence, he urged the private sector to invest in these sectors.
Exporters’ Association of Sri Lanka, Chairman Harin de Silva stated that the exporters blamed the
absence of a “strong and positive political will and vision,” as the reason behind Sri Lanka’s failure to
achieve full export potential, and urged the government to focus on providing greater transparency,
accountability and speedy implementation of policy initiatives.
Mr. Silva further stated that “Sri Lanka’s export fraternities’ ambition of working with a government,
that was focused on bringing about good governance and ushering in a new era for Sri Lankan exports,
has not panned out as we hoped,”
“Time and again the EASL has stressed the importance and need for a strong and positive political will
and vision to drive the export sector of our country in order to reach its full potential. But sadly it
seems that our pleas have gone in vain,” he added.
EASL Annual Report 2018/2019 Page 17
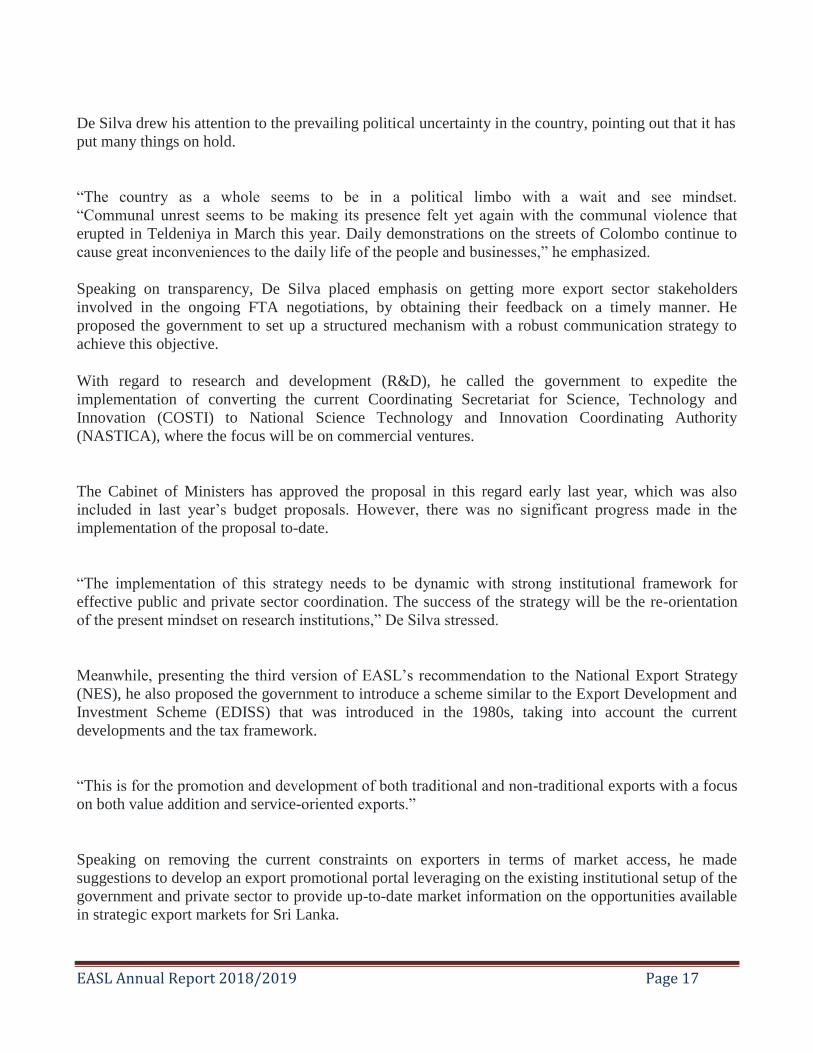
De Silva drew his attention to the prevailing political uncertainty in the country, pointing out that it has
put many things on hold.
“The country as a whole seems to be in a political limbo with a wait and see mindset.
“Communal unrest seems to be making its presence felt yet again with the communal violence that
erupted in Teldeniya in March this year. Daily demonstrations on the streets of Colombo continue to
cause great inconveniences to the daily life of the people and businesses,” he emphasized.
Speaking on transparency, De Silva placed emphasis on getting more export sector stakeholders
involved in the ongoing FTA negotiations, by obtaining their feedback on a timely manner. He
proposed the government to set up a structured mechanism with a robust communication strategy to
achieve this objective.
With regard to research and development (R&D), he called the government to expedite the
implementation of converting the current Coordinating Secretariat for Science, Technology and
Innovation (COSTI) to National Science Technology and Innovation Coordinating Authority
(NASTICA), where the focus will be on commercial ventures.
The Cabinet of Ministers has approved the proposal in this regard early last year, which was also
included in last year’s budget proposals. However, there was no significant progress made in the
implementation of the proposal to-date.
“The implementation of this strategy needs to be dynamic with strong institutional framework for
effective public and private sector coordination. The success of the strategy will be the re-orientation
of the present mindset on research institutions,” De Silva stressed.
Meanwhile, presenting the third version of EASL’s recommendation to the National Export Strategy
(NES), he also proposed the government to introduce a scheme similar to the Export Development and
Investment Scheme (EDISS) that was introduced in the 1980s, taking into account the current
developments and the tax framework.
“This is for the promotion and development of both traditional and non-traditional exports with a focus
on both value addition and service-oriented exports.”
Speaking on removing the current constraints on exporters in terms of market access, he made
suggestions to develop an export promotional portal leveraging on the existing institutional setup of the
government and private sector to provide up-to-date market information on the opportunities available
in strategic export markets for Sri Lanka.
EASL Annual Report 2018/2019 Page 18
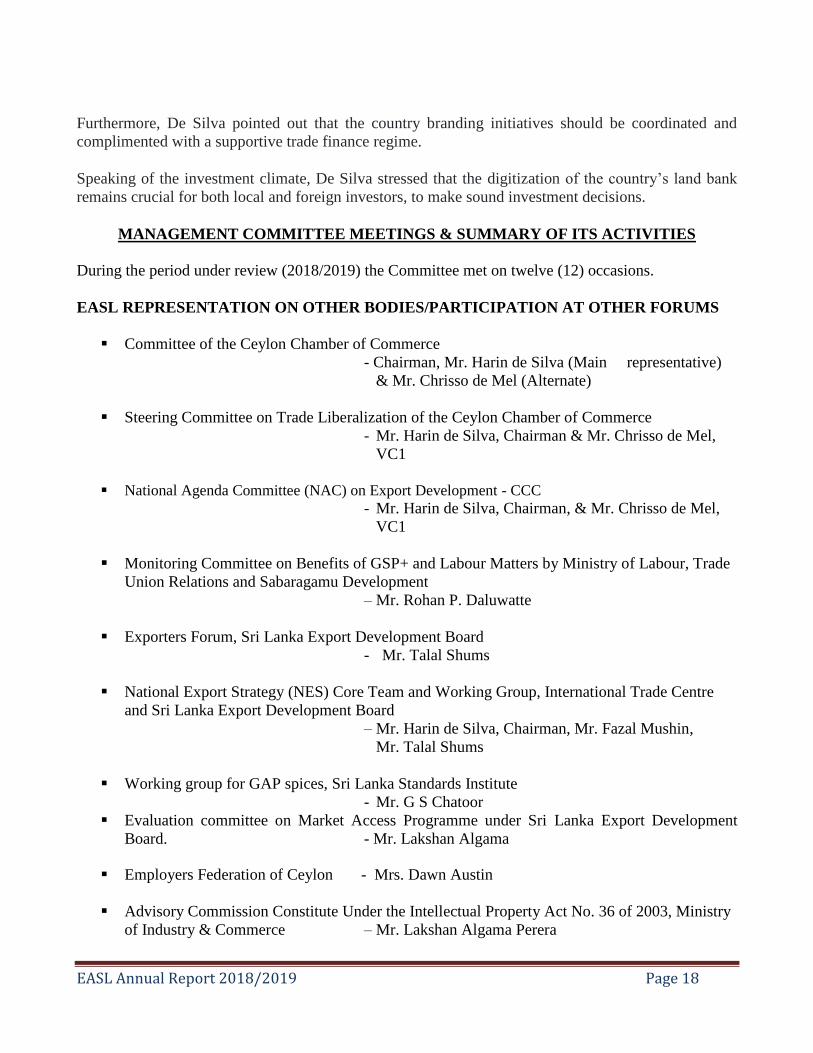
Furthermore, De Silva pointed out that the country branding initiatives should be coordinated and
complimented with a supportive trade finance regime.
Speaking of the investment climate, De Silva stressed that the digitization of the country’s land bank
remains crucial for both local and foreign investors, to make sound investment decisions.
MANAGEMENT COMMITTEE MEETINGS & SUMMARY OF ITS ACTIVITIES
During the period under review (2018/2019) the Committee met on twelve (12) occasions.
EASL REPRESENTATION ON OTHER BODIES/PARTICIPATION AT OTHER FORUMS
Committee of the Ceylon Chamber of Commerce
- Chairman, Mr. Harin de Silva (Main representative)
& Mr. Chrisso de Mel (Alternate)
Steering Committee on Trade Liberalization of the Ceylon Chamber of Commerce
- Mr. Harin de Silva, Chairman & Mr. Chrisso de Mel,
VC1
National Agenda Committee (NAC) on Export Development - CCC
- Mr. Harin de Silva, Chairman, & Mr. Chrisso de Mel,
VC1
Monitoring Committee on Benefits of GSP+ and Labour Matters by Ministry of Labour, Trade
Union Relations and Sabaragamu Development
– Mr. Rohan P. Daluwatte
Exporters Forum, Sri Lanka Export Development Board
- Mr. Talal Shums
National Export Strategy (NES) Core Team and Working Group, International Trade Centre
and Sri Lanka Export Development Board
– Mr. Harin de Silva, Chairman, Mr. Fazal Mushin,
Mr. Talal Shums
Working group for GAP spices, Sri Lanka Standards Institute
- Mr. G S Chatoor
Evaluation committee on Market Access Programme under Sri Lanka Export Development
Board. - Mr. Lakshan Algama
Employers Federation of Ceylon - Mrs. Dawn Austin
Advisory Commission Constitute Under the Intellectual Property Act No. 36 of 2003, Ministry
of Industry & Commerce – Mr. Lakshan Algama Perera
EASL Annual Report 2018/2019 Page 19
EU - Sri Lanka Trade related assistance project - Geographical Indication (GI) Ceylon
Cinnamon, Ministry of Industry and Commerce – Mr. Lakshan Algama
The Association has maintained a closer dialogue with the following Institutions, on export related
matters:
Ministry of Development Strategies and International Trade
Ministry of Industry and Commerce
Ministry of Finance
Ministry of Foreign Affairs
Sri Lanka Export Development Board
Department of Inland Revenue (VAT Dept)
Sri Lanka Customs
Board of Investment
The Central Bank of Sri Lanka
Sri Lanka Ports Authority
Department of Commerce
Department of Exchange Control
Joint Apparel Associations Forum
Sri Lanka Standards Institute
MAIN AREAS ADDRESSED DURING THE YEAR UNDER REVIEW
As the apex body representing over 100 Exporters through direct & indirect membership, who
contribute over 80% to the total exports of the country, the EASL activities during the year under
review, were primarily aimed at facilitating an environment for the Exporters with a focus on global
competitiveness and achieving strong growth of the Sector.
In the year under review the EASL has forged ahead to capitalize on the Government’s declaration that
all imperatives required to encourage the growth of Export will be addressed and resolved. Consistent
and frequent representation has been made by the EASL to every related agency connected with
Exports, drawing attention to aspects that constrain Export businesses from being able to achieve the
targets which each sector has set for itself.
The Association’s representation for a stakeholder discussion with Project Director of National Single
Window (NSW) & Trade information Portal (TIP) Project, PM Group to discuss options and approaches on
the Revenue & Fee Model task within the NSW blueprint organized by the Ceylon Chamber of Commerce.
Recommendations for the National Export Strategy (NEDEVS 3)
Over the past 2 years the EASL on its own have developed 2 documents under the title
“Recommendations for a National Export Strategy”. Subsequent committees set about identifying
cross cutting issues at a macro level via extensive consultations with our membership & stake holder in
the export fraternity along with economist who specialize in the field of exports. This year is no
different and the committee has proceeded to develop the 3rd document. This document was shared
EASL Annual Report 2018/2019 Page 20
with policy makers in the current government. Taking a step further this year, this document was also
shared with all political and interested parties who are concerned with the developments of exports out
of Sri Lanka which was something that EASL did not do with the first two documents.
Each of these 3 documents address the most critical issues challenging the export fraternity in Sri
Lanka that need to be addressed at the highest levels of government.
Third document focuses on 5 main points that are currently essential in formulating the foundations for
the growth of Sri Lankan exports.
1. Driving the National Exports Strategy
The government must ensure that a predictable and transparent policy and regulatory
framework is in place to promote trade competitiveness. This will go a long way in achieving
the five-year detailed plan of action and implementation of the management framework
proposed by NES.
The establishment of an institutional framework for effective public and private sector
coordination for the execution of these plans of action and pro–business orientation of
Government agencies.
Updating regulatory framework by the way of incorporating amendments to outdated
legislation and bringing in new regulations to suit the requirements of modern trading practices.
2. Improving the investment climate for exports
Digitising the Land Bank in Sri Lanka - a key difficulty for both foreign and local investors is
the availability of data concerning the availability of land for investment purposes. While steps
are being taken to implement the digitisation of the land bank, it will need to be expedited to
ensure that this does not continue to be a key drawback for investment.
Improve Sri Lanka’s ranking on the Ease of Doing Business index
Introduction of a scheme similar to the Export Development and Investment Support Scheme
(EDISS) that was introduced in the 1980s taking into account the current developments and the
tax framework. This is for the promotion and development of both traditional and non-
traditional exports with a focus on both value addition and the service oriented exports.
Policy initiatives should be driven to encourage investments by addressing the increasing
labour shortages for many industries.
3. Addressing Constraints for Market Access and Promotion
Develop an export promotion portal by leveraging on existing institutional set up of the
Government and the private sectors to provide up to date market information on opportunities
available in strategic export markets for Sri Lanka.
Addressing quality infrastructure deficiencies to resolve compliance issues and promote market
access potential of exports.
Country branding initiatives to be coordinated and complimented with a supportive trade
finance regime.
EASL Annual Report 2018/2019 Page 21
4. Proactive Engagement in Trade Liberalisation
Develop a structured mechanism with a robust communication strategy for obtaining timely
feedback from the export sector stakeholders concerning ongoing FTA negotiations, especially
on offensive interests.
Develop a trade adjustment package in consultation with the relevant stakeholders.
Prioritize the establishment of a National Single Window (NSW), under Sri Lanka’s TFA
commitments to gain trade facilitation efficiencies which has the potential to bring substantial
cost savings and predictability for traders.
5. Fostering Innovation to drive exports
Convert the current Coordinating Secretariat for Science, Technology and Innovation (COSTI)
to the National Science Technology and Innovation Coordinating Authority (NASTICA) where
the focus will be on commercial ventures.
The implementation of this strategy will need to be dynamic with a strong institutional
framework for effective public and private sector coordination. The success of the strategy will
be on re-orienting the present mind set in research institutions.
NEDEVS 3 was formulated by Economic Intelligence Unit (EIU) of the Ceylon Chamber of
Commerce (CCC)
The final document was shared among main government and private sector stakeholders. (Around 50 key
stakeholders). There was a good press coverage highlighting the key aspects of the document after the
AGM.
To be the focus of the Committee during the year, Improve the quality and standards of export
products; build capacity within Institutions responsible ensuring the ability to achieve international
standards in a cost effective manner; Create encouragement to increase Production and Productivity;
Setting up of an EXIM bank to support Exporters looking at new markets, NTBS, Sanitary and
Phytosanitary Measures and Technical Barriers to Trade relevant to FTAs with India, China and
Pakistan were taken up at the various sub committees appointed by the Ministry of Development
Strategies and International Trade (MoDSIT).
The Office-bearers worked tirelessly on lobbying on Tax, Fiscal, and other issues related to the new
Foreign Exchange Act, the New Inland Revenue Act, Budget Proposals for 2018 and the Sri Lanka
Singapore Treaty for prevention of Double Taxation which has a bearing on the Free Trade Agreement
(FTA) which was signed by the Government of Sri Lanka and Singapore recently which impacts on,
and benefits International Trade particularly in regard to exports
We have also been very vocal in the media and have released article on Easter Sunday terror attacks
and acknowledging the colossal impact the attacks have had on human life, livelihoods, and the
economy, the EASL is committed to do their part to help Sri Lanka recover.
EASL Annual Report 2018/2019 Page 22
KEY EXPORT RELATED MATTERS ADDRESSED AND RESOLVED THROUGH EASL
INTERVENTIONS AT MEETINGS WITH GOVERNMENT OFFICIALS AND OTHER
EXPORT RELATED ORGANIZATIONS:
i) EASL Submissions for 2018 National Budget
Submissions of the different Sectors were consolidated and presented by EASL to the Ceylon
Chamber of Commerce.
ii) Department of Inland Revenue (IRD)
Representations were made to IRD stating that there should not be a hiatus in the transition
from SVAT to RAMIS and that the current SVAT system must remain operational until
RAMIS is in place as projected.
iii) Sri Lanka Customs
Meetings with Director General Customs
Export Statistics to be available monthly for the benefit of the exporters to understand the
competitiveness in the market
Operational Issues relating to Sri Lanka Customs Export Facilitation Centre
iv) Export Development Board
Ongoing interaction with the EDB and members of the Managing Committee being
included on the respective EDB Advisory Committees.
Submissions for Exporters’ Forum
The Chairman of the EASL was appointed to serve on the core team and working Group
of National Export Strategy (NES)
v) Foreign Exchange Department of the Central Bank of Sri Lanka (CBSL)
Proposed New Mechanism for Tracking Export Proceeds by Sri Lanka Customs
EASL was invited to participate discussions to set up a mechanism for tracking repatriation of
export proceeds, organized by Central Bank and Sri Lanka Export Development Board. The
current rule for repatriation of export proceeds stands at 120 days with a grace period of 30
days (as per the provisions of the Foreign Exchange Act No 12 of 2017). EASL has opposed
implementing the new mechanism proposed by Sri Lanka Customs which is a cumbersome
procedure adding extra cost to the exporters.
SRI LANKA NATIONAL EXPORT STRATEGY (NES)
The Government of Sri Lanka unveiled the National Export Strategy (NES) on 19th July 2019, a
blueprint for achieving increased exports, enhanced regional cooperation and job creation.
Alongside other national initiatives such as Enterprise Sri Lanka and Vision 2025, the Strategy
is an important addition to the country’s development agenda and its goal of becoming a
leading Asian export hub driven by innovation and investment. Technical assistance for
developing the NES was provided through the EU-Sri Lanka Trade Related Assistance project
funded by the European Union.
EASL Annual Report 2018/2019 Page 23
The five-year Strategy aims to enable Sri Lanka to reach its goal of $28 billion in exports by
2022. It benefits from the input of more than 600 public and private-sector stakeholders across
Sri Lanka to reflect their export ambitions.
The Strategy sets out specific priority actions and investments to address competitiveness
constraints, modernise regulatory systems for improved efficiency, and boost Sri Lankan
industries in order to increase exports. It also sets targets to improve opportunities for Sri
Lanka’s micro, small and medium-sized enterprises (MSMEs) and exporters in regional and
global trade.
Advisory Committees were set up by the Hon. Minister, Malik Samarawickrema, Minister of
Development Strategies and International Trade under the provision of the SLEDB’s Act No.
40 of 1979. These export “Advisory Committees” were rapidly reactivated for effective
implementation and monitoring of the NES. These committees were set up for 3 year period.
Members of the EASL committee have been invited to serve on these advisory committees.
The successful implementation of Sri Lanka’s National Export Strategy depends on the
capacity and willingness of all public and private sector stakeholders to contribute, collaborate,
own and drive towards a common national objective. Priorities need to be implemented at the
earliest possible opportunity and the frequency of regular and structured public-private
dialogues will be critical to maintain the momentum needed.
vi) Sri Lanka Standards Institute
Issues faced by Exporters when exporting fast moving consumer goods to India
Request for MRA to be established between SLSI and the Exporters and other statutory
bodies in order to have reciprocity between Authorising Agencies.
Import Inspection Scheme
EASL suggested that Import and Export Control Department and Sri Lanka Standards
Institution shall take into consideration to include products such as Chili powder, Curry
Powder under the Import Inspection Scheme of SLSI.
vii) Department of Commerce
Addressing Non-Tariff Barriers (NTBs) faced by Sri Lankan exporters when exporting to
India in the form of standards, testing and inspection requirements.
viii) Board of Investment of Sri Lanka
Request to extend the tax and other incentives given for new foreign investors to the
existing local companies who want to add value, expand and upgrade their operations.
EASL Annual Report 2018/2019 Page 24
EASL’S AFFILIATION WITH OTHER ORGANIZATIONS ON EXPORT RELATED
MATTERS
i) The Ceylon Chamber of Commerce
Participation in monthly Chamber Committee meetings:
ii) Employers Federation of Ceylon
As an Affiliated Association of the EFC, EASL participated in EFC regular meetings, where
employee related matters were discussed.
AWARENESS BUILDING ACTIVITIES
A) Dissemination of Information
The membership was alerted on various issues affecting exporters, as well as matters of interest, by
way of Circulars issued by EASL as well as the Ceylon Chamber of Commerce and various other
affiliated bodies of the relevant local Chamber. This included information on matters of business
interest to members, notices of topical seminars/workshops organized by the Ceylon Chamber of
Commerce and affiliated Associations/Councils.
B) Seminars/Interactive forum
During the year under review, there was no seminars organized by EASL.
C) Website
The site has proved to be an extremely useful information tool. http://www.exporterssrilanka.net.
D) Publicity
Several Press releases and interviews were given by EASL to create awareness of developments and
issues in the Sector, and the future outlook.
E) Membership
The Membership as at 31st March 2019 consisted of 93 individual Exporter members and 11
Product Associations.
F) Auditors and Annual Accounts
The Auditors of the Exporters Association of Sri Lanka for the period 2018/2019 were Messrs. HLB
Edirisinghe & Co. The Audited Accounts of the Association is attached.
G) Secretariat
The Ceylon Chamber of Commerce continued to provide Secretarial Services to the Association
during the period under review.
EASL Annual Report 2018/2019 Page 25
BY ORDER OF THE COMMITTEE
Sgd.
Ushani Dassanayake
For Secretary
EASL Annual Report 2018/2019 Page 26
EXPORT SECTOR PERFORMANCE IN 2018/2019
AND FUTURE EXPORT CHALLENGES
OVERVIEW OF THE ECONOMY
The vulnerability of the Sri Lankan economy to
global and domestic disturbances became
increasingly visible in 2018, with a modest
expansion in real economic activity amidst a
low inflation environment during the year. Real
GDP growth was recorded at 3.2 per cent in
2018, compared to 3.4 per cent in the previous
year. This growth was largely supported by
services activities that expanded by 4.7 per cent
and the recovery in agriculture activities, which
recorded a growth of 4.8 per cent. Industry
activities slowed down significantly to 0.9 per
cent during the year, mainly as a result of the
contraction in construction. According to the
expenditure approach, both consumption and
investment expenditure supported growth.
Investment as a percentage of GDP stood at
28.6 per cent in 2018 compared to 28.8 per cent
in the previous year, while the savings-
investment gap widened during the year
indicating increased dependence on external
resources to fill the shortfall. The total size of
the Sri Lankan economy was estimated at US
dollars 88.9 billion, while the per capita GDP
was recorded at US dollars 4,102 in 2018,
which was marginally lower than in the
previous year. Amidst the moderate growth in
economic activity, a marginal increase in the
unemployment rate and a decline in the labour
force participation rate were observed during
the year. The external sector of the economy
was volatile during the year due to both global
and domestic factors. Globally, monetary
policy normalisation, particularly in the United
States of America (USA), resulted in global
financial conditions tightening, thus causing
capital outflows from emerging market
economies and increased pressure on exchange
rates of twin deficit economies, in particular.
Sri Lanka also experienced these headwinds,
particularly from mid-April 2018, which were
exacerbated following the political
uncertainties and the downgrade of the
country’s Sovereign rating in the fourth quarter
of the year. Domestically, the trade deficit
surpassed US dollars 10 billion for the first
time in history with higher growth in import
expenditure outpacing the growth in export
earnings, which were at a record level in
nominal terms. Although services exports are
estimated to have grown substantially, the
deficit in the merchandise trade balance,
stagnant workers’ remittances and rising
foreign interest payments resulted in a widened
current account deficit of 3.2 per cent of GDP
during the year. The financial account
benefitted from increased foreign direct
investment (FDI) inflows which recorded its
historically highest level in 2018, as well as
borrowing from abroad, particularly through
the issuance of International Sovereign Bonds
(ISBs). The combined result of these
developments was a deficit in the overall
balance in the balance of payments (BOP). In
2018, the Central Bank followed a market
based exchange rate policy and allowed a
sharper depreciation of the rupee, but
intervened in the domestic foreign exchange
market, particularly at times when large capital
outflows and undue speculation caused
excessive volatility in the market. In order to
address the widening trade deficit, the Central
Bank and the government implemented a series
of measures to curb non-essential imports by
increasing tariffs, imposing margin
requirements, tightening loanto-value ratios on
selected types of lending, and suspending the
issuance of letters of credit (LCs) on
concessionary permits for vehicle imports. In
response to these measures and the global
financial markets becoming less unfavourable,
the pressure on the BOP and the exchange rate
subsided during late 2018 and early 2019, and
EASL Annual Report 2018/2019 Page 27
the Sri Lankan rupee appreciated against major
currencies during the first quarter of 2019, thus
correcting the overshooting of the exchange
rate observed in the previous year to some
extent. The resumption of discussions and the
achievement of staff level agreement with the
International Monetary Fund (IMF) on the
programme under the Extended Fund Facility
(EFF) arrangement in February 2019 also
helped improve investment sentiments. In spite
of the sharp depreciation of the rupee and the
introduction of the pricing formula for
domestic petroleum price adjustments, headline
and core inflation remained well anchored in
low single digit levels during the year,
supported by proactive monetary policy
measures, improved domestic supply
conditions, and also due to subdued aggregate
demand conditions. Headline inflation
fluctuated largely in line with the price
movements of the food category, where food
prices declined mostly during 2018 owing to
favourable weather conditions that prevailed
during the year. Inflation is expected to remain
well within mid single digit levels in the
medium term, particularly under the envisaged
flexible inflation targeting (FIT) regime.
Subdued inflation and inflation expectations
and lower than potential growth in real
economic activity prompted the Central Bank
to signal an end to the monetary tightening
cycle in April 2018 by reducing the Standing
Lending Facility Rate (SLFR) by 25 basis
points. Thereafter, the Central Bank maintained
a neutral monetary policy stance throughout the
year, in view of the continued pressure on the
external sector amidst the subpar performance
in the domestic economy. Nevertheless, the
large and persistent liquidity deficit in the
domestic money market, particularly since
September 2018, compelled the Central Bank
to inject liquidity on a permanent basis in
November 2018, by way of reducing the
Statutory Reserve Ratio (SRR) applicable on
all rupee deposit liabilities of commercial
banks by 1.50 percentage points. However, at
the same time, to neutralise the impact of the
SRR reduction and maintain its neutral policy
stance, the Central Bank increased the Standing
Deposit Facility Rate (SDFR) by 75 basis
points and SLFR by 50 basis points, further
narrowing the policy rate corridor to 100 basis
points. Accordingly, by end 2018, SDFR and
SLFR stood at 8.00 per cent and 9.00 per cent,
respectively. As the shortage in rupee liquidity
persisted into early 2019, the Central Bank
reduced the SRR by a further 1.00 percentage
point to 5.00 per cent effective 01 March 2019.
Meanwhile, the year-on-year growth of broad
money (M2b) decelerated in 2018 driven by the
contraction in net foreign assets (NFA) of the
banking sector. However, within broad money
growth, the overall expansion of credit granted
to the private sector by commercial banks in
2018 was higher than expected, in spite of tight
liquidity conditions and high nominal and real
market interest rates. In the meantime, fiscal
operations during 2018 demonstrated some
improvements with a higher primary surplus
and a lower budget deficit, notwithstanding the
decline in revenue mobilisation. The
government revenue declined to 13.3 per cent
of GDP in 2018 while expenditure and net
lending declined, particularly due to lower
public investment, which was affected by
political tensions that prevailed towards the end
of the year resulting in delays in the
implementation of budgetary operations.
Reduced capital expenditure also contributed to
a dampening of economic activity. The current
account deficit increased in 2018 as a
percentage of GDP reflecting dissavings of the
government. The primary balance, which
mirrors the difference between the government
revenue and non-interest expenditure,
registered a surplus of 0.6 per cent of GDP in
2018 compared to the surplus of 0.02 per cent
of GDP in 2017. The budget deficit declined to
5.3 per cent of GDP in 2018 from 5.5 per cent
of GDP in 2017 as a result of the substantial
reduction in capital expenditure, but a deviation
from the target level of 4.8 per cent of GDP
envisaged in the Budget 2018 was also
observed. The outstanding central government
EASL Annual Report 2018/2019 Page 28
debt increased to 82.9 per cent of GDP at end
2018 from 76.9 per cent at end 2017, which is
attributed to the depreciation of the rupee that
affected the rupee value of foreign debt,
relatively low nominal GDP and higher net
borrowings during the period. Rollover risks
can be contained through the implementation of
the provisions of the Active Liability
Management Act (ALMA) and the introduction
of the Medium Term Debt Management
Strategy (MTDS), which would help manage
the government’s debt obligations in the period
ahead, with the support of continued
commitment towards revenue based fiscal
consolidation. The financial sector continued to
expand in 2018, supported by the moderate but
stable growth of the banking sector. However,
the profitability of the banking sector declined
during the year mainly due to some
deterioration in the asset quality, a rise in
operating costs and higher taxes. The Central
Bank strengthened the prudential policy
measures, including the implementation of
Basel III requirements and the adoption of Sri
Lanka Accounting Standard - SLFRS 9 during
the year. Meanwhile, the Licensed Finance
Companies (LFCs) and Specialised Leasing
Companies (SLCs) sector also recorded
moderate growth amidst a challenging
environment, and the Central Bank took
measures to resolve distressed finance
companies and to address the lingering
concerns in the sector. The Colombo Stock
Exchange (CSE) recorded yet another year of
poor performance due to adverse developments
on domestic and global fronts, which affected
investor sentiments. While Sri Lanka has made
significant progress in maintaining price
stability in the past decade, progress in terms of
real economic performance has fallen below
expectations in recent years impacted by the
continued delays in the implementation of the
required structural reforms and inconsistent and
unpredictable policies introduced from time to
time. These irregularities have crippled the
growth momentum of the economy, thus
preventing the country from progressing into a
higher income economy. In this background, it
is vital that all stakeholders make concerted
efforts to expedite the reform agenda that is
already in place, which includes the National
Export Strategy (NES) and New Trade Policy
(NTP) to improve earnings from merchandise
and service exports, the fiscal consolidation
programme to improve fiscal discipline and
debt sustainability, and the Central Bank’s
move towards adopting FIT by 2020 to ensure
sustained price stability. The timely
implementation of these reforms will not only
improve Sri Lanka’s economic outlook and its
prospects as a highly sought after destination
for investments given the country’s strategic
location in the Indian Ocean, but also would be
essential to uplift the overall standard of living
and quality of life of its people.
Global Economic Environment and Outlook
As per the January 2019 update of the World
Economic Outlook (WEO) of the IMF, a
moderation in the expansion of global
economic activity was observed in 2018, on
account of mounting economic and political
headwinds internationally. Compared to 2017,
global growth was increasingly unsynchronized
during 2018, as most economies, apart from the
US, experienced a slowdown in economic
activity. In spite of the notable growth in
economic activity in the US, growth among
advanced economies grew modestly during
EASL Annual Report 2018/2019 Page 29
2018, with a larger than expected moderation in
economic activity in the UK, Euro area and
Japan. Meanwhile, emerging market and
developing economies continued to grow
strongly, albeit at a slower pace than in the
previous year, underpinned by improved
domestic demand and higher oil prices
favouring oil-exporting economies, amidst a
challenging global macroeconomic
environment driven by rising trade tensions and
tighter financial conditions. Further, the
uncertainty surrounding the Brexit and
mounting tensions from the Sino-American
trade war led to a moderation in global trade
during 2018. Meanwhile, oil prices, which were
on an increasing trend during the first nine
months of 2018, caused some acceleration in
inflation in both advanced economies and
emerging market and developing economies
during the year. Amidst mounting uncertainties
in the global economic environment, a gradual
approach of monetary policy normalisation was
undertaken by most advanced economies
during 2018, citing favourable developments in
domestic market conditions, necessitating
emerging market economies to respond with
the view of containing the adverse spillover
effects of such normalisation. The US Federal
Reserve, which commenced tightening
monetary policy in late 2015, tightened its
stance further by increasing the Federal Funds
target rate in four instances during 2018,
responding to improved domestic demand and
strengthening labour markets. However,
considering the signals that the US economy is
slowing down while inflationary pressures
remain subdued, the Federal Reserve adopted a
more cautious approach from January 2019.
Meanwhile, the Bank of England (BOE)
increased its policy rates in August 2018, with
domestic economic activity gathering
momentum and inflation hovering above the
targeted levels. However, the intensification of
tensions surrounding Brexit along with subdued
domestic and global growth caused the BOE to
remain increasingly dovish. With inflation
gaining momentum and risks to the growth
outlook remaining broadly balanced, the
European Central Bank (ECB) announced the
gradual winding down of quantitative easing
(QE). Accordingly, by end 2018, the net asset
purchases concluded, although Brexit woes and
rising global risks resulting from escalating
trade tensions led the ECB to continue its
accommodative stance on monetary policy.
Having little success on the achievement of the
inflation target, the Bank of Japan (BOJ)
continued with its accommodative monetary
policy stance during 2018. Meanwhile,
emerging market economies were impacted by
monetary policy normalisation measures in key
advanced economies and the ensuing capital
outflows as well as rising trade tensions. In
response to these economic headwinds, a
number of central banks in emerging market
economies raised interest rates. The Reserve
Bank of India (RBI) raised its interest rates
twice during 2018, which was later reversed
with a policy rate cut in early 2019. The
lacklustre growth and investor confidence, and
rising risks to financial stability required China
to ease fiscal and monetary policies during
2018. As a result of global economic and
financial market developments and domestic
vulnerabilities, currencies of several emerging
market economies depreciated considerably
against the US dollar during 2018. The balance
of risks to global growth, as highlighted in the
January 2019 update of WEO, is tilted to the
downside indicating the possibility of some
slowdown in the global economy going
forward. Central banks in most advanced, and
emerging market and developing economies
have taken measures to tighten monetary policy
during 2018 in view of containing undue
inflationary pressures arising from the
favourable economic outlook, stronger labour
markets and subsequent firming up of demand.
However, with increased uncertainty
surrounding global and domestic
macroeconomic developments and inflationary
pressures remaining somewhat muted, the
policy stance of major central banks turned
more accommodative commencing early 2019.
EASL Annual Report 2018/2019 Page 30
Nonetheless, several risks remain that could
weigh down on global growth prospects. The
continuation of the US-China trade tensions
could bring in greater policy uncertainties
among economies and could restrain global
trade, thereby weakening global growth
prospects. Also, a further slowdown in the
Chinese economy will require continued fiscal
and monetary stimulus, failing which the
economy could be increasingly vulnerable to a
prolonged downturn. This could wane demand
for commodities leading to a drop in prices,
severely affecting commodity-exporting
economies and global growth at large. The
ongoing uncertainties surrounding Brexit
would impede growth prospects in the UK,
Eurozone as well as in other partner economies.
In the meantime, oil prices are expected to
remain subdued, particularly with a possible
supply glut due to US shale production and
lack of cooperation among OPEC economies.
Although moderate oil prices are expected to
reduce global inflationary pressures, oil
exporting economies are expected to be
negatively impacted while oil producing
corporates are likely to experience a thinning of
their margins. Mounting uncertainties in the
global political and economic environment
pose significant challenges to Sri Lanka,
necessitating the implementation of timely and
prudent policy measures to support domestic
growth initiatives while maintaining stability.
The weaker economic outlook reflecting
subdued global demand could impact Sri
Lanka’s trade during 2019. Moreover,
escalating trade tensions between the US and
China, as well as the UK and the Eurozone
could exacerbate this impact affecting the
country’s BOP. However, this impact could
ease somewhat with key economies
increasingly adopting accommodative
monetary policies to stimulate domestic
demand. Nevertheless, any rise in global
market interest rates could increase debt
servicing costs of the government and
corporates, leading to greater financial fragility
and weaker risk profile of the country.
Therefore, prudent accumulation of foreign
exchange reserves and careful management of
external debt are essential in the period ahead.
As global oil prices are expected to remain at
current subdued levels, its impact on domestic
inflation is expected to remain minimal during
2019.
Direction of Trade
Sri Lanka’s major trading partners broadly
remained unchanged in 2018, in comparison to
2017. India remained Sri Lanka’s major trading
partner, in 2018, followed by China and the
USA. As in 2017, total trade with India
exceeded US dollars 5 billion, while trade with
China and the USA exceeded US dollars 4
billion and US dollars 3 billion, respectively, in
2018, with a share of 14.7 per cent, 12.8 per
cent and 10.6 per cent. In addition, the United
Arab Emirates (UAE), Japan, Singapore, the
UK and Germany were the other major trading
partners accounting for trade to the value of
more than US dollars 1 billion each in 2018.
However, trade with India declined in 2018 due
to a reduction in imports from India, while total
trade with Singapore dropped owing to a
significant decline in exports to Singapore.
Contrastingly, trade with China, the USA, the
UAE, Japan, the UK and Germany increased
during the year in comparison to the previous
year. Among Sri Lanka’s export destinations,
advanced countries, mainly the USA and the
UK, continued to account for the largest share,
while among Sri Lanka’s sources of imports,
Asia, mainly India and China, accounted for a
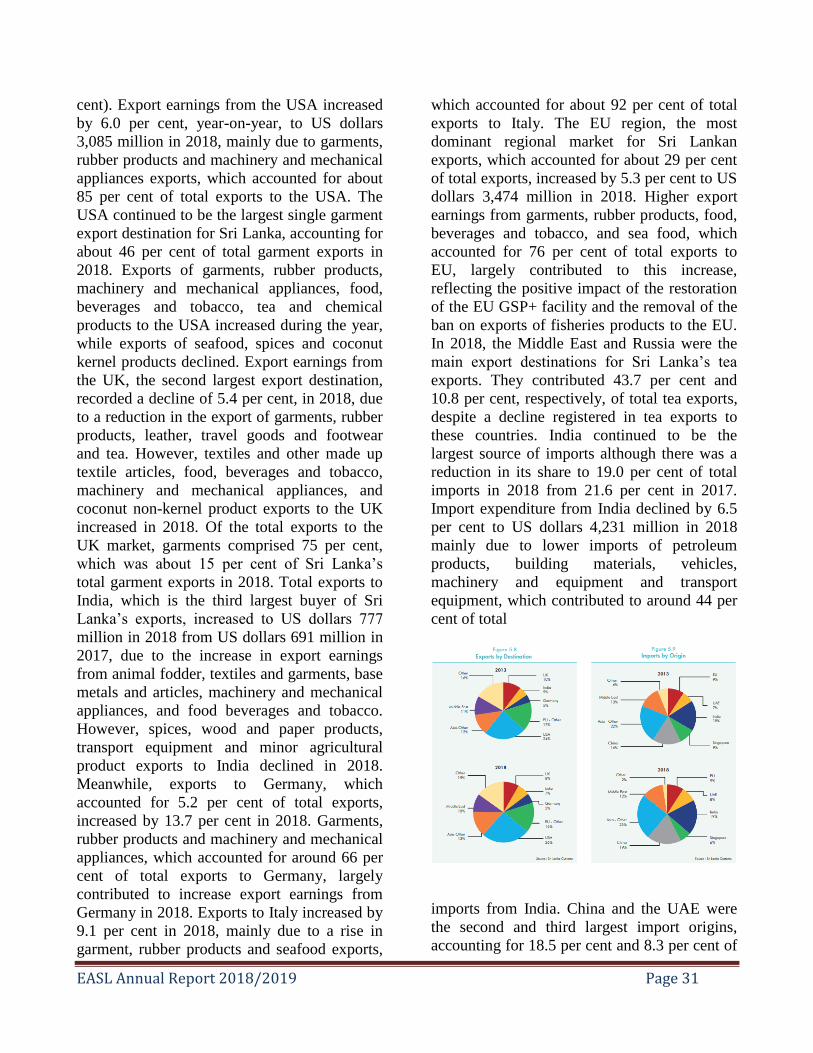
major share. The USA retained its position as
the major export destination, accounting for
25.9 per cent of Sri Lanka’s exports, followed
by the UK (8.2 per cent) and India (6.5 per
EASL Annual Report 2018/2019 Page 31
cent). Export earnings from the USA increased
by 6.0 per cent, year-on-year, to US dollars
3,085 million in 2018, mainly due to garments,
rubber products and machinery and mechanical
appliances exports, which accounted for about
85 per cent of total exports to the USA. The
USA continued to be the largest single garment
export destination for Sri Lanka, accounting for
about 46 per cent of total garment exports in
2018. Exports of garments, rubber products,
machinery and mechanical appliances, food,
beverages and tobacco, tea and chemical
products to the USA increased during the year,
while exports of seafood, spices and coconut
kernel products declined. Export earnings from
the UK, the second largest export destination,
recorded a decline of 5.4 per cent, in 2018, due
to a reduction in the export of garments, rubber
products, leather, travel goods and footwear
and tea. However, textiles and other made up
textile articles, food, beverages and tobacco,
machinery and mechanical appliances, and
coconut non-kernel product exports to the UK
increased in 2018. Of the total exports to the
UK market, garments comprised 75 per cent,
which was about 15 per cent of Sri Lanka’s
total garment exports in 2018. Total exports to
India, which is the third largest buyer of Sri
Lanka’s exports, increased to US dollars 777
million in 2018 from US dollars 691 million in
2017, due to the increase in export earnings
from animal fodder, textiles and garments, base
metals and articles, machinery and mechanical
appliances, and food beverages and tobacco.
However, spices, wood and paper products,
transport equipment and minor agricultural
product exports to India declined in 2018.
Meanwhile, exports to Germany, which
accounted for 5.2 per cent of total exports,
increased by 13.7 per cent in 2018. Garments,
rubber products and machinery and mechanical
appliances, which accounted for around 66 per
cent of total exports to Germany, largely
contributed to increase export earnings from
Germany in 2018. Exports to Italy increased by
9.1 per cent in 2018, mainly due to a rise in
garment, rubber products and seafood exports,
which accounted for about 92 per cent of total
exports to Italy. The EU region, the most
dominant regional market for Sri Lankan
exports, which accounted for about 29 per cent
of total exports, increased by 5.3 per cent to US
dollars 3,474 million in 2018. Higher export
earnings from garments, rubber products, food,
beverages and tobacco, and sea food, which
accounted for 76 per cent of total exports to
EU, largely contributed to this increase,
reflecting the positive impact of the restoration
of the EU GSP+ facility and the removal of the
ban on exports of fisheries products to the EU.
In 2018, the Middle East and Russia were the
main export destinations for Sri Lanka’s tea
exports. They contributed 43.7 per cent and
10.8 per cent, respectively, of total tea exports,
despite a decline registered in tea exports to
these countries. India continued to be the
largest source of imports although there was a
reduction in its share to 19.0 per cent of total
imports in 2018 from 21.6 per cent in 2017.
Import expenditure from India declined by 6.5
per cent to US dollars 4,231 million in 2018
mainly due to lower imports of petroleum
products, building materials, vehicles,
machinery and equipment and transport
equipment, which contributed to around 44 per
cent of total
imports from India. China and the UAE were
the second and third largest import origins,
accounting for 18.5 per cent and 8.3 per cent of
EASL Annual Report 2018/2019 Page 32
total imports, respectively. Main imports from
China comprised textiles and textile articles,
machinery and equipment, and building
materials, which accounted for 61 per cent of
total imports, while major imports from the
UAE were petroleum products and diamonds,
precious stones and metals, accounting for 87
per cent of total imports from the UAE. Japan
and Singapore were the fourth and fifth largest
import sourcing countries, accounting for 7.1
per cent and 6.2 per cent of total imports,
respectively. Expenditure on imports from
Japan rose significantly by 52.6 per cent to US
dollars 1,585 million in 2018, while increasing
its share of total imports to 7.1 per cent from
4.9 per cent in 2017, mainly due to the
considerable growth registered in vehicle
imports. Import expenditure on Japanese
vehicles accounted for around 62 per cent of
total imports from Japan and 62.4 per cent of
vehicles imported to Sri Lanka in 2018.
Meanwhile, import expenditure from Singapore
increased marginally by 1.5 per cent in 2018
mainly due to higher imports of petroleum
products. Diamonds, precious stones and
metals, machinery and equipment and chemical
products were the other main items imported
from Singapore in 2018. However, imports of
diamonds, precious stones and metals,
machinery and equipment, and chemical
products from Singapore declined during the
year.
Export Performance
Earnings from merchandise exports, which
rebounded strongly in 2017, continued to
maintain its growth momentum in 2018. The
restoration of the EU GSP+ facility, conducive
external trade policies together with strong
institutional support and the flexible exchange
rate policy maintained by the Central Bank
underpinned the performance of export
earnings. Accordingly, earnings from exports
increased by 4.7 per cent to US dollars 11,890
million in 2018, from US dollars 11,360
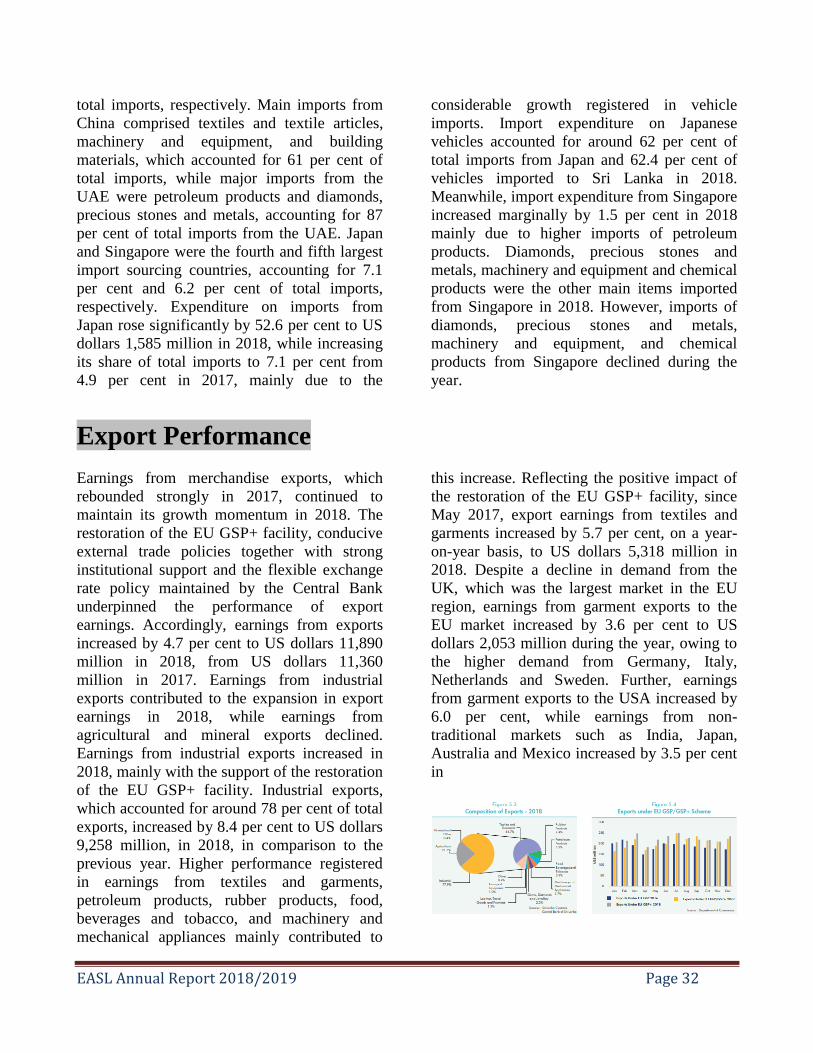
million in 2017. Earnings from industrial
exports contributed to the expansion in export
earnings in 2018, while earnings from
agricultural and mineral exports declined.
Earnings from industrial exports increased in
2018, mainly with the support of the restoration
of the EU GSP+ facility. Industrial exports,
which accounted for around 78 per cent of total
exports, increased by 8.4 per cent to US dollars
9,258 million, in 2018, in comparison to the
previous year. Higher performance registered
in earnings from textiles and garments,
petroleum products, rubber products, food,
beverages and tobacco, and machinery and
mechanical appliances mainly contributed to
this increase. Reflecting the positive impact of
the restoration of the EU GSP+ facility, since
May 2017, export earnings from textiles and
garments increased by 5.7 per cent, on a year-
on-year basis, to US dollars 5,318 million in
2018. Despite a decline in demand from the
UK, which was the largest market in the EU
region, earnings from garment exports to the
EU market increased by 3.6 per cent to US
dollars 2,053 million during the year, owing to
the higher demand from Germany, Italy,
Netherlands and Sweden. Further, earnings
from garment exports to the USA increased by
6.0 per cent, while earnings from non-
traditional markets such as India, Japan,
Australia and Mexico increased by 3.5 per cent
in
EASL Annual Report 2018/2019 Page 33
2018. Due to increased demand for textiles and
made up textile articles from the EU market,
the USA, India, Vietnam and Turkey, export
earnings from those categories also increased
by 26.6 per cent and 10.9 per cent, respectively,
in 2018. Export earnings from petroleum
products increased significantly by 43.2 per
cent in 2018, due to the combined impact of
higher export volumes and prices of bunker and
aviation fuel. Export prices of bunker and
aviation fuel increased considerably by 29.4 per
cent, in line with the higher oil prices that
prevailed in the international market during the
year. Earnings from exports of rubber products
increased by 4.8 per cent to US dollars 875
million during the year, compared to the
previous year, mainly due to the improved
performance in rubber tyre exports. Further,
export earnings from food, beverages and
tobacco rose by 17.7 per cent to US dollars 462
million in 2018, owing to the improved
performance of all sub categories except cereal
preparations. Also, export earnings from
machinery and mechanical appliances
increased by 17.3 per cent, on a year-on-year
basis, in 2018 due to increased performance
registered in almost all sub categories,
particularly in electronic equipment and
insulated wires, cables and conductors. In
addition, earnings from gems, diamonds and
jewellery, base metals and articles, chemical
products and animal fodder contributed to
boost industrial exports during the year.
However, earnings from transport equipment
declined by 25.9 per cent to US dollars 120
million, in 2018, mainly due to the base effect,
as three ships were exported to Singapore in
2017. Further, export earnings from leather,
travel goods and footwear declined by 6.8 per
cent, while earnings from printing industry
products and ceramic products declined by 35.2
per cent and 7.3 per cent, respectively, during
the year, in comparison to the previous year.
Performance of agricultural exports
deteriorated in 2018. Agricultural exports,
which accounted for about 22 per cent of total
exports, declined by 6.8 per cent, year-on-year,
to US dollars 2,579 million in 2018 due to poor
performance in almost all sub categories except
seafood. Earnings from tea exports, which grew
significantly in the previous year with the
support of favourable international tea prices,
declined by 6.6 per cent to US dollars 1,428
million in 2018, due to the combined impact of
lower average export prices and reduced
exported volumes of tea. Although the higher
volume of black tea production and exports,
particularly from Africa, resulted in a decline in
the international tea prices at the Mombasa and
Kolkata auctions, prices of Sri Lankan
Orthodox tea remained relatively strong due to
the limited supply. However, despite an
increase observed in the first quarter of 2018,
the average export price of one kilogram of tea
declined during the year to US dollars 5.06, in
comparison to US dollars 5.29 in 2017, due to
restricted trade with Iran and Russia following
the imposition of sanctions on these countries.
The volume of tea exported declined by 2.3 per
cent in 2018, compared to the previous year,
with the lower production owing to work
stoppage due to wage negotiations as well as
adverse weather conditions that prevailed in
some months. In 2018, Turkey continued to be
the number one importer of Sri Lankan tea, in
value terms, followed by Russia, Iraq and Iran,
jointly contributing for about 41 per cent of
earnings from tea exports. Despite an increase
observed in export earnings from non-kernel
coconut products, earnings from coconut
exports declined by 10.6 per cent to US dollars
311 million in 2018, due to the significant
decline in export earnings from coconut kernel
products. In 2018, export earnings from
coconut kernel products decreased by 21.3 per
cent mainly due to lower exported volumes of
desiccated coconut and coconut oil with the
reduced production of coconut during the first
half of 2018, owing to the lagged effect of
adverse weather conditions. Export earnings
from coconut non-kernel products increased by
2.3 per cent owing to higher performance in
fibre exports. Further, export earnings from
spices reduced by 11.3 per cent to US dollars
EASL Annual Report 2018/2019 Page 34
360 million in 2018, compared to the previous
year, led by the poor performance in almost all
categories of spices, except cinnamon. While
earnings from most of the spices such as
cloves, pepper and nutmeg and mace declined
with the reduction in exported volumes due to
poor harvest, earnings from cinnamon exports
increased with high export volumes. Further,
export earnings from minor agricultural
products declined by 14.7 per cent to US
dollars 118 million during the year due to the
lower performance of most categories
particularly arecanut, betel leaves and fruit. In
addition, export earnings from rubber,
vegetables and unmanufactured tobacco also
declined in 2018. However, earnings from
seafood exports continued to rise by 10.5 per
cent, to US dollars 266 million in 2018,
benefitting from the removal of the ban on the
exports of fisheries products to the EU and the
restoration of GSP+ facility. Accordingly,
seafood exports to the EU market increased
significantly by 37.5 per cent to US dollars 92
million during the year, due to the higher
demand from France, Italy, Germany, Spain
and Netherlands. Earnings from mineral
exports declined marginally by 0.4 per cent,
year-on-year, to US dollars 34 million in 2018.
Despite an increase in export earnings from
ores, slag and ash, earnings from mineral
exports decreased during the year due to
reductions in earnings from earths and stones,
and precious metals.
SECTORAL EXPORT PERFORMANCE 2018/2019
Tea
Unfavourable weather conditions in tea
growing areas, particularly during the months
of May and June 2018, and wage related trade
union action in the plantation sector affected
the total tea production during the year.
Accordingly, total tea production decreased by
1.0 per cent to 303.8 million kilogrammes in
2018 from 307.1 million kilogrammes in 2017.
Low grown tea production, which accounts for
63.2 per cent of the total production, decreased
by 2.7 per cent to 192.0 million kilogrammes,
while the production of high grown tea and
medium grown tea increased by 1.3 per cent to
64.8 million kilogrammes and 3.0 per cent to
47.0 million kilogrammes, respectively. In the
meantime, the tea smallholder sector recorded a
decline in the average yield of made tea to
1,958 kilogrammes per hectare from 1,995
kilogrammes per hectare in 2017. Orthodox tea
and value added tea production recorded a
decline of 1.9 per cent and 1.7 per cent,
respectively, while CTC tea production
increased by 9.6 per cent during 2018. A
declining trend in tea prices was recorded from
early 2018 and continued till the end of the
year. Average auction prices of high, medium
and low grown teas at the Colombo Tea
Auction (CTA) were significantly lower than
the corresponding prices that were observed in
2017. During 2018, the average price of tea
decreased to Rs. 581.58 per kilogramme from
Rs. 620.44 per kilogrammes in 2017. The
highest year-on-year decrease in tea prices at
the CTA was observed for medium grown tea
(8.0 per cent), followed by high grown tea (6.3
per cent) and low grown tea (5.9 per cent). The
average export price (FOB) recorded a decrease
of 4.4 per cent to US dollars 5.06 per
kilogramme in 2018, compared with US dollars
5.29 per kilogramme in 2017. Meanwhile, Iraq
was price (Rs./kg) Quantity (MT '000) the
major importer of Sri Lankan tea, followed by
Turkey and Russia. Comparatively low demand
during 2018 from exporters adversely affected
tea exports. Accordingly, total tea exports
decreased by 2.3 per cent to 282.4 million
kilogrammes in 2018, compared to 289.0
million kilogrammes in the previous year.
EASL Annual Report 2018/2019 Page 35
Rubber
Rubber production declined by 0.6 per cent to
82.6 million kilogrammes in 2018 from 83.1
million kilogrammes produced in 2017.
Continuous rain in plantation areas that
prevailed during tapping days along with the
high cost of production and poor management
of plantations contributed to the drop in total
rubber production in 2018. During the first half
of 2018, rubber production showed a declining
trend, while rubber production improved
considerably thereafter, supported by
favourable weather conditions in major rubber
growing areas. The production of sheet rubber,
which accounts for about 50.0 per cent share of
total rubber production, declined by 0.5 per
cent to 41.3 million kilogrammes from 41.5
million kilogrammes in 2017. Crepe rubber
production recorded a considerable growth of
26.2 per cent to 14.5 million kilogrammes.
Production of other categories of rubber, which
accounts for 32.4 per cent of total rubber
production, declined by 11.1 per cent to 26.8
million kilogrammes, in comparison to the
previous year’s production of 30.1 million
kilogrammes. Domestic usage of rubber for
local industries increased by 5.6 per cent to
135.2 million kilogrammes in 2018.
Meanwhile, exports of raw rubber recorded a
decline of 18.9 per cent to 14.0 million
kilogrammes during 2018. Reflecting the drop
in international market prices in 2018, rubber
prices in the domestic market also showed a
declining trend during 2018. At the Colombo
Rubber Auction, the average price of Ribbed
Smoked Sheet No.1 (RSS1) declined by 8.2 per
cent to Rs. 309.09 per kilogramme, while
prices of latex crepe declined by 8.5 per cent to
Rs. 321.70 per kilogramme. Low rubber prices
in the international market and lower domestic
production resulted in an increase of raw rubber
imports from 61.8 million kilogrammes in 2017
to 65.8 million kilogrammes during 2018 to
meet the requirements on rubber based
industries in the country.
Coconut
Coconut production recovered from its
declining trend in 2018, due to the lagged effect
of favourable rainfall experienced in major
coconut growing areas in 2017. Although
coconut production that remained subdued
during the first quarter of the year, recorded an
expansion thereafter resulting in an overall
growth of 7.1 per cent to 2,623 million nuts
during 2018. Due to low supplies during the
first half of the year, production volumes of
many coconut based products decreased in
2018, compared to 2017. Accordingly,
desiccated coconut (DC) production decreased
significantly by 16.7 per cent in 2018.
Similarly, coconut oil production also declined
by 14.6 per cent in 2018, largely due to the
reduction in coconut oil production by small
and medium scale mills owing to high cost of
production. Meanwhile, palm oil imports, a
close substitute for coconut oil, increased by
11.5 per cent in 2018, induced by lower
domestic coconut oil production and the
decline in global palm oil prices. Meanwhile,
production of coconut cream, coconut milk
powder and coconut milk grew by 13.4 per cent
in 2018, reflecting high export demand for
these products. Further, production of virgin
coconut oil was also affected by limited
availability of nuts, resulting in a 13.1 per cent
decline in its production. Reflecting higher
demand from domestic manufacturers for
coconut products and increased export demand
amidst supply shortages in the world market,
coconut prices increased, particularly during
the first nine months of 2018. However, with
increased supplies in the last quarter of 2018,
EASL Annual Report 2018/2019 Page 36
the average wholesale price of coconut
declined marginally to Rs. 60.68 per nut in
2018, from Rs. 62.71 per nut in 2017. High
farmgate prices of coconut, mostly reported in
the first nine months, resulted in increasing the
retail price of coconut as well as the cost of
production of coconut based products. The
average retail price of a coconut increased to
Rs. 69.71 per nut in 2018 from Rs. 67.40 per
nut in 2017, while the average price of coconut
oil remained broadly unchanged. The average
FOB price of desiccated coconut increased to
Rs. 430.84 per kilogramme in 2018 from Rs.
387.35 per kilogramme in 2017. Meanwhile,
DC exporters were unable to harness the full
benefit of increased prices due to low domestic
production, as reflected by the decline of
around 28 per cent in DC exports during 2018.
Minor Export Crops
The performance of minor export crops
continued to weaken in 2018 as in the previous
year. Although the production of cinnamon,
cocoa, arecanut, citronella and turmeric
recorded a growth, the production of pepper,
clove, cardamom, coffee, nutmeg, betel and
ginger declined considerably during 2018,
compared to 2017. Despite the increase in
extent under minor export crops by 1.9 per
cent, total production decreased by 14.3 per
cent to 101,718 metric tons during 2018. This
decline in production was mainly due to dry
weather and the unusual shift in the rainfall
pattern in growing areas. Accordingly, pepper
production decreased by 31.9 per cent to
20,135 metric tons mainly due to unfavourable
weather conditions in major pepper growing
areas during the flowering and fruiting period.
Meanwhile, both farmgate and auction prices of
pepper dropped significantly by around 30 per
cent due to the declining trend in world market
prices and the issue due to the importation of
low quality pepper that was then re-exported
under trade agreements. However, cocoa
production improved significantly by 38.9 per
cent to 654 metric tons and cinnamon
production grew by 3.0 per cent to 23,019
metric tons during the year, supported by the
increase in the cultivation extent in recent
years. The total export volume of minor export
crops dropped by 19.6 per cent, along with an
11.3 per cent reduction in earnings to US
dollars 360.2 million during 2018, compared to
the previous year. Despite exports of many
crops such as pepper, clove, cardamom, cocoa,
betel and arecanut recording a decline in 2018,
cinnamon exports showed a continuous growth
and reached 17,537 metric tons with 5.5 per
cent increase over the previous year.
Meanwhile, the importation of minor export
crops including pepper, cocoa, turmeric and
ginger increased by 12.0 per cent and import
expenditure increased by around 8.9 per cent in
2018.
Vegetables
According to the estimates of the Department
of Census and Statistics, vegetable production
increased to 1.7 million metric tons in 2018,
registering a growth of 13.3 per cent amidst
weather related disturbances during some
periods of the year. This was supported by an
increase of 20.6 per cent in the 2017/18 Maha
season and a 4.6 per cent growth during the
2018 Yala season. Meanwhile, there were wide
fluctuations in vegetable prices throughout the
year owing to both drought and flood
conditions that prevailed in some parts of the
EASL Annual Report 2018/2019 Page 37
country. Weather related setbacks experienced
during the second quarter of 2018 resulted in
crop damages, reducing the market supply and
elevating prices of many vegetable varieties.
Meanwhile, during the third quarter of 2018,
prices increased displaying the regular seasonal
pattern, while rainy weather conditions
substantially disturbed harvesting and
transporting of vegetables during the end of the
fourth quarter of the year. However, amidst
these weather related disturbances, the supply
of vegetables increased during the peak
harvesting period of the Maha season as well as
the Yala season, thus lowering prices. During
2018, 25.8 million kilogrammes of vegetables
worth Rs. 4.6 billion were exported, while
738.2 million kilogrammes of vegetables worth
Rs. 49.1 billion were imported. Meanwhile,
pest attacks became a major issue in vegetable
cultivation, and measures are required to
address this issue in order to protect the farmers
and the consumers, as well as to increase the
sustainability of the sector
Fruits
The production of fruits increased in 2018, with
significant contributions from avocado, orange,
guava, rambutan and lime. Fruit production
recorded a significant growth of 28.8 per cent
in 2018, compared to the growth of 9.5 per cent
in the previous year. During the year, 37.3
million kilogrammes of fruits worth Rs. 6.3
billion were exported, while 78.7 million
kilogrammes of fresh fruits, including apples,
mandarins, oranges and grapes valued at Rs.
14.2 billion were imported. Fruit cultivation in
Sri Lanka is spread over 150,000 hectares,
while a large share of this extent is cultivated in
home gardens. Due to poor planning in
cultivation of fruits and lack of awareness,
contribution to national development by fruit
production still remains low. Increasing
effectiveness of fruit cultivation, ensuring
quality of products and meeting market demand
for fruits with better awareness among farmers
on ground conditions are key issues that need
to be addressed in developing this sector
Textiles & Apparel
Manufacturing of textiles, wearing apparel and
leather related products also grew by 3.6 per
cent during the year compared to 3.8 per cent
growth recorded in 2017, largely supporting the
overall growth in manufacturing activities. The
manufacture of wearing apparel, the second
largest subsector in the IIP, recorded a growth
of 3.9 per cent in 2018, compared to the growth
of 4.7 per cent registered in 2017. This growth
was partially supported by the favourable
impact of the reinstatement of the GSP+
scheme in 2017. Meanwhile, manufacturing of
textiles registered a growth of 3.6 per cent
during 2018, compared to the growth of 2.3 per
cent recorded in the previous year. Both the
wearing apparel and textiles subsectors together
contributed around 78 per cent of the overall
growth in the manufacturing sector in 2018.
Although the local apparel and textile
industries have the potential to expand further,
the lack of economies of scale, infrastructure
constraints, and high input costs are adversely
affecting the competitive strength of the
industry. Moreover, the emergence of relatively
new textile manufacturing hubs in the region
has continuously challenged Sri Lanka’s
position in a dynamic global market. Although
the reinstatement of the GSP+ scheme has
supported export demand in the recent past, the
garment industry needs to undertake
constructive measures to minimise continued
dependence on such schemes, enabling
EASL Annual Report 2018/2019 Page 38
improved resilience towards external vulnerabilities.
Fisheries
The fisheries sector witnessed a marginal
setback in 2018. Total fish production showed
a decline of 0.8 per cent to 527,060 metric tons
during 2018, compared to the marginal
expansion of 0.1 per cent recorded in 2017. The
contraction in fish production was mainly
attributed to the decline in marine fish
production. Marine fish production, which
accounts for around 83 per cent of total fish
production, witnessed a decline of 2.2 per cent
to 439,370 metric tons in 2018, largely due to
the drop in coastal and lagoon fish production.
Meanwhile, offshore fish production increased
marginally. Adverse weather conditions that
prevailed during the second quarter of 2018 in
the Western and Southern coastal areas
adversely affected the operations of the day
boats and thereby, affected marine fish
production. However, inland fish production
that contributed around 17 per cent to the total
fish production showed an increase of 7.1 per
cent to 87,690 metric tons in 2018 compared to
the previous year. The increased release of
fingerlings to tanks that was supported by the
recovery in water levels in major reservoirs in
the early part of 2018, better management of
aquaculture resources and proper monitoring
largely contributed to the improvements in the
inland fisheries sector. In 2018, around 112
million of fingerlings were produced, which is
an increase of around 35 per cent, compared to
the previous year. Meanwhile, the production
in the shrimp farms subcategory also increased
considerably during the period under review,
while the aquaculture category witnessed a
decline of 2.9 per cent to 8,490 metric tons. In
response to the decline in production, prices of
large fish varieties registered a marginal
increase of 0.7 per cent, while small fish
varieties recorded an increase of 15.2 per cent
during 2018, in comparison to the previous
year. In the meantime, export earnings from
fish products in terms of value, witnessed an
increase of 10.5 per cent to US dollars 265.8
million and 6.6 per cent in terms of volume to
25,949 metric tons during 2018, reflecting the
continued positive impact of the removal of the
ban on fish exports to the EU market.
Meanwhile, fish imports witnessed a decline of
20.4 per cent to 84,206 metric tons in 2018
from 105,745 metric tons recorded in 2017.
from 382,421 in 2017 to 428,108 in 2018,
while local production of broiler parents
increased to 1.1 million during 2018, compared
to 1.0 million in 2017. Meanwhile, pork
production increased by 32.2 per cent to 10,430
metric tons, while mutton production increased
by 14.8 per cent to 1,630 metric tons in 2018.
However, beef production decreased by 5.7 per
cent to 28,420 metric tons in 2018 from 30,130
metric tons recorded in 2017.
EASL Annual Report 2018/2019 Page 39
EXPORTERS’ ASSOCIATION OF SRI LANKA
FINANCE STATEMENTS
FOR THE YEAR ENDED
31 MARCH 2019
![FISCAL INCENTIVES AVAILABLE TO SRI LANKAN …€¦ · FISCAL INCENTIVES AVAILABLE TO SRI LANKAN EXPORTERS [NON-BOI] Prepared by: Export Development Board (EDB), Sri Lanka August,](https://img.pdfslide.net/doc/110x75/5ad4d0527f8b9a571e8cb5f3/fiscal-incentives-available-to-sri-lankan-fiscal-incentives-available-to-sri.jpg)