Embed Size (px)
Citation preview
Extending the Lifetime of Organic Flow Batteries via Redox StateManagementMarc-Antoni Goulet,†,∥,⊥ Liuchuan Tong,‡,∥ Daniel A. Pollack,§ Daniel P. Tabor,‡
Susan A. Odom,†,∇ Alan Aspuru-Guzik,‡,¶ Eugene E. Kwan,*,‡ Roy G. Gordon,*,†,‡
and Michael J. Aziz*,†
†Harvard John A. Paulson School of Engineering and Applied Sciences, Harvard University, Cambridge, Massachusetts 02138,United States‡Department of Chemistry and Chemical Biology, Harvard University, Cambridge, Massachusetts 02138, United States§Department of Physics, Harvard University, Cambridge, Massachusetts 02138, United States∇Department of Chemistry, University of Kentucky, Lexington, Kentucky 40506, United States
*S Supporting Information
ABSTRACT: Redox flow batteries based on quinone-bearing aqueous electrolytes have emerged as promisingsystems for energy storage from intermittent renewablesources. The lifetime of these batteries is limited byquinone stability. Here, we confirm that 2,6-dihydroxyan-thrahydroquinone tends to form an anthrone intermediatethat is vulnerable to subsequent irreversible dimerization.We demonstrate quantitatively that this decompositionpathway is responsible for the loss of battery capacity.Computational studies indicate that the driving force foranthrone formation is greater for anthraquinones withlower reduction potentials. We show that the decom-position can be substantially mitigated. We demonstratethat conditions minimizing anthrone formation andavoiding anthrone dimerization slow the capacity lossrate by over an order of magnitude. We anticipate that thismitigation strategy readily extends to other anthraqui-none-based flow batteries and is thus an important steptoward realizing renewable electricity storage throughlong-lived organic flow batteries.
The cost of electricity generated from renewable sourcessuch as the sun and wind has become competitive with
electricity derived from fossil fuels.1 Nonetheless, the wide-spread adoption of intermittent renewable electricity requiresnew methods for the reliable storage and delivery of electricityover long periods when these sources are unavailable forgeneration.2−4 Redox flow batteries (RFBs), whose energy andpower capabilities can be scaled independently, may enablecost-effective long-duration discharge.4−9
The all-vanadium redox flow battery chemistry is currentlythe most technologically developed but may not access muchof the grid storage market due to electrolyte costconstraints.6,9−13 Emerging organic electrolytes comprisingcheaper earth-abundant elements may address this limita-tion.14−39 However, organic electrolytes are more prone tomolecular decomposition, which can lead to a progressive lossof charge storage capacity. Although several studies haveproposed decomposition pathways, such as Michael addi-
tion,19,22,31,40,41 nucleophilic substitution,25,31,34 electrophilicaromatic substitution,39 ring-opening,17 and disproportiona-tion,25,33,37 none of these pathways have been linkedquantitatively to capacity fade.Here we identify irreversible dimerization as the mechanism
of capacity loss in a RFB utilizing the inexpensive redoxcouples of 2,6-dihydroxyanthraquinone (DHAQ) and potas-sium salts of iron hexacyanide (Fe(CN)6). We furtherdemonstrate that capacity loss can be suppressed throughsimple modifications of the battery operating conditions.Under ideal conditions, discharging a flow battery involves
the reversible oxidation and concurrent reduction of the lowpotential (negolyte) and high potential (posolyte) activespecies, respectively. In a DHAQ/Fe(CN)6 flow battery, thereactions and potentials vs SHE are16
+ −− − −Negolyte: DHAQ 2e DHAHQ 680 mV; (pH 14)2 4F
[ ] + [ ] +− − −Posolyte: Fe(CN) e Fe(CN) 510 mV63
64F
In practice, decomposition of the negolyte active species causesthe battery capacity to fade at ∼5−8%/day. As this rate limitsthe lifetime to the order of 1 week, identifying and inhibitingthe mechanism of capacity loss is critical for the battery toapproach the decadal service life that will be necessary forlarge-scale grid storage applications.42
■ RESULTS AND DISCUSSIONTo identify the chemical origin of negolyte active species deg-radation,43 we cycled a sample of DHAQ electrolyte repeatedlyover the course of several days in a symmetric cell and analyzedits composition (Figure S1). In addition to deprotonated formsof DHAQ and its intended reduction product, dihydroxyan-thrahydroquinone (DHAHQ), we identified the decomposi-tion products 2,6-dihydroxyanthrone (DHA) and its dimers((DHA)2) (see Scheme 1).The identification of DHA was enabled by precisely
controlling cycling conditions (Figure S2). The structure ofDHA was suggested by high resolution mass spectrometry and
Received: December 22, 2018Published: April 4, 2019
Communication
pubs.acs.org/JACSCite This: J. Am. Chem. Soc. XXXX, XXX, XXX−XXX
© XXXX American Chemical Society A DOI: 10.1021/jacs.8b13295J. Am. Chem. Soc. XXXX, XXX, XXX−XXX
Dow
nloa
ded
via
HA
RV
AR
D U
NIV
on
May
5, 2
019
at 2
3:41
:40
(UT
C).
Se
e ht
tps:
//pub
s.ac
s.or
g/sh
arin
ggui
delin
es f
or o
ptio
ns o
n ho
w to
legi
timat
ely
shar
e pu
blis
hed
artic
les.

confirmed by an exact match to the 1H NMR spectrum andHPLC retention time of an authentic sample (Figures S3−S5).When samples containing DHA were subjected to electro-chemical oxidation (Figure S6), mass spectrometric peakscorresponding to (DHA)2 were observed (Figure S7). Theassignment of (DHA)2 was confirmed by the isolation of puresamples by preparative HPLC and subsequent NMR analysis(Figures S8 and S9).Beck and Heydecke observed anthrone formation during
electrochemical reduction of unsubstituted anthraquinoneunder highly acidic conditions and proposed homogeneousdisproportionation as the mechanism by which this trans-formation occurs.44 Two observations suggest that DHAHQ inalkaline solution undergoes disproportionation as well. First,increasing the reduction overpotential beyond the potentialrequired to reduce DHAQ to DHAHQ does not increase therate of capacity loss.43 Additionally, increasing proportions ofDHA are formed when DHAHQ is held away from theelectrodes in a sealed vial for increasing durations (FigureS10). This disproportionation would occur according to thefollowing proposed reaction:
+ → + +− − − −2DHAHQ 2H O DHAQ DHA 3OH42
2 3
Under the highly alkaline conditions within the negolytecompartment (Figure S11), facile one-electron oxidation of theDHA carbanion, followed by radical dimerization, would leadto (DHA)2. Indeed, pure samples of DHA are completely andirreversibly converted to (DHA)2 when subjected to electro-chemical oxidation under alkaline and anaerobic conditions(Figure S12). However, under aerobic conditions, oxidation ofDHA back to DHAQ can be favored over dimerization(Figures 1A and S13), particularly at low DHA concentration(Figures S14 and S15). Precedents for the oxidation ofanthrone species to anthraquinone and dianthrone species maybe found in refs 45−56.The irreversible conversion of DHAHQ to (DHA)2 has a
deleterious effect on battery operation due to the replacementof the anthraquinone moiety with a benzophenone functionalgroup (Figures 1B and S16A). Although (DHA)2 is also redox-active, its use in a RFB is impractical for several reasons. First,the higher reduction potential of (DHA)2 with respect to
DHAQ (Figure 1B) decreases the overall potential of thebattery prohibitively.11 Second, even with strong over-potentials, cycling accesses only two electrons per molecule(Figure S16B). Thus, at twice the molecular weight of DHAQ,(DHA)2 has half the capacity by mass. Finally, (DHA)2 isunstable at pH 14 (Figure S17). These findings indicate thatthe conversion of DHAQ to (DHA)2 engenders a progressiveloss of battery capacity.To establish that irreversible dimerization is the primary
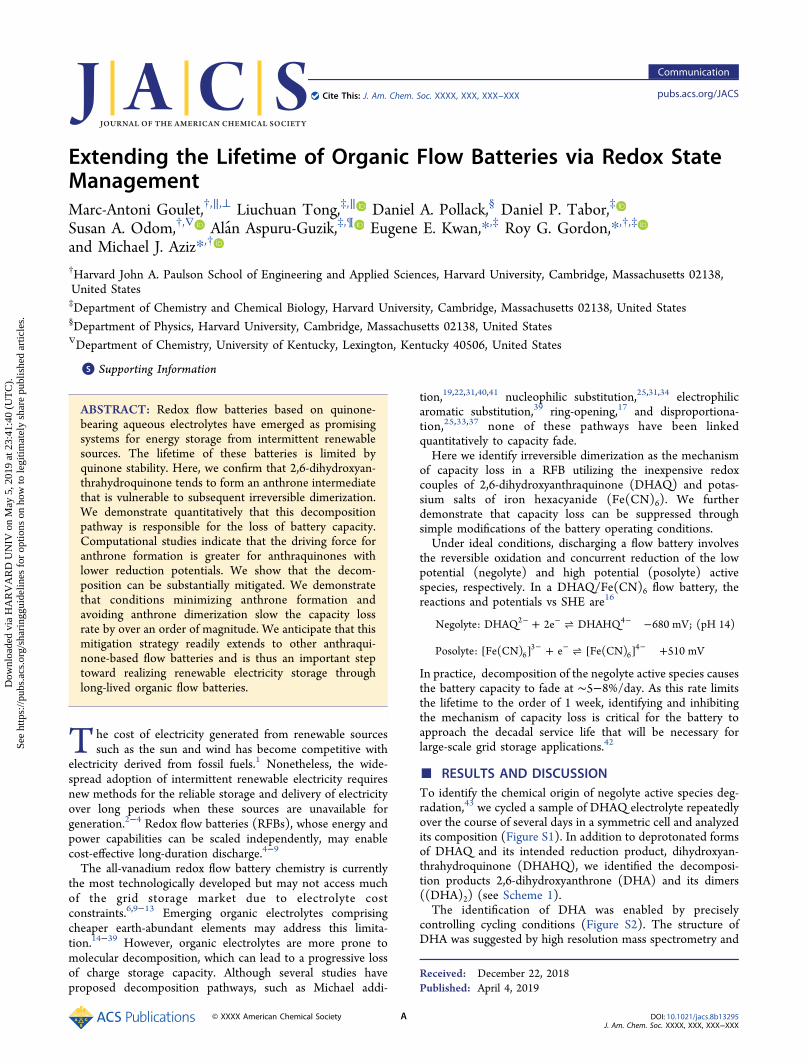
mechanism of capacity loss, we quantitatively correlated thedecrease in concentrations of DHAQ and DHAHQ with theextent of capacity loss. We subjected a typical flow batterycontaining 0.1 M DHAQ/DHAHQ to symmetric cell-cyclingat pH 14 (8 cycles over ∼5 h). When cycling was stopped andthe capacity-limiting side held in a reduced state for 43 h, thebattery capacity decreased by 15% (Figure 2) when correctedfor aliquot volume removal. When cycling with ±350 mVdischarge overpotential was resumed, the first oxidativedischarge half-cycle included the transient capacity associatedwith the irreversible conversion of DHA to (DHA)2.
1H NMRanalysis of an aliquot of negolyte removed after aging revealedthat the total concentration of DHAQ had declined by 16%.This decrease was mass-balanced by an increase in DHA
Scheme 1. Intended Operation and Decomposition Pathwayof a DHAQ/Fe(CN)6 Flow Batterya
aDHA is depicted in its presumed protonation state at pH 14 asDHA3−.
Figure 1. (A) Cyclic voltammetry of 10 mM synthesized DHA at pH14 under a nitrogen atmosphere. After aeration, redox activity isrecovered through conversion of DHA to DHAQ. A separate 10 mMDHAQ sample is shown for comparison. (B) (DHA)2 has a higherredox potential than DHAQ, which leads to poor battery perform-ance. Cyclic voltammograms were obtained separately for DHAQ and(DHA)2, both at 5 mM in 1 M KOH. The (DHA)2 sample containeda ∼5% DHAQ impurity.
Journal of the American Chemical Society Communication
DOI: 10.1021/jacs.8b13295J. Am. Chem. Soc. XXXX, XXX, XXX−XXX
B
concentration of 16% (as determined by NMR analysis). Bothquantities correspond well to the observed loss in capacity of15%. In addition, all of the DHA formed was measurablyconverted to (DHA)2 (Figures S18−S20). These observationsstrongly implicate anthrone formation and subsequentdimerization as the primary source of capacity loss. Anthroneand dianthrone species have also been reported to be productsof the chemical reduction of anthraquinones and of theelectrochemical reduction of anthraquinones in acidic aqueoussolutions.44,57−65
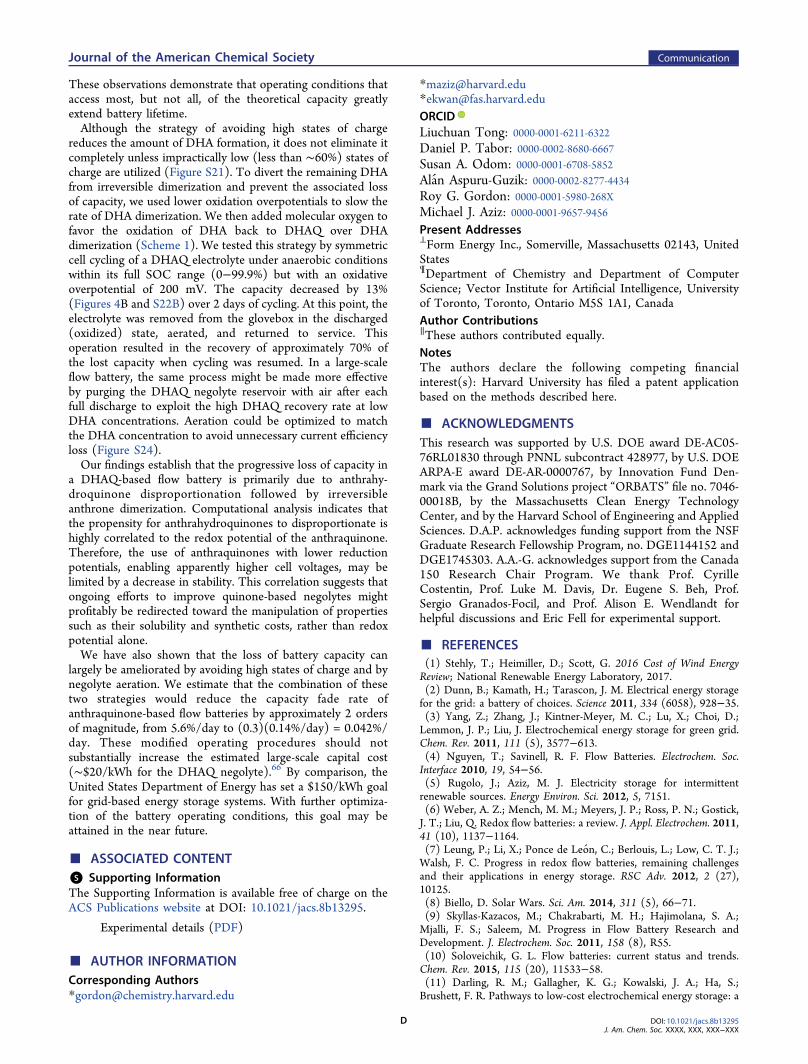
The finding that irreversible dimerization is linked to theredox chemistry of anthraquinones may limit the ongoingsearch for quinones with lower potentials. This is because anydecrease in the reduction potential of the quinone/hydro-quinone couple may simultaneously increase the propensity forthe hydroquinone to disproportionate into anthrone andquinone. This hypothesis is supported both by calculations(Figure 3; PM7/COSMO on a subset of molecules from ref41) and the experimental properties of 4,4′-((9,10-anthraqui-none-2,6-diyl)dioxy)dibutyrate (2,6-DBEAQ).34 This negolyteactive species has a reduction potential that is 180 mV higher
than that of DHAQ and is approximately 100 times morestable in terms of RFB lifetime.34 In addition to the associateddecrease in battery voltage that this higher reduction potentialentails, 2,6-DBEAQ is synthesized from DHAQ, increasing itscost.34 Strategies that can increase the lifetime of anthraqui-nones independently of their redox potential would thereforebe valuable.Two simple changes to the operating conditions of the
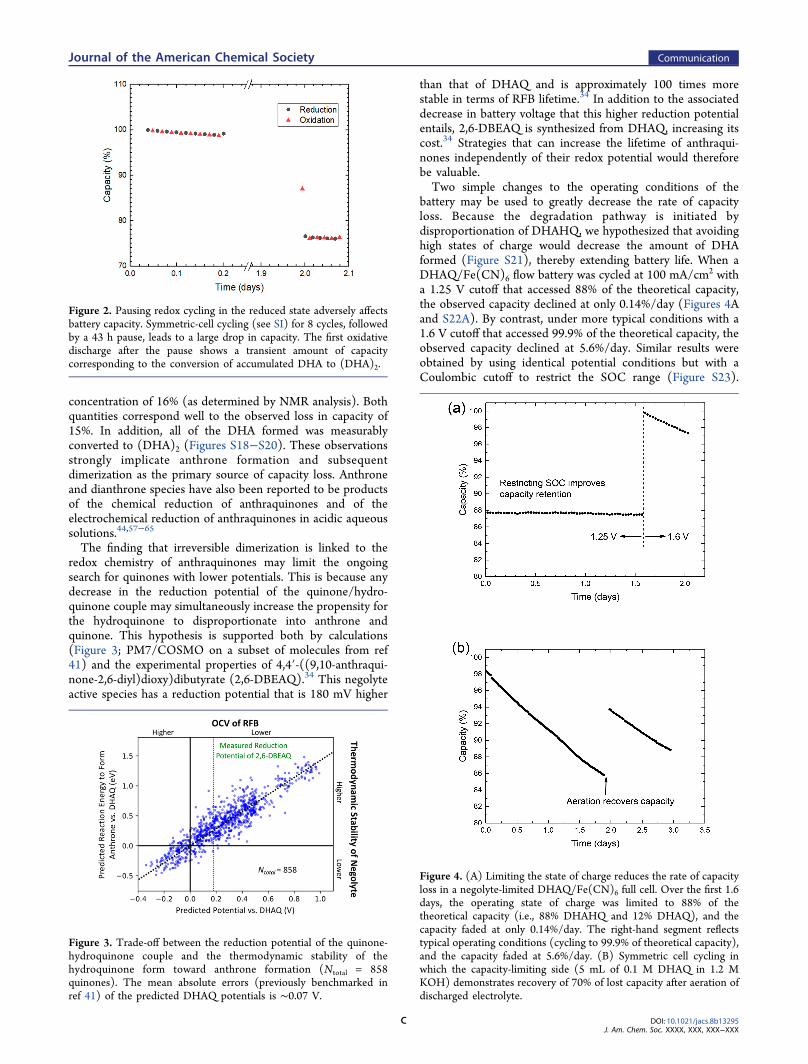
battery may be used to greatly decrease the rate of capacityloss. Because the degradation pathway is initiated bydisproportionation of DHAHQ, we hypothesized that avoidinghigh states of charge would decrease the amount of DHAformed (Figure S21), thereby extending battery life. When aDHAQ/Fe(CN)6 flow battery was cycled at 100 mA/cm2 witha 1.25 V cutoff that accessed 88% of the theoretical capacity,the observed capacity declined at only 0.14%/day (Figures 4Aand S22A). By contrast, under more typical conditions with a1.6 V cutoff that accessed 99.9% of the theoretical capacity, theobserved capacity declined at 5.6%/day. Similar results wereobtained by using identical potential conditions but with aCoulombic cutoff to restrict the SOC range (Figure S23).
Figure 2. Pausing redox cycling in the reduced state adversely affectsbattery capacity. Symmetric-cell cycling (see SI) for 8 cycles, followedby a 43 h pause, leads to a large drop in capacity. The first oxidativedischarge after the pause shows a transient amount of capacitycorresponding to the conversion of accumulated DHA to (DHA)2.
Figure 3. Trade-off between the reduction potential of the quinone-hydroquinone couple and the thermodynamic stability of thehydroquinone form toward anthrone formation (Ntotal = 858quinones). The mean absolute errors (previously benchmarked inref 41) of the predicted DHAQ potentials is ∼0.07 V.
Figure 4. (A) Limiting the state of charge reduces the rate of capacityloss in a negolyte-limited DHAQ/Fe(CN)6 full cell. Over the first 1.6days, the operating state of charge was limited to 88% of thetheoretical capacity (i.e., 88% DHAHQ and 12% DHAQ), and thecapacity faded at only 0.14%/day. The right-hand segment reflectstypical operating conditions (cycling to 99.9% of theoretical capacity),and the capacity faded at 5.6%/day. (B) Symmetric cell cycling inwhich the capacity-limiting side (5 mL of 0.1 M DHAQ in 1.2 MKOH) demonstrates recovery of 70% of lost capacity after aeration ofdischarged electrolyte.
Journal of the American Chemical Society Communication
DOI: 10.1021/jacs.8b13295J. Am. Chem. Soc. XXXX, XXX, XXX−XXX
C
These observations demonstrate that operating conditions thataccess most, but not all, of the theoretical capacity greatlyextend battery lifetime.Although the strategy of avoiding high states of charge
reduces the amount of DHA formation, it does not eliminate itcompletely unless impractically low (less than ∼60%) states ofcharge are utilized (Figure S21). To divert the remaining DHAfrom irreversible dimerization and prevent the associated lossof capacity, we used lower oxidation overpotentials to slow therate of DHA dimerization. We then added molecular oxygen tofavor the oxidation of DHA back to DHAQ over DHAdimerization (Scheme 1). We tested this strategy by symmetriccell cycling of a DHAQ electrolyte under anaerobic conditionswithin its full SOC range (0−99.9%) but with an oxidativeoverpotential of 200 mV. The capacity decreased by 13%(Figures 4B and S22B) over 2 days of cycling. At this point, theelectrolyte was removed from the glovebox in the discharged(oxidized) state, aerated, and returned to service. Thisoperation resulted in the recovery of approximately 70% ofthe lost capacity when cycling was resumed. In a large-scaleflow battery, the same process might be made more effectiveby purging the DHAQ negolyte reservoir with air after eachfull discharge to exploit the high DHAQ recovery rate at lowDHA concentrations. Aeration could be optimized to matchthe DHA concentration to avoid unnecessary current efficiencyloss (Figure S24).Our findings establish that the progressive loss of capacity in
a DHAQ-based flow battery is primarily due to anthrahy-droquinone disproportionation followed by irreversibleanthrone dimerization. Computational analysis indicates thatthe propensity for anthrahydroquinones to disproportionate ishighly correlated to the redox potential of the anthraquinone.Therefore, the use of anthraquinones with lower reductionpotentials, enabling apparently higher cell voltages, may belimited by a decrease in stability. This correlation suggests thatongoing efforts to improve quinone-based negolytes mightprofitably be redirected toward the manipulation of propertiessuch as their solubility and synthetic costs, rather than redoxpotential alone.We have also shown that the loss of battery capacity can
largely be ameliorated by avoiding high states of charge and bynegolyte aeration. We estimate that the combination of thesetwo strategies would reduce the capacity fade rate ofanthraquinone-based flow batteries by approximately 2 ordersof magnitude, from 5.6%/day to (0.3)(0.14%/day) = 0.042%/day. These modified operating procedures should notsubstantially increase the estimated large-scale capital cost(∼$20/kWh for the DHAQ negolyte).66 By comparison, theUnited States Department of Energy has set a $150/kWh goalfor grid-based energy storage systems. With further optimiza-tion of the battery operating conditions, this goal may beattained in the near future.
■ ASSOCIATED CONTENT*S Supporting InformationThe Supporting Information is available free of charge on theACS Publications website at DOI: 10.1021/jacs.8b13295.
Experimental details (PDF)
■ AUTHOR INFORMATIONCorresponding Authors*[email protected]
*[email protected]*[email protected] Tong: 0000-0001-6211-6322Daniel P. Tabor: 0000-0002-8680-6667Susan A. Odom: 0000-0001-6708-5852Alan Aspuru-Guzik: 0000-0002-8277-4434Roy G. Gordon: 0000-0001-5980-268XMichael J. Aziz: 0000-0001-9657-9456Present Addresses⊥Form Energy Inc., Somerville, Massachusetts 02143, UnitedStates¶Department of Chemistry and Department of ComputerScience; Vector Institute for Artificial Intelligence, Universityof Toronto, Toronto, Ontario M5S 1A1, CanadaAuthor Contributions∥These authors contributed equally.NotesThe authors declare the following competing financialinterest(s): Harvard University has filed a patent applicationbased on the methods described here.
■ ACKNOWLEDGMENTSThis research was supported by U.S. DOE award DE-AC05-76RL01830 through PNNL subcontract 428977, by U.S. DOEARPA-E award DE-AR-0000767, by Innovation Fund Den-mark via the Grand Solutions project “ORBATS” file no. 7046-00018B, by the Massachusetts Clean Energy TechnologyCenter, and by the Harvard School of Engineering and AppliedSciences. D.A.P. acknowledges funding support from the NSFGraduate Research Fellowship Program, no. DGE1144152 andDGE1745303. A.A.-G. acknowledges support from the Canada150 Research Chair Program. We thank Prof. CyrilleCostentin, Prof. Luke M. Davis, Dr. Eugene S. Beh, Prof.Sergio Granados-Focil, and Prof. Alison E. Wendlandt forhelpful discussions and Eric Fell for experimental support.
■ REFERENCES(1) Stehly, T.; Heimiller, D.; Scott, G. 2016 Cost of Wind EnergyReview; National Renewable Energy Laboratory, 2017.(2) Dunn, B.; Kamath, H.; Tarascon, J. M. Electrical energy storagefor the grid: a battery of choices. Science 2011, 334 (6058), 928−35.(3) Yang, Z.; Zhang, J.; Kintner-Meyer, M. C.; Lu, X.; Choi, D.;Lemmon, J. P.; Liu, J. Electrochemical energy storage for green grid.Chem. Rev. 2011, 111 (5), 3577−613.(4) Nguyen, T.; Savinell, R. F. Flow Batteries. Electrochem. Soc.Interface 2010, 19, 54−56.(5) Rugolo, J.; Aziz, M. J. Electricity storage for intermittentrenewable sources. Energy Environ. Sci. 2012, 5, 7151.(6) Weber, A. Z.; Mench, M. M.; Meyers, J. P.; Ross, P. N.; Gostick,J. T.; Liu, Q. Redox flow batteries: a review. J. Appl. Electrochem. 2011,41 (10), 1137−1164.(7) Leung, P.; Li, X.; Ponce de Leon, C.; Berlouis, L.; Low, C. T. J.;Walsh, F. C. Progress in redox flow batteries, remaining challengesand their applications in energy storage. RSC Adv. 2012, 2 (27),10125.(8) Biello, D. Solar Wars. Sci. Am. 2014, 311 (5), 66−71.(9) Skyllas-Kazacos, M.; Chakrabarti, M. H.; Hajimolana, S. A.;Mjalli, F. S.; Saleem, M. Progress in Flow Battery Research andDevelopment. J. Electrochem. Soc. 2011, 158 (8), R55.(10) Soloveichik, G. L. Flow batteries: current status and trends.Chem. Rev. 2015, 115 (20), 11533−58.(11) Darling, R. M.; Gallagher, K. G.; Kowalski, J. A.; Ha, S.;Brushett, F. R. Pathways to low-cost electrochemical energy storage: a
Journal of the American Chemical Society Communication
DOI: 10.1021/jacs.8b13295J. Am. Chem. Soc. XXXX, XXX, XXX−XXX
D
comparison of aqueous and nonaqueous flow batteries. EnergyEnviron. Sci. 2014, 7 (11), 3459−3477.(12) Winsberg, J.; Hagemann, T.; Janoschka, T.; Hager, M. D.;Schubert, U. S. Redox-Flow Batteries: From Metals to OrganicRedox-Active Materials. Angew. Chem. Int. Ed. 2017, 56 (3), 686−711.(13) Huskinson, B.; Rugolo, J.; Mondal, S. K.; Aziz, M. J. A HighPower Density, High Efficiency Hydrogen-Chlorine RegenerativeFuel Cell with a Low Precious Metal Content Catalyst. EnergyEnviron. Sci. 2012, 5 (9), 8690.(14) Huskinson, B.; Marshak, M. P.; Suh, C.; Er, S.; Gerhardt, M. R.;Galvin, C. J.; Chen, X.; Aspuru-Guzik, A.; Gordon, R. G.; Aziz, M. J. Ametal-free organic-inorganic aqueous flow battery. Nature 2014, 505(7482), 195−8.(15) Janoschka, T.; Martin, N.; Martin, U.; Friebe, C.; Morgenstern,S.; Hiller, H.; Hager, M. D.; Schubert, U. S. An aqueous, polymer-based redox-flow battery using non-corrosive, safe, and low-costmaterials. Nature 2015, 527, 78−81.(16) Lin, K.; Chen, Q.; Gerhardt, M. R.; Tong, L.; Kim, S. B.;Eisenach, L.; Valle, A. W.; Hardee, D.; Gordon, R. G.; Aziz, M. J.;Marshak, M. P. Alkaline quinone flow battery. Science 2015, 349(6255), 1529.(17) Lin, K.; Gomez-Bombarelli, R.; Beh, E. S.; Tong, L.; Chen, Q.;Valle, A.; Aspuru-Guzik, A.; Aziz, M. J.; Gordon, R. G. A redox-flowbattery with an alloxazine-based organic electrolyte. Nature Energy2016, 1 (9), 16102.(18) Orita, A.; Verde, M. G.; Sakai, M.; Meng, Y. S. A biomimeticredox flow battery based on flavin mononucleotide. Nat. Commun.2016, 7 (1), 13230.(19) Hoober-Burkhardt, L.; Krishnamoorthy, S.; Yang, B.; Murali,A.; Nirmalchandar, A.; Surya Prakash, G. K.; Narayanan, S. R. A newMichael-reaction-resistant benzoquinone for aqueous organic redoxflow batteries. J. Electrochem. Soc. 2017, 164 (4), A600−A607.(20) Liu, T.; Wei, X.; Nie, Z.; Sprenkle, V.; Wang, W. A TotalOrganic Aqueous Redox Flow Battery Employing a Low Cost andSustainable Methyl Viologen Anolyte and 4-HO-TEMPO Catholyte.Adv. Energy Mater. 2016, 6 (3), 1501449.(21) Yang, B.; Hoober-Burkhardt, L.; Wang, F.; Surya Prakash, G.K.; Narayanan, S. R. An inexpensive aqueous flow battery for large-scale electrical energy storage based on water-soluble organic redoxcouples. J. Electrochem. Soc. 2014, 161, A1371−A1380.(22) Yang, B.; Hoober-Burkhardt, L.; Krishnamoorthy, S.; Murali,A.; Surya Prakash, G. K.; Narayanan, S. R. High-PerformanceAqueous Organic Flow Battery with Quinone-Based Redox Couplesat Both Electrodes. J. Electrochem. Soc. 2016, 163, A1442−A1449.(23) Janoschka, T.; Martin, N.; Hager, M. D.; Schubert, U. S. AnAqueous Redox-Flow Battery with High Capacity and Power: TheTEMPTMA/MV System. Angew. Chem. Int. Ed. 2016, 55, 14427−14430.(24) Hu, B.; DeBruler, C.; Rhodes, Z.; Liu, T. L. Long-CyclingAqueous Organic Redox Flow Battery (AORFB) toward Sustainableand Safe Energy Storage. J. Am. Chem. Soc. 2017, 139 (3), 1207−1214.(25) Beh, E. S.; De Porcellinis, D.; Gracia, R. L.; Xia, K. T.; Gordon,R. G.; Aziz, M. J. A neutral pH aqueous organic−organometallic redoxflow battery with extremely high capacity retention. ACS Energy Lett.2017, 2 (3), 639−644.(26) DeBruler, C.; Hu, B.; Moss, J.; Liu, X.; Luo, J.; Sun, Y.; Liu, T.L. Designer two-electron storage viologen anolyte materials forneutral aqueous organic redox flow batteries. Chem. 2017, 3, 961−978.(27) Janoschka, T.; Morgenstern, S.; Hiller, H.; Friebe, C.;Wolkersdorfer, K.; Haupler, B.; Hager, M. D.; Schubert, U. S.Synthesis and characterization of TEMPO- and viologen- polymersfor water-based redox-flow batteries. Polym. Chem. 2015, 6 (45),7801−7811.(28) Winsberg, J.; Stolze, C.; Muench, S.; Liedl, F.; Hager, M. D.;Schubert, U. S. TEMPO/phenazine combi-molecule: a redox-activematerial for symmetric aqueous redox-flow batteries. ACS Energy Lett.2016, 1 (5), 976−980.
(29) Hollas, A.; Wei, X.; Murugesan, V.; Nie, Z.; Li, B.; Reed, D.;Liu, J.; Sprenkle, V.; Wang, W. A biomimetic high-capacity phenazine-based anolyte for aqueous organic redox flow batteries. Nature Energy2018, 3 (6), 508−514.(30) Li, Z.; Li, S.; Liu, S.; Huang, K.; Fang, D.; Wang, F.; Peng, S.Electrochemical Properties of an All-Organic Redox Flow BatteryUsing 2,2,6,6-Tetramethyl-1-Piperidinyloxy and N-Methylphthali-mide. Electrochem. Solid-State Lett. 2011, 14 (12), A171.(31) Wedege, K.; Drazevic, E.; Konya, D.; Bentien, A. OrganicRedox Species in Aqueous Flow Batteries: Redox Potentials, ChemicalStability and Solubility. Sci. Rep. 2016, 6, 39101.(32) Xu, Y.; Wen, Y. H.; Cheng, J.; Cao, G. P.; Yang, Y. S. A study oftiron in aqueous solutions for redox flow battery application.Electrochim. Acta 2010, 55 (3), 715−720.(33) Orita, A.; Verde, M. G.; Sakai, M.; Meng, Y. S. The impact ofpH on side reactions for aqueous redox flow batteries based onnitroxyl radical compounds. J. Power Sources 2016, 321, 126−134.(34) Kwabi, D. G.; Lin, K.; Ji, Y.; Kerr, E. F.; Goulet, M.-A.; DePorcellinis, D.; Tabor, D. P.; Pollack, D. A.; Aspuru-Guzik, A.;Gordon, R. G.; Aziz, M. J. Alkaline quinone flow battery with longlifetime at pH 12. Joule 2018, 2, 1907.(35) Luo, J.; Hu, B.; DeBruler, C.; Liu, T. A “π-ConjugationExtended Viologen” as Novel Two-Electron Storage Anolyte for TotalOrganic Aqueous Redox Flow Battery. Angew. Chem. Int. Ed. 2018, 57(1), 231−235.(36) DeBruler, C.; Hu, B.; Moss, J.; Luo, J.; Liu, T. L. A sulfonate-functionalized viologen enabling neutral cation exchange, aqueousorganic redox flow batteries toward renewable energy storage. ACSEnergy Lett. 2018, 3 (3), 663−668.(37) Hu, B.; Tang, Y.; Luo, J.; Grove, G.; Guo, Y.; Liu, T. ImprovedRadical Stability of Viologen Anolyte in Aqueous Organic Redox FlowBattery. Chem. Commun. 2018, 54, 6871.(38) Hu, B.; Liu, T. L. Two electron utilization of methyl viologenanolyte in nonaqueous organic redox flow battery. J. Energy Chem.2018, 27 (5), 1326−1332.(39) Murali, A.; Nirmalchandar, A.; Krishnamoorthy, S.; Hoober-Burkhardt, L.; Yang, B.; Soloveichik, G. L.; Surya Prakash, G. K.;Narayanan, S. R. Understanding and mitigating capacity fade inaqueous organic redox flow batteries. J. Electrochem. Soc. 2018, 165(7), A1193.(40) Xu, Y.; Wen, Y. H.; Cheng, J.; Cao, G. P.; Yang, Y. S.Electrochemical Reaction Mechanism of Tiron in Acidic AqueousSolution. Adv. Mater. Res. 2011, 396−398, 1730−1735.(41) Tabor, D. P.; Gomez-Bombarelli, R.; Tong, L.; Gordon, R. G.;Aziz, M. J.; Aspuru-Guzik, A. Theoretical and ExperimentalInvestigation of the Stability Limits of Quinones in Aqueous Media:Implications for Organic Aqueous Redox Flow Batteries. ChemRxiv2018, DOI: 10.26434/chemrxiv.6990053.v2.(42) Perry, M. L.; Weber, A. Z. Advanced Redox-Flow Batteries: APerspective. J. Electrochem. Soc. 2016, 163 (1), A5064−A5067.(43) Goulet, M.-A.; Aziz, M. J. Flow Battery Molecular ReactantStability Determined by Symmetric Cell Cycling Methods. J.Electrochem. Soc. 2018, 165 (7), A1466−A1477.(44) Beck, F.; Heydecke, G. On the Mechanism of the CathodicReduction of Anthraquinone to Anthrone. Berichte der Bunsengesell-schaft fur physikalische Chemie 1987, 91 (1), 37−43.(45) Serdyuk, A. A.; Kasianchuk, M. G.; Opeida, I. A. Kinetics ofAmine Catalysed Oxidation of Anthrone by Oxygen in AproticSolvents. Russ. J. Phys. Chem. A 2010, 84 (3), 391−394.(46) Iwata, M.; Kuzuhara, H. Oxidation of Anthracenols andAnthrone to Anthraquinones with Oxygen Mediated by Copper(II)Ion and Imidazole. Bull. Chem. Soc. Jpn. 1985, 58, 1609−1610.(47) Cavey, D.; Caron, J.-C.; Shroot, B. Anthralin: Chemicalinstability and glucose-6-phosphate dehydrogenase inhibition. J.Pharm. Sci. 1982, 71 (9), 980−983.(48) Muller, K.; Eibler, E.; Mayer, K. K.; Wiegrebe, W.; Klug, G.Dithranol, Singlet Oxygen and Unsaturated Fatty Acids. Arch. Pharm.1986, 319, 2−9.
Journal of the American Chemical Society Communication
DOI: 10.1021/jacs.8b13295J. Am. Chem. Soc. XXXX, XXX, XXX−XXX
E
(49) Segal, A.; Katz, C.; Van Duuren, B. L. Structure and tumor-promoting activity of anthralin (1, 8-dihydroxy-9-anthrone) andrelated compounds. J. Med. Chem. 1971, 14 (12), 1152−1154.(50) Martinmaa, J.; Vanhala, L.; Mustakallio, K. K. Free radicalintermediates produced by autoxidation of 1,8-dihydroxy-9-anthrone(dithranol) in pyridine. Experientia 1978, 34, 872−873.(51) Davies, A. G.; Hawari, J. A.-A.; Whitefield, M. Generation andE.S.R. spectrum of the 1,8-dihydroxy-9-Anthron-10-yl radical.Tetrahedron Lett. 1983, 24 (41), 4465−4468.(52) Geiger, W. 1,8-Dihydroxyanthrone and two isomeric 1,1’,8,8’-Tetrahydroxy-10,10’-bianthrones. Chem. Ber. 1974, 107 (9), 2976−2984.(53) Dabestani, R.; Hall, R. D.; Sik, R. H.; Chignell, C. F.Spectroscopic studies of cutaneous photosensitizing agents−XV.anthralin and its oxidation product 1,8-dihydroxyanthraquinone.Photochem. Photobiol. 1990, 52 (5), 961−971.(54) Majeski, E. J.; Stuart, J. D.; Ohnesorge, W. E. ControlledPotential Oxidation of Anthracene in Acetonitrile. J. Am. Chem. Soc.1968, 90 (3), 633−636.(55) Fujii, I.; Chen, Z.-G.; Ebizuka, Y.; Sankawa, U. Identification ofemodinanthrone oxygenase in fungus Aspergillus terreus. Biochem. Int.1991, 25 (6), 1043−1049.(56) Chung, J.-y.; Fujii, I.; Harada, S.; Sankawa, U.; Ebizuka, Y.Expression, Purification, and Characterization of AknX AnthroneOxygenase, Which Is Involved in Aklavinone Biosynthesis inStreptomyces galilaeus. J. Bacteriol. 2002, 184 (22), 6115−6122.(57) Wendlandt, A. E.; Stahl, S. S. Quinones in Hydrogen PeroxideSynthesis and Catalytic Aerobic Oxidation Reactions. In Liquid PhaseAerobic Oxidation Catalysis: Industrial Applications and AcademicPerspectives, 1st ed.; Stahl, S. S., Alsters, P. L., Eds.; Wiley-VCH VerlagGmbH & Co. KGaA: Weinheim, Germany, 2016; pp 221−237.(58) Perkin, A. G.; Whattam, T. W. XXXVI.Some products of thereduction of 2-hydroxyanthraquinone. J. Chem. Soc., Trans. 1922, 121,289−300.(59) Goodall, F. L.; Perkin, A. G. LVIII.Reduction products of thehydroxyanthraquinones. Part V. J. Chem. Soc., Trans. 1924, 125, 470−476.(60) Comninellis, C.; Plattner, E. The electrochemical reduction ofanthraquinone to anthrone in concentrated H2SO4. J. Appl.Electrochem. 1985, 15 (5), 771−773.(61) Shi, Z.-W.; Li, Y.-Z.; Li, Y.; Lu, G.-Y.; Liu, S.-H. 1,1′,8,8′-Tetramethoxy-10,10′-bianthrone. Acta Crystallogr., Sect. E: Struct. Rep.Online 2004, E60 (12), o2275−o2277.(62) Shyamasundar, N.; Caluwe, P. Lithium aluminum hydridereduction of peri-alkoxy-9,10 anthraquinones. J. Org. Chem. 1981, 46(8), 1552−1557.(63) Prinz, H.; Wiegrebe, W.; Muller, K. Syntheses ofanthracenones. 1. Sodium dithionite reduction of peri-substitutedanthracenediones. J. Org. Chem. 1996, 61, 2853−2856.(64) Prinz, H.; Burgemeister, T.; Wiegrebe, W.; Muller, K. Synthesesof Anthracenones. 2. Preparation of 1,8-Dimethoxy- (Dimethylan-thralin) and 4,5-Dihydroxy-9(10H)-anthracenone (Isoanthralin): ARevision. J. Org. Chem. 1996, 61 (8), 2857−2860.(65) Muller, K.; Leukel, P.; Ziereis, K.; Gawlik, I. AntipsoriaticAnthrones with Modulated Redox Properties. 2. Novel Derivatives ofChrysarobin and IsochrysarobinAntiproliferative Activity and 5-Lipoxygenase Inhibition. J. Med. Chem. 1994, 37 (11), 1660−1669.(66) Yang, Z.; Tong, L.; Tabor, D. P.; Beh, E. S.; Goulet, M.-A.; DePorcellinis, D.; Aspuru-Guzik, A.; Gordon, R. G.; Aziz, M. J. Alkalinebenzoquinone aqueous flow battery for large-scale storage of electricalenergy. Adv. Energy Mater. 2018, 8 (8), 1702056.
Journal of the American Chemical Society Communication
DOI: 10.1021/jacs.8b13295J. Am. Chem. Soc. XXXX, XXX, XXX−XXX
F
Supporting Information
Extending the Lifetime of Organic Flow Batteries via Redox
State Management
Marc-Antoni Goulet,†,||,⊥ Liuchuan Tong,‡,|| Daniel A. Pollack,§ Daniel P. Tabor,‡ Susan A.
Odom,†, Alán Aspuru-Guzik,‡,¶ Eugene E. Kwan,*,‡ Roy G. Gordon,*,†,‡ and Michael J. Aziz*,†
†Harvard John A. Paulson School of Engineering and Applied Sciences, Harvard University, Cambridge, Massachusetts 02138,
United States
‡Department of Chemistry and Chemical Biology, Harvard University, Cambridge, Massachusetts 02138, United States
§Department of Physics, Harvard University, Cambridge, Massachusetts 02138, United States
Department of Chemistry, University of Kentucky, Lexington, Kentucky 40506, United States
||These authors contributed equally.
Present Addresses
⊥ Form Energy, Inc., Somerville, Massachusetts 02143, United States
¶ Department of Chemistry and Department of Computer Science; Vector Institute for Artificial Intelligence, University of
Toronto, Toronto, Ontario M5S 1A1, Canada
Table of Contents
Experimental methods................................................................................................................................... 1
Capacity fade of DHAQ symmetric cell .......................................................................................................... 3
Formation and detection of 2,6-dihydroxyanthrone (DHA) .......................................................................... 4
Identification of DHA ..................................................................................................................................... 5
Oxidation of DHA ........................................................................................................................................... 8
Formation and detection of (DHA)2 ............................................................................................................... 9
Identification of (DHA)2................................................................................................................................ 10
Time-dependence of DHA formation .......................................................................................................... 12
pH dependence of DHA 1H NMR spectrum ................................................................................................. 13
Synthesis of (DHA)2 via electrochemical oxidation of DHA ......................................................................... 14
Recovery of DHAQ via aeration of DHA ....................................................................................................... 15
Concentration dependent production of (DHA)2 ........................................................................................ 16
Concentration effects on capacity fade ....................................................................................................... 17
Characteristics of (DHA)2 cycling ................................................................................................................. 18
Stability of (DHA)2 ........................................................................................................................................ 19
Quantitative analysis of DHA and (DHA)2 formation and correlation with capacity loss............................ 20
DHA formation vs state of charge of DHAQ ................................................................................................ 23
Capacity fade mitigation strategies ............................................................................................................. 24
Potentiostatic cycling with Coulombic SOC cutoff ...................................................................................... 25
Cycling of DHAQ under aerobic conditions ................................................................................................. 26
Theoretical investigation of anthrone formation susceptibility .................................................................. 27
Annex (Details of NMR spectroscopic analysis)........................................................................................... 28
Characterization of DHA .......................................................................................................................... 28
Characterization of (DHA)2 ...................................................................................................................... 28
1
Experimental methods
Cell cycling
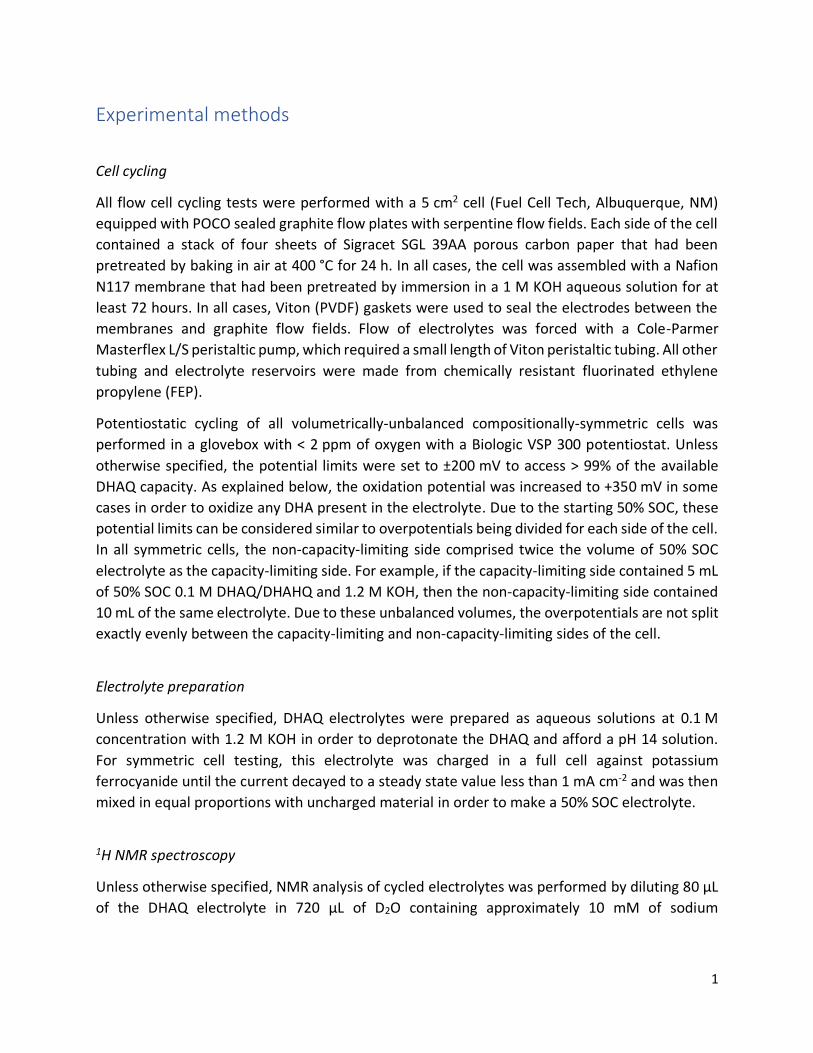
All flow cell cycling tests were performed with a 5 cm2 cell (Fuel Cell Tech, Albuquerque, NM)
equipped with POCO sealed graphite flow plates with serpentine flow fields. Each side of the cell
contained a stack of four sheets of Sigracet SGL 39AA porous carbon paper that had been
pretreated by baking in air at 400 °C for 24 h. In all cases, the cell was assembled with a Nafion
N117 membrane that had been pretreated by immersion in a 1 M KOH aqueous solution for at
least 72 hours. In all cases, Viton (PVDF) gaskets were used to seal the electrodes between the
membranes and graphite flow fields. Flow of electrolytes was forced with a Cole-Parmer
Masterflex L/S peristaltic pump, which required a small length of Viton peristaltic tubing. All other
tubing and electrolyte reservoirs were made from chemically resistant fluorinated ethylene
propylene (FEP).
Potentiostatic cycling of all volumetrically-unbalanced compositionally-symmetric cells was
performed in a glovebox with < 2 ppm of oxygen with a Biologic VSP 300 potentiostat. Unless
otherwise specified, the potential limits were set to ±200 mV to access > 99% of the available
DHAQ capacity. As explained below, the oxidation potential was increased to +350 mV in some
cases in order to oxidize any DHA present in the electrolyte. Due to the starting 50% SOC, these
potential limits can be considered similar to overpotentials being divided for each side of the cell.
In all symmetric cells, the non-capacity-limiting side comprised twice the volume of 50% SOC
electrolyte as the capacity-limiting side. For example, if the capacity-limiting side contained 5 mL
of 50% SOC 0.1 M DHAQ/DHAHQ and 1.2 M KOH, then the non-capacity-limiting side contained
10 mL of the same electrolyte. Due to these unbalanced volumes, the overpotentials are not split
exactly evenly between the capacity-limiting and non-capacity-limiting sides of the cell.
Electrolyte preparation
Unless otherwise specified, DHAQ electrolytes were prepared as aqueous solutions at 0.1 M
concentration with 1.2 M KOH in order to deprotonate the DHAQ and afford a pH 14 solution.
For symmetric cell testing, this electrolyte was charged in a full cell against potassium
ferrocyanide until the current decayed to a steady state value less than 1 mA cm-2 and was then
mixed in equal proportions with uncharged material in order to make a 50% SOC electrolyte.
1H NMR spectroscopy
Unless otherwise specified, NMR analysis of cycled electrolytes was performed by diluting 80 µL
of the DHAQ electrolyte in 720 µL of D2O containing approximately 10 mM of sodium
2
methanesulfonate (δ 2.6 ppm) as an internal standard. Spectra were recorded on a Varian INOVA
500 MHz spectrometer unless otherwise specified.
General information for synthesis
1H NMR and 13C NMR spectra were recorded on Varian INOVA 500 spectrometers unless
otherwise specified. NMR spectra were recorded in solutions of deuterated dimethyl sulfoxide
(DMSO-d6) with the residual dimethyl sulfoxide (δ 2.49 ppm for 1H NMR and δ 39.5 ppm for 13C
NMR) taken as the internal reference and deuterated water (D2O) with the residual water (δ 4.79
ppm for 1H NMR) taken as the internal reference. All solvents and reagents were purchased from
Sigma-Aldrich or Alfa Aesar and were used as received unless otherwise specified.
High resolution LC-MS
High-resolution LC-MS analysis was performed in the Small Molecule Mass Spectrometry Facility
at Harvard University on a Bruker Impact II q-TOF with internal calibration sodium formate
clusters. Liquid chromatography was performed on an Agilent 1290 Infinity HPLC using an Allure
PFPP column (5 µm particle size, 150 x 2.1 mm) at a flow rate of 0.4 mL/min, and the following
elution conditions were applied (solvent A = 0.1% v/v formic acid in water; solvent B = 0.1% v/v
formic acid in acetonitrile): 95% solvent A for 2 min, a gradient increasing from 5% to 60% solvent
B in solvent A over 13 min, a gradient increasing to 95% solvent B over 5 min, a gradient
decreasing to 5% solvent B in solvent A over 0.1 min, and 95% solvent A for 4.9 min. The ESI mass
spectra were recorded in negative ionization mode.
Preparative-scale HPLC
Liquid chromatography was performed using a Thermo Scientific Hypersil GOLD aQ column (5 µm
particle size, 250 x 20 mm) at a flow rate of 10 mL/min, and the following elution conditions were
applied (solvent A = 0.1% v/v formic acid in water; solvent B = 0.1% v/v formic acid in acetonitrile):
80% solvent A for 2 min, a gradient increasing from 20% to 70% solvent B in solvent A over 5 min,
a gradient increasing to 85% solvent B over 10 min, a gradient increasing to 95% solvent B over 4
min, a gradient decreasing to 20% solvent B in solvent A over 1 min, and 80% solvent A for 2 min.
The eluent fractions were collected and lyophilized for subsequent LC-MS confirmation.

3
Capacity fade of DHAQ symmetric cell
Fig. S1 depicts results of a volumetrically-unbalanced compositionally-symmetric cell cycling
experiment performed potentiostatically with overpotentials of ±200 mV, accessing > 99% of the
theoretical DHAQ capacity.1 Cycling was continued for several days (363 cycles) in order to
achieve significant capacity loss and perform post-mortem electrolyte analysis. A fade rate of
approximately 8%/day was observed in this experiment.
Figure S1. Unbalanced compositionally-symmetric cell cycling of 0.1 M DHAQ in a 1.2 M KOH
solution, demonstrating loss of capacity over time.

4
Formation and detection of 2,6-dihydroxyanthrone (DHA)
Fig. S2a depicts results of a symmetric cell cycling experiment that began with a strong
discharging (oxidation) overpotential of +350 mV, initially accessing > 99% of the theoretical
DHAQ capacity. Near day 0.5 of cycling, the oxidation overpotential was lowered to +200 mV,
leading to a sudden drop in capacity. Cycling was continued with this oxidative overpotential for
several days, and aliquots were taken periodically in the discharged state for 1H NMR
spectroscopy. The presence and increasing intensity of new peaks in the NMR spectrum indicates
the accumulation of another chemical species besides DHAQ.
Figure S2. (a) Symmetric cell cycling of 0.1 M DHAQ in a 1.2 M KOH solution, showing change in
capacity and fade rate when oxidation overpotential is changed from +350 to +200 mV. (b)
Continued cycling at +200 mV oxidation overpotential leads to broadening of DHAQ peaks and to
the appearance of additional peaks of increasing intensity in the 1H NMR spectrum in D2O.
(Bottom spectrum is DHAQ, middle spectrum is electrolyte cycled for 1 day, top spectrum is
electrolyte cycled for 5 days).
0.0 0.5 1.0
86
88
90
92
94
96
98
100
0.20 V
Ca
pacity (
%)
Time (days)
0.35 V
a b
5
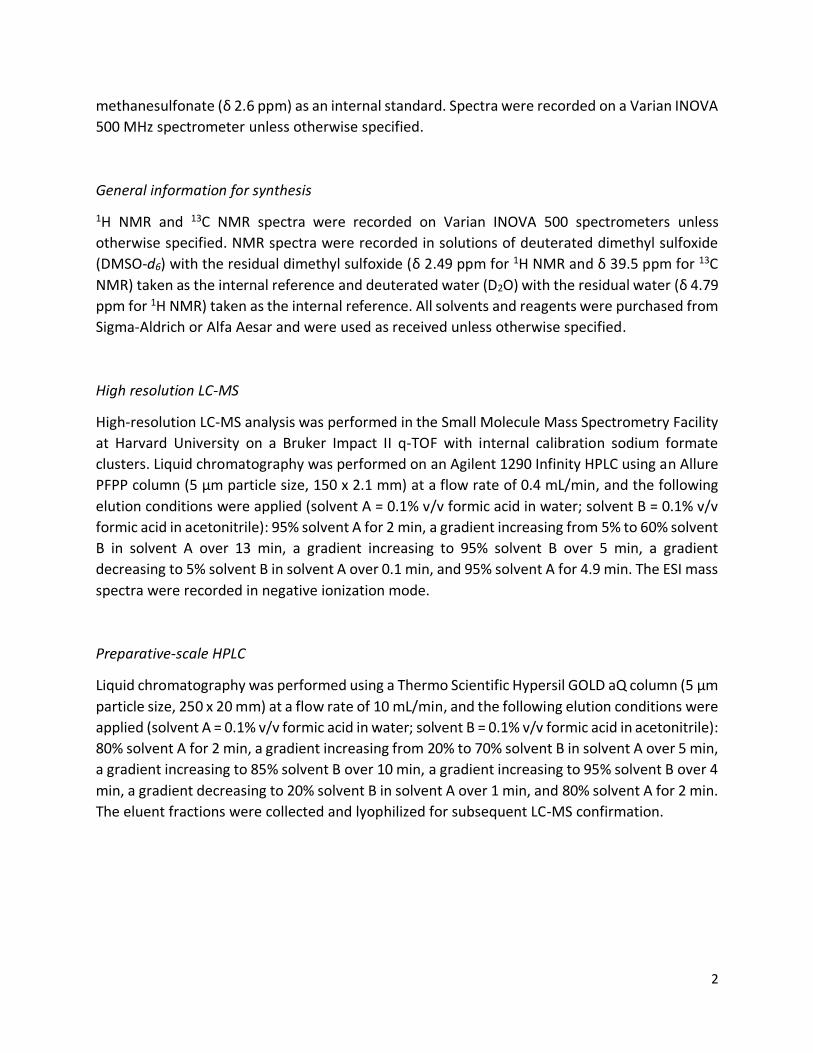
Identification of DHA
The capacity-limiting electrolyte utilized in the experiment of which results are depicted in Fig.
S2 was collected after several days of further cycling with a +200 mV oxidation overpotential.
Initial HPLC-MS analysis suggested primarily one major compound in addition to DHAQ, namely
2,6-dihydroxyanthrone (DHA). To verify the identification of DHA as the major side-product of
DHAQ cell cycling at this potential, DHA was synthesized (Fig. S3) and confirmed to have the same
retention time in HPLC-MS (Fig. S4). In addition, NMR spectroscopy was also performed on a
mixture of synthesized DHA and DHAQ to simulate the cycled electrolyte. The NMR spectrum of
DHA-spiked DHAQ (Fig. S5) qualitatively matches the spectrum of discharged cycled DHAQ (Fig.
S2b).
Figure S3. (a) Chemical synthesis of DHA. (b) 1H NMR spectrum of synthetic DHA in DMSO-d6.
2,6-Dihydroxyanthrone (DHA). The synthesis of DHA (Fig. S3a) was carried out according to a
reported procedure2 with modifications. 2,6-dihydroxyanthraquinone (DHAQ, 2.40 g, 10.0 mmol)
and stannous chloride (15.2 g, 80.0 mmol) were refluxed for 7 h in 80 mL of concentrated
hydrochloric acid. The resulting solution was cooled to room temperature, and the precipitate
was collected by vacuum filtration. The collected solid was washed with DI water. The product
was dried in vacuo to afford 2.20 g pale yellow powder (97% yield).
1H NMR (600 MHz, DMSO-d6) δ 10.41 (s, 1H), 9.69 (s, 1H), 8.03 (d, J = 8 Hz, 1H), 7.51 (d, J = 3 Hz,
1H), 7.35 (d, J = 8 Hz, 1H), 7.06 (dd, J = 8 Hz, 3 Hz, 1H), 6.87 (m, 2H), 4.22 (s, 2H) HRMS (ESI) m/z:
calcd for C14H9O3 [M-H]-, 225.0552; found, 225.0556.
a
b
6
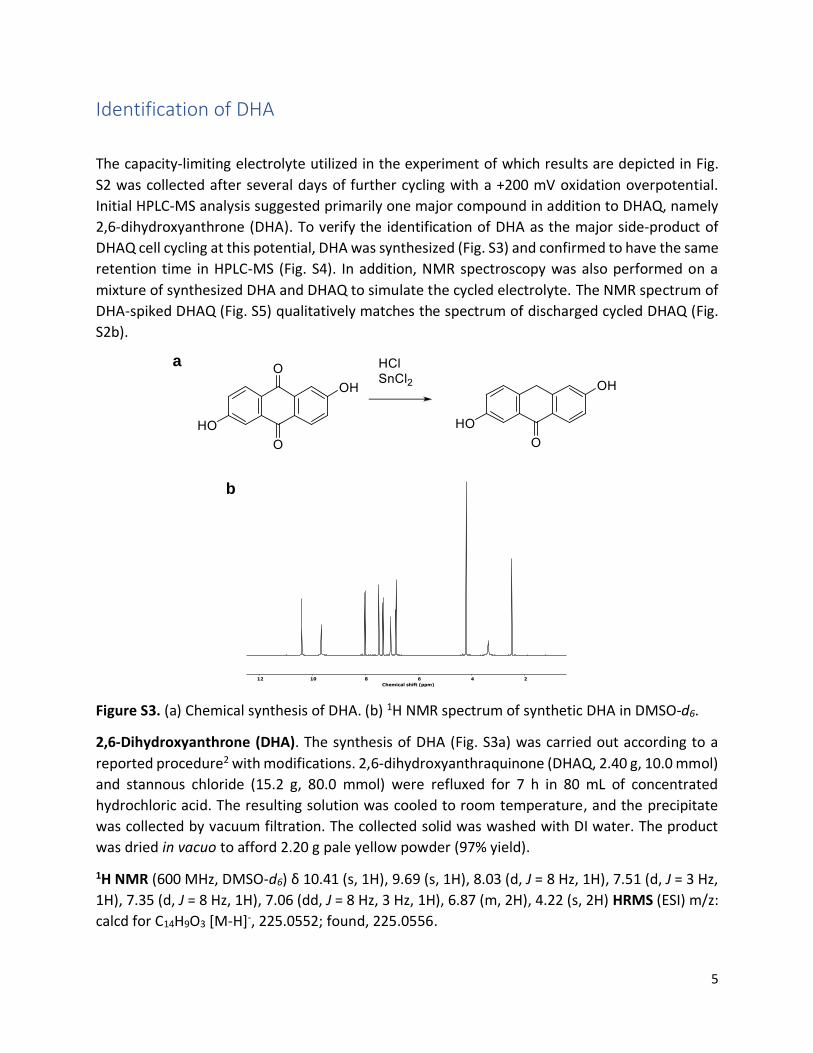
Figure S4. LC-MS traces of (a) pristine DHAQ, (b) cycled DHAQ in discharged state, and (c)
synthetic DHA standard. The peak at 10.2 min was identified as DHA. The LC trace of the pure
synthetic DHA standard also included a peak at 11.4 min corresponding to DHAQ due to partial
oxidation during material handling in alkaline solution.
a
b
c
7
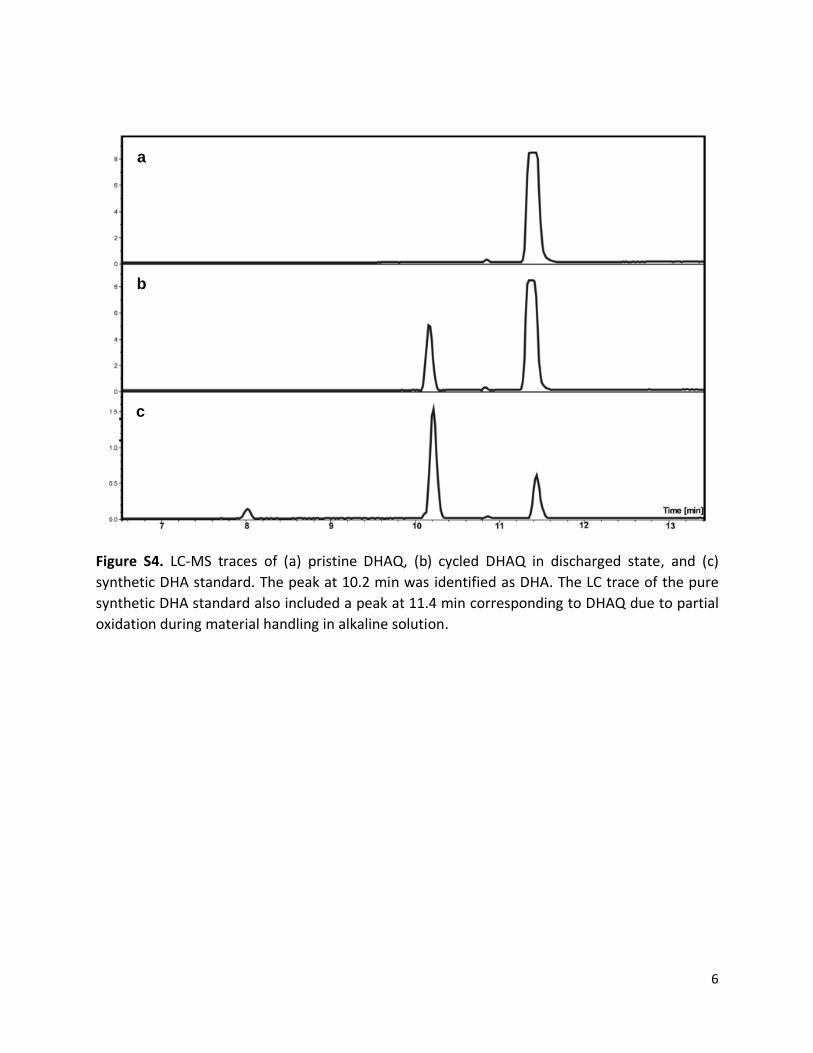
Figure S5. 1H NMR spectra (500 MHz, D2O) of DHAQ (bottom spectrum), pristine DHA (2nd
spectrum from bottom), a mixture of pristine DHA and DHAQ (3rd spectrum from bottom), DHAQ
cycled in a symmetric cell configuration and discharged at +200 mV oxidation potential (top
spectrum). The mixed sample was prepared by diluting 40 µL of each 0.1 M electrolyte in 720 µL
of D2O, whereas all other samples were prepared as described in the Experimental Methods
section.
8
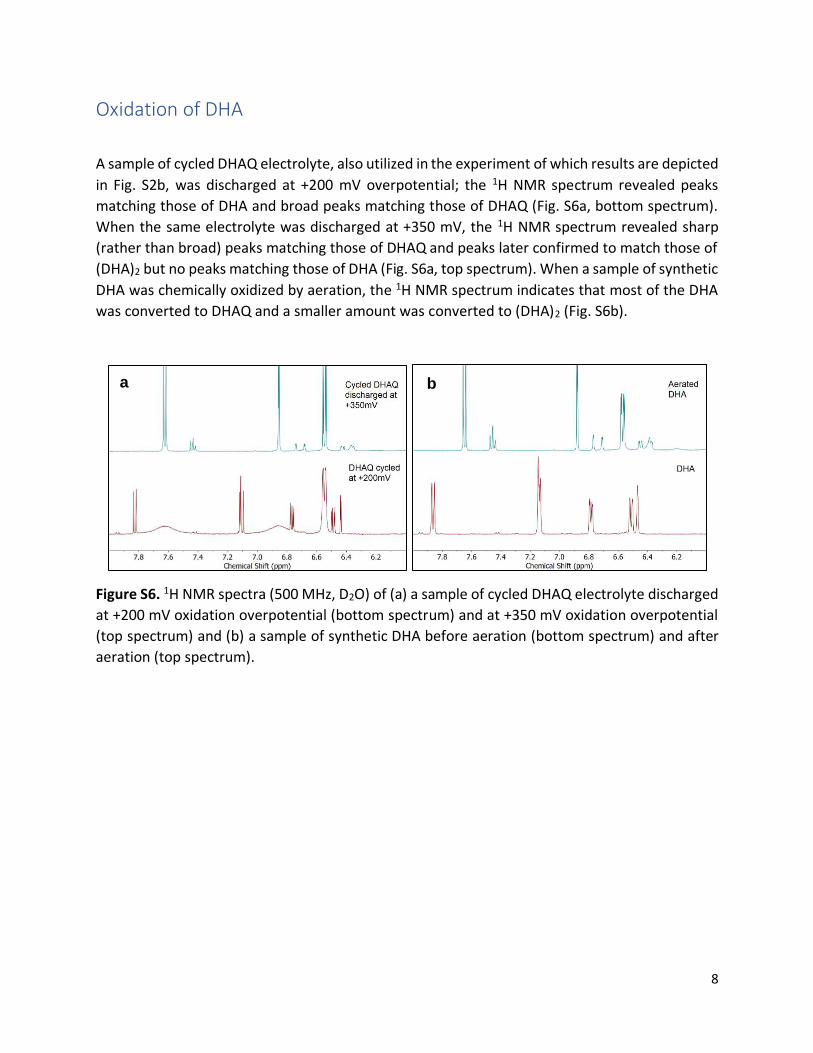
Oxidation of DHA
A sample of cycled DHAQ electrolyte, also utilized in the experiment of which results are depicted
in Fig. S2b, was discharged at +200 mV overpotential; the 1H NMR spectrum revealed peaks
matching those of DHA and broad peaks matching those of DHAQ (Fig. S6a, bottom spectrum).
When the same electrolyte was discharged at +350 mV, the 1H NMR spectrum revealed sharp
(rather than broad) peaks matching those of DHAQ and peaks later confirmed to match those of
(DHA)2 but no peaks matching those of DHA (Fig. S6a, top spectrum). When a sample of synthetic
DHA was chemically oxidized by aeration, the 1H NMR spectrum indicates that most of the DHA
was converted to DHAQ and a smaller amount was converted to (DHA)2 (Fig. S6b).
Figure S6. 1H NMR spectra (500 MHz, D2O) of (a) a sample of cycled DHAQ electrolyte discharged
at +200 mV oxidation overpotential (bottom spectrum) and at +350 mV oxidation overpotential
(top spectrum) and (b) a sample of synthetic DHA before aeration (bottom spectrum) and after
aeration (top spectrum).
a
b

9
Formation and detection of (DHA)2
HPLC-MS of a cycled DHAQ electrolyte after a strongly oxidative discharge (+350 mV) was applied,
showing disappearance of DHA and the appearance of new compounds with [M-H]- = 449.1028
and [M-H]- = 223.0404.
Figure S7. (a) LC-MS trace of DHAQ after prolonged cycling shows disappearance of the DHA peak
and appearance of an additional peak at 10.2 min with [M-H]- of 449.1028. (b) Mass spectrum of
the material eluted at 10.2 min in the LC trace. A [M-H]- of 449.1028 corresponds to a neutral
molecular formula C28H18O6. The majority of the ions existed in a fragment with [M-H]- of
223.04104. (c) The material with [M-H]-of 449.1028 was isolated and fragmented by MS/MS,
indicating that the signal with [M-H]- of 223.04104 observed by LC-MS corresponds to fragments
of the material with [M-H]-of 449.1028.
MS/MS of m/z = 449
a
b
c
10
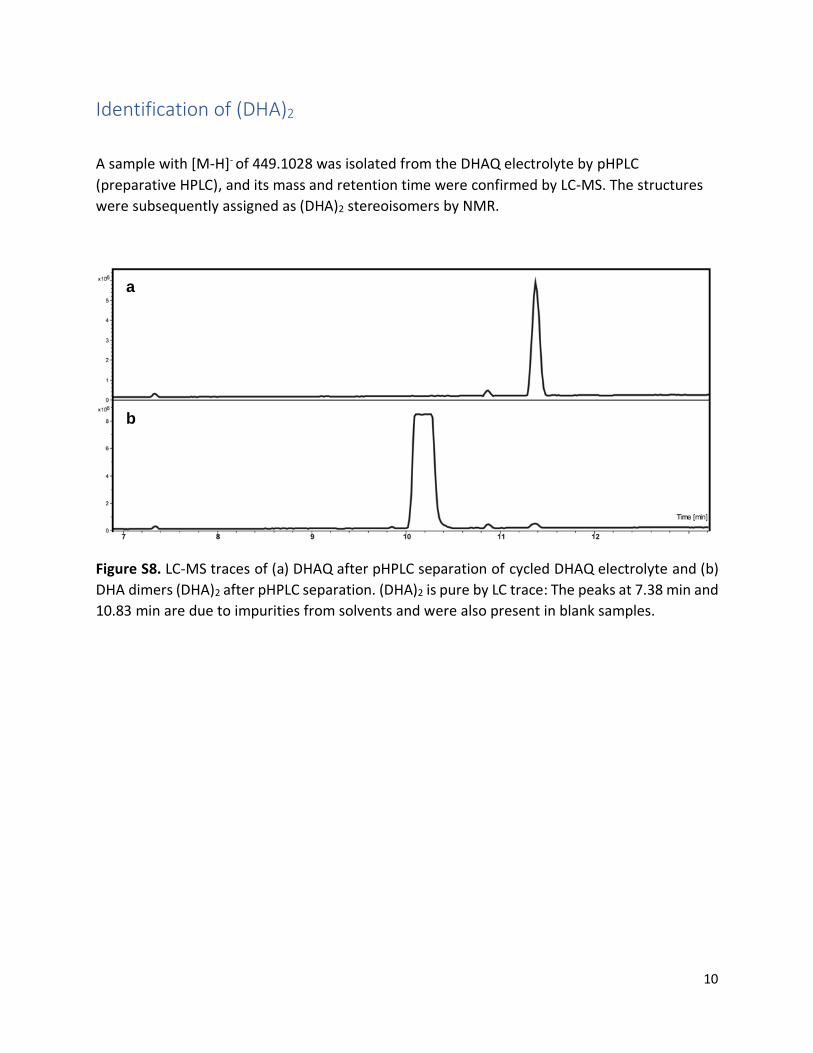
Identification of (DHA)2
A sample with [M-H]- of 449.1028 was isolated from the DHAQ electrolyte by pHPLC
(preparative HPLC), and its mass and retention time were confirmed by LC-MS. The structures
were subsequently assigned as (DHA)2 stereoisomers by NMR.
Figure S8. LC-MS traces of (a) DHAQ after pHPLC separation of cycled DHAQ electrolyte and (b)
DHA dimers (DHA)2 after pHPLC separation. (DHA)2 is pure by LC trace: The peaks at 7.38 min and
10.83 min are due to impurities from solvents and were also present in blank samples.
a
b

11
Following separation from the DHAQ electrolyte by pHPLC, the sample with [M-H]- of 449.1028
was dissolved in DMSO-d6 and analyzed by NMR to confirm the chemical structures as (DHA)2
stereoisomers (Fig. S9). Full details of the NMR analysis can be found in the Annex at the end of
the SI.
Figure S9. Chemical structures of DHAQ decomposition products, (DHA)2, revealed by NMR
analysis.
12
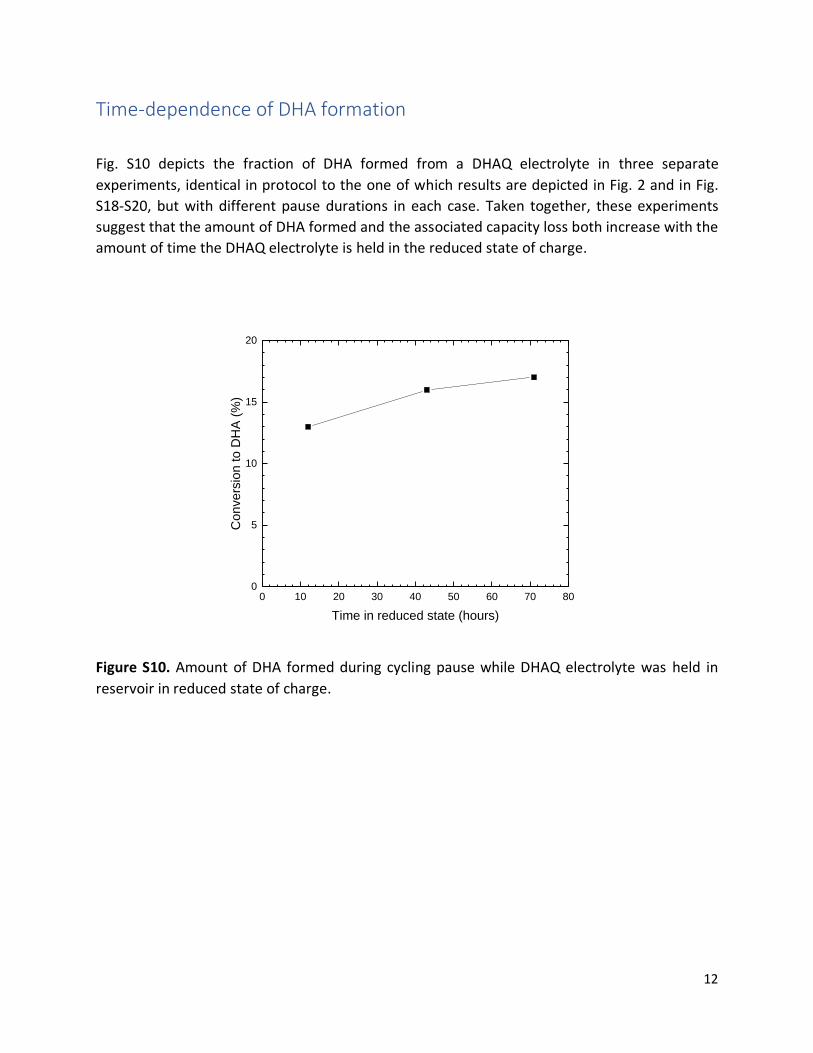
Time-dependence of DHA formation
Fig. S10 depicts the fraction of DHA formed from a DHAQ electrolyte in three separate
experiments, identical in protocol to the one of which results are depicted in Fig. 2 and in Fig.
S18-S20, but with different pause durations in each case. Taken together, these experiments
suggest that the amount of DHA formed and the associated capacity loss both increase with the
amount of time the DHAQ electrolyte is held in the reduced state of charge.
Figure S10. Amount of DHA formed during cycling pause while DHAQ electrolyte was held in
reservoir in reduced state of charge.
0 10 20 30 40 50 60 70 800
5
10
15
20
Convers
ion to D
HA
(%
)
Time in reduced state (hours)
13
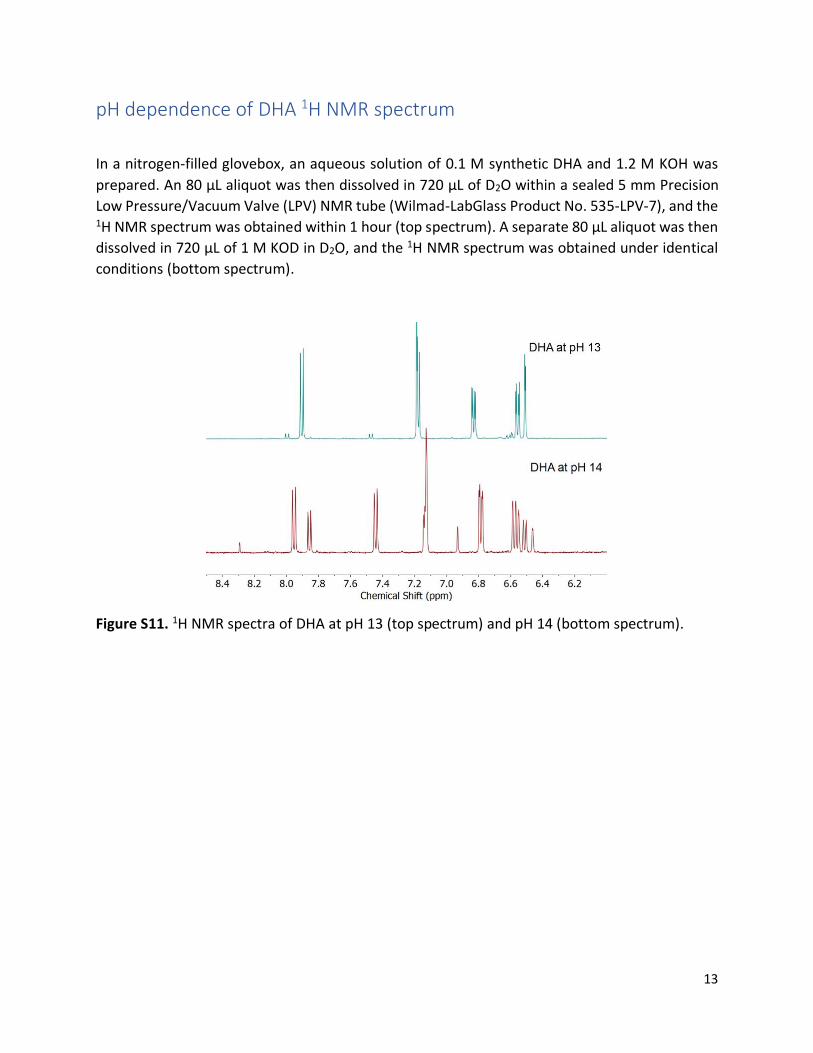
pH dependence of DHA 1H NMR spectrum
In a nitrogen-filled glovebox, an aqueous solution of 0.1 M synthetic DHA and 1.2 M KOH was
prepared. An 80 μL aliquot was then dissolved in 720 μL of D2O within a sealed 5 mm Precision
Low Pressure/Vacuum Valve (LPV) NMR tube (Wilmad-LabGlass Product No. 535-LPV-7), and the 1H NMR spectrum was obtained within 1 hour (top spectrum). A separate 80 μL aliquot was then
dissolved in 720 μL of 1 M KOD in D2O, and the 1H NMR spectrum was obtained under identical
conditions (bottom spectrum).
Figure S11. 1H NMR spectra of DHA at pH 13 (top spectrum) and pH 14 (bottom spectrum).
14
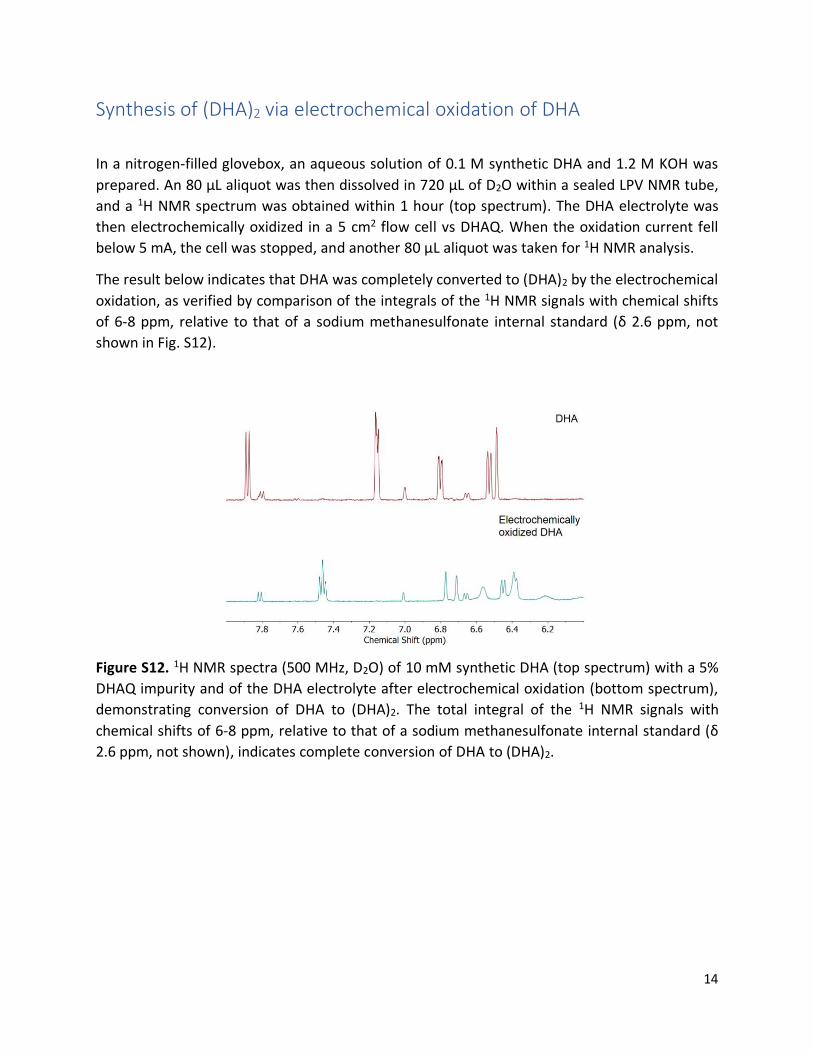
Synthesis of (DHA)2 via electrochemical oxidation of DHA
In a nitrogen-filled glovebox, an aqueous solution of 0.1 M synthetic DHA and 1.2 M KOH was
prepared. An 80 μL aliquot was then dissolved in 720 μL of D2O within a sealed LPV NMR tube,
and a 1H NMR spectrum was obtained within 1 hour (top spectrum). The DHA electrolyte was
then electrochemically oxidized in a 5 cm2 flow cell vs DHAQ. When the oxidation current fell
below 5 mA, the cell was stopped, and another 80 μL aliquot was taken for 1H NMR analysis.
The result below indicates that DHA was completely converted to (DHA)2 by the electrochemical
oxidation, as verified by comparison of the integrals of the 1H NMR signals with chemical shifts
of 6-8 ppm, relative to that of a sodium methanesulfonate internal standard (δ 2.6 ppm, not
shown in Fig. S12).
Figure S12. 1H NMR spectra (500 MHz, D2O) of 10 mM synthetic DHA (top spectrum) with a 5%
DHAQ impurity and of the DHA electrolyte after electrochemical oxidation (bottom spectrum),
demonstrating conversion of DHA to (DHA)2. The total integral of the 1H NMR signals with
chemical shifts of 6-8 ppm, relative to that of a sodium methanesulfonate internal standard (δ
2.6 ppm, not shown), indicates complete conversion of DHA to (DHA)2.
15
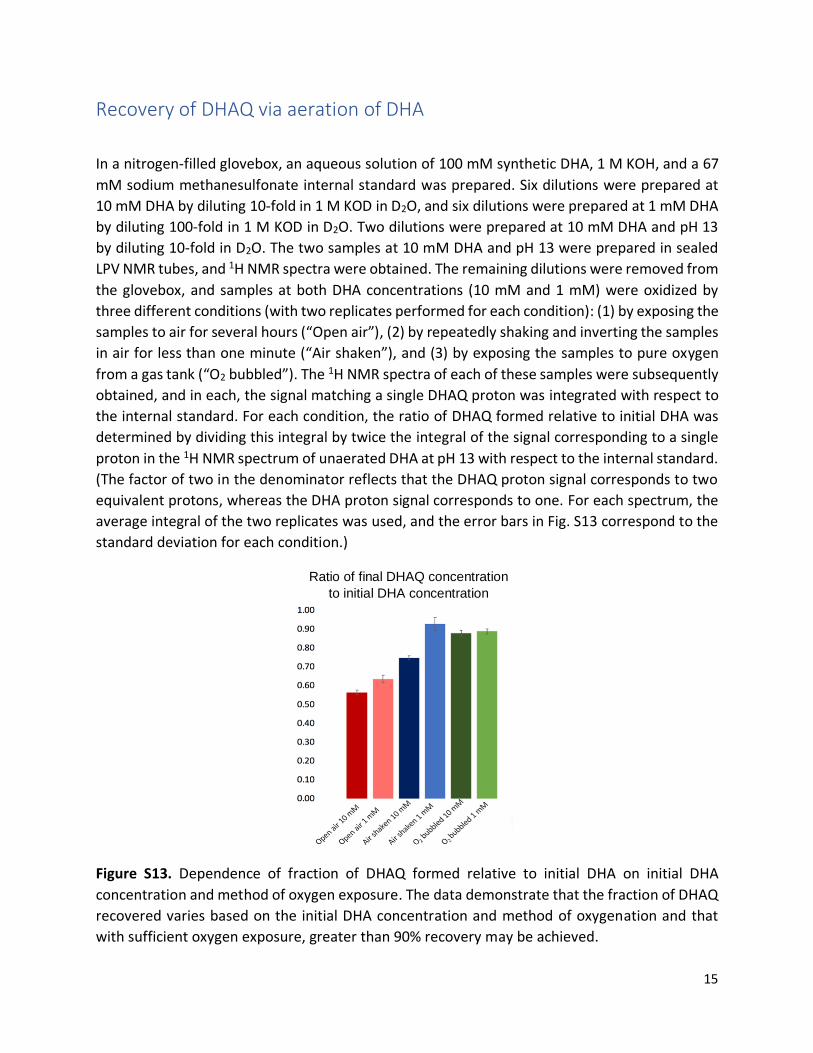
Recovery of DHAQ via aeration of DHA
In a nitrogen-filled glovebox, an aqueous solution of 100 mM synthetic DHA, 1 M KOH, and a 67
mM sodium methanesulfonate internal standard was prepared. Six dilutions were prepared at
10 mM DHA by diluting 10-fold in 1 M KOD in D2O, and six dilutions were prepared at 1 mM DHA
by diluting 100-fold in 1 M KOD in D2O. Two dilutions were prepared at 10 mM DHA and pH 13
by diluting 10-fold in D2O. The two samples at 10 mM DHA and pH 13 were prepared in sealed
LPV NMR tubes, and 1H NMR spectra were obtained. The remaining dilutions were removed from
the glovebox, and samples at both DHA concentrations (10 mM and 1 mM) were oxidized by
three different conditions (with two replicates performed for each condition): (1) by exposing the
samples to air for several hours (“Open air”), (2) by repeatedly shaking and inverting the samples
in air for less than one minute (“Air shaken”), and (3) by exposing the samples to pure oxygen
from a gas tank (“O2 bubbled”). The 1H NMR spectra of each of these samples were subsequently
obtained, and in each, the signal matching a single DHAQ proton was integrated with respect to
the internal standard. For each condition, the ratio of DHAQ formed relative to initial DHA was
determined by dividing this integral by twice the integral of the signal corresponding to a single
proton in the 1H NMR spectrum of unaerated DHA at pH 13 with respect to the internal standard.
(The factor of two in the denominator reflects that the DHAQ proton signal corresponds to two
equivalent protons, whereas the DHA proton signal corresponds to one. For each spectrum, the
average integral of the two replicates was used, and the error bars in Fig. S13 correspond to the
standard deviation for each condition.)
Figure S13. Dependence of fraction of DHAQ formed relative to initial DHA on initial DHA
concentration and method of oxygen exposure. The data demonstrate that the fraction of DHAQ
recovered varies based on the initial DHA concentration and method of oxygenation and that
with sufficient oxygen exposure, greater than 90% recovery may be achieved.
Ratio of final DHAQ concentration
to initial DHA concentration
16
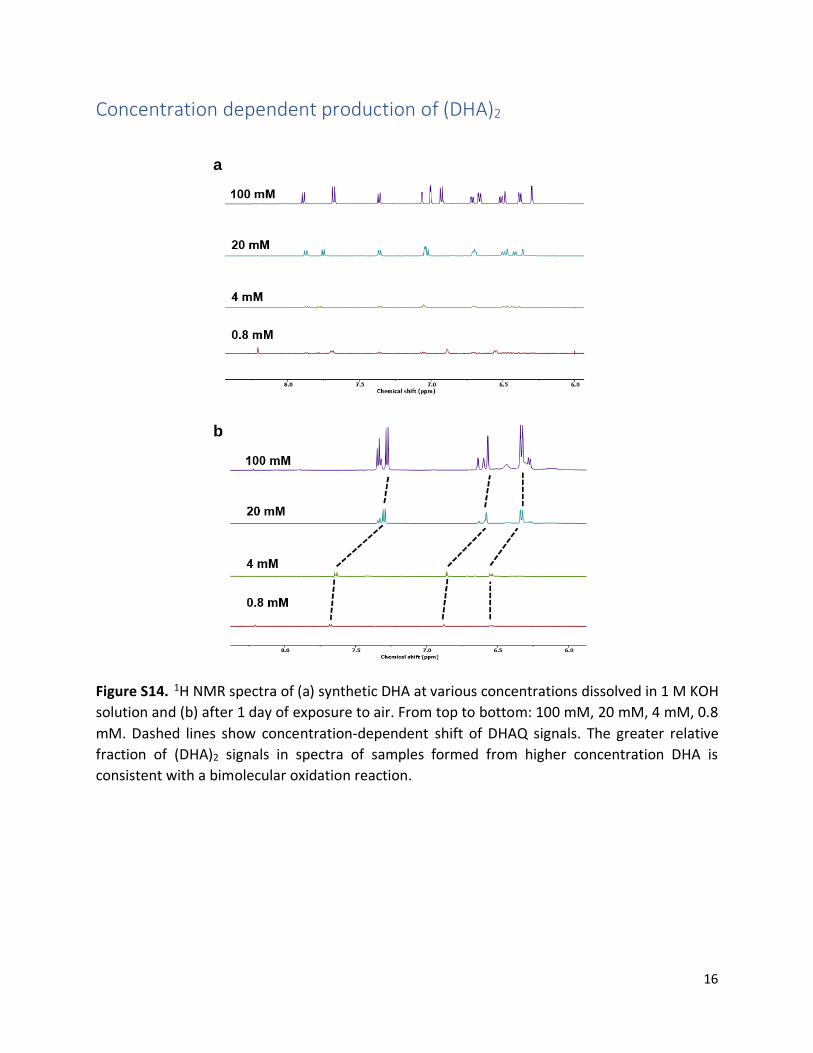
Concentration dependent production of (DHA)2
Figure S14. 1H NMR spectra of (a) synthetic DHA at various concentrations dissolved in 1 M KOH
solution and (b) after 1 day of exposure to air. From top to bottom: 100 mM, 20 mM, 4 mM, 0.8
mM. Dashed lines show concentration-dependent shift of DHAQ signals. The greater relative
fraction of (DHA)2 signals in spectra of samples formed from higher concentration DHA is
consistent with a bimolecular oxidation reaction.
a
b
17
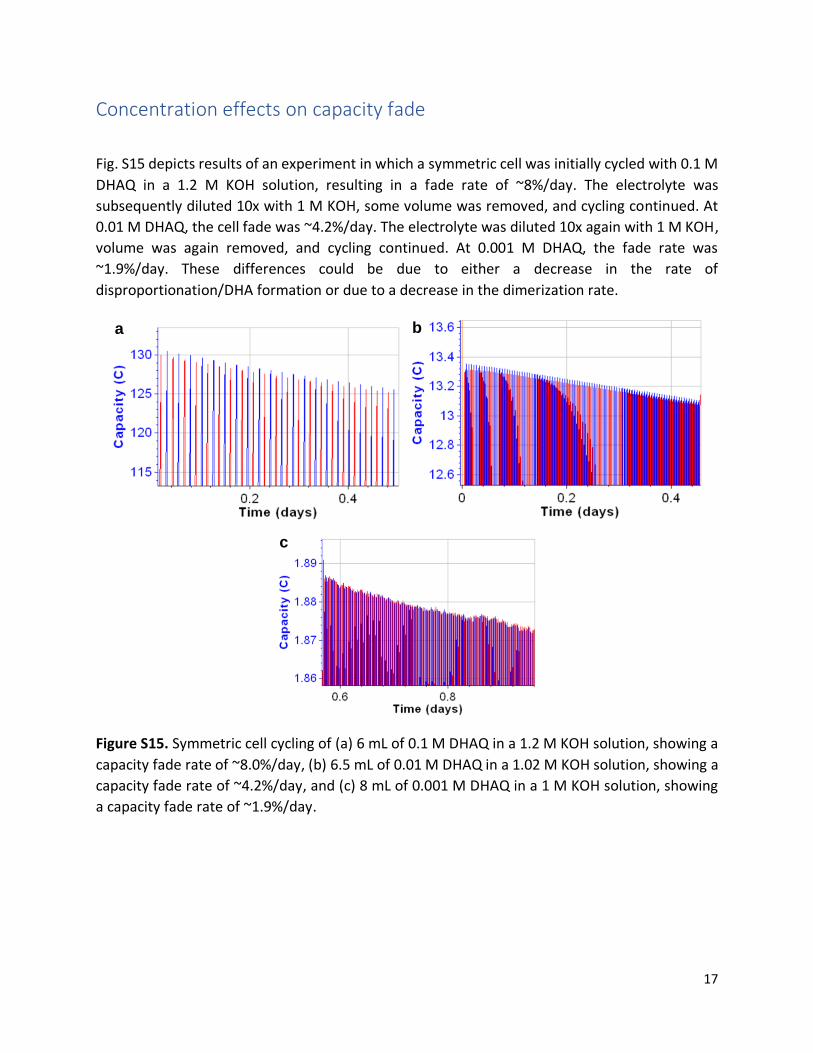
Concentration effects on capacity fade
Fig. S15 depicts results of an experiment in which a symmetric cell was initially cycled with 0.1 M
DHAQ in a 1.2 M KOH solution, resulting in a fade rate of ~8%/day. The electrolyte was
subsequently diluted 10x with 1 M KOH, some volume was removed, and cycling continued. At
0.01 M DHAQ, the cell fade was ~4.2%/day. The electrolyte was diluted 10x again with 1 M KOH,
volume was again removed, and cycling continued. At 0.001 M DHAQ, the fade rate was
~1.9%/day. These differences could be due to either a decrease in the rate of
disproportionation/DHA formation or due to a decrease in the dimerization rate.
Figure S15. Symmetric cell cycling of (a) 6 mL of 0.1 M DHAQ in a 1.2 M KOH solution, showing a
capacity fade rate of ~8.0%/day, (b) 6.5 mL of 0.01 M DHAQ in a 1.02 M KOH solution, showing a
capacity fade rate of ~4.2%/day, and (c) 8 mL of 0.001 M DHAQ in a 1 M KOH solution, showing
a capacity fade rate of ~1.9%/day.
c
b
a
18
Characteristics of (DHA)2 cycling
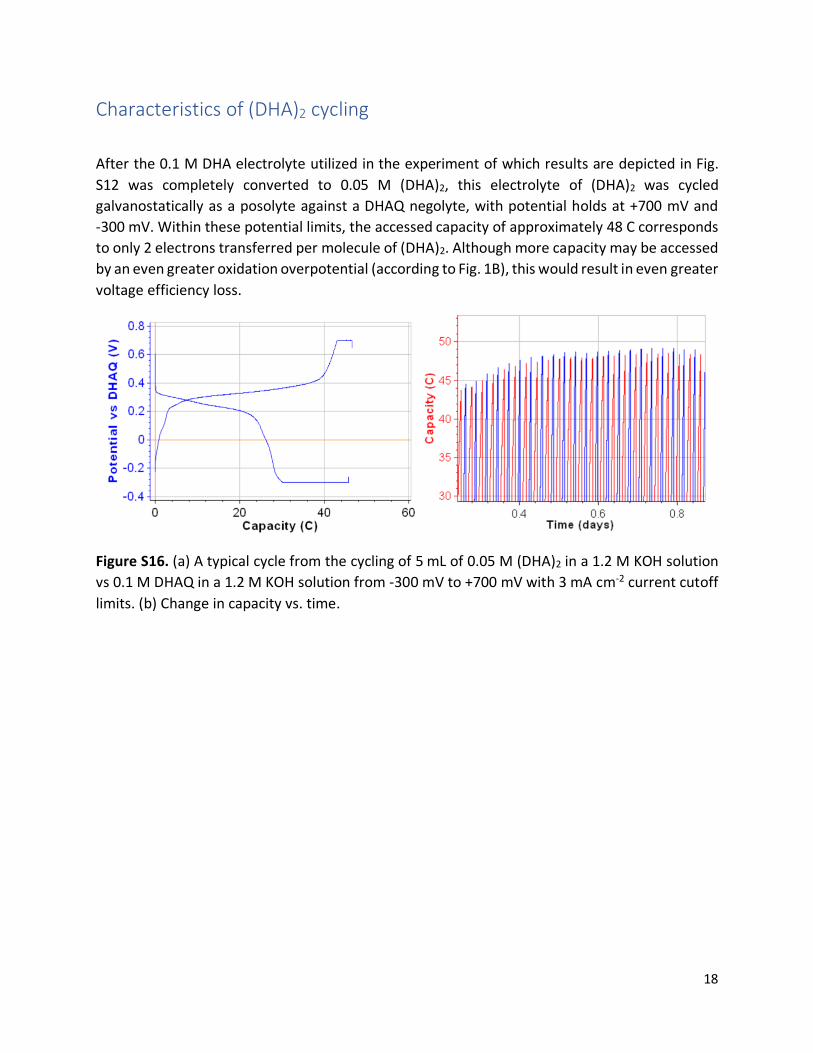
After the 0.1 M DHA electrolyte utilized in the experiment of which results are depicted in Fig.
S12 was completely converted to 0.05 M (DHA)2, this electrolyte of (DHA)2 was cycled
galvanostatically as a posolyte against a DHAQ negolyte, with potential holds at +700 mV and
-300 mV. Within these potential limits, the accessed capacity of approximately 48 C corresponds
to only 2 electrons transferred per molecule of (DHA)2. Although more capacity may be accessed
by an even greater oxidation overpotential (according to Fig. 1B), this would result in even greater
voltage efficiency loss.
Figure S16. (a) A typical cycle from the cycling of 5 mL of 0.05 M (DHA)2 in a 1.2 M KOH solution
vs 0.1 M DHAQ in a 1.2 M KOH solution from -300 mV to +700 mV with 3 mA cm-2 current cutoff
limits. (b) Change in capacity vs. time.
19
Stability of (DHA)2
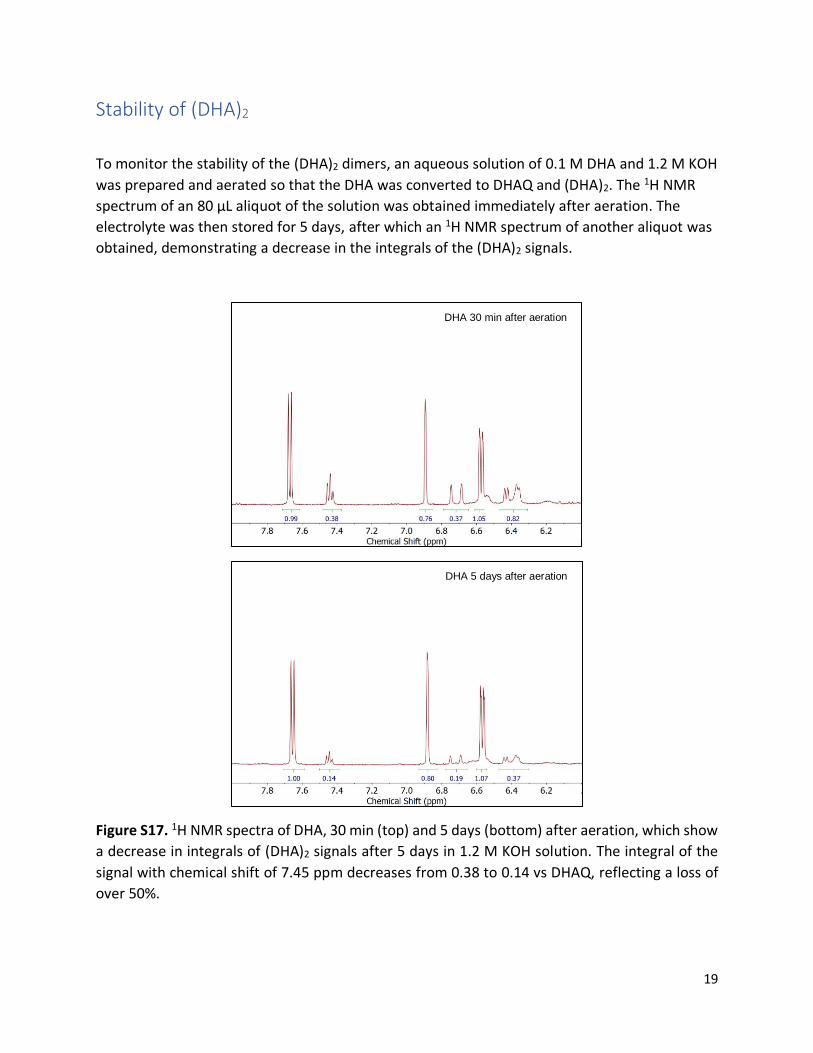
To monitor the stability of the (DHA)2 dimers, an aqueous solution of 0.1 M DHA and 1.2 M KOH
was prepared and aerated so that the DHA was converted to DHAQ and (DHA)2. The 1H NMR
spectrum of an 80 µL aliquot of the solution was obtained immediately after aeration. The
electrolyte was then stored for 5 days, after which an 1H NMR spectrum of another aliquot was
obtained, demonstrating a decrease in the integrals of the (DHA)2 signals.
Figure S17. 1H NMR spectra of DHA, 30 min (top) and 5 days (bottom) after aeration, which show
a decrease in integrals of (DHA)2 signals after 5 days in 1.2 M KOH solution. The integral of the
signal with chemical shift of 7.45 ppm decreases from 0.38 to 0.14 vs DHAQ, reflecting a loss of
over 50%.
DHA 30 min after aeration
DHA 5 days after aeration
20
Quantitative analysis of DHA and (DHA)2 formation and correlation with
capacity loss
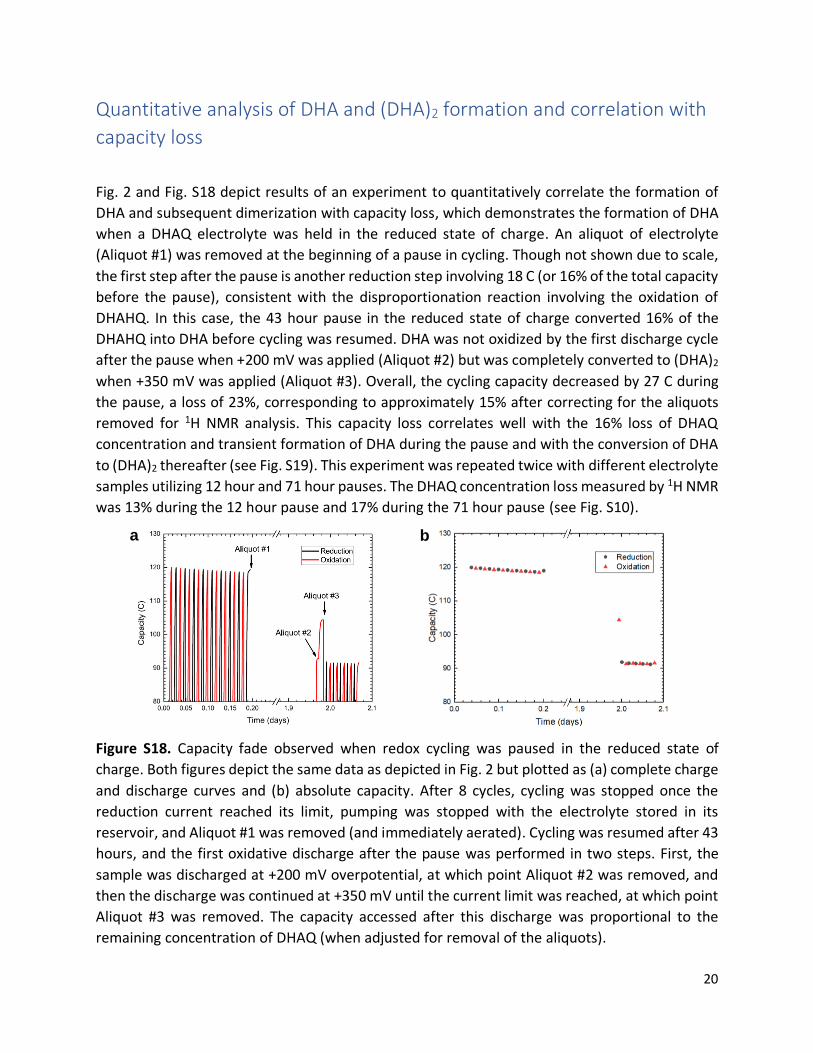
Fig. 2 and Fig. S18 depict results of an experiment to quantitatively correlate the formation of
DHA and subsequent dimerization with capacity loss, which demonstrates the formation of DHA
when a DHAQ electrolyte was held in the reduced state of charge. An aliquot of electrolyte
(Aliquot #1) was removed at the beginning of a pause in cycling. Though not shown due to scale,
the first step after the pause is another reduction step involving 18 C (or 16% of the total capacity
before the pause), consistent with the disproportionation reaction involving the oxidation of
DHAHQ. In this case, the 43 hour pause in the reduced state of charge converted 16% of the
DHAHQ into DHA before cycling was resumed. DHA was not oxidized by the first discharge cycle
after the pause when +200 mV was applied (Aliquot #2) but was completely converted to (DHA)2
when +350 mV was applied (Aliquot #3). Overall, the cycling capacity decreased by 27 C during
the pause, a loss of 23%, corresponding to approximately 15% after correcting for the aliquots
removed for 1H NMR analysis. This capacity loss correlates well with the 16% loss of DHAQ
concentration and transient formation of DHA during the pause and with the conversion of DHA
to (DHA)2 thereafter (see Fig. S19). This experiment was repeated twice with different electrolyte
samples utilizing 12 hour and 71 hour pauses. The DHAQ concentration loss measured by 1H NMR
was 13% during the 12 hour pause and 17% during the 71 hour pause (see Fig. S10).
Figure S18. Capacity fade observed when redox cycling was paused in the reduced state of
charge. Both figures depict the same data as depicted in Fig. 2 but plotted as (a) complete charge
and discharge curves and (b) absolute capacity. After 8 cycles, cycling was stopped once the
reduction current reached its limit, pumping was stopped with the electrolyte stored in its
reservoir, and Aliquot #1 was removed (and immediately aerated). Cycling was resumed after 43
hours, and the first oxidative discharge after the pause was performed in two steps. First, the
sample was discharged at +200 mV overpotential, at which point Aliquot #2 was removed, and
then the discharge was continued at +350 mV until the current limit was reached, at which point
Aliquot #3 was removed. The capacity accessed after this discharge was proportional to the
remaining concentration of DHAQ (when adjusted for removal of the aliquots).
a
b
21
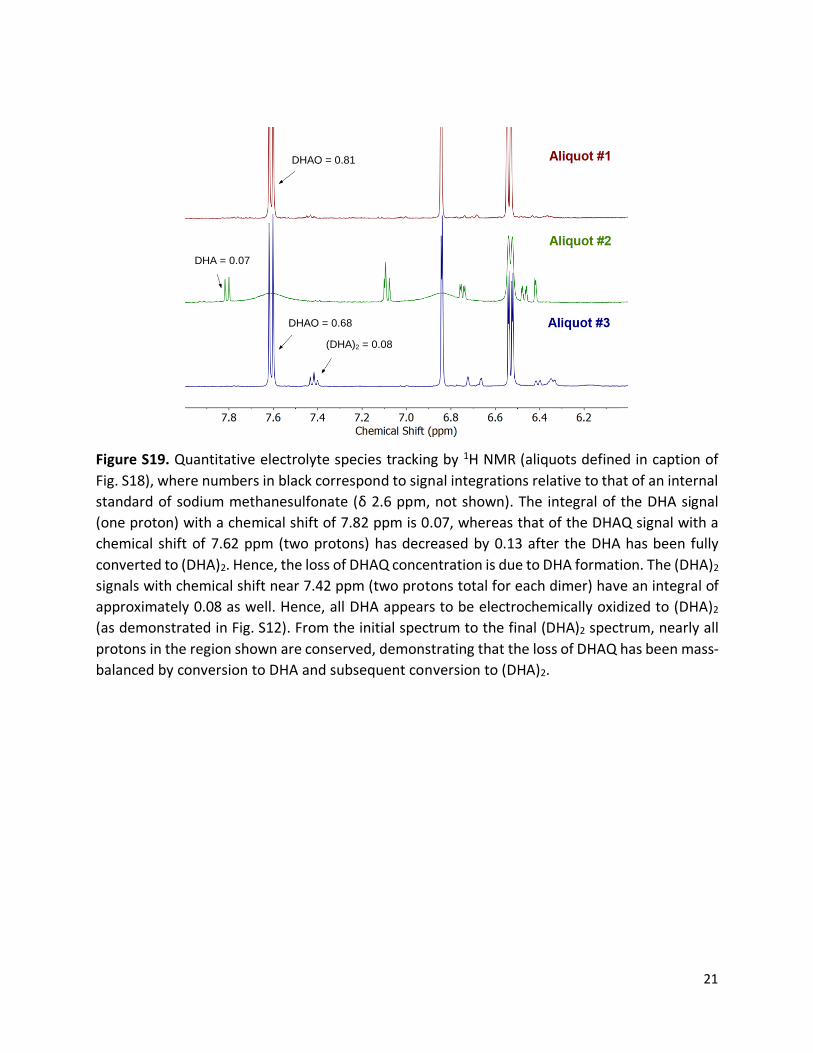
Figure S19. Quantitative electrolyte species tracking by 1H NMR (aliquots defined in caption of
Fig. S18), where numbers in black correspond to signal integrations relative to that of an internal
standard of sodium methanesulfonate (δ 2.6 ppm, not shown). The integral of the DHA signal
(one proton) with a chemical shift of 7.82 ppm is 0.07, whereas that of the DHAQ signal with a
chemical shift of 7.62 ppm (two protons) has decreased by 0.13 after the DHA has been fully
converted to (DHA)2. Hence, the loss of DHAQ concentration is due to DHA formation. The (DHA)2
signals with chemical shift near 7.42 ppm (two protons total for each dimer) have an integral of
approximately 0.08 as well. Hence, all DHA appears to be electrochemically oxidized to (DHA)2
(as demonstrated in Fig. S12). From the initial spectrum to the final (DHA)2 spectrum, nearly all
protons in the region shown are conserved, demonstrating that the loss of DHAQ has been mass-
balanced by conversion to DHA and subsequent conversion to (DHA)2.
DHAQ = 0.81
DHA = 0.07
DHAQ = 0.68
(DHA)2 = 0.08
22
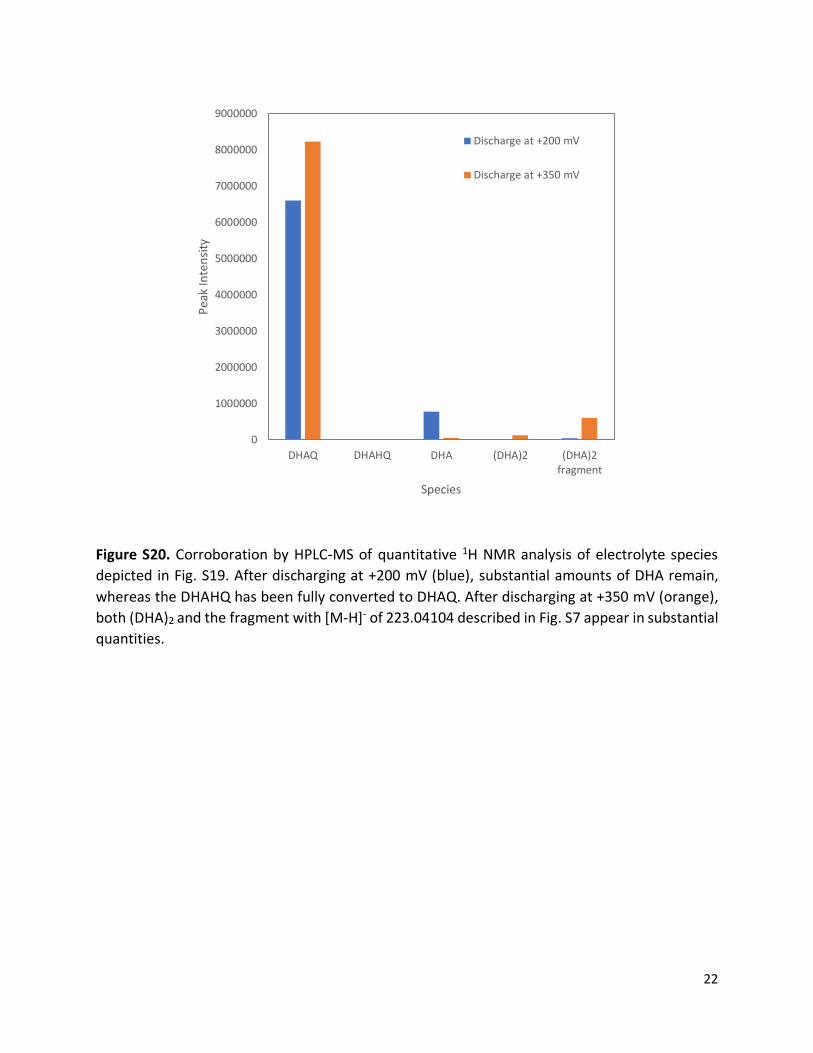
Figure S20. Corroboration by HPLC-MS of quantitative 1H NMR analysis of electrolyte species
depicted in Fig. S19. After discharging at +200 mV (blue), substantial amounts of DHA remain,
whereas the DHAHQ has been fully converted to DHAQ. After discharging at +350 mV (orange),
both (DHA)2 and the fragment with [M-H]- of 223.04104 described in Fig. S7 appear in substantial
quantities.
0
1000000
2000000
3000000
4000000
5000000
6000000
7000000
8000000
9000000
DHAQ DHAHQ DHA (DHA)2 (DHA)2fragment
Pea
k In
ten
sity
Species
Discharge at +200 mV
Discharge at +350 mV
23
DHA formation vs state of charge of DHAQ
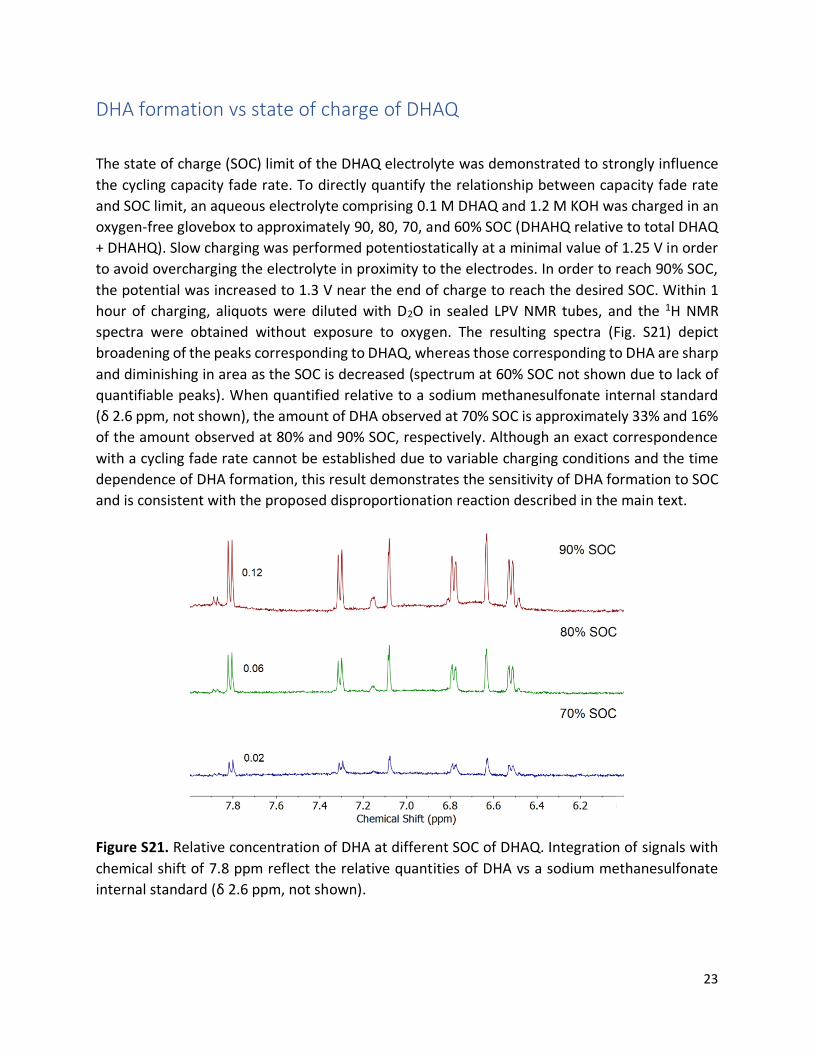
The state of charge (SOC) limit of the DHAQ electrolyte was demonstrated to strongly influence
the cycling capacity fade rate. To directly quantify the relationship between capacity fade rate
and SOC limit, an aqueous electrolyte comprising 0.1 M DHAQ and 1.2 M KOH was charged in an
oxygen-free glovebox to approximately 90, 80, 70, and 60% SOC (DHAHQ relative to total DHAQ
+ DHAHQ). Slow charging was performed potentiostatically at a minimal value of 1.25 V in order
to avoid overcharging the electrolyte in proximity to the electrodes. In order to reach 90% SOC,
the potential was increased to 1.3 V near the end of charge to reach the desired SOC. Within 1
hour of charging, aliquots were diluted with D2O in sealed LPV NMR tubes, and the 1H NMR
spectra were obtained without exposure to oxygen. The resulting spectra (Fig. S21) depict
broadening of the peaks corresponding to DHAQ, whereas those corresponding to DHA are sharp
and diminishing in area as the SOC is decreased (spectrum at 60% SOC not shown due to lack of
quantifiable peaks). When quantified relative to a sodium methanesulfonate internal standard
(δ 2.6 ppm, not shown), the amount of DHA observed at 70% SOC is approximately 33% and 16%
of the amount observed at 80% and 90% SOC, respectively. Although an exact correspondence
with a cycling fade rate cannot be established due to variable charging conditions and the time
dependence of DHA formation, this result demonstrates the sensitivity of DHA formation to SOC
and is consistent with the proposed disproportionation reaction described in the main text.
Figure S21. Relative concentration of DHA at different SOC of DHAQ. Integration of signals with
chemical shift of 7.8 ppm reflect the relative quantities of DHA vs a sodium methanesulfonate
internal standard (δ 2.6 ppm, not shown).

24
Capacity fade mitigation strategies
Fig. S22 below contains the same data as depicted in Fig. 4 in the main text but plotted as absolute
capacity rather than relative capacity.
Figure S22. (a) Limiting the state of charge reduces the rate of capacity loss in a negolyte-limited
DHAQ-Fe(CN)6 full cell. Over the first 1.6 days, the operating state of charge was limited to 88%
of the theoretical capacity (i.e., 88% DHAHQ and 12% DHAQ), and the capacity faded at only
0.14%/day. The right-hand segment reflects typical operating conditions (cycling to 99.9% of
theoretical capacity), and the capacity faded at 5.6%/day. (b) Symmetric cell cycling in which the
capacity-limiting side (5 mL of 0.1 M DHAQ in a 1.2 M KOH solution) demonstrates recovery of
70% of lost capacity after aeration of discharged electrolyte.
0 1 288
90
92
94
96
98
100
102
104
106
108
110
Charge
DischargeC
apacity (
C)
Time (days)
change voltage
cutoff from
1.25 to 1.6V to access
>99% of the theoretical capacity
98
99
100
Coulombic Efficiency
Effic
iency (
%)
0.0 0.5 1.0 1.5 2.0 2.5 3.0100
105
110
115
120
125
130
135
140
Reduction
Oxidation
Ca
pacity (
C)
Time (days)
Aeration recovers capacity
a
b
25
Potentiostatic cycling with Coulombic SOC cutoff
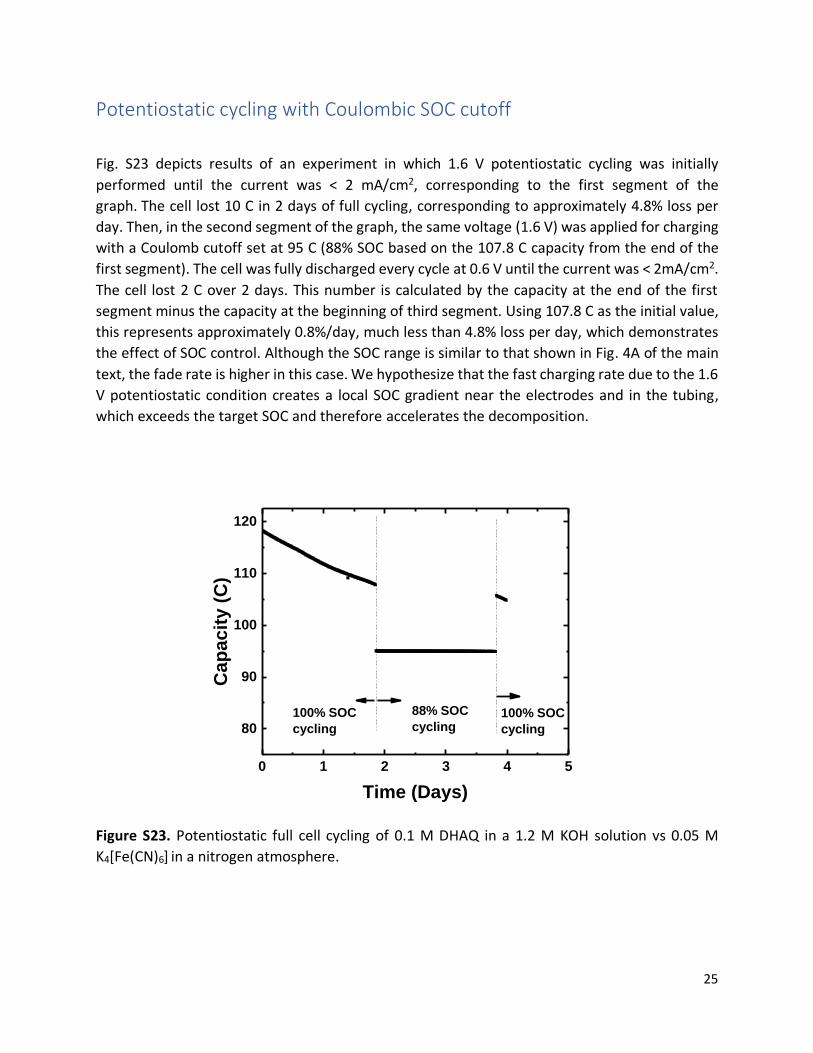
Fig. S23 depicts results of an experiment in which 1.6 V potentiostatic cycling was initially
performed until the current was < 2 mA/cm2, corresponding to the first segment of the
graph. The cell lost 10 C in 2 days of full cycling, corresponding to approximately 4.8% loss per
day. Then, in the second segment of the graph, the same voltage (1.6 V) was applied for charging
with a Coulomb cutoff set at 95 C (88% SOC based on the 107.8 C capacity from the end of the
first segment). The cell was fully discharged every cycle at 0.6 V until the current was < 2mA/cm2.
The cell lost 2 C over 2 days. This number is calculated by the capacity at the end of the first
segment minus the capacity at the beginning of third segment. Using 107.8 C as the initial value,
this represents approximately 0.8%/day, much less than 4.8% loss per day, which demonstrates
the effect of SOC control. Although the SOC range is similar to that shown in Fig. 4A of the main
text, the fade rate is higher in this case. We hypothesize that the fast charging rate due to the 1.6
V potentiostatic condition creates a local SOC gradient near the electrodes and in the tubing,
which exceeds the target SOC and therefore accelerates the decomposition.
Figure S23. Potentiostatic full cell cycling of 0.1 M DHAQ in a 1.2 M KOH solution vs 0.05 M
K4[Fe(CN)6] in a nitrogen atmosphere.
0 1 2 3 4 5
80
90
100
110
120
100% SOC
cycling
88% SOC
cycling
Ca
pac
ity (
C)
Time (Days)
100% SOC
cycling
26
Cycling of DHAQ under aerobic conditions
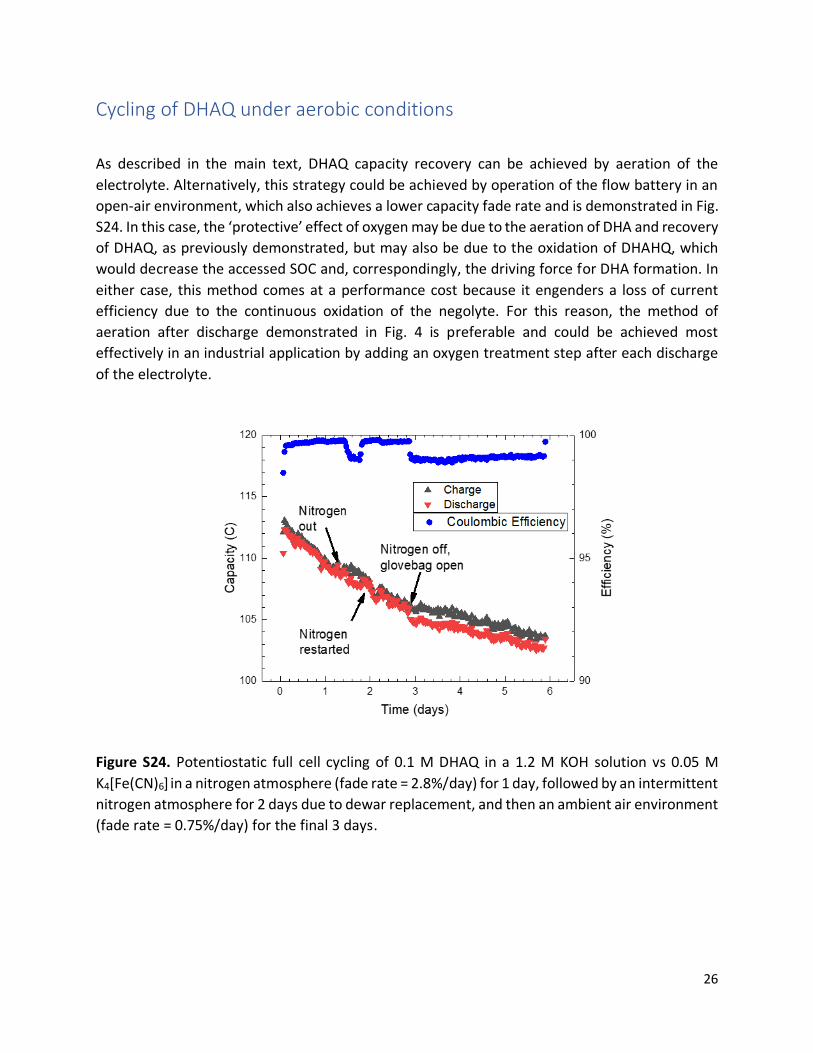
As described in the main text, DHAQ capacity recovery can be achieved by aeration of the
electrolyte. Alternatively, this strategy could be achieved by operation of the flow battery in an
open-air environment, which also achieves a lower capacity fade rate and is demonstrated in Fig.
S24. In this case, the ‘protective’ effect of oxygen may be due to the aeration of DHA and recovery
of DHAQ, as previously demonstrated, but may also be due to the oxidation of DHAHQ, which
would decrease the accessed SOC and, correspondingly, the driving force for DHA formation. In
either case, this method comes at a performance cost because it engenders a loss of current
efficiency due to the continuous oxidation of the negolyte. For this reason, the method of
aeration after discharge demonstrated in Fig. 4 is preferable and could be achieved most
effectively in an industrial application by adding an oxygen treatment step after each discharge
of the electrolyte.
Figure S24. Potentiostatic full cell cycling of 0.1 M DHAQ in a 1.2 M KOH solution vs 0.05 M
K4[Fe(CN)6] in a nitrogen atmosphere (fade rate = 2.8%/day) for 1 day, followed by an intermittent
nitrogen atmosphere for 2 days due to dewar replacement, and then an ambient air environment
(fade rate = 0.75%/day) for the final 3 days.
27
Theoretical investigation of anthrone formation susceptibility
The values plotted in Fig. 3 in the main text were generated as follows. For a set of para-quinone
molecules taken from Ref. 41 (of the main text), all possible anthrone forms were generated. For
each molecule, up to 20 conformers were generated using the RDKit;3 these were optimized at
the PM7 COSMO level of theory.4 We then calculated the energy difference of the lowest energy
anthrone form and the hydroquinone form and report this energy relative to that of DHAHQ →
DHA. The raw data for these calculations is provided on figshare with the following DOI:
10.6084/m9.figshare.7455338. An excel spreadsheet listing the molecules along with their
calculated properties is attached and a zipped version of the conformer and PM7 COSMO
calculations is provided.
In previous works,5 we have compared the accuracy of different quantum chemical methods
(upon calibration) in predicting the thermodynamic quantities of reactions associated with redox-
active organic molecules, in particular quinones. Previously, we found that both DFT (B3LYP/6-
311+G(d,p) with PCM calculated at the B3LYP/6-31+G(d) optimized geometry) and PM7 COSMO
give comparable results for predicting the two-proton two-electron reduction potential of
quinones (mean absolute deviations of 0.04 V and 0.07 V, for B3LYP/6-311+G(d,p) with PCM and
PM7 COSMO, respectively). In addition, we found for a set of ketone-gem diol equilibrium
constants, the mean absolute deviations in the calculated base-10 logarithm of this equilibrium
constant was 0.99 for B3LYP/6-311+G(d,p) with PCM and 1.23 for PM7 COSMO. This corresponds
to an error in the reaction energy of about 6.7 kJ mol-1 for PM7 COSMO. Given the scale of the
quantities being examined in this study, PM7 COSMO strikes the best balance between speed
and accuracy.
28
Annex (Details of NMR spectroscopic analysis)
Characterization of DHA
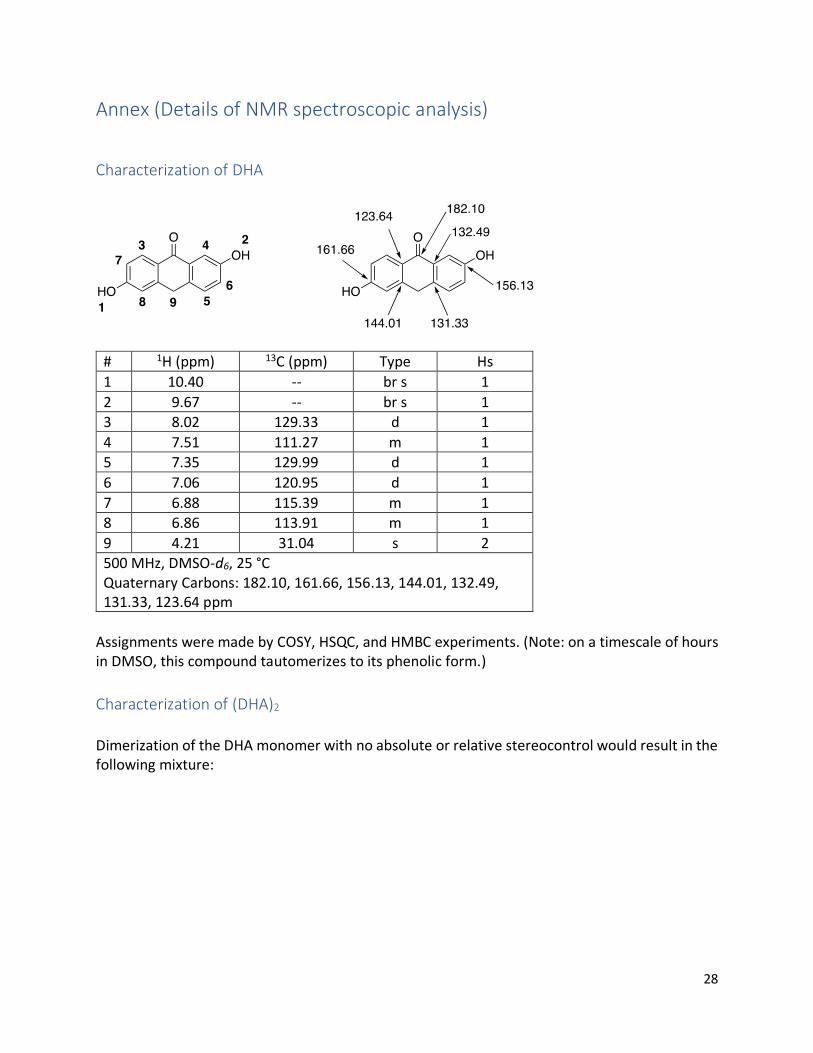
# 1H (ppm) 13C (ppm) Type Hs
1 10.40 -- br s 1
2 9.67 -- br s 1 3 8.02 129.33 d 1
4 7.51 111.27 m 1 5 7.35 129.99 d 1
6 7.06 120.95 d 1
7 6.88 115.39 m 1 8 6.86 113.91 m 1
9 4.21 31.04 s 2 500 MHz, DMSO-d6, 25 °C Quaternary Carbons: 182.10, 161.66, 156.13, 144.01, 132.49, 131.33, 123.64 ppm
Assignments were made by COSY, HSQC, and HMBC experiments. (Note: on a timescale of hours in DMSO, this compound tautomerizes to its phenolic form.)
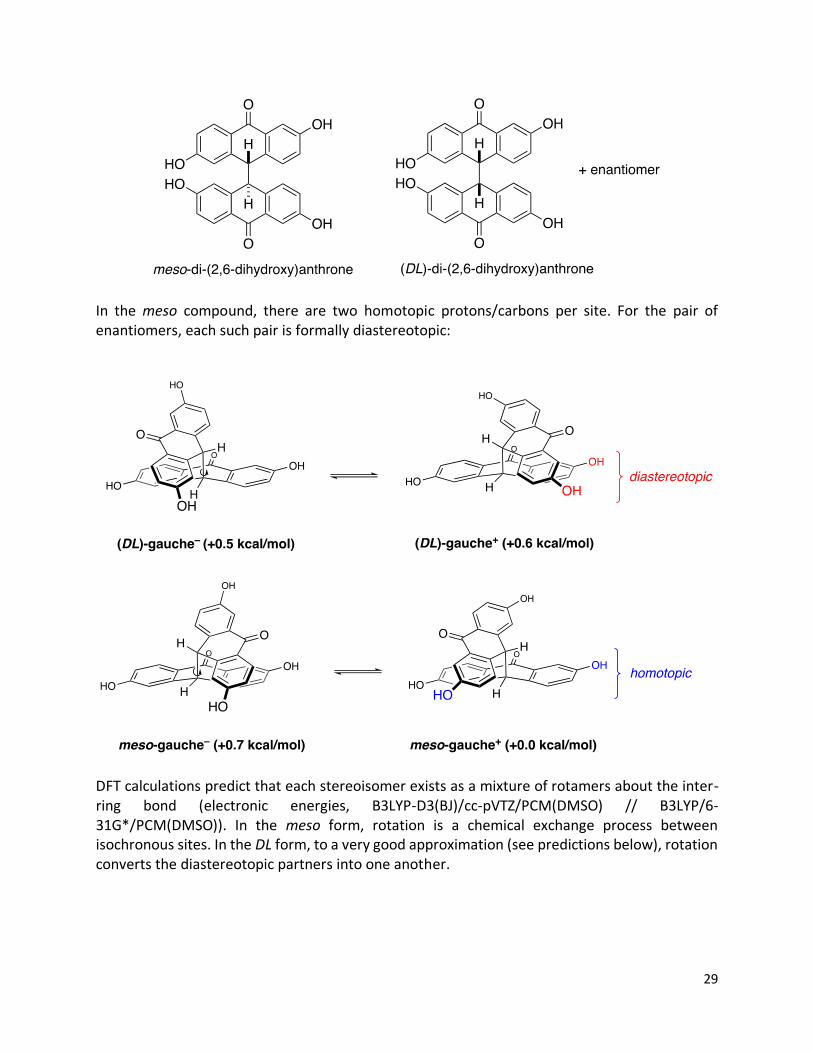
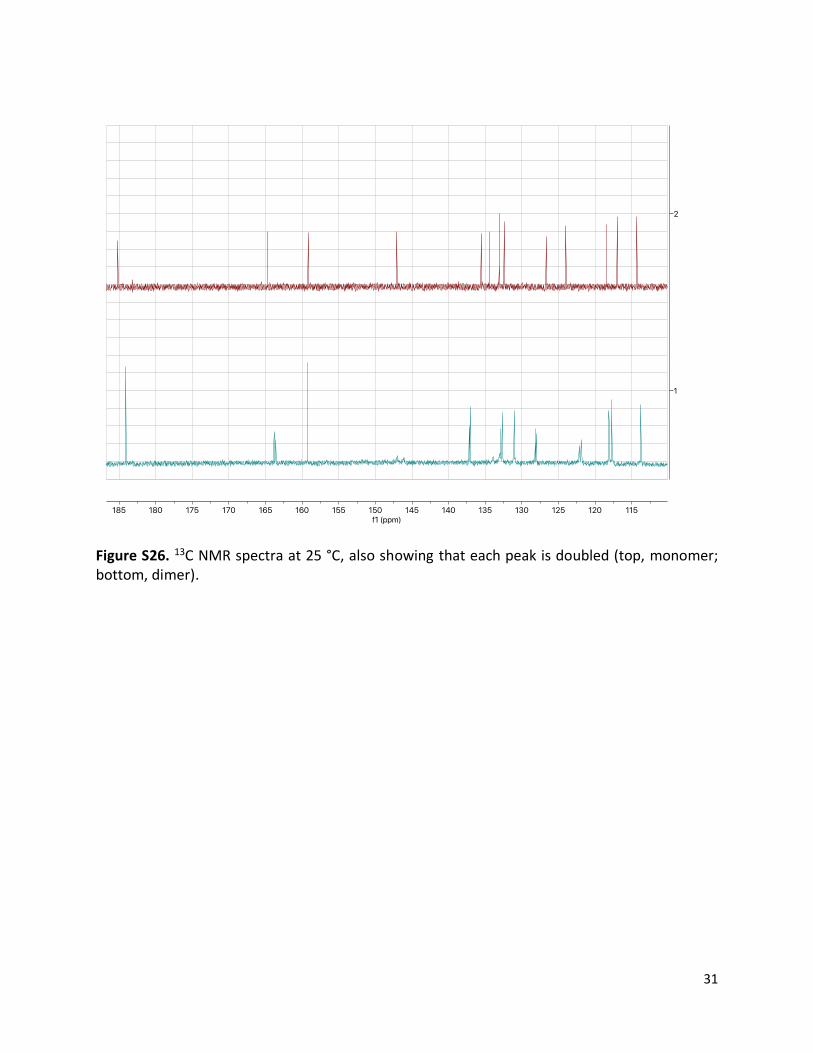
Characterization of (DHA)2 Dimerization of the DHA monomer with no absolute or relative stereocontrol would result in the following mixture:
29
In the meso compound, there are two homotopic protons/carbons per site. For the pair of enantiomers, each such pair is formally diastereotopic:
DFT calculations predict that each stereoisomer exists as a mixture of rotamers about the inter-ring bond (electronic energies, B3LYP-D3(BJ)/cc-pVTZ/PCM(DMSO) // B3LYP/6-31G*/PCM(DMSO)). In the meso form, rotation is a chemical exchange process between isochronous sites. In the DL form, to a very good approximation (see predictions below), rotation converts the diastereotopic partners into one another.
30
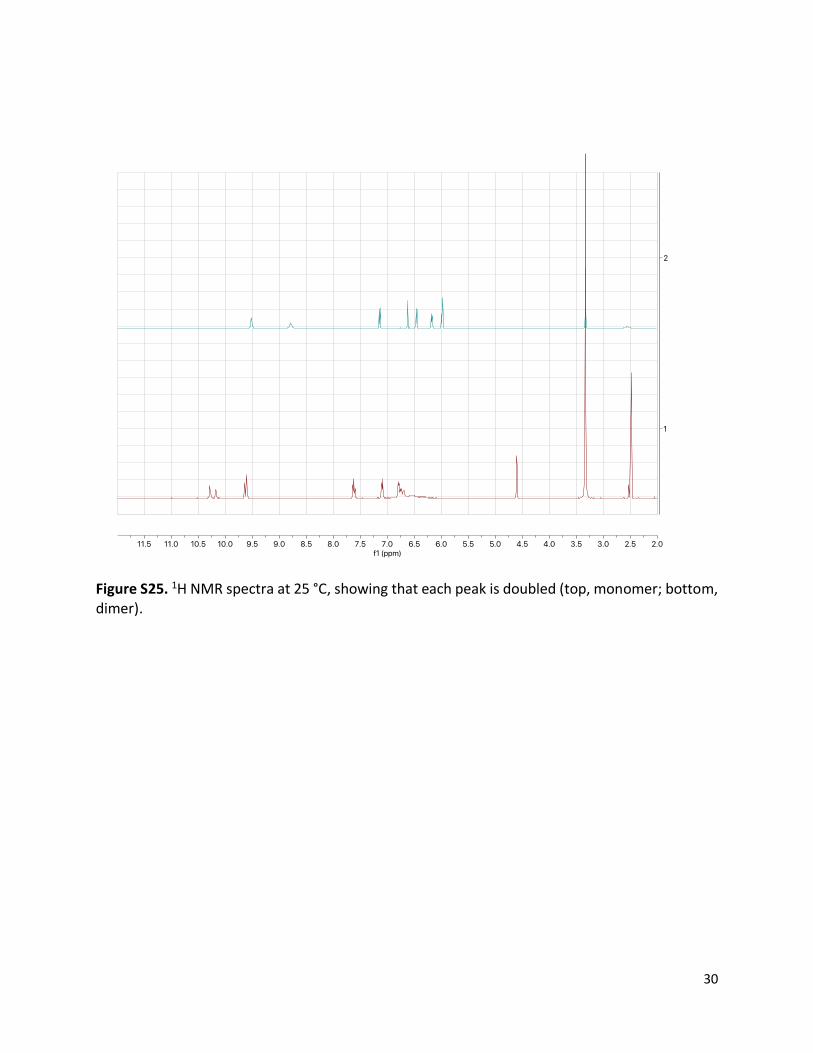
Figure S25. 1H NMR spectra at 25 °C, showing that each peak is doubled (top, monomer; bottom, dimer).
31
Figure S26. 13C NMR spectra at 25 °C, also showing that each peak is doubled (top, monomer; bottom, dimer).
32
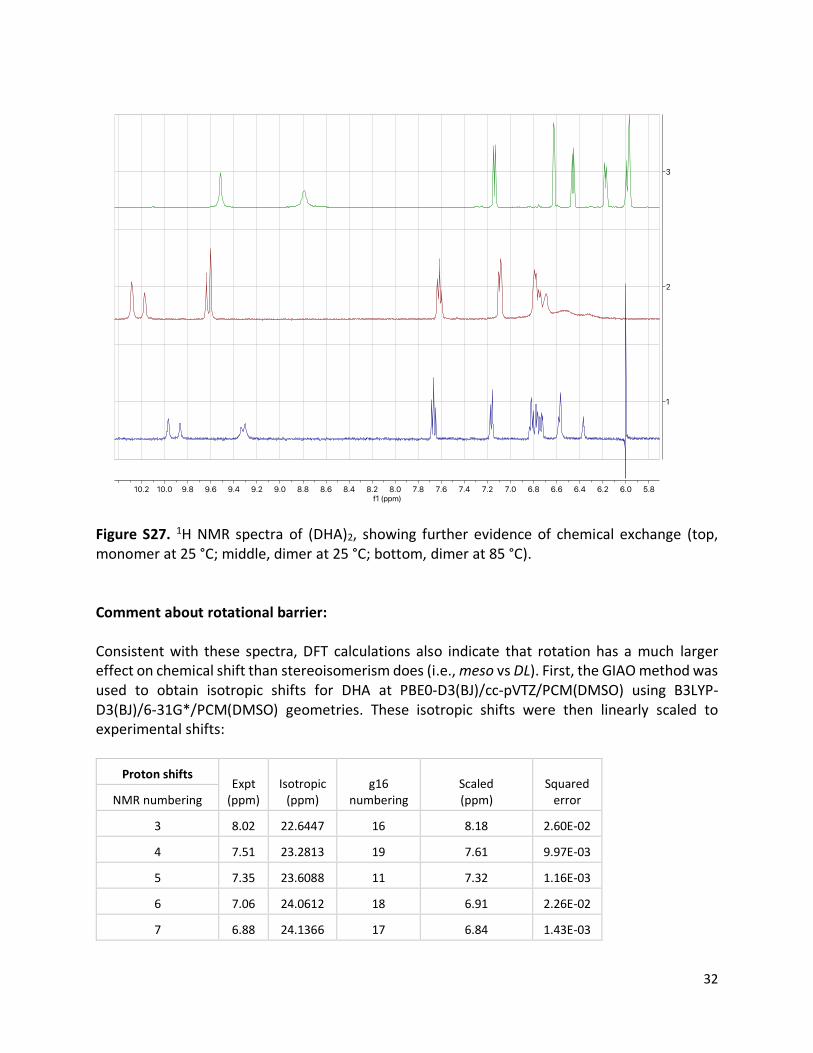
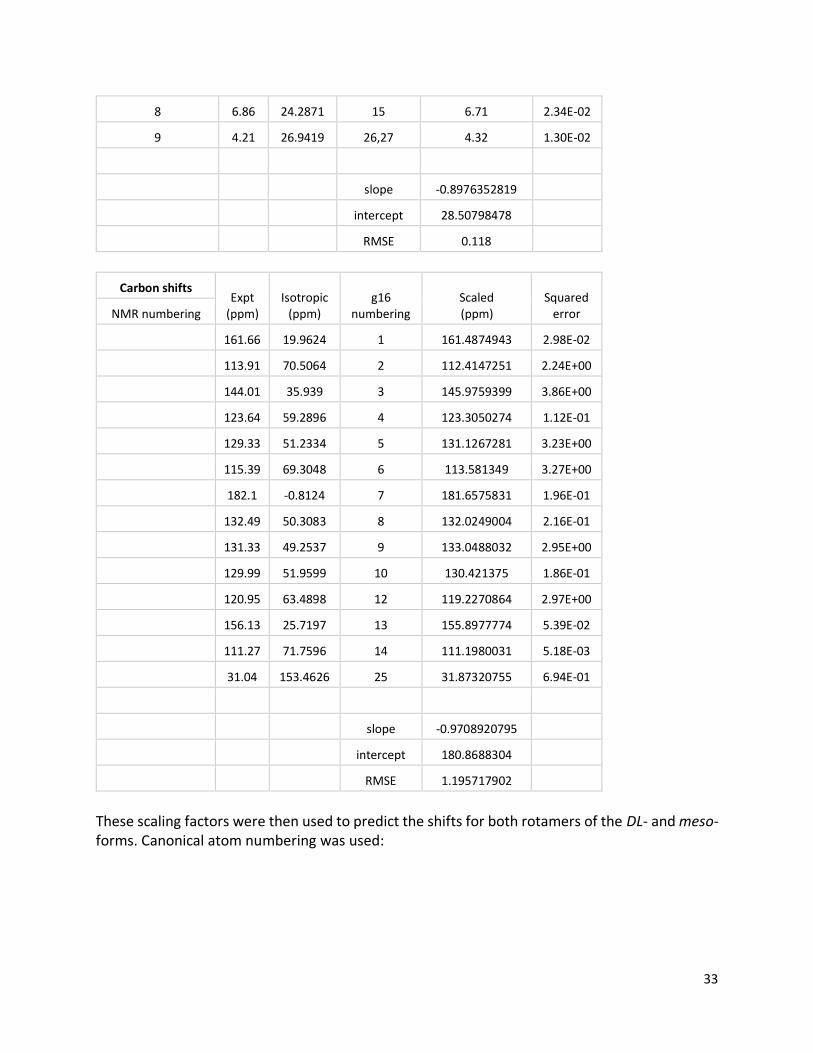
Figure S27. 1H NMR spectra of (DHA)2, showing further evidence of chemical exchange (top, monomer at 25 °C; middle, dimer at 25 °C; bottom, dimer at 85 °C). Comment about rotational barrier: Consistent with these spectra, DFT calculations also indicate that rotation has a much larger effect on chemical shift than stereoisomerism does (i.e., meso vs DL). First, the GIAO method was used to obtain isotropic shifts for DHA at PBE0-D3(BJ)/cc-pVTZ/PCM(DMSO) using B3LYP-D3(BJ)/6-31G*/PCM(DMSO) geometries. These isotropic shifts were then linearly scaled to experimental shifts:
Proton shifts Expt
(ppm) Isotropic
(ppm) g16
numbering Scaled (ppm)
Squared error NMR numbering
3 8.02 22.6447 16 8.18 2.60E-02
4 7.51 23.2813 19 7.61 9.97E-03
5 7.35 23.6088 11 7.32 1.16E-03
6 7.06 24.0612 18 6.91 2.26E-02
7 6.88 24.1366 17 6.84 1.43E-03
33
8 6.86 24.2871 15 6.71 2.34E-02
9 4.21 26.9419 26,27 4.32 1.30E-02
slope -0.8976352819
intercept 28.50798478
RMSE 0.118
Carbon shifts Expt
(ppm) Isotropic
(ppm) g16
numbering Scaled (ppm)
Squared error NMR numbering
161.66 19.9624 1 161.4874943 2.98E-02
113.91 70.5064 2 112.4147251 2.24E+00
144.01 35.939 3 145.9759399 3.86E+00
123.64 59.2896 4 123.3050274 1.12E-01
129.33 51.2334 5 131.1267281 3.23E+00
115.39 69.3048 6 113.581349 3.27E+00
182.1 -0.8124 7 181.6575831 1.96E-01
132.49 50.3083 8 132.0249004 2.16E-01
131.33 49.2537 9 133.0488032 2.95E+00
129.99 51.9599 10 130.421375 1.86E-01
120.95 63.4898 12 119.2270864 2.97E+00
156.13 25.7197 13 155.8977774 5.39E-02
111.27 71.7596 14 111.1980031 5.18E-03
31.04 153.4626 25 31.87320755 6.94E-01
slope -0.9708920795
intercept 180.8688304
RMSE 1.195717902
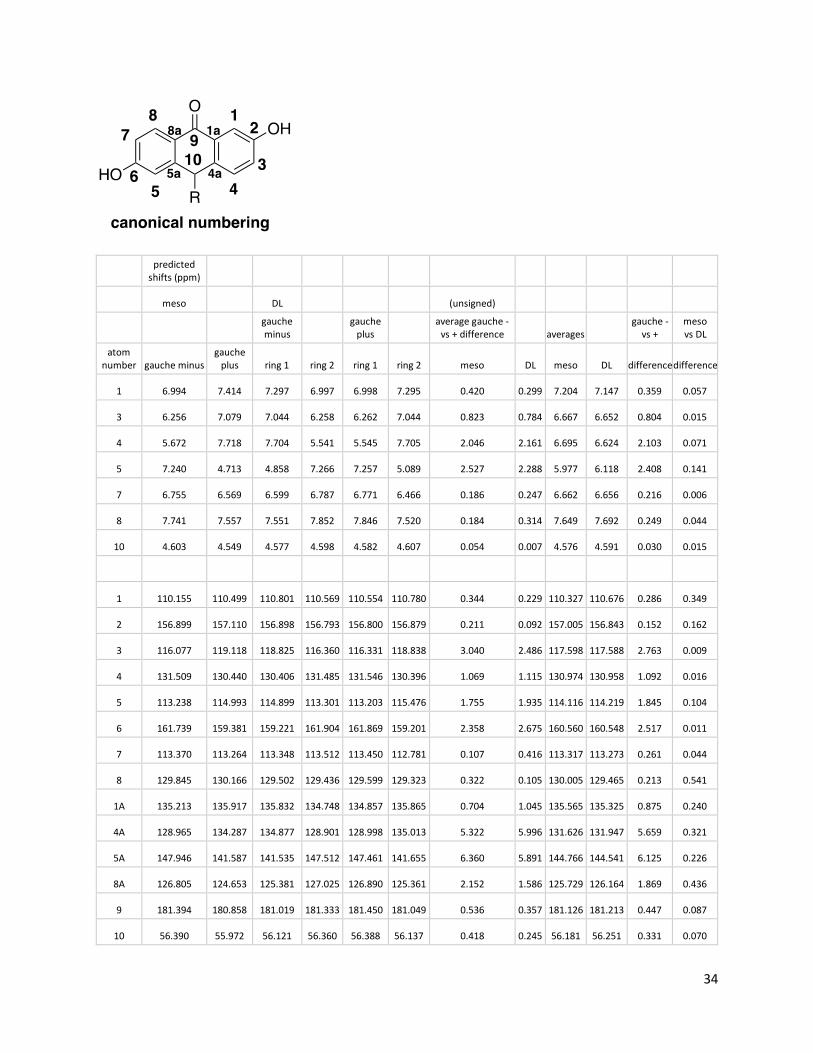
These scaling factors were then used to predict the shifts for both rotamers of the DL- and meso-forms. Canonical atom numbering was used:
34
predicted shifts (ppm)
meso DL (unsigned)
gauche minus
gauche plus
average gauche - vs + difference averages
gauche - vs +
meso vs DL
atom number gauche minus
gauche plus ring 1 ring 2 ring 1 ring 2 meso DL meso DL difference difference
1 6.994 7.414 7.297 6.997 6.998 7.295 0.420 0.299 7.204 7.147 0.359 0.057
3 6.256 7.079 7.044 6.258 6.262 7.044 0.823 0.784 6.667 6.652 0.804 0.015
4 5.672 7.718 7.704 5.541 5.545 7.705 2.046 2.161 6.695 6.624 2.103 0.071
5 7.240 4.713 4.858 7.266 7.257 5.089 2.527 2.288 5.977 6.118 2.408 0.141
7 6.755 6.569 6.599 6.787 6.771 6.466 0.186 0.247 6.662 6.656 0.216 0.006
8 7.741 7.557 7.551 7.852 7.846 7.520 0.184 0.314 7.649 7.692 0.249 0.044
10 4.603 4.549 4.577 4.598 4.582 4.607 0.054 0.007 4.576 4.591 0.030 0.015
1 110.155 110.499 110.801 110.569 110.554 110.780 0.344 0.229 110.327 110.676 0.286 0.349
2 156.899 157.110 156.898 156.793 156.800 156.879 0.211 0.092 157.005 156.843 0.152 0.162
3 116.077 119.118 118.825 116.360 116.331 118.838 3.040 2.486 117.598 117.588 2.763 0.009
4 131.509 130.440 130.406 131.485 131.546 130.396 1.069 1.115 130.974 130.958 1.092 0.016
5 113.238 114.993 114.899 113.301 113.203 115.476 1.755 1.935 114.116 114.219 1.845 0.104
6 161.739 159.381 159.221 161.904 161.869 159.201 2.358 2.675 160.560 160.548 2.517 0.011
7 113.370 113.264 113.348 113.512 113.450 112.781 0.107 0.416 113.317 113.273 0.261 0.044
8 129.845 130.166 129.502 129.436 129.599 129.323 0.322 0.105 130.005 129.465 0.213 0.541
1A 135.213 135.917 135.832 134.748 134.857 135.865 0.704 1.045 135.565 135.325 0.875 0.240
4A 128.965 134.287 134.877 128.901 128.998 135.013 5.322 5.996 131.626 131.947 5.659 0.321
5A 147.946 141.587 141.535 147.512 147.461 141.655 6.360 5.891 144.766 144.541 6.125 0.226
8A 126.805 124.653 125.381 127.025 126.890 125.361 2.152 1.586 125.729 126.164 1.869 0.436
9 181.394 180.858 181.019 181.333 181.450 181.049 0.536 0.357 181.126 181.213 0.447 0.087
10 56.390 55.972 56.121 56.360 56.388 56.137 0.418 0.245 56.181 56.251 0.331 0.070
35
From the last two columns, it is clear that rotation has a much larger effect on chemical shift than stereochemistry. Thus, the NMR spectra at room temperature are dominated by rotational effects, with each peak being slightly “doubled” by stereochemical effects. Computational Structures: Calculations were performed using Gaussian 16, revision A.03. Energies are in hartree (at B3LYP-D3(BJ)/6-31G*/PCM(DMSO)). All structures were verified to be local minima or first-order saddle points by frequency analysis as appropriate. DHA -765.269653331 C -3.78253200 -0.30739400 -0.00002200 C -2.69090800 -1.17708000 -0.00001000 C -1.38558500 -0.67938800 0.00002000 C -1.17834100 0.71159400 0.00002200 C -2.29046600 1.57627300 0.00002100 C -3.58086700 1.08466400 0.00000900 C 0.17633900 1.29490100 0.00000600 C 1.33174900 0.35840200 0.00002200 C 1.13998000 -1.03288800 -0.00000100 C 2.27190300 -1.85695000 -0.00004100 H 2.14572900 -2.93648600 -0.00006400 C 3.55552000 -1.32363000 -0.00002800 C 3.73483200 0.06861400 -0.00003100 C 2.62320000 0.90288900 -0.00001400 H -2.85782400 -2.25196300 -0.00002000 H -2.10596100 2.64499400 0.00003000 H -4.44234000 1.74420100 0.00002000 H 4.42079500 -1.98199800 -0.00000600 H 2.74410900 1.98000200 -0.00003200 O 0.35213300 2.51792700 -0.00002300 O 4.97155100 0.64952200 0.00008400 H 5.65081800 -0.04431300 -0.00065100 O -5.06842100 -0.74630400 -0.00006700 H -5.08058500 -1.71807000 -0.00005800 C -0.23371700 -1.64972200 0.00011000 H -0.33177900 -2.31376100 -0.87017700 H -0.33172100 -2.31347300 0.87062500 DL-gauche– -1529.35526268 C 2.05006000 0.81050100 2.66699100

36
C 1.60005800 -0.27500300 1.91003300 C 0.28477100 -0.31912400 1.44926800 C -0.60342100 0.71542900 1.80121000 C -0.13953700 1.79642500 2.56894600 C 1.17576700 1.85855600 2.99453600 C -2.02706800 0.66254400 1.41785900 C -2.52430800 -0.62794400 0.86595800 C -1.62378700 -1.63423100 0.47719900 C -2.14177300 -2.83051200 -0.02699200 H -1.46229300 -3.61859000 -0.34068500 C -3.51444400 -3.03070100 -0.14238100 C -4.40302900 -2.01588200 0.24353700 C -3.90384400 -0.81805800 0.74867400 H 2.29311000 -1.06961300 1.64924800 H -0.84030700 2.58466900 2.82176700 H 1.54527900 2.69319700 3.58086900 H -3.89917300 -3.97139400 -0.52838800 H -4.57934300 -0.02542800 1.04936000 O -2.78924700 1.61513600 1.60167900 O -5.75798000 -2.14997300 0.14960500 H -5.97016400 -3.02348500 -0.21766400 O 3.33308100 0.90641000 3.10305400 H 3.84277900 0.14532300 2.77847500 C -0.14035400 -1.38610000 0.47752400 H 0.38534400 -2.31923100 0.70154400 C 3.93217300 -2.20809400 -1.02635300 C 2.53599600 -2.19461900 -1.11363800 C 1.83907800 -0.98936200 -1.07444300 C 2.55002100 0.21988900 -0.95117200 C 3.94907700 0.19293000 -0.85270700 C 4.64406500 -1.00485100 -0.88658900 C 1.84700000 1.51776300 -0.90548100 C 0.41095600 1.51374300 -1.29601600 C -0.28477500 0.30146700 -1.45719700 C -1.60070000 0.35293300 -1.92723400 H -2.15534900 -0.56848700 -2.07084000 C -2.22316800 1.56781000 -2.20059000 C -1.53190400 2.76967900 -1.99683200 C -0.21030400 2.73756900 -1.55634800 H 2.00730200 -3.13916800 -1.20142000 H 4.47658900 1.13441300 -0.74494100 H 5.72820400 -1.02019700 -0.81461500 H -3.24689000 1.58375800 -2.56541600 H 0.34622100 3.65791200 -1.42139000
37
O 2.43293300 2.56498400 -0.62021900 O -2.09294800 3.99173100 -2.22982300 H -3.00900000 3.87394000 -2.53002300 O 4.54764400 -3.41747900 -1.07982300 H 5.50935000 -3.29708800 -1.00889800 C 0.33400500 -0.99816600 -1.02232800 H -0.04317900 -1.81454100 -1.64536700 DL-gauche+ -1529.35491200 C -3.93002700 -2.23717900 -1.01105900 C -2.53326000 -2.21996200 -1.08700500 C -1.84105400 -1.01192900 -1.05779200 C -2.55691100 0.19616800 -0.95261000 C -3.95656900 0.16532000 -0.86526900 C -4.64721900 -1.03495400 -0.89310900 C -1.85844800 1.49672600 -0.92131800 C -0.42262600 1.49292300 -1.31366500 C 0.27712000 0.28105500 -1.45982000 C 1.59151800 0.33047800 -1.93429100 H 2.14883300 -0.59100500 -2.06683200 C 2.20909700 1.54360300 -2.22590100 C 1.51431400 2.74568200 -2.03620700 C 0.19383200 2.71516600 -1.59206700 H -2.00058600 -3.16356100 -1.15967000 H -4.48832300 1.10603600 -0.77261300 H -5.73194700 -1.05316100 -0.83060500 H 3.23178300 1.55825600 -2.59376200 H -0.36541800 3.63545500 -1.46831600 O -2.44752100 2.54571300 -0.64879100 O 2.07081500 3.96644700 -2.28664100 H 2.98633400 3.84751600 -2.58798100 O -4.54091300 -3.44952800 -1.05508600 H -5.50337700 -3.33160100 -0.99111800 C -0.33610400 -1.01426200 -1.00492200 H 0.04383100 -1.83806700 -1.61646200 C -2.03093300 0.84350800 2.68358700 C -1.58832300 -0.24956700 1.93174600 C -0.28056000 -0.29609000 1.45628000 C 0.61040100 0.74776400 1.78070200 C 0.15324300 1.83925200 2.53339500 C -1.15779200 1.90192200 2.97779700 C 2.03134200 0.68976100 1.38764200 C 2.52667400 -0.61238700 0.86214900
38
C 1.62448700 -1.62677300 0.49890400 C 2.14059000 -2.83366500 0.01863800 H 1.45984100 -3.62814400 -0.27562400 C 3.51287400 -3.03659400 -0.09722700 C 4.40296800 -2.01383000 0.26335100 C 3.90573200 -0.80509400 0.74382900 H -2.29259700 -1.04048000 1.69926900 H 0.85330200 2.63460700 2.76497400 H -1.50744500 2.75151400 3.55815300 H 3.89609100 -3.98563300 -0.46389400 H 4.58232200 -0.00603100 1.02440800 O 2.79306900 1.64746600 1.54462400 O 5.75764200 -2.15025700 0.16778200 H 5.96837500 -3.03143900 -0.18151600 O -3.32665300 0.82693000 3.09252100 H -3.51980500 1.63544900 3.59568300 C 0.14092700 -1.37813400 0.49940000 H -0.38449300 -2.30730000 0.73966100 meso-gauche– -1529.35478937 C -3.74173300 -2.67353100 -0.51987200 C -2.34860900 -2.57916700 -0.60417200 C -1.73798700 -1.34602600 -0.81672200 C -2.53183500 -0.19039500 -0.94578500 C -3.92714700 -0.29606700 -0.84769600 C -4.53773900 -1.52155400 -0.63689200 C -1.91903200 1.13323300 -1.17721700 C -0.48834700 1.14161600 -1.58877400 C 0.28889700 -0.02742000 -1.49698000 C 1.59365600 0.00566900 -1.99882500 H 2.21081100 -0.88547700 -1.94587800 C 2.12612200 1.16734400 -2.55035800 C 1.35385300 2.33592500 -2.59912300 C 0.04291600 2.31599900 -2.12750900 H -1.75441400 -3.48141200 -0.49366800 H -4.52017700 0.60747700 -0.93904500 H -5.61964400 -1.59800800 -0.56730900 H 3.14280400 1.17060900 -2.93494900 H -0.57456900 3.20502900 -2.18458200 O -2.57318900 2.17618900 -1.10359700 O 1.82496600 3.50974600 -3.11177300 H 2.74261300 3.38790400 -3.40514000 O -4.26925600 -3.90954000 -0.32240500
39
H -5.23791900 -3.84802500 -0.27977900 C -0.23696200 -1.23612800 -0.77382100 H 0.20469900 -2.14262100 -1.19837300 C 3.74195400 -2.67336600 0.51976800 C 2.34881800 -2.57908300 0.60395200 C 1.73811300 -1.34600100 0.81660400 C 2.53189300 -0.19034900 0.94591100 C 3.92721900 -0.29593900 0.84794400 C 4.53789200 -1.52136600 0.63702100 C 1.91900400 1.13322000 1.17745000 C 0.48827600 1.14148600 1.58886100 C -0.28890300 -0.02757500 1.49685100 C -1.59373300 0.00540500 1.99851900 H -2.21084800 -0.88575700 1.94537400 C -2.12631800 1.16699600 2.55011600 C -1.35409900 2.33560100 2.59912200 C -0.04310200 2.31578300 2.12767100 H 1.75467800 -3.48134400 0.49327700 H 4.52019600 0.60762100 0.93947200 H 5.61980700 -1.59775700 0.56752900 H -3.14305200 1.17017700 2.93457000 H 0.57433800 3.20483400 2.18491800 O 2.57313700 2.17621000 1.10410100 O -1.82532600 3.50934500 3.11184300 H -2.74300700 3.38743500 3.40507400 O 4.26955600 -3.90932300 0.32218200 H 5.23822000 -3.84775400 0.27965300 C 0.23708300 -1.23617900 0.77361700 H -0.20454800 -2.14273200 1.19807100 meso-gauche+ -1529.35525686 C -2.03805300 1.33075500 -2.41415000 C -1.53419600 0.12139100 -1.92338100 C -0.22011400 0.03606900 -1.47120300 C 0.61758400 1.16726500 -1.56185600 C 0.09942900 2.37319800 -2.05576800 C -1.21923500 2.46890400 -2.47078000 C 2.04371900 1.09685600 -1.19128900 C 2.60373000 -0.25907700 -0.93772700 C 1.75357400 -1.36962200 -0.79843000 C 2.33081500 -2.62179400 -0.56925800 H 1.69202800 -3.49334700 -0.45254900 C 3.71138200 -2.77506800 -0.48068200
40
C 4.54870000 -1.65756100 -0.61438300 C 3.99085500 -0.40236300 -0.84405200 H -2.19619300 -0.73541900 -1.87401600 H 0.75860900 3.23283000 -2.10936200 H -1.61609900 3.40727400 -2.84861000 H 4.14215000 -3.75828600 -0.30986500 H 4.62541600 0.47028000 -0.94797800 O 2.75972100 2.10113400 -1.15183600 O 5.90835600 -1.74467100 -0.53304000 H 6.16232800 -2.66856200 -0.37425500 O -3.33616000 1.34066200 -2.81361900 H -3.57609700 2.23069000 -3.12113400 C 0.25865200 -1.20500700 -0.76847100 H -0.21119300 -2.08676100 -1.21426200 C 2.03805300 1.33077400 2.41414300 C 1.53419600 0.12140600 1.92338400 C 0.22011300 0.03608100 1.47120800 C -0.61758500 1.16727700 1.56185100 C -0.09942900 2.37321400 2.05575300 C 1.21923400 2.46892400 2.47076300 C -2.04372000 1.09686400 1.19128800 C -2.60373000 -0.25907100 0.93773100 C -1.75357400 -1.36961600 0.79844300 C -2.33081400 -2.62178900 0.56927600 H -1.69202700 -3.49334300 0.45257400 C -3.71138100 -2.77506400 0.48069700 C -4.54870000 -1.65755600 0.61438900 C -3.99085600 -0.40235700 0.84405200 H 2.19619200 -0.73540500 1.87402700 H -0.75860900 3.23284700 2.10934000 H 1.61609900 3.40729700 2.84858500 H -4.14214900 -3.75828300 0.30988500 H -4.62541600 0.47028700 0.94797100 O -2.75972000 2.10114300 1.15181600 O -5.90835500 -1.74466600 0.53304100 H -6.16232700 -2.66855800 0.37425900 O 3.33616000 1.34068500 2.81361000 H 3.57609700 2.23071600 3.12111700 C -0.25865200 -1.20500100 0.76848500 H 0.21119300 -2.08675200 1.21428300
41
References
1. Goulet, M.-A.; Aziz, M. J., Flow Battery Molecular Reactant Stability Determined by Symmetric Cell Cycling Methods. J. Electrochem. Soc. 2018, 165 (7), A1466-A1477.
2. Goodall, F. L.; Perkin, A. G., LVIII.—Reduction products of the hydroxyanthraquinones. Part V. J. Chem. Soc, Trans. 1924, 125, 470-476.
3. RDKit: Open Source Cheminformatic Software, http://www.rdkit.org/. 4. Stewart, J. J. P. MOPAC2016, Version: 17.173L. 5. Tabor, D. P.; Gómez-Bombarelli, R.; Tong, L.; Gordon, R. G.; Aziz, M. J.; Aspuru-Guzik, A., Theoretical
and Experimental Investigation of the Stability Limits of Quinones in Aqueous Media: Implications for
Organic Aqueous Redox Flow Batteries. 2018. ChemRxiv preprint:
doi.org/10.26434/chemrxiv.6990053.v2


![A lifetime-extending forwarder1.9 References [proposal.bibliography] —A forwarder implementation, Vincent Reverdy, Github (July 2020) — N4860: Draft International Standard - Programming](https://img.pdfslide.net/doc/110x75/60c3302d070293206f677138/a-lifetime-extending-19-references-proposalbibliography-aa-forwarder-implementation.jpg)