Embed Size (px)
Citation preview
International Journal of Research in Engineering and Applied Sciences(IJREAS) Available online at http://euroasiapub.org/journals.php Vol. 7 Issue 5, May-2017, pp. 70~80 ISSN (O): 2249-3905, ISSN(P): 2349-6525 | Impact Factor: 7.196 | Thomson Reuters Researcher ID: L-5236-2015
International Journal of Research in Engineering & Applied Sciences
Email:- [email protected], http://www.euroasiapub.org
An open access scholarly, online, peer-reviewed, interdisciplinary, monthly, and fully refereed journal
70
Geological and structural interpretation of possible mineralization zones of part of
Anambra basin and Southern Benue Trough using airborne geophysical data.
Eze, M.O 1,
Department of Geology
Micheal Okpara University of Agriculture, Umudike, Abia state.
Dr. L. I. Mamah2,
Department of Geology
University Of Nigeria Nsukka
Dr, A.J.C. Madu3,
Department of Geology
Micheal Okpara University Of Agriculture, Umudike, Abia Stae
Onuba, Leonard4
Nnamdi Azikiwe University, Awka
Abstract
Nine (9) high-resolution of aeromagnetic and radiometric data of the Benue Trough and adjacent
Anambra Basin, were evaluated to understand the subsurface geological structure of the
area. Various data enhancement/derivative techniques like analytic signal, first and second
vertical derivatives, horizontal derivative and tilt derivative were employed in delineating
magnetic lineaments, edges, lithological boundaries, and contact zones within the area. The
results obtained revealed magnetic lineaments, shear zones and shallow faults, trending mostly in
NE-SW, E-W, and NW-SE directions. The ternary image generated from Radiometric data using
oasis Montaj software highlights the lithology of Asu River Group, Eze-Aku Formation, Agwu Shale,
Nkporo Shale, Nsukka Formation and Ajali Sandstone. This shows an improved version of the
geological mapping of the study area
Keywords: Lineaments, Structures, Filtering, Magnetic field.
INTRODUCTION
Magnetic data gives information on the structural fabric of the basement but improvements in
instrument resolution and acquisition techniques have allowed for the utilization for mapping
weakly magnetic intra-sedimentary structures. High resolution airborne magnetic and gamma ray
spectrometric surveys are fundamental to modern geoscientific mapping. They provide cost-
effective definition of structure lithology (Telford et.al, 1990). Airborne radiometric survey is used
to measure variations in the radioactive minerals composition in order to map lateral lithological
changes (Wilford et.al, 1997). This method involves the measurement of naturally occurring
radioactive elements that exist in rock forming minerals and soil profiles. These lateral variations
International Journal of Research in Engineering and Applied Sciences (IJREAS) Vol. 7Issue 5, Month - 2017 ISSN(O): 2249-3905, ISSN(P): 2349-6525 | Impact Factor: 7.196
International Journal of Research in Engineering & Applied Sciences Email:- [email protected], http://www.euroasiapub.org
An open access scholarly, online, peer-reviewed, interdisciplinary, monthly, and fully refereed journals
71
produce anomalous regions which are indicative of radioactive of structural or lithological
contrasts. The geographical information system (GIS) has facilitated an unprecedented integration
of digital geophysical data with independent vector and raster information. A GIS allows the ready
amalgamation of diverse data sets such as remotely sensed images, digital elevation models,
magnetic data, electromagnetic data, gamma ray data and gravity data, to name but a few.
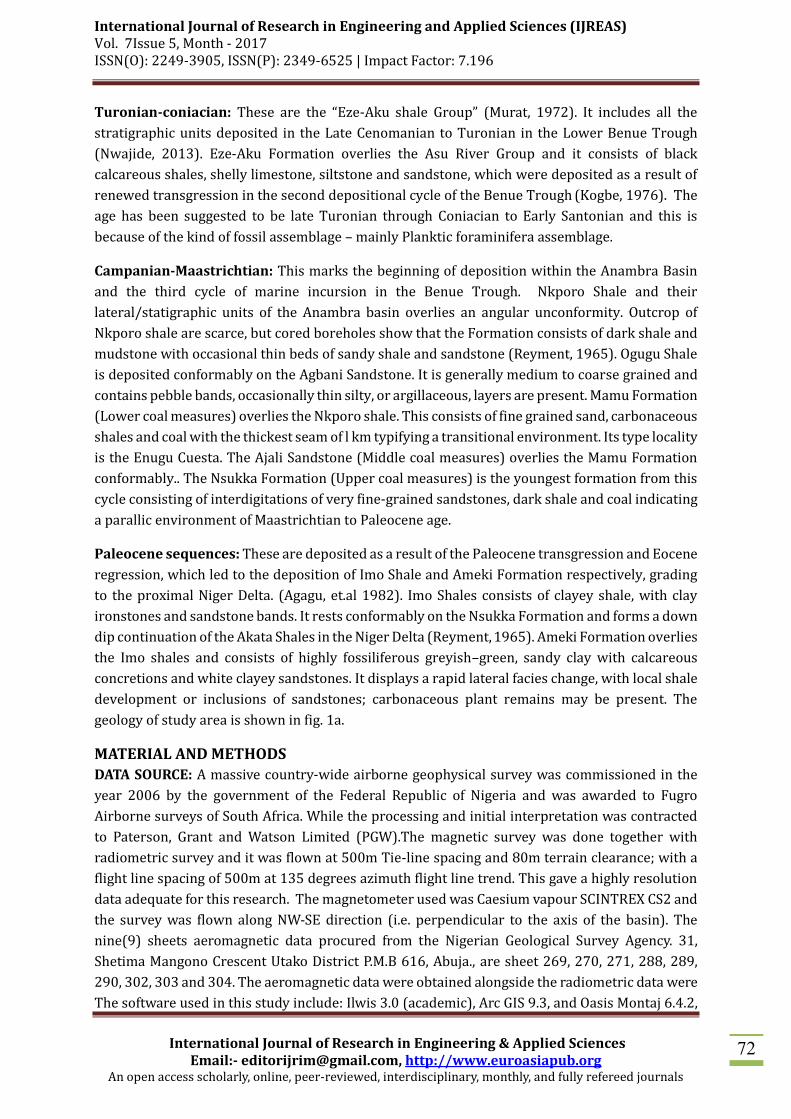
Geology of Southern Benue Trough and Upper Anambra Basin:
The study area covers the Southern Benue trough, upper Anambra basin and Nigeria Basement
complex bounded it at the South Eastern portion of the study area. The area is bounded by
Longitude 7.30oE to 9.00oE and Latitude 6.000N to 7.30oN. During the Cretaceous, progressive sea
level rise from Albian-Maastrichitian are the main factor responsible for sedimentation within the
Benue trough.
Albian–cenomanian: Asu River Group represents the first and oldest unit of shallow marine to
brackish water sediments deposited on the basement complex. The group occupies the core of
the Abakaliki fold belt (Nwajide, 2013). The subdivision of the group into the component
formations by Reyment (1965) has been in use. But Nwajide (2013) has repackaged Asu River
Group such that the Ogoja Sandstone, Awi Formation, Mamfe Formation, Abakaliki Formation and
Mfamosing limestone are all under Asu River Group Formations. Ogoja sandstone is the basal
parts of the Asu River group and consists of conglomerates and arkosic sandstones in both Ikom
and Ogoja areas (Uzuakpunwa, 1980; Petters et.al 1987). The Awi Formation is the basal, non-
calcareous, sandy, conglomeratic unit of the Asu River Group directly overlying the Basement
complex (Oban Massif) north of Calabar. The sediment is Albian sediment which always deposited
in a a shallow marine environment (Reyment; 1965).
International Journal of Research in Engineering and Applied Sciences (IJREAS) Vol. 7Issue 5, Month - 2017 ISSN(O): 2249-3905, ISSN(P): 2349-6525 | Impact Factor: 7.196
International Journal of Research in Engineering & Applied Sciences Email:- [email protected], http://www.euroasiapub.org
An open access scholarly, online, peer-reviewed, interdisciplinary, monthly, and fully refereed journals
72
Turonian-coniacian: These are the “Eze-Aku shale Group” (Murat, 1972). It includes all the
stratigraphic units deposited in the Late Cenomanian to Turonian in the Lower Benue Trough
(Nwajide, 2013). Eze-Aku Formation overlies the Asu River Group and it consists of black
calcareous shales, shelly limestone, siltstone and sandstone, which were deposited as a result of
renewed transgression in the second depositional cycle of the Benue Trough (Kogbe, 1976). The
age has been suggested to be late Turonian through Coniacian to Early Santonian and this is
because of the kind of fossil assemblage – mainly Planktic foraminifera assemblage.
Campanian-Maastrichtian: This marks the beginning of deposition within the Anambra Basin
and the third cycle of marine incursion in the Benue Trough. Nkporo Shale and their
lateral/statigraphic units of the Anambra basin overlies an angular unconformity. Outcrop of
Nkporo shale are scarce, but cored boreholes show that the Formation consists of dark shale and
mudstone with occasional thin beds of sandy shale and sandstone (Reyment, 1965). Ogugu Shale
is deposited conformably on the Agbani Sandstone. It is generally medium to coarse grained and
contains pebble bands, occasionally thin silty, or argillaceous, layers are present. Mamu Formation
(Lower coal measures) overlies the Nkporo shale. This consists of fine grained sand, carbonaceous
shales and coal with the thickest seam of l km typifying a transitional environment. Its type locality
is the Enugu Cuesta. The Ajali Sandstone (Middle coal measures) overlies the Mamu Formation
conformably.. The Nsukka Formation (Upper coal measures) is the youngest formation from this
cycle consisting of interdigitations of very fine-grained sandstones, dark shale and coal indicating
a parallic environment of Maastrichtian to Paleocene age.
Paleocene sequences: These are deposited as a result of the Paleocene transgression and Eocene
regression, which led to the deposition of Imo Shale and Ameki Formation respectively, grading
to the proximal Niger Delta. (Agagu, et.al 1982). Imo Shales consists of clayey shale, with clay
ironstones and sandstone bands. It rests conformably on the Nsukka Formation and forms a down
dip continuation of the Akata Shales in the Niger Delta (Reyment, 1965). Ameki Formation overlies
the Imo shales and consists of highly fossiliferous greyish–green, sandy clay with calcareous
concretions and white clayey sandstones. It displays a rapid lateral facies change, with local shale
development or inclusions of sandstones; carbonaceous plant remains may be present. The
geology of study area is shown in fig. 1a.
MATERIAL AND METHODS
DATA SOURCE: A massive country-wide airborne geophysical survey was commissioned in the
year 2006 by the government of the Federal Republic of Nigeria and was awarded to Fugro
Airborne surveys of South Africa. While the processing and initial interpretation was contracted
to Paterson, Grant and Watson Limited (PGW).The magnetic survey was done together with
radiometric survey and it was flown at 500m Tie-line spacing and 80m terrain clearance; with a
flight line spacing of 500m at 135 degrees azimuth flight line trend. This gave a highly resolution
data adequate for this research. The magnetometer used was Caesium vapour SCINTREX CS2 and
the survey was flown along NW-SE direction (i.e. perpendicular to the axis of the basin). The
nine(9) sheets aeromagnetic data procured from the Nigerian Geological Survey Agency. 31,
Shetima Mangono Crescent Utako District P.M.B 616, Abuja., are sheet 269, 270, 271, 288, 289,
290, 302, 303 and 304. The aeromagnetic data were obtained alongside the radiometric data were
The software used in this study include: Ilwis 3.0 (academic), Arc GIS 9.3, and Oasis Montaj 6.4.2,
International Journal of Research in Engineering and Applied Sciences (IJREAS) Vol. 7Issue 5, Month - 2017 ISSN(O): 2249-3905, ISSN(P): 2349-6525 | Impact Factor: 7.196
International Journal of Research in Engineering & Applied Sciences Email:- [email protected], http://www.euroasiapub.org
An open access scholarly, online, peer-reviewed, interdisciplinary, monthly, and fully refereed journals
73
Excel spreadsheet.
Airborne geophysical data processing and interpretation were carried out using Oasis Montaj 6.4
mapping and processing system with geosoft executable (GX) plugins. This involved generation of
information related to structural features in the frequency and space domain using automated
Fast Fourier Transforms (FFT).
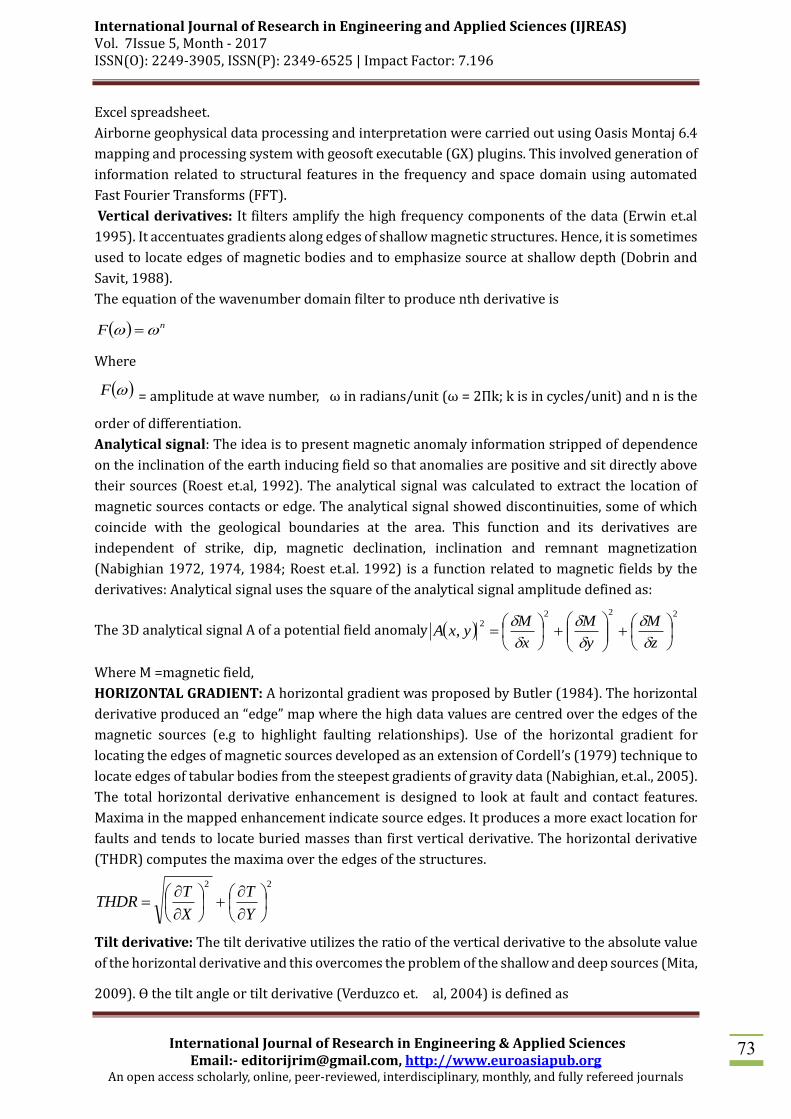
Vertical derivatives: It filters amplify the high frequency components of the data (Erwin et.al
1995). It accentuates gradients along edges of shallow magnetic structures. Hence, it is sometimes
used to locate edges of magnetic bodies and to emphasize source at shallow depth (Dobrin and
Savit, 1988).
The equation of the wavenumber domain filter to produce nth derivative is
nF
Where
F = amplitude at wave number, ω in radians/unit (ω = 2Пk; k is in cycles/unit) and n is the
order of differentiation.
Analytical signal: The idea is to present magnetic anomaly information stripped of dependence
on the inclination of the earth inducing field so that anomalies are positive and sit directly above
their sources (Roest et.al, 1992). The analytical signal was calculated to extract the location of
magnetic sources contacts or edge. The analytical signal showed discontinuities, some of which
coincide with the geological boundaries at the area. This function and its derivatives are
independent of strike, dip, magnetic declination, inclination and remnant magnetization
(Nabighian 1972, 1974, 1984; Roest et.al. 1992) is a function related to magnetic fields by the
derivatives: Analytical signal uses the square of the analytical signal amplitude defined as:
The 3D analytical signal A of a potential field anomaly 222
2,
z
M
y
M
x
MyxA
Where M =magnetic field,
HORIZONTAL GRADIENT: A horizontal gradient was proposed by Butler (1984). The horizontal
derivative produced an “edge” map where the high data values are centred over the edges of the
magnetic sources (e.g to highlight faulting relationships). Use of the horizontal gradient for
locating the edges of magnetic sources developed as an extension of Cordell’s (1979) technique to
locate edges of tabular bodies from the steepest gradients of gravity data (Nabighian, et.al., 2005).
The total horizontal derivative enhancement is designed to look at fault and contact features.
Maxima in the mapped enhancement indicate source edges. It produces a more exact location for
faults and tends to locate buried masses than first vertical derivative. The horizontal derivative
(THDR) computes the maxima over the edges of the structures.
22
Y
T
X
TTHDR
Tilt derivative: The tilt derivative utilizes the ratio of the vertical derivative to the absolute value
of the horizontal derivative and this overcomes the problem of the shallow and deep sources (Mita,
2009). Ө the tilt angle or tilt derivative (Verduzco et. al, 2004) is defined as
International Journal of Research in Engineering and Applied Sciences (IJREAS) Vol. 7Issue 5, Month - 2017 ISSN(O): 2249-3905, ISSN(P): 2349-6525 | Impact Factor: 7.196
International Journal of Research in Engineering & Applied Sciences Email:- [email protected], http://www.euroasiapub.org
An open access scholarly, online, peer-reviewed, interdisciplinary, monthly, and fully refereed journals
74
Ө = tan-1 h
fz
f
Where the total horizontal derivative is
21
22
y
fx
fh
f
Since the tilt filter is expressions of horizontal and vertical gradients, it has the tendency to amplify
field variations from shallow sources, highlight the location of sub vertical edges and provide
estimates of the depth to sources (fig. 13c).
The data was georeferenced using the geographical coordinate system. Image enhancement and
analysis were carried out using oasis montaj 6.4 software and the ArcmapTM 10.3 was used to
abstract the lineament and the rose diagram was drawn using the ILEWIS 3.1 academic software.
The data was analysed qualitatively guided by the geologic concepts of the Anambra and Lower
Benue trough.
RESULTS AND DISCUSSION
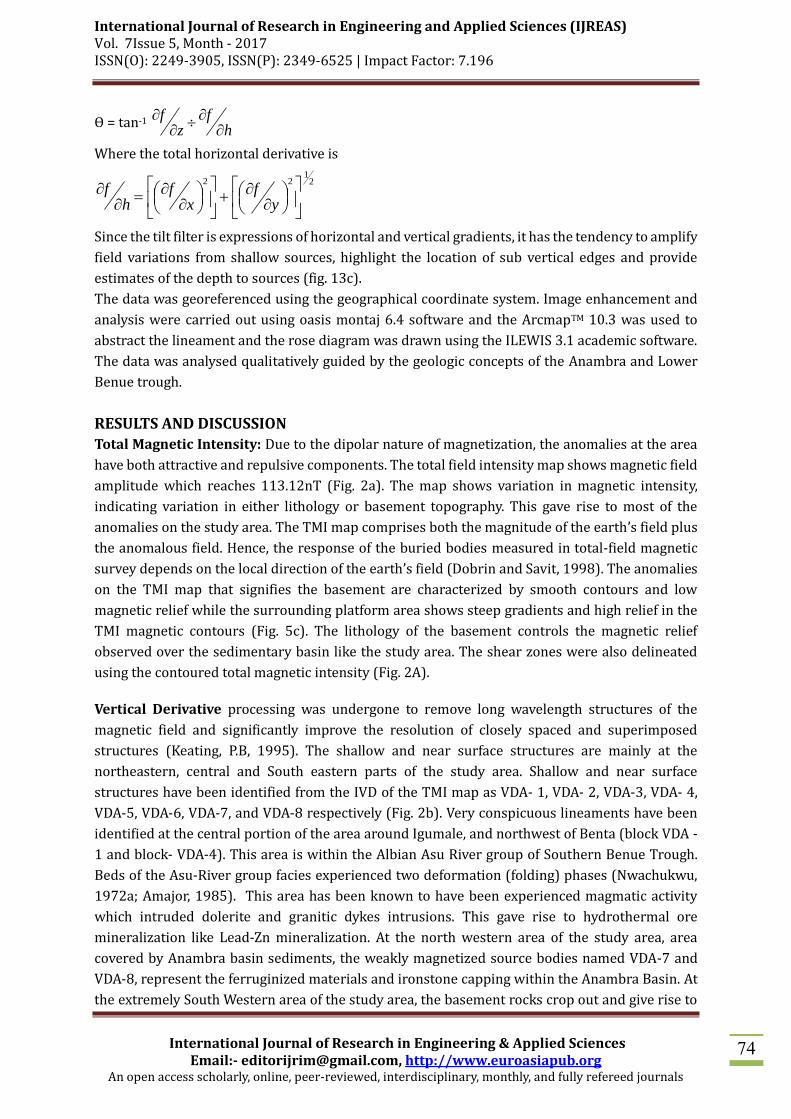
Total Magnetic Intensity: Due to the dipolar nature of magnetization, the anomalies at the area
have both attractive and repulsive components. The total field intensity map shows magnetic field
amplitude which reaches 113.12nT (Fig. 2a). The map shows variation in magnetic intensity,
indicating variation in either lithology or basement topography. This gave rise to most of the
anomalies on the study area. The TMI map comprises both the magnitude of the earth’s field plus
the anomalous field. Hence, the response of the buried bodies measured in total-field magnetic
survey depends on the local direction of the earth’s field (Dobrin and Savit, 1998). The anomalies
on the TMI map that signifies the basement are characterized by smooth contours and low
magnetic relief while the surrounding platform area shows steep gradients and high relief in the
TMI magnetic contours (Fig. 5c). The lithology of the basement controls the magnetic relief
observed over the sedimentary basin like the study area. The shear zones were also delineated
using the contoured total magnetic intensity (Fig. 2A).
Vertical Derivative processing was undergone to remove long wavelength structures of the
magnetic field and significantly improve the resolution of closely spaced and superimposed
structures (Keating, P.B, 1995). The shallow and near surface structures are mainly at the
northeastern, central and South eastern parts of the study area. Shallow and near surface
structures have been identified from the IVD of the TMI map as VDA- 1, VDA- 2, VDA-3, VDA- 4,
VDA-5, VDA-6, VDA-7, and VDA-8 respectively (Fig. 2b). Very conspicuous lineaments have been
identified at the central portion of the area around Igumale, and northwest of Benta (block VDA -
1 and block- VDA-4). This area is within the Albian Asu River group of Southern Benue Trough.
Beds of the Asu-River group facies experienced two deformation (folding) phases (Nwachukwu,
1972a; Amajor, 1985). This area has been known to have been experienced magmatic activity
which intruded dolerite and granitic dykes intrusions. This gave rise to hydrothermal ore
mineralization like Lead-Zn mineralization. At the north western area of the study area, area
covered by Anambra basin sediments, the weakly magnetized source bodies named VDA-7 and
VDA-8, represent the ferruginized materials and ironstone capping within the Anambra Basin. At
the extremely South Western area of the study area, the basement rocks crop out and give rise to
International Journal of Research in Engineering and Applied Sciences (IJREAS) Vol. 7Issue 5, Month - 2017 ISSN(O): 2249-3905, ISSN(P): 2349-6525 | Impact Factor: 7.196
International Journal of Research in Engineering & Applied Sciences Email:- [email protected], http://www.euroasiapub.org
An open access scholarly, online, peer-reviewed, interdisciplinary, monthly, and fully refereed journals
75
high frequency magnetic signatures(VDA-5). This area is within Basara, Nkarasi in Ogoja LGA of
Cross River state. At Igbor, Aliade and Gboko areas, highly magnetic shallow magnetic sources -
VDA_2 which is within the Eze-Aku sandstone formation and VDA_3 on the the Agwu Ndeaboh
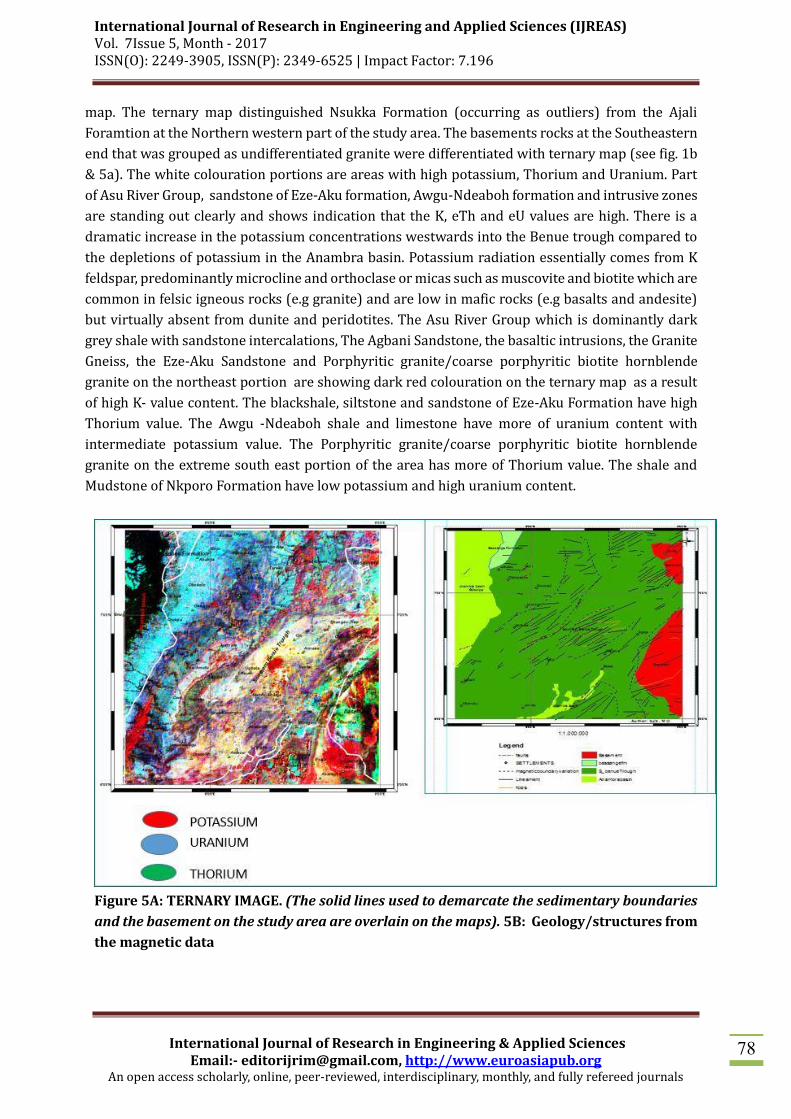
formation were identified. The rocks at that area are mainly intrusive igneous rocks. Structural
trends of the study area was mapped by extracting the lineaments using first vertical derivative of
the study area (see fig. 4a) In some cases lineaments reflects the strike lines of elongated intrusive
features or surface of large faults reflected in the basement topography or lithology (Dobrin and
Savit, 1988). Such features are often concealed under sedimentary cover and show only on
magnetic maps. Lineaments create conduits which aid the flow of fluids. These lineaments are
assumed to be the surface effects of fracture zones of tensional or shear type (Nwajide, 2013).
From the Rose diagram plotted using the azimuthal angle of lineaments; they are trending mainly
in NE-SW, E-W, N-S with the NE-SW trend being dominant (Fig 4b). The delineated geological and
structural map from the magnetic data is shown in Fig. 5b.
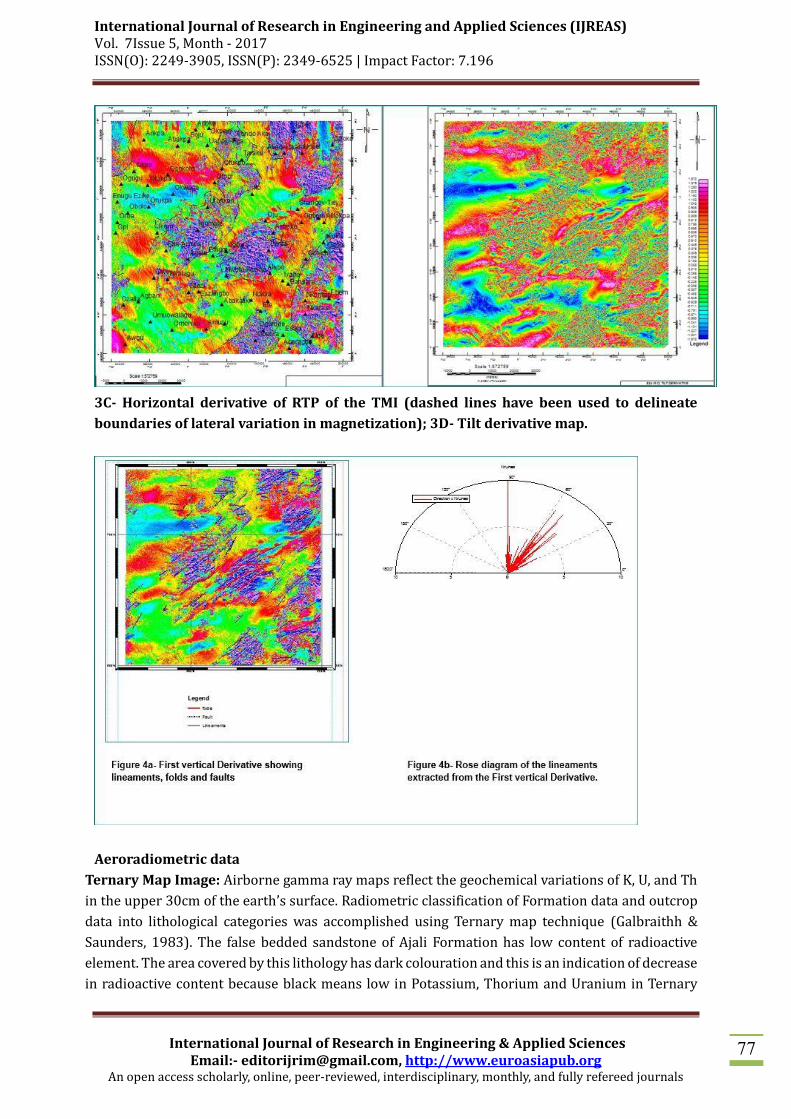
TILT DERIVATIVE: Tilt angle derivative filter is an expression of horizontal and vertical gradients.
It is related to the analytical signal in their tendency to amplify field variations from shallow
sources, highligting the location of sub vertical edges and provide estimates of depth to sources
according to their sharpness of the (when RTP) Tilt derivative reveals the angle different between
the magnetic field. It was used to enhance the contact and boundaries between magnetic sources
( Fig 2d).
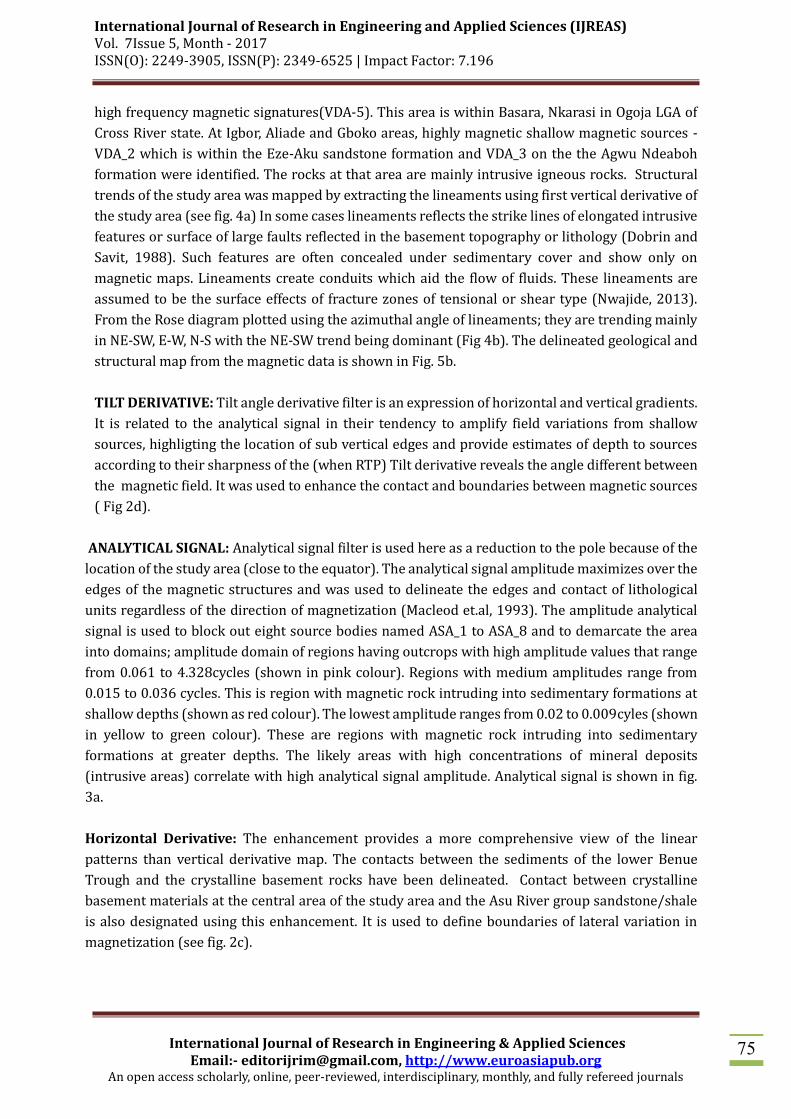
ANALYTICAL SIGNAL: Analytical signal filter is used here as a reduction to the pole because of the
location of the study area (close to the equator). The analytical signal amplitude maximizes over the
edges of the magnetic structures and was used to delineate the edges and contact of lithological
units regardless of the direction of magnetization (Macleod et.al, 1993). The amplitude analytical
signal is used to block out eight source bodies named ASA_1 to ASA_8 and to demarcate the area
into domains; amplitude domain of regions having outcrops with high amplitude values that range
from 0.061 to 4.328cycles (shown in pink colour). Regions with medium amplitudes range from
0.015 to 0.036 cycles. This is region with magnetic rock intruding into sedimentary formations at
shallow depths (shown as red colour). The lowest amplitude ranges from 0.02 to 0.009cyles (shown
in yellow to green colour). These are regions with magnetic rock intruding into sedimentary
formations at greater depths. The likely areas with high concentrations of mineral deposits
(intrusive areas) correlate with high analytical signal amplitude. Analytical signal is shown in fig.
3a.
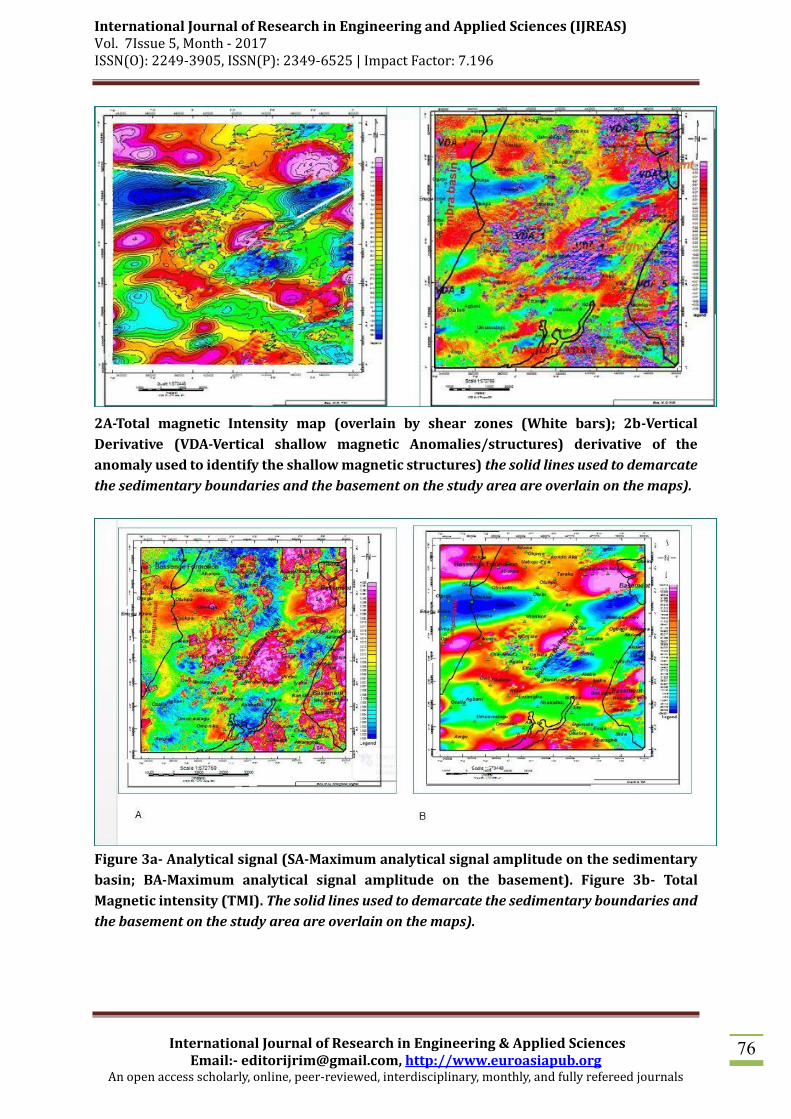
Horizontal Derivative: The enhancement provides a more comprehensive view of the linear
patterns than vertical derivative map. The contacts between the sediments of the lower Benue
Trough and the crystalline basement rocks have been delineated. Contact between crystalline
basement materials at the central area of the study area and the Asu River group sandstone/shale
is also designated using this enhancement. It is used to define boundaries of lateral variation in
magnetization (see fig. 2c).
International Journal of Research in Engineering and Applied Sciences (IJREAS) Vol. 7Issue 5, Month - 2017 ISSN(O): 2249-3905, ISSN(P): 2349-6525 | Impact Factor: 7.196
International Journal of Research in Engineering & Applied Sciences Email:- [email protected], http://www.euroasiapub.org
An open access scholarly, online, peer-reviewed, interdisciplinary, monthly, and fully refereed journals
76
2A-Total magnetic Intensity map (overlain by shear zones (White bars); 2b-Vertical
Derivative (VDA-Vertical shallow magnetic Anomalies/structures) derivative of the
anomaly used to identify the shallow magnetic structures) the solid lines used to demarcate
the sedimentary boundaries and the basement on the study area are overlain on the maps).
Figure 3a- Analytical signal (SA-Maximum analytical signal amplitude on the sedimentary
basin; BA-Maximum analytical signal amplitude on the basement). Figure 3b- Total
Magnetic intensity (TMI). The solid lines used to demarcate the sedimentary boundaries and
the basement on the study area are overlain on the maps).
International Journal of Research in Engineering and Applied Sciences (IJREAS) Vol. 7Issue 5, Month - 2017 ISSN(O): 2249-3905, ISSN(P): 2349-6525 | Impact Factor: 7.196
International Journal of Research in Engineering & Applied Sciences Email:- [email protected], http://www.euroasiapub.org
An open access scholarly, online, peer-reviewed, interdisciplinary, monthly, and fully refereed journals
77
3C- Horizontal derivative of RTP of the TMI (dashed lines have been used to delineate
boundaries of lateral variation in magnetization); 3D- Tilt derivative map.
Aeroradiometric data
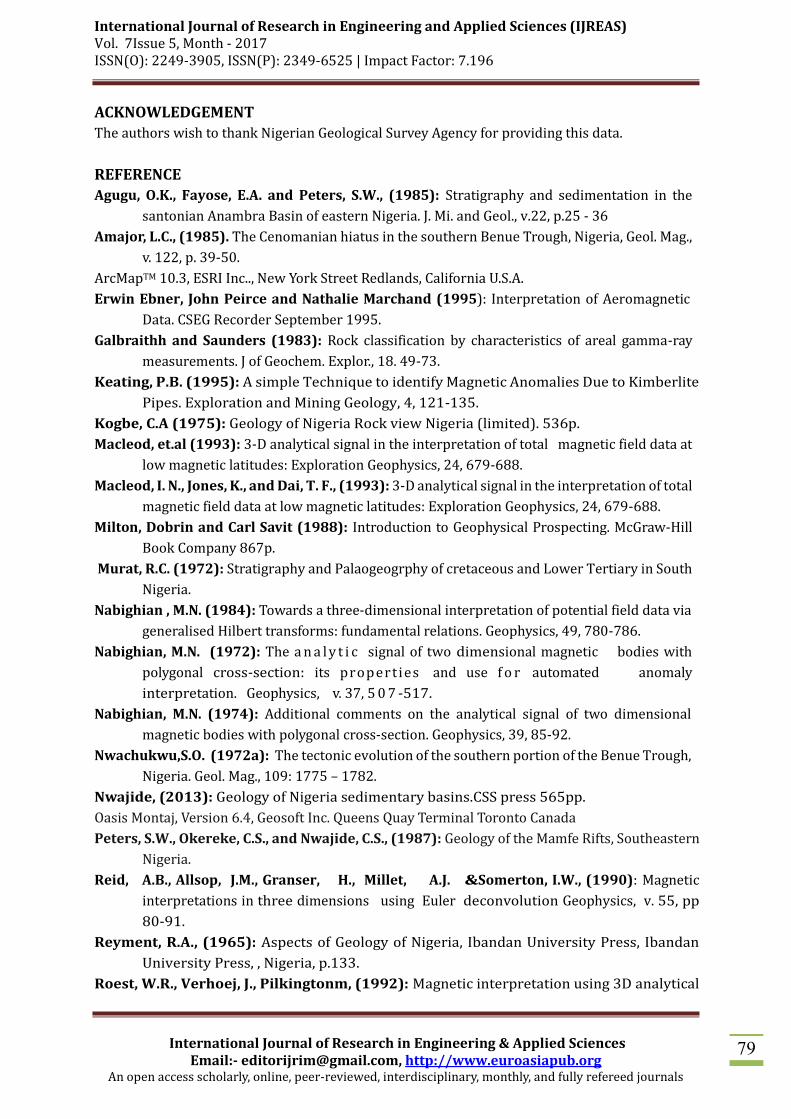
Ternary Map Image: Airborne gamma ray maps reflect the geochemical variations of K, U, and Th
in the upper 30cm of the earth’s surface. Radiometric classification of Formation data and outcrop
data into lithological categories was accomplished using Ternary map technique (Galbraithh &
Saunders, 1983). The false bedded sandstone of Ajali Formation has low content of radioactive
element. The area covered by this lithology has dark colouration and this is an indication of decrease
in radioactive content because black means low in Potassium, Thorium and Uranium in Ternary
International Journal of Research in Engineering and Applied Sciences (IJREAS) Vol. 7Issue 5, Month - 2017 ISSN(O): 2249-3905, ISSN(P): 2349-6525 | Impact Factor: 7.196
International Journal of Research in Engineering & Applied Sciences Email:- [email protected], http://www.euroasiapub.org
An open access scholarly, online, peer-reviewed, interdisciplinary, monthly, and fully refereed journals
78
map. The ternary map distinguished Nsukka Formation (occurring as outliers) from the Ajali
Foramtion at the Northern western part of the study area. The basements rocks at the Southeastern
end that was grouped as undifferentiated granite were differentiated with ternary map (see fig. 1b
& 5a). The white colouration portions are areas with high potassium, Thorium and Uranium. Part
of Asu River Group, sandstone of Eze-Aku formation, Awgu-Ndeaboh formation and intrusive zones
are standing out clearly and shows indication that the K, eTh and eU values are high. There is a
dramatic increase in the potassium concentrations westwards into the Benue trough compared to
the depletions of potassium in the Anambra basin. Potassium radiation essentially comes from K
feldspar, predominantly microcline and orthoclase or micas such as muscovite and biotite which are
common in felsic igneous rocks (e.g granite) and are low in mafic rocks (e.g basalts and andesite)
but virtually absent from dunite and peridotites. The Asu River Group which is dominantly dark
grey shale with sandstone intercalations, The Agbani Sandstone, the basaltic intrusions, the Granite
Gneiss, the Eze-Aku Sandstone and Porphyritic granite/coarse porphyritic biotite hornblende
granite on the northeast portion are showing dark red colouration on the ternary map as a result
of high K- value content. The blackshale, siltstone and sandstone of Eze-Aku Formation have high
Thorium value. The Awgu -Ndeaboh shale and limestone have more of uranium content with
intermediate potassium value. The Porphyritic granite/coarse porphyritic biotite hornblende
granite on the extreme south east portion of the area has more of Thorium value. The shale and
Mudstone of Nkporo Formation have low potassium and high uranium content.
Figure 5A: TERNARY IMAGE. (The solid lines used to demarcate the sedimentary boundaries
and the basement on the study area are overlain on the maps). 5B: Geology/structures from
the magnetic data
International Journal of Research in Engineering and Applied Sciences (IJREAS) Vol. 7Issue 5, Month - 2017 ISSN(O): 2249-3905, ISSN(P): 2349-6525 | Impact Factor: 7.196
International Journal of Research in Engineering & Applied Sciences Email:- [email protected], http://www.euroasiapub.org
An open access scholarly, online, peer-reviewed, interdisciplinary, monthly, and fully refereed journals
79
ACKNOWLEDGEMENT
The authors wish to thank Nigerian Geological Survey Agency for providing this data.
REFERENCE
Agugu, O.K., Fayose, E.A. and Peters, S.W., (1985): Stratigraphy and sedimentation in the
santonian Anambra Basin of eastern Nigeria. J. Mi. and Geol., v.22, p.25 - 36
Amajor, L.C., (1985). The Cenomanian hiatus in the southern Benue Trough, Nigeria, Geol. Mag.,
v. 122, p. 39-50.
ArcMapTM 10.3, ESRI Inc.., New York Street Redlands, California U.S.A.
Erwin Ebner, John Peirce and Nathalie Marchand (1995): Interpretation of Aeromagnetic
Data. CSEG Recorder September 1995.
Galbraithh and Saunders (1983): Rock classification by characteristics of areal gamma-ray
measurements. J of Geochem. Explor., 18. 49-73.
Keating, P.B. (1995): A simple Technique to identify Magnetic Anomalies Due to Kimberlite
Pipes. Exploration and Mining Geology, 4, 121-135.
Kogbe, C.A (1975): Geology of Nigeria Rock view Nigeria (limited). 536p.
Macleod, et.al (1993): 3-D analytical signal in the interpretation of total magnetic field data at
low magnetic latitudes: Exploration Geophysics, 24, 679-688.
Macleod, I. N., Jones, K., and Dai, T. F., (1993): 3-D analytical signal in the interpretation of total
magnetic field data at low magnetic latitudes: Exploration Geophysics, 24, 679-688.
Milton, Dobrin and Carl Savit (1988): Introduction to Geophysical Prospecting. McGraw-Hill
Book Company 867p.
Murat, R.C. (1972): Stratigraphy and Palaogeogrphy of cretaceous and Lower Tertiary in South
Nigeria.
Nabighian , M.N. (1984): Towards a three-dimensional interpretation of potential field data via
generalised Hilbert transforms: fundamental relations. Geophysics, 49, 780-786.
Nabighian, M.N. (1972): The a n a l y t i c signal of two dimensional magnetic bodies with
polygonal cross-section: its properties and use f o r automated anomaly
interpretation. Geophysics, v. 37, 5 0 7 -517.
Nabighian, M.N. (1974): Additional comments on the analytical signal of two dimensional
magnetic bodies with polygonal cross-section. Geophysics, 39, 85-92.
Nwachukwu,S.O. (1972a): The tectonic evolution of the southern portion of the Benue Trough,
Nigeria. Geol. Mag., 109: 1775 – 1782.
Nwajide, (2013): Geology of Nigeria sedimentary basins.CSS press 565pp.
Oasis Montaj, Version 6.4, Geosoft Inc. Queens Quay Terminal Toronto Canada
Peters, S.W., Okereke, C.S., and Nwajide, C.S., (1987): Geology of the Mamfe Rifts, Southeastern
Nigeria.
Reid, A.B., Allsop, J.M., Granser, H., Millet, A.J. &Somerton, I.W., (1990): Magnetic
interpretations in three dimensions using Euler deconvolution Geophysics, v. 55, pp
80-91.
Reyment, R.A., (1965): Aspects of Geology of Nigeria, Ibandan University Press, Ibandan
University Press, , Nigeria, p.133.
Roest, W.R., Verhoej, J., Pilkingtonm, (1992): Magnetic interpretation using 3D analytical

International Journal of Research in Engineering and Applied Sciences (IJREAS) Vol. 7Issue 5, Month - 2017 ISSN(O): 2249-3905, ISSN(P): 2349-6525 | Impact Factor: 7.196
International Journal of Research in Engineering & Applied Sciences Email:- [email protected], http://www.euroasiapub.org
An open access scholarly, online, peer-reviewed, interdisciplinary, monthly, and fully refereed journals
80
signal Geophysics, 57(1): 116-125.
Telford, et.al (1990): Applied Geophysics 2ndedn. Cambridge University press Cambridge.
Telford, W.M., Geldart, L.P. & Sheriff, R.E. (1990): Applied Geophysics 2ndedn. Cambridge
University press Cambridge.
Uzuakpunwa, (1980): Petrography differentiation of tectonically controlled Cretaceous
sedimentary cycles southeastern Nigeria. Sedimentary Geology, 17, 234 – 245.
Verduzco, B., Fairhead, J. D. and Green, C.M., (2004) :New insights into magnetic derivatives:
The Leading Edge, 22, 116–119, doi:10.1190/1.1651454.
Wilford, et.al (1997): Application of airborne gamma ray spectrometry in soil/regolith
mapping and applied geomorphology. AGSO Journal of Austrialian Geology and
Geophysics. V. 17(2) 201-216.