Embed Size (px)
Citation preview

i
EZECHETA CECILIA CHIKA
PG/M.Sc/08/49622
EFFECTS OF DOMESTIC FOOD PROCESSING METHODS ON NUTRIENT,
ANTINUTRIENT, FUNCTIONAL PROPERTIES AND ORGANOLEPTIC
ATTRIBUTES OF MUNGBEAN (Vigna radiata) PRODUCTS.
DEPARTMENT OF HOME SCIENCE, NUTRITION AND DIETETICS
FACULTY OF AGRICULTURE
Godwin Valentine
Digitally Signed by: Content manager’s Name
DN : CN = Webmaster’s name
O= University of Nigeria, Nsukka
OU = Innovation Centre

ii
EFFECTS OF DOMESTIC FOOD PROCESSING METHODS ON NUTRIENT,
ANTINUTRIENT, FUNCTIONAL PROPERTIES AND ORGANOLEPTIC
ATTRIBUTES OF MUNGBEAN (Vigna radiata) PRODUCTS.
A THESIS
SUBMITTED IN FULFILLMENT OF THE REQUIREMENTS
FOR THE AWARD OF DEGREE OF MASTER OF SCIENCE IN HUMAN
NUTRITION
BY
EZECHETA CECILIA CHIKA
PG/M.Sc/08/49622
DEPARTMENT OF HOME SCIENCE, NUTRITION AND DIETETICS
FACULTY OF AGRICULTURE
UNIVERSITY OF NIGERIA, NSUKKA
MARCH, 2016.

1
TITLE PAGE
EFFECTS OF DOMESTIC FOOD PROCESSING METHODS ON NUTRIENT,
ANTINUTRIENT, FUNCTIONAL PROPERTIES AND ORGANOLEPTIC
ATTRIBUTES OF MUNGBEAN (Vigna radiata) PRODUCTS.
A THESIS
SUBMITTED IN FULFILLMENT OF THE REQUIREMENTS
FOR THE AWARD OF DEGREE OF MASTER OF SCIENCE IN HUMAN
NUTRITION
BY
EZECHETA CECILIA CHIKA
PG/M.Sc/08/49622
DEPARTMENT OF HOME SCIENCE, NUTRITION AND DIETETICS
FACULTY OF AGRICULTURE
UNIVERSITY OF NIGERIA, NSUKKA
MARCH, 2016.
2
APPROVAL PAGE
This thesis has been approved for the award of Master of Science (M.Sc)
Degree in Human Nutrition and Dietetics, University of Nigeria, Nsukka
By
…………………………... ………………………………
Prof I. C. Obizoba. Date
(Supervisor)
………………………….
………………………………
Prof. (Mrs) E. K. Ngwu. Date
……………………………… ……………………………….
Prof. (Mrs) L. I. Salami. Date
(External Examiner)

3
CERTIFICATION
Ezecheta, Cecilia Chika, a postgraduate student in the Department of Home Science,
Nutrition and Dietetics with registration number PG/M.Sc/08/49622 has satisfactorily
completed the requirement for the Degree of Master of Science in Human Nutrition. The
work embodied in this Thesis is original and has not been submitted in part or full for any
other diploma or degree of this or any other University.
……………………………… …………………………….
Prof. I. C. Obizoba Prof. (Mrs) E. K. Ngwu
Supervisor Head of Department

4
DEDICATION
This research is solely dedicated to the Lord, God Almighty, without whom the starting and
completion would not have been possible. To HIM alone be glory, honour, dominion, and
majesty, Amen.

5
ACKNOWLEDGEMENTS
The researcher’s indebtedness to a lot of people who have helped, advised and encouraged
her. To her husband, Chief Ezecheta, Ezeobi A. O. for boundless encouragement, moral,
emotional, physical, financial and otherwise support. Her supervisor, Professor, Obizoba, I.
C. for mentoring, boundless enthusiasm, moral and financial encouragement. The
researcher’s brother, Barrister Okeke, A C. (Daddy), and sister, Jane for propelling and
financial encouragement. To her children, for their patience, love, cooperation and criticisms,
which spurred her on. To all the lecturers of the Department of Home Science, Nutrition and
Dietetics: Professor E. K. Ngwu (the head of department), Dr. Mrs Nwamara, Dr. Mrs
Chikwendu, who supervised the final corrections to the reseach write up, after the final
defence, Dr. Udenta and others who contributed in one way or the other in making this
research work what it is. I pray that God showers them with abundant blessings. She
expresses her gratitude to her sincere friends and other well wishers, for spurring her on. Her
greatest glory and allegiance ever remain for God, the pillar that holds her life.

6
ABSTRACT
The study investigated the effects of domestic processing methods on nutrient, antinutrient,
functional properties and organoleptic attributes of mungbean (Vigna radiata) products. The
mungbean grains were cleaned, washed with cooled boiled water, drained to remove any traces of
dirt and other contaminants. One thousand three hundred and fifty grammes were used for akara,
moi-moi and pottage for sensory evaluation. One thousand eight hundred grammes of mungbean
seeds were weighed out and divided into six equal portions for flour production. The first portion
was fermented for 24h, dehulled and shade dried. The second, fermented for 48h, dehulled and
shade dried. The third, was soaked for 5h, dehulled, washed in cooled boiled water and shade
dried. The fourth, prepared as the third sample, and sun dried. The fifth was washed with cooled
boiled water, undehulled and shade dried. This served as the control. The sixth, was soaked for
5h, germinated for seven days, shade-dried moisture free. Samples 1-6 were each milled and
sifted using 70mm screen sieve, packaged and labeled. Unfermented and fermented mungbean
flours were blended with wheat flour and Vigna spp. (sokoto) bean paste in ratios of 70:30 and
50:50, each, for cakes, moi-moi and ‘akara’ preparation. Whole mungbean and cowpea (Vigna
unguiculata) were used for pottage production. Sensory evaluation of products was carried out
with 9- point hedonic scale. The data collected was analyzed using statistical package for social
sciences (SPSS).The means were separated and compared using Duncan’s new multiple range
test at P>0.05. Protein values for the dehulled shade dried (DSH), the dehulled sundried (DSU)
and the 24h fermented (F24) mungbean flours were comparable (32.44, 32.24 and 32.02%). The
48h fermented (F48) and the seven-day sprouted (SP7) mungbean flours had similar protein
(25.98 and 25. 67%). Fat values for treated samples decreased relative to the control (1.74 – 1.91
vs 2.03%) except for the SP7 mungbean flour (2.03 vs. 2.15%). The DSU and the SP7 had higher
and comparable ash values (4.27and 4.41%) relative to both the control and the other treatments.
The undehulled shade dried (UDSH, the DSU, the F24, the F48 and the SP7 flours had similar
and higher fibre relative to the other treatments (4.42, 4.24, 4.33, 4.04, 4.10%). The F48 and the
SP7 samples had higher and comparable carbohydrate values (57.05 and 56.48%) relative to other
samples (50.57-51.65%).The F24 and the F48 flours had higher and similar calcium (84.39 and
81.99mg) relative to the other samples. The control flour had comparable iron to the other
samples 5.42 to 5.97mg except for the F48 (6.32mg). The UDSH had lower sodium 7.51mg
relative to the rest of the samples (8.19 – 9.16mg). Surprisingly, the UDSH flour had the highest
zinc (21.18mg) relative to the other samples whose values ranged from 1.57 to 2.22mg. The
DSU, the F24 and the SP7 flours had higher and comparable phytate (6.20, 6.18 and 6.25m)
relative the other flours. Values for tannins ranged from 4.02 to 5.29mg. Oxalate values were
2.07 to 2.68mg. Saponins were low 0.16 to 0.20mg. Water absorption capacity (WAC) as well as
protein solubility, were high. The flours were suitable for baked products. The proximate
composition of cakes,moi-moi, akara and porridges based on mungbean and its blends with wheat
flour were high. Protein, fat, ash, fibre and CHO content of the products were much higher
relative to the other products. Iron contents were between 0.10 and 0.47mg. Phosphorus values
ranged from 0.43 to 0.93mg. Sodium content was low and might be good for patients on low
sodium diets. Potassium content was between 30.17 to 44.10mg. The cakes based on the 100%
wheat flour or the DSU: W70:30 or the 50:50 and the 100% cowpea porridge had 8.6, 6.1, 6.0,
and 6.8 values for taste. Poor taste and flavour as well as dark colours of the UDSH, SP7, and the
fermented samples resulted in the low general acceptability of their products. The study revealed
that the domestic food processing methods decreased antinutrients, increased nutrients, functional
properties and the organoleptic attributes of mungbean products. Adequate sensitization of the
masses to the production, food uses, nutrient potentials, and efficient processing methods of
mungbean seeds is imperative, to diversify the diets and promote the health of Nigerian citizens.

7
TABLE OF CONTENT
PAGES
Title page……………………………………………………………………………….i
Approval page………………………………………………………………………….ii
Certification page……………………………………………………………………....iii
Dedication……………………………………………………………………………………......iv
Acknowledgement………………………………………………………………………v
List of tables……………………………………………………………………………vi
List of figures……………………………………………………………………….....vii
List of plates…………………………………………………………………………...viii
Abstract ………………………………………………………………………...ix
CHAPTER ONE: INTRODUCTION
1.1 Background to the Study …………………………………………………………….1
1.2 Statement of the Problem ……………………………………………………………2
1.3 Objectives of the Study …………………………………………………………….3
1.4 Significance of the Study ………………………………………………………….....4
CHAPTER TWO: LITERATURE REVIEW
2.1 Classification/Varieties of Beans……………………………………………………..5
2.2 Planting of Beans ……………………………………………………………………...7
2.3 Origin of Mungbean…………………………………………………………………...7
2.4 Cultivation of Mungbean ………………………………………………………………8
2.5 Food uses of Mungbean ………………………………………………………………8
2.6 Mungbean Without Skin (Dehulled)…………………………………………………...9
2.7 Mungbean Sprout………………………………………………………......................10
2.8 Mungbean Starch ……………………………………………………………………...11
2.9 Nutrients and Phytochemical Composition…………………………………………... 11
2.10. Antinutritional Factors ……………………………………………………………….12
2.10.1 Phytates (Phytic Acid) ……………………………………………………….13
2.10.2 Saponins ……………………………………………………………………... 14
2.10.3 Oxalates (Oxalic Acid)………………………………………………………………14
2.10.4 Tannins (Tannic acid)……………………………………………………………….14
2.11.1 Other Important Uses of Mungbean ……………………………………………….15
2.11.2 Anti-carcinogenic Properties ……………………………………………………….15
2.11.3 Antimicrobial Activity ……………………………………………………….16

8
2.11.4 Hypo-cholesterolemic Activity……………………………………………………...16
2.11.5 Diuretic Activity ……………………………………………………………….16
2.11.6 Anti-aging/Anti-oxidant activity ……………………………………………….17
2.11.7 Management of Atherosclerosis ……………………………………………………17
2.12.1 Functional Properties ……………………………………………………………….17
2.12.2 Water Absorption Capacity ………………………………………………………..18
2.12.3 Protein Solubility ………………………………………………………………..19
2.12.4 Swelling Property ………………………………………………………………..19
2.13.1 Processing and Preservation Methods ……………………………………………...20
2.13.2 Washing ………………………………………………………………………..20
2.13.3 Soaking ……………………………………………………………………….20
2.13.4 Rinsing ……………………………………………………………………….20
2.13.5 Dehulling ……………………………………………………………………….21
2.13.6 Sprouting (Germination) ……………………………………………………….21
2.13.7 Sun-drying ……………………………………………………………………….21
2.13.8 Shade-drying ……………………………………………………………………….22
2.13.9 Cooking ……………………………………………………………………….22
2.13.10 Fermentation………………………………………………………………………..22
2.13.11 Porttages/stew………………………………………………………………………23
CHAPTER THREE: MATERIALS AND METHODS
3.1 Materials ……………………………………………………………………………….24
3.2 Experimental Design ……………………………………………………………….24
3.3 Whole Mungbeans……………………………………………………………………...25
3.4 Sample Preparation ……………………………………………………………….26
3.5 Processing of Mungbean Seeds………………………………………………………...27
3.6 Sprouted Mungbean…………………………………………………………………….28
3.7 Organoleptic Attributes of Products …………………………………………………..29
3.8 Formulation of Blends ……………………………………………………………….29
3.9 Proportion of Ingredients ……………………………………………………………….29
3.9b Cake Samples………………………………………………………………………….30
3.9c Akara Recipe...………………………………………………………………………...31
3.9d Akara Balls...…………………………………………………………………………..31
3.9e Moi-Moi Recipe......………………………………………………………………….. 32
3.9f Moi-Moi Samples …………………………………………………………………….32

9
3.9g Preparation of Pottage ……...………………………………………………………...33
3.9h Bean Pottages/Stew ingredients ..…………………………………………………33
3.9h mungbean and cowpea pottage …….…………………………………………………34
3.10 Chemical Analysis ………………………………………………………………..35
3.10a Moisture ...………………………………………………………………………35
3.10b Crude Protein ……………………………………………………………………...35
3.10c Fat …………………………………………………………………………..36
3.10d Ash Determination ………………………………………………………………37
3.10e Crude Fibre ……………………………………………………………………..38
3.10f Carbohydrates ………………………………………………………………………39
3.11a Mineral Determination ……………………………………………………………39
3.12b. Phosphorus Determination ………………………………………………………39
3.12c Calcium and potassium Determination ……………………………………………40
3.12d Iron Determination ……………………………………………………………….41
3.12e Zinc Determination ……………………………………………………………….41
3.13 Antinutrient Determination ……………………………………………................41
3.13a Phytate………………………………………………………………………………..42
3.13.b Tannins Determination ……………………………………………………….42
3.13.c Oxalate Determination ……………………………………………………… 42
3.13d Saponins Determination ………………………………………………………… 43
3.14. Functional Properties Determination ………………………………………………..43
3.14.a Water Absorption Capacity ………………………………………………………..43
3.14.b Swelling Property and Solubility ………………………………………………..43
3.15. Statistical Analysis …………………………………………………..44
CHAPTER FOUR: RESULTS
Proximate Composition ………………………………………………………………..45
Mineral Content of Six Mungbean Flours…………………………………………………..47
Anti-nutrient Content of Six Mungbean Flours ………………………………... …….49
Functional Properties of Six Mungbean Flours ……………………………………….51
Proximate Composition of Products …………………………………………………..53
Mineral Content of Products ……………………………………………………….56
Sensory Evaluation of Products ……………………………………………………….59
CHAPTER FIVE: DISCUSSION, CONCLUSION AND RECOMMENDATIONS

10
Discussion ………………………………………………………………………………..62
Conclusion …………………………………………………….........................................73
Recommendation ……………………………………………………………………….73
Suggestions for further reading……………………………………………………………..74
References. …………………………………………………………….............................75
APPENDICES
Appendix i ……………………………………………………………………….80
Appendix ii………………………….……………………………………………..85
Appendix iii………………………………………………………………………86
Appendix iv …………………………………………………………………........88
Appendix v………………………………………………………………………..89

11
LIST OF TABLES
1 Effects of processing on proximate composition of six mungbean
flours (%, dry matter) ………………………………………………………. 46
2 Effects of processing on mineral composition of six mungbean flours
(mg, dry matter) ………………………………………………………… 48
3 Effects of processing on anti-nutrient content of six mungbean flours (mg) …. 50
4 Effects of processing on functional properties of six mungbean flours (mg) ….. 52
5 Proximate composition of cakes, moi-moi, akara and pottages based on
mungbean, cowpea Vigna spp., wheat flours and their blends
(%, dry weight) ……………………………………………………………. 55
6 Mineral content of cakes, akara, moi-moi and soups based on mungbean,
cowpea, Vigna spp., wheat flours and their blends …………………………. 58
7 Sensory evaluation of cakes, moi-moi, akara and pottages based on
mungbean, cowpea, Vigna spp., wheat flours and their blends ( %,dry weight) …. 61

12
LIST OF FIGURES
Figure Page
1 Processing of mungbean seeds …………………………… 27

13
LIST OF PLATES
Plate Page
1 Whole mungbean seeds ……………………………………………. 25
2 Sprouted mungbean seeds …………………………………………… 28
3 Cakes prepared from mungbean, wheat flour and their blends ……… 30
4 Akara prepared from mungbean, Vigna specie paste and their blends… 31
5 Moi-moi prepared from mungbean,Vigna specie paste and their blend 32
6 Pottages prepared from mungbean and cowpea seeds …………… 34

14
CHAPTER ONE
INTRODUCTION
1.1 Background to the Study
Qualitative and Quantitative feeding is of utmost importance in the maintenance of
good health. The human body is composed mostly of proteins, which are synthesized and
degraded on daily basis. There must be a balance in the amounts of protein destroyed and the
daily intakes in diets to maintain the body structure, which is largely protein. An under
protein supply brings about aging with depressing speed. Beans have been credited to contain
sufficient quantity of protein as to replace the more widely acclaimed but more costly animal
proteins in the diets, yet are not very efficiently consumed by people. It is an already
established fact that legume proteins are limiting in sulphur containing amino acids,
methionine, cystine, tryptophan and in some cases valine and isoleucine. Supplementation of
food legumes with their limiting amino acids have been known to improve their nutritional
quality. Similarly, processing methods aimed at destroying or inactivating heat-labile
compounds and other enzyme inhibitors have been found to improve the nutritive value of
food legumes (Akpapunam, 1996). The human digestive system lacks the enzyme, a-
galactosidase which hydrolyze Oligosaccharides (raffinose, starchyose and verbascose),
present in lugumes, as a result they enter the large intestine where they are fermented
anaerobically to produce gas and abdominal discomfort. Oligosaccharides are not heat-labile
and cannot be removed by heat processing and have been implicated as a cause of flatulence
in humans and animals that consume raw or improperly processed food legumes. However,
they are said to be soluble in water and are eliminated by adequate pre-soaking treatment.
Akpapunam (1996) observed that germination and fermentation of beans are known to reduce
them. Simple processing techniques, like, soaking, dehulling, sun and shade drying,
fermentation and sprouting (germination) can significantly reduce the levels of antinutrients
(tannins, phytates, oxalates, saponins) and food toxicants in plant foods (Obizoba and
Atii,1994; Savage King and Burgess (1992).
Grain legumes, mungbean inclusive, can improve nutrition security and the nutritional
status of children, as they contain immune-boosting substances that can improve growth and
health (Ohiokpehai et al, 2011). Processing techniques have been reported to: increase food
security; reduce moisture content thereby preventing microorganisms (bacteria, yeasts,
viruses, moulds: which make aflatoxins); reduce the risk of food borne diseases and increae

15
the nutrient densities; breakdown cell walls, enhancing digestibility; remove the skin,
causing a reduction in fibre and phytate and increased bioavailability of non-haem iron and
zinc; reduce fat and enzymes, which cause rancidity and spoilage; reduce the weight making
them easier to handle; as well as diversify their usage (Savage King and burgess,1992).
Agugo and Onimawo (2009) observed that cooking improved NPU in mungbean diets from
44.33 in raw seed to 45.60% in toasted mungbean seed, and 47.35% in boiled mungbean
seed.
The major grain legumes consumed in Nigeria include, cowpea (Vigna unguiculata),
groundnuts (Arachis hypogaea), bambara groundnuts (Voandzeia subterranean), pigeon pea
(Cajanus cajan) and more recently soybean (Glycine max) (Agugo and Onimawo, 2009).
The above legumes do not thrive well in the humid south eastern zone of Nigeria, but, grow
favourably in the savannah zone of the Northern parts, where they are producd in large
quantities. Mungbean is native to the Asian countries (China, India, Burma, Bangladesh, and
Indonesia) where they are used to prepare assorted dishes and snacks. Mungbean is a lesser
known legume, high in protein, the B-complex vitamins, minerals, phytochemicals, and fibre.
Despite these desirable qualities, it has not been introduced into Nigerian recipes and cuisine.
Mungbean could be processed into flours, pastas or noodles. It is consumed whole or used
fresh in salads and stews. It is grown in flower pots or family surrounding gardens and
plucked as needed for home recipes (Elliot, 1994). It prevents many cellular and
cardiovascular diseases. They are also easy to prepare; processed, and cook as the other
legumes and beans. These and other outstanding properties make it imperative for inclusion
in our daily diets.
1.2 Statement of the Problem:
Some contributory factors to inadequate consumption of beans as animal protein
substitute are: the age-long established opinion that beans cause bloating, flatulence,
indigestion and take longer cooking time than most other foods discourage some people from
cooking and eating beans; Nigerians, especially the ‘Ibos’ have developed many hard and
fast rules about foods such that the introduction of new foods into their recipes is always very
difficult; the complexities of modern society whereby both parents are seriously engaged in
occupations outside the homes do not accord them adequate time to attend to rigourous
domestic food processing techniques that would render legume foods more bioavailable to
the cells and to ensure good health.

16
Most snacks, such as bread, cakes, biscuits, buns, pies and other finger foods, regarded as
“junk foods”, are prepared from over-processed wheat and other cereal flours which are
deficient in the sulphur-containing amino acid lysine, but, contain a lot of methionine and
cystine. Mungbean and other legumes, on the other hand, are rich in lysine, but low in
methionine and cystine. Therefore, combinations of processed wheat and mungbean flours in
cake and other snacks production will offer good complementary food materials with
adequate or complete proteins (all the essential amino acids) needed to make human proteins
to support good health (Whitney and Rolfes,2008).
Proteins from animal sources are usually more expensive than plant sources and contain
saturated fatty acids and cholesterol which pose major health problems in humans. They are
not easily affordable by the majority of the people. Plants are the major source of protein in
many areas of the world (only 35% protein come from animal sources) (Savage king and
Burgess, 1992). However, the bioavailability of legume proteins and minerals, being plant
foods, depends in part on the levels of antinutritional factors present in them. Available for
human consumption is a wide variety of legumes of which mungbean is a member.
Mungbean has characteristic beany flavour and contains antinutrients.
The nutrient composition of mungbean compared favourably with those of other common
legumes compiled by many workers (Agugo and Onimawo, 2009).). Nevertheless, most
Nigerians are not aware of the existence, production, nutrient potentials, as well as how best
to prepare and process mungbean to remove antinutrients; increase the nutrient content and
bioavailability; increase the functional and organoleptic properties as well as diversify their
usage, to derive maximum nutritional benefits. It becomes imperative to investigate the
suitable domestic food processing methods to improve nutrients for increased bioavailability,
scanty processing and literature existing in the study of mungbean.
1.3.1 Objectives of the Study
The broad objective of the study: the general aim of this work was to determine the effects
of domestic food processing methods on nutrient, anti-nutrient, functional properties and
organoleptic attributes of mungbean (Vigna radiata) products.
1.3.2 Specific objectives: The specific objectives were to:
1. use different food processing methods: soaking, dehulling, sun and shade drying, sprouting
and fermentation in the preparation of mungbean samples;
17
2. determine the effects of the food processing methods: dehulling, fermentation, sprouting,
sun and shade drying on nutrients, anti-nutrients, functional properties and sensory
attributes of mungbean;
3. determine the possibility of substituting or blending processed wheat flour with mungbean
flour to increase the nutrient density of food products; and
4. develop and evaluate orgonoleptic attributes of snacks and pottages based on mungbean
using cowpea, Vigna spp. and wheat flours as controls.
1.4 Significance of the study
The results of this study when published will be useful in the following ways:
• individuals and families would prepare and process different mungbean products for
family consumption using appropriate domestic food processing methods;
• Practicing nutritionists or dietitians will use the information from this work to
advice, and prepare healthful daily diets for their clients (patients);
• The government would use the information from this work to: create awareness in
mungbean in the masses via radio, TV adverts and house to house campaign, as
soyabean was introduced to the masses using these methods; encourage and support
the agricultural sector to embark on massive production of mungbean, this would
increase its market supply at cheaper prices;
• Farmers would increase the production of mungbean seeds for both home
consumption and commercial purposes, to increase family income and standard of
living;
• Many communities would plant mungbean in their home gardens to widen the food
use nationwide;
• Industrialists would incorporate mungbean flour into their food packages as
supplements and preservatives to increase their nutrient densities.

18
CHAPTER TWO
REVIEW OF RELATED LITERATURE
2.1 Classification /varieties of beans
Scientific classification of mungbean
Kingdom - plantae
Unranked – angiosperms
Unranked - endicots
Unranked - rosids
Order – fabales
Family - fabaceae
Genus - Vigna
Specie - V. radiata
Bionomial name - Vigna radiate (L) R.wilczek.
Varieties of Beans
The two main types of beans are bush and pole. Bush beans do not require any type of
support and the plants grow between one foot and one and a half feet high. They bear seeds in
about seven or eight weeks. Pilot study showed that mungbean belongs to this category. Pole
beans on the other hand, grow up to six or eight feet high and bear seeds about a week later
than bush beans but bear more prolifically and need some type of support.
Beans are grain legumes. Grain legumes, also called pulses are plants belonging to the family
Leguminosae (alternatively fabaceae) which are grown primarily for their edible grains or
seeds. These seeds are harvested mature and marketed dry, to be used as food or feed.
Currently, the world gene banks hold about 40,000 bean varieties, although only a fraction
are mass produced for regular consumption(http://www.,2012).
Some grain legumes (bean types): scientific and common names include:
Vicia: V. faba or broad beans, Windsor beans, horse beans, bell bean, field bean
tick bean, pigeon pea.
V. sativa or vetch, common vetch.
• Vigna:
V. aconitifolia or moth bean
V. angularis synonymous to phaseolus angularis or azuki bean, adanka bean, danka bean
V. mungo or urad bean

19
V. radiata or mung bean:syn:phaseolus aureus, black dahl, black gram, black
mung, golden gram, gram bean, green gram, mungo, red mung bean, urd, chop suey bean
V. umbellata or rice bean
V. unguiculata or cowpea (includes the black-eyed pea, yardlong bean and
Asparagus bean, black-eyed bean, crowder pea, field pea, southern pea, frijole, lobhia, kibal,
nieve, paayap.
Cicer:
C. arietinum or chickpea (also known as the garbanzo bean), Bengal gram,
Calvance pea, chestnut bean, chich, chich-pea, dwarf pea, garavance, garbanza
garbanzos, gram, gram pea, homes, hamaz, nohub, lablabi, shimbra, yellow gram.
Pisum:
P. sativum or pea, dry pea, Chinese pea, Chinese pea pod, Chinese snow pea, edible-podded
pea, edible pod pea, podded pea, snap pea, snow pea, sugar snap pea, batani, chicharo,
erbese, ater, pois, takamany borso, pisello, holoan, mange- tout, papdi.
Lathyrus:
Lathyrus sativus (Indian pea)
Lathyrus tuberosus (Tuberous pea)
Lens:
L. culinaris or lentil, black lentil, brown lentil, green lentil, green mungbean, large-seeded
lentil, red mungbean, small-seeded lentil, wild lentil, yellow lentil, adas, mercimek, messer,
masser, heramame.
Lablab:
L. purpureus or hyacinth bean, bonavist, bataw, (Dolichos lablab)
Phaseolus:
P. acutifolius or tapery bean
P. coccineus or runner bean
P.lunatus or lima bean, butter bean, patani.
P. vulgaris or common bean (includes pinto bean, kidney bean, caparrones, and
Navy, habichuela, snap bean, common field bean).
P.polyanthus (aka P. Dumosus, recognized as a seperate specie in 1995)
Glycine:
G. max or soybean, soya, edamame.
Psophocarpus:

20
P. tetragonolobus or winged bean
Cajanus:
C. cajan or pigeon pea, kadios.
Stizolobium:
S. spp or velvet bean
Cyamopsis:
C. tetragonoloba or guar
Canavalia:
C.ensiformis or jack bean
Canavalia gladiate or sword bean
Macrotyloloma:
M. uniflora or horse gram
Lupines or Lupin:
Lupinus spp., sweet lupin
L.perennis, wild lupin
L.luteus, yellow lupin
L.angustifolius, blue lupin
L. metabilis or tarwi, Andean lupin, pearl lupin, chocho-L.mutabilis.
Lupinus albus or lupini bean, white lupin.
Erythrina:
E. herbacea or Coral bean
Arachis hypogaea : peanut or groundnut, earth nut, goober nut, mani, monkey nut runner
peanut, Spanish peanut, Valencia peanut, Virginia peanut.
2.3 Planting of Beans
Beans do well in almost any type of soil, provided it is not too acidic, and is in a sunny spot.
Like all plants, they do swell (best) if the soil has been enriched with organic fertilizer like
compost or well rotted manure.
2.4 Origin of mungbean
Mungbean is native to India and is grown throughout Africa, China, USA and India
itself where they are known as Mung dal (Elliot, 1994). Mungbean is one of the many species
recently moved from the genus Phaseolus to Vigna and still often cited as Phaseolus aureus
or Phaseolus radiatus. These are all the same plant (http://www, 2008). It is the seed of the

21
plant Vigna radiata which is native to India and Pakistan. It is mainly cultivated in India,
Philippines, Indonesia, China, Burma, Bangladesh, hot and dry regions of south Europe and
southern USA.
Lauren, Shrestha, Sattar & Yadav (2001) confirmed that several grain legumes
(chickpea, pigeon pea, mungbean and black gram) originated and were adopted in west and
south Asia around 2000 to 1000 BC, it provides inexpensive protein sources to religious
vegetarians and the poor. Wikipedia (2009) offered other names used for mungbean as: green
beans, mung, moong, mash beans, munggo, green gram, golden gram and green soy. The split
bean is also referred to as moong dal, which is green with the husk, and yellow when
dehulled. The beans are small, ovoid in shape, and green in colour. The English word ‘Mung’
derives from the Hindi moong.
2.5 Cultivation of mungbean
Literature revealed that mungbeans are tropical or sub-tropical crops and require warm
temperatures (optimally around 30-35oC) for pusap cultivation. Loamy soil is the best. In
India and Bangladesh, they are planted during two seasons, viz: the Rabi season (starting in
November), and the kharif season (starting in March).
2.6 Food uses of mungbean
Beans are consumed as mature grains, immature seeds, as well as vegetable (both
leaves and pods). They are the most important grain legumes for direct human consumption
(Broughton et al., 2003). They are one of the quicker cooking pulses and have sweet flavor
and soft texture. Lauren et al (2001) observed that legumes are important as food for human
nutrition, as feed or fodder for animal nutrition. They opined that while cultivation of
legumes specifically for fodder is a relatively recent practice, feeding legume residues to
livestock is an ancient and common custom. Studies showed that prior to the availability of
chemical fertilizers, farmers in south Asia regularly cultivate legume species for green
manure as early as 1000 BC.
Mungbean are commonly used in Chinese cuisine. They are called lu dou, literally
‘green beans’, as well as in Korea, Pakistan, India, Thailand, southeast Asia. In Vietnam they
are called dau xanh (again literally ‘green beans’). They are generally either eaten whole
(with or without skin) or as bean sprouts, or used to make the dessert “green bean soup”.
The starch of mungbean is also extracted from them to make jellies and transparent
cellophane noodles. In Vietnam, the transparent wrapping of Vietnamese spring rolls is
22
made from mungbean flour. In phillipino cuisine, meat is sautéed with garlic, onions, and
bay-leaves, then mungbean are added and cooked. Mungbean batter is used to make crepes
named Pesaratu in Andra Pradesh, India. Whole mungbean are generally prepared from dried
beans by boiling until they are soft. In Chinese cuisine, whole mungbeans are used to make a
tang shui or dessert otherwise literally translated “sugar water” called Lu dou tang shui,
which is served either warm or chilled. It is considered an antidote to thirst. In Indonesia,
they are made into a popular dessert snack called es kacang hijau, which has the consistency
of a porridge and are cooked with sugar, coconut milk and a little ginger. In Philippine, it is
the main ingredient of the dessert hopieng munggo. Whole mungbean are occasionally used
in Indian cuisine where beans without skin are more commonly used except in kerala. Whole
mung dal (cheru payaru) is commonly boiled to make a dry preparation that is often had with
rice gruel (kanji), in kerala.
Ronzio (1997), observed that mungbean, other legumes and lentils contain saponins and
isoflavones such as genistein (phytoestrogen or phytosterols).These may inhibit estrogen-
promoted cancers and lower high blood cholesterol to decrease the risk of atherosclerosis.
The nutritional value of mungbean renders it valuable in preventing most of the cellular,
coronary artery and degenerating diseases such as cancer, diverticular, heart attack, high
blood pressure and diabetes.
Atkins (1996) noted that high in fibre, proteins and variety of minerals and vitamins, beans
and other legumes are composed of carbohydrates with fairly low glycemic index, making
one feel fuller longer. Unlike carbohydrates with higher glycemic index which raises blood
sugar levels quickly, beans and other legumes are slowly absorbed in the blood stream. This
could be the reason diabetic patients are advised to consume much more beans to satisfy their
hunger. Siegal (1996) confirmed that the artificially high blood sugar levels resulting from
the large amounts of processed carbohydrates in the western diet may produce changes in the
lining of the arteries. This predisposes them to cholesterol and fat deposits that eventually
pave way to thrombosis. High blood sugar is a warning sign of diabetes. The link between
diabetes and coronary heart disease seems obvious. Cleave in Atkins (1997) emphatically
affirmed that the major cause of coronary thrombosis lies in the cause of both diabetes and
obesity
2. 7 Mungbean without skin (dehulled)
With their skin removed, mungbean are light yellow in colour (pilot study). They are
made into mungbean paste by the process of dehulling, cooking and

23
pulverizing the beans to the consistency of a dry paste. The paste is sweetened and is similar
in texture to the red bean paste though the smell is slightly more bean-like (Wikipedia, 2008).
In several Asian countries, dehulled mungbean and mungbean paste are made into ice creams
or frozen ice props and are very popular dessert items. In Taiwan, mungbean paste is a
common filling for moon cakes. In china, the boiled and shelled beans are used as filling in
glutinous rice dumplings eaten during the dragon boat festival.
Dehulled mungbean can also be used in a similar fashion as whole beans for the
purpose of making sweet soups. Mungbean in some regional cuisine of India are stripped of
their outer coats to make mung dal. In other regions of India, such as Andra Pradesh, a
delicious vegetable preparation is made using fresh grated coconut, chillies, mung and typical
south Indian spices (asafoetida, tumeric, ginger, mustard seeds, urad lentil). In south Indian
states mungbean are also eaten as pancakes. They are soaked in water for 6-12 hours (the
higher the temperature the lesser the cooking time). They are then ground into fine paste
along with ginger and fine salt. The pancakes are made on a very hot griddle. These are
usually eaten for breakfast. This provides high quality protein in raw form that is rare in most
Indian regional cuisine. Pongal is another recipe that is made with rice and mungbean without
skin. It is used with coconut milk and jaggery to make Payasam.
A traditionally prepared Indian home snack now available from industrial producers is made
by soaking dried mungbean in water, then partly drying to a dry matter content of
approximately 42% and then deep fried in hot oil. The frying time varies between 60 and 90
seconds. The fat content of this snack is around 20%.
2.8 Mungbean sprouts
Mungbean sprouts are germinated by leaving them watered with four hours of daytime light
and spending the rest of the day in the dark. The sprouts can be grown under artificial light
for four hours over the period of a week (Wikipedia, 2008). Flourescent bulbs or
incandescent light bulbs would be the best to use for mungbean sprouts. They are usually sold
simply as “ bean sprouts” and are known as ‘ dou ya’ (literally “ bean sprouts / germ”); ‘ya
cai’ (literally “sprout vegetable”) or ‘ yin’ (literally “ silver sprouts”) in Chinese, “ min nan”
in Hokkien; ‘ kongnamool’ in Korea; ‘moyashi’ in Japanese; ‘ tauge’ in Indonesia; ‘ taugeh’
in Malay, ‘togue’ in Filipino; ‘ thua-ngok’ in Thai; and ‘dau’ in Vietnamese.
Mungbean sprouts are the major bean sprouts in most asian countries whereas soyabean
sprouts called ‘kongnamul’ (hangul) are more widely used in variety of dishes in Korea. The
sprouts are stir fried as a vegetable accompaniment to a meal, usually with ingredients such

24
as garlic, spring onions, or pieces of salted dried fish to add flavour. In Vietnamese,
uncooked bean sprouts are used in filling for spring rolls, as well as a garnish for pho.
In Malaysia and Peranakan cuisine, they are a major ingredient in a variety of dishes
including ‘char kway teow’, ‘ hokkien mee’ ‘mee rebus’, and ‘pasembor. In Korea, slightly
cooked mungbean sprouts, called ‘sukjunaml’ (hangul) are often served as a side dish. They
are blanched (placed into boiling water for less than a minute), immediately cooled down in
cold water mixed with sesame oil, garlic, salt, and often other ingredients. In Philippines, the
sprouts are made into ‘lumpia rolls’ called ‘lumpiang togue’.
2.9 Mungbean Starch
Mungbean starch which is extracted from ground mungbean is used to make transparent
cellophane noodles (also known as bean thread noodles, bean threads, glass noodles, ‘fen si’,
‘tung hoon’, ‘ mien’ and ‘ bun tao’). These noodles become soft and slippery when they are
soaked in hot water. A wider variety of cellophane noodles, called ‘nokdumuk’ (hangul, also
called cheongpomuk) is also made from mungbean starch. A similar jelly, coloured yellow
with the addition of gardenia colouring, is called hwanpomuk.
2.10 Nutrients and phytochemical composition
Beans are commonly regarded as poor man’s meat and play a particularly important role in
the diet of the under-privileged. Broughton et al (2003) noted that the demand for beans is
believed to be income-inelastic and that its consumption drops as income level rises. Elliot
(1994), observed that although pulses have continued to play an important part in the diet of
the poorer people of the world, in India, China and the middle-east, apart from war time when
more house wives were urged to serve more body building beans, in the affluent west they
have been neglected in favour of animal proteins, or simply grown as food for livestock. It is
only in recent years, with worry about the increasing world population and food shortages
that these foods have begin to receive more serious attention.
Mungbean is a very rich source of many health-giving nutrients and phytochemicals. Agugo
and Onimawo (2009), reported the following proximate composition in raw mungbean (dry
weight): protein 22.90%, fat 1.43%, ash 3.34%, fibre 8.95%, CHO 63.38%, calcium 130mg,
zinc 2.76mg, iron 4.23mg ; and noted the nutritional composition of mungbean compared
with some other known legumes in Nigeria as follows: protein values of 22.90g vs 35.1g,
22g, 18g, and 27g for mungbean vs soybean, cowpea, bambara groundnut, and groundnut,
respectively; fat values of 1.45g vs 17.7g, 1.5g, 6.0g, and 4.5g, respectively; ash values of

25
3.43 vs 5.00g, 0g, 0g, 0g respectively; fibre values of 8.95g, vs 4.2g, 0g, 0g, 0g, respectively;
CHO values of 63.38g, 32g, 60g, 60g, 17g, respectively; calcium values of 130mg, vs 226mg,
90mg, 65mg, 60mg, respectively; zinc values of 2.76mg, vs 0mg, 0mg, 0mg, and 0mg,
respectively; iron values of 4.23mg vs 4.23mg, 5.0mg, 6.0mg, and 2.5mg, respectively, all
arranged as in the protein values.
Lauren et al (2001) observed that legume seeds contain significant concentrations of
minerals (calcium, zinc, iron) and vitamins (folic acid and vitamin B, including riboflavin,
thiamin and niacin). Ronzio (1997) showed the levels of the following nutrients in mungbean
(104g): calories 32, protein 3g, carbohydrate 6g, fibre 0.84g, vitamin A 22 retinol equivelent,
thiamin 0.09mg, riboflavin 0.13mg, niacin 028mg, and vitamin C 14mg.
Elliot (1994) maintained that apart from being a good source of cheap protein, pulses are
particularly useful addition to our diet for two other reasons. Firstly they have the lowest fat
content of any of the protein foods, and secondly their roughage or fibre content is extremely
high; both important factors from the health point of view. Pulses are some of the richest
sources of fibre of all proteins; they can have up to 81g of fibre per 1000kcals of energy
supplied (Elliot, 1994). This is particularly impressive considering that other important
protein foods: milk, eggs, fish and meat contain no fibre at all. Soluble fibre has been shown
to lower blood cholesterol levels and blood glucose levels and blood glucose levels, thereby
reducing risks of cardiovascular disease and diabetes. Insoluble fibres decrease intestinal
transit time, thus reducing risks of constipation, diverticular disease and colon cancer.
However, very high intake of fibre (above 50-60g/day) can cause health risks: deficiency of
zinc and iron malabsorption of other minerals. This occurs because some minerals can bind to
fibre which prevents them from being absorbed.
2.11.0 Anti-nutritional factors
Anti-nutrient are substances that oppose the action of other nutrients and can have impact on
health .They are major limiting factors to a wider food usage of many tropical plants and they
all act in different ways, such as binding minerals, preventing absorption, creating
inflammation and other auto immune disorders, damaging tissues etc. Their manifestation of
toxicity range from severe reductions in food intake and utilization, to profound neurological
effects and even death (Osagie, 1998), but they are in the plants as defense against predators.
It has been reported that green leaves were rich in protein, but their utilization was limited
because of the presence of indigestible fibre (Elemo, Elemo, Mordi, Balogun, and Olakanpo
(2013). The anti-nutritional factors in five leafy vegetables were given as follows: tannins

26
values 0.09, 0.11, 3.64, 0.11, and 4.37mg/100g dry matter, respectively, for Igbo (Solanium
macrocarpon), Ishapa (Hibiscus sabdariffa), Okro (Hibiscus esculentus), Tete (Amaranthus
viridis), Ugu (Telferia occidentalis); 0.40, 0, 0, 0.41, and 0.21mg, respectively, per 100g
Oxalate content of the same vegetables Elemo et.al. (2013).
Researchers observed that plants’ natural compounds otherwise known as plants’ secondary
metabolites or anti nutritional factors have many health and other benefits. These anti
nutritional factors include fibres, saponins, isoflavones, flavonoids, tannins, oxalates,
phytates, alkaloids, trypsin (protease inhibitors), phyto-hemaegglutinins (lectins) , etc.
mungbean is a very rich source of many phytochemicals, having been proved by USDA
nutrient data base and other researchers, to contain fibre, saponins and isoflavones, etc.
Mineral bioavailability is determined by a number of intrinsic physiological factors and by
dietary components that may enhance or hinder absorption of polycations by physical and or
chemical means. Recognizing the importance of adequate mineral intake, the United States
National Research Council, established some guidelines for recommended dietary allowances
(RDA) of various minerals. The RDA per day is estimated at 80mg calcium for adults;
300mg magnesium for men and women over 51, 18mg for women under 51; and 15mg zinc
for adults.
2.11.1 Phytates (phytic acid) (inositol hexaphosphate)
Phytates inhibit mineral absorption and digestive enzymes that help with breakdown of
proteins. Excessive phytate consumption can cause mineral deficiencies, bone / tooth loss and
impaired digestion. They have negative effect on the absorption of zinc, iron and calcium.
They are also associated with increased cooking time in most grain legumes (Obiakor, 2009).
Phytates are not heat labile, as such it is not eliminated by heat treatment. However,
fermentation and germination are known to reduce it in food legumes (Akpapunam, 1996).
Phytates are associated with protein bodies in legumes and they increase with increasing
protein content (Reddy, 2002).
Today, studies have proved antinutrents, phytate inclusive are not all that harmful as formerly
believed. They are credited with the following benefits:
As antioxidants, they combine with iron which behaves like a free radical of intense
oxidizing action and prevents excess of it from harming the intestinal lining and turning into
a factor of cancerous degeneration (Pamplona-Roger, 2005). Heaney, Weaver & Fitzsimmons
(1991) observed a safe phytate level of 3.01mg/g. Phytates occur in foods such as soybean,
beans, wheat, nuts, almonds, pumpkin, sesame seeds etc.
27
2.11.2 Saponins (a triterpenoid)
Saponins are natural detergents found in plants. They have detergent or surfactant
properties because they contain both water-fat-soluble components. They consist of a fat-
soluble nucleus, having either a steroid or triterpenoid structure with one or more side chains
of water-soluble carbohydrates (Cheeke, 2000). The two major commercial sources of
saponins are Yucca schidigera, which grows in the Mexican dessert, and Quilaja saponaria,
atree thet grwows in ari areas of chad (Cheeke, 2000). Consumption of saponins above the
safe levels of 146mg per day is linked with auto immune disorders, enzyme inhibition and
impaired digestion. Lower quantities are recommended for people who have compromised
digestion. Saponins are found in beans other legumes, maize, alfalfa, nightshades, such as
tomatoes peppers, egg plant and white potatoes, and are known to cause bloating of the
stomach in animals, reduce palatability, cause growth depression and mineral binding.
Schiavone et al (2007) reported a safe level of 146mg/100g. Excessive consumption of foods
high in saponins is reported to cause inflamation and and leaky guts.
2.11.3 Oxalates (oxalic acids)
Oxalates are the strongest known inhibitor of calcium absorption (Onwuka, 2005). They
were reported to cause oxidation, leading to inflammation and damage of tissues, including
the digestive tract. Patients of kidney stones autism and auto immune disorders need low
oxalate diets as they are high in oxalic acid, and can promote formation of kidney stones.
Onwuka (2005) reported a lethal oxalate dose of 2-5g in man, and a safe level of 4-5mg/100g
sample of grains and 2.20mg/100g of vegetable consumed. An RDA of 2mg daily is
recommended. Oxalic acid is found in foods like legumes, sweet pepper, almonds, tea,
coffee, ginger etc. Oxalate is beneficial in the interrelationship among nutrients.
2.11.4 Tannins (tannic acid)
Pamplona-Roger, (2005) noted that tannins are stringent compounds of bitter taste that
appear in plants such as grapes, wine, apples, strawberries, and medicinal plants, like green
tea, legumes, etc. As antinutrients, they inhibit the activities of some digestive enzymes such
as trypsin, chemotrypsin, amylase and lipase. They also precipitate protein in the gut, thereby
making them unavailable. Tannins also hinder iron absorption and its reduction increases iron
bioavailability. Onwuka (2005) noted that low tannins content in the diet is an indication of
good protein absorption (availability). Pamplona-Roger (2005) observed the following about
tannins: they act on the skin and mucous membrane as astringents, forming a layer of
28
coagulated protein over them, upon which microorganisms can no longer act; this fact is also
the basis for skin tanning; they are the most active astringent agent known; by acting on
inflamed tissues they dry and tighten them momentarily, while they are slowly substituted by
healthy tissues; they have an anti-inflamatory and analgesic effect, and stop small surface
hemorrhages (hemostatic action). Schavione et al (2007) observed a safe tannins level of
0.15-0.2% (150mg-200mg/100g. As phytochemicals, tannins are antioxidants, and are
important in the healing of wounds, treating diarrhea and preventing the onset of cholesterol.
2.12.1 Other importance/uses of mungbean
As antioxidant and preservative saponins and flavonoids, for example, have wide
applications in the fields of medicine, pharmacy and food industries as pharmacologically
active principles (schopke & Hiller, 1990); as antioxidants, preservatives and flavouring
agents (You, Wang, Yan, Jin, & Huong, (1993). Soetan (2008), reports that saponins are
used in the preparation of spray dried powders containing vitamin E for the enrichment of
foods, drinks and animals’ feeds. Although alkaloids are known to be the most potent anti-
inflammatory agents of the naturally occurring products of secondary metabolism, the same
activity is shown to be attributed to flavonoids and saponins. Huong, Matsumoto, Kasai,
Yamasaki, & Watanabe, (1998) reported the protective action of Vietnamese ginseng
saponins against free radicals-induced injury. Saponins also have analgesic properties
2.12.2 Anti carcinogenic properties.
Koraktar & Rao (1997), described saponins as having anti cancer properties,
inhibiting about two-thirds the development of azoxymethane-induced prenoplastic lesions in
the colon. It has also been proved by many scholars that many anti-tumor drugs preparations
used for the chemotherapeutic management of various types of cancer contain saponins in
their chemical formulations. In confirmation of the above statement, (Schopke & Hiller,
1990; Wakabayashi, Hasegawara, Murata, Ichiyama, & Saiki, 1997) reported that they
inhibited the growth of both benign and malignant tumours.
Studies at the University of Toronto, Canada reported that dietary sources of saponins can
inhibit or kill cancer cells without killing normal cells. Several reports of in-vitro studies
showed that genistein inhibits the growth of a wide range of both hormone dependent and
hormone independent cancer cells including breast cancer (Peterson & Barnes,1991, 1996;
Pegliacci et al, 1994; Clarke, Santos-moore, Stevenson, & Frankellon, 1996; Zava & Duwe,
1997) and prosrate cancer (Peterson & Barnes, 1993; Naik , Lehr, & Pienta,1994; Kyle,
29
Neckers, Takimoto, Curt, & Bergan,1997) colon cancer (Kuo, 1996; Kuo, moorehouse, &
Lin, 1997) and skin cancer (Rauth, Kichia, & Green, 1997) (reviewed by Akiyama &
Ogawara, 1991; Constantinou & huberman, 1995). In in-vitro genistein it inhibits the
metastatic activity of both breast cancer (Scholar &Toewa, 1994) and prostate cancer cells
(Santibanez et al., 1997) independent of the effect on cell growth. There are speculations that
isoflavones may promote bone health based on the similarity in structure between isoflavones
oestrogen and the findings that isoflavones posses weak oestrogenic properties (Messina,
1999).
2.12.3 Anti-microbial activity
Sapoins are reported to have antibiotic activities (Soetan et al., 2006), anti-fungal activities
(Jun et al., 1989) and antiviral activity (Okubo et al., 1994).
2.12.4 Hypo-cholesterolemic activity
The beneficial effects of saponins are largely due to their hyper-cholesterolemic
action, leading to the belief that they may prove useful in the control of human cardiovascular
diseases. Many researchers noted that in human nutrition, saponins assist in prevention of
cardiovascular diseases by lowering plasma cholesterol directly or indirectly as bile acids.
They cause a depletion of body cholesterol by preventing its reabsorption, thus increasing its
excretion in much the same way as other cholesterol lowering drugs such as cholestyramine.
Ronzio (1997) and Bennink (http://www.michiganbean.org/research.html), noted that
mungbean is a rich source of soluble dietary fiber. Soluble fibre reduces blood cholesterol in
epidermiological, clinical and animal studies. Bruce, Spiller, Klevay, Gallagher (2000)
proved that diets rich in whole grains, dark green and yellow/orange-fleshed vegetables,
fruits, legumes nuts and seeds, contain high concentrations of antioxidants phenolics, fibre
and numerous other phytochemicals that may be protective against chronic diseases. The
importance of dietary fibre in unrefined food and beans in the maintenance of a leaner
physique and prevention of constipation, irritable bowel movement, hemorrhoids and
diverticulitis, was highlighted by many scholars. Also, appropriate combinations of beans and
cereals, consumed in adequate amounts, will prevent protein-energy malnutrition (PEM).
2.12.5 Diuretic, anti-diabetic and antiulcer activities
Saponins from Vigna radiata, Vigna mungo and Vigna sinensis are all proved to have
diuretic activities, anti-diabetic activity, (Yamaguchi, 1993); and anti-ulcer activity,
(Marhuenda, Marbin, & Delacastra, 1993).

30
2.12.6Anti-aging /anti-oxidant activity
Saponins are reported to improve learning process and memory retention in experimental
animals (Zang & Hu, 1995). They inhibit lipid peroxide formation in tissues and elevate the
blood and brain superoxide dismutase activity. Yoshiki and Okubo (1995) reported the
oxygen- scavenging activity of saponins. Huong et al. (1998) noted the protective action of
Vietnamese ginseng saponins against free radicals-induced injury.
2.12.7 Management of atherosclerosis.
Saponins have been shown to exhibit various cardiovascular activities. Their ability to
penetrate cell and plasma membranes to cause positive inotrophic effects in isolated cardiac
muscles, qualified them to be included in numerous pharmaceutical formulations for the
management of arteriosclerosis (Schopke & Hiller, 1990), myocardial infarction and aging
pectoris. Ginseng leaf saponins are reported to protect the ultra structure of the myocardium.
Saponins are a class of the two broad classes of compounds called phytoestrogens, which
may help relieve some of the symptoms of menopause and lower the risk of osteoporosis, a
bone thinning disease (Ronzio, 1997).
2.13.1 Functional properties of mungbean
Functional properties are the fundamental physicochemical properties that reflect the
complex interaction between the composition, structure, molecular conformation and physic-
chemical properties of food components together with the nature of environment in which
these are associated and measured (Kaur & Singh, 2006; Saddiq, Ravi, Dolan, & Butt 2009).
Functional characteristics are required to evaluate and possibly help to predict how new
proteins, fat, fibre and carbohydrates may behave in specific systems as well as demonstrate
whether or not such proteins can be used to stimulate or replace conventional proteins (Kaur
& singh, 2006; Saddiq et al., 2009). Onimawo and Akubor (2005) observed that functional
property concerns any non-nutritional property of food substances that affect their utilization.
They are intrinsic physic-chemical characteristics, which affects the behavior of proteins in
food systems during processing, manufacturing, storage and preparation. The functional
properties of foods are related to the raw food materials, that is, the nature, composition and
conformation temperature during cooking, drying, pH and the physical and chemical
modification taking place during processing.

31
The reasons for measuring functionality include to:
1. Determine how the protein has been affected by the processing method employed,
2. Screen and extrapolate functionality test result to performance in the finished products,
3. Understand why specific proteins function as they do,
4. Understand how proteins interact with each other within mixtures or finished products.
A functional property of food is determined by physical, chemical, and/or organoleptic
properties of the food. Example of functional properties may include solubility, absorption,
water retention, frothing ability, elasticity and absorptive capacity for fat and foreign
particulars. Typical functional properties include emulsification, hydration (water binding),
viscosity, foaming, solubility, gelation, cohesion and adhesion (Chandra & Samsher, 1991).
2.13.2 Water absorption capacity (WAC).
Water absorption capacity or characteristics represent the ability of a product to associate
with water under conditions where water is limited (Singh, 2001). Water absorption capacity
is a critical function of protein in various food products like soups, dough and baked products
(Adeyeye & Aye, 1998). The interaction of proteins with water is important to properties such
as hydration, swelling, solubility and gelation. Water absorption capacity is an index of the
ability of protein to absorb and retain water that influences the sensory quality, texture and
mouth-feel characteristics of foods. It is a useful indication of whether protein could be
incorporated with aqueous food formulations, especially those involving dough folding such
as processed cheese, sausages and bread dough. Studies have shown that heat treatment
increases the water absorption capacity of seed flours. During heating, major proteins are
dissociated into subunits that have more water binding sites than the native or oligometric
proteins. Swelling of crude fibre and gelatinization of carbohydrates take place during
heating thereby increasing water absorption. It was observed that fermentation and
germination increase water absorption of flours. This might be due to the proteolytic activity
during these processes that cause increase in the number of polar groups, which increase
hydrophilicity of these seed proteins.
Water absorption capacity of some seed flours can be improved by the addition of 0.2m of
sodium chloride (Nacl). When Nacl is added, the chloride ions are bound to the proteins,
which increase the net charge of the molecules. This unfolds the protein network which
inturn increase accessibility to water. The removal of fat from six Mucuna bean flours lead to
an increase in their water absorption capacities. The fat removed from the samples exposed
the water binding sites on the side chain groups of protein units previously blocked in a
32
lipophilic environment thereby leading to an increase in WAC values in defatted flours
(Adebowale, Adeyemi & Oshodi, 2005).
2.13.[[[3 Protein solubility
Protein solubility has a vital influence on other functional properties like emulsification,
foaming and gelation which determine the usefulness of the product in food systems. Among
functional properties of protein, protein solubility often expressed as nitrogen solubility index
(NSI) is the most important (Onimawo & Akubor, 2005). High solubility is normally a
desired functional property while loss of solubility has been widely used as an indication of
denaturation. High solubility of proteins indicated that they could have promising food
applications.
Variations in experimental conditions for determining protein solubility such as blending
centrifuging, equilibrium time, and initial protein concentration will yield different solubility
values for the same sample. Onimawo and Akubor (2005) observed that protein solubility is
dependent on origin, processing conditions, pH and ionic strengths of a given flour. Heat
processing decreases nitrogen solubility of flours, possibly due to protein denaturation and
subsequent aggregation. Studies have shown that nitrogen solubility increases at low salt
concentration and decreases at high salt concentration. The addition of sodium chloride
enhances the nitrogen solubility of some flours in the pH range of 4-6 where the flour protein
is less soluble in water.
2.13.4 Swelling property
Swelling property of flours depend on size of particles, types of variety and types of
processing methods or unit operations. Swelling property is directly related to water
absorption capacity since the application of heat causes swelling of crude fibre and
gelatinization of carborhydrates thereby, also increasing the water absorption of flour
samples. Chandra and Samsher (2013) obtained the following values of swelling capacity for
different flours: 42.90ml for potato flours; 19.80ml for green gram flour; 17.60ml and
15.20ml for wheat and rice flours, respectively.
As saponins and flavonoid rich legume, mungbean could be used in food, drink and
beverage industries as foaming agents the foaming ability being concentration-dependent.
You et al. (1993) reported that saponins can be used as preservatives and flavouring agents.
Purified saponins or their concentrated extracts are used as food additives in the manufacture
of food and drinks primarily as foaming agents or as emulsion stabilizers.

33
Research has proved that saponins are used in preparation of spray-dried powders containing
vitamin E for the enrichment of foods, animal feeds and drinks. Saponins are used as
adjuvants in the preparation of vaccines against several types of fungal, bacteria, and
protozoa infections (Campbell, 1993).
2.14.1 Processing and preservation methods
These change the form of foods, increase shelf life, digestibility, flavour, colour and the
nutritive values. Poor cooking and processing practices was enlisted by Nwokeocha (2012)
among the constaints to the provision of nutrionally adequate meals. Different food
processing and preservation methods were employed in mungbean preparation, such as:
2.14.2 Washing
This helps to remove dirt and powdered preservatives used in storing dry seeds and easy
removal of husks (dehulling) (Elliot, 1994). Put mungbean seeds into large a sieve and run
cold water through them, move around with the fingers to ensure that the water gets to them
all, rinse.
2.14.3 Soaking
Most pulses benefit from initial soaking before cooking. This speeds up the subsequent
cooking time and also makes them more easily digestible. There are two ways of soaking
pulses:
Short-hot-soak: put washed beans into a saucepan, cover them with plenty of cold water
(1:2v/w) and boil vigorously for 2-3 minutes. Remove from heat, cover the saucepan and
leave to soak for 45-60 minutes (Elliot, 1994).
Long-cold-soak: cover the beans with twice their volume in cold water and leave them to
soak for 4-8h or overnight (Elliot, 1994).
It is observed that soaking and or sprouting beans, seeds, grains and nuts in salt water can
reduce the amount of lectins, phytates, and oligosaccharides in them, improving their
digestibility and preventing them from binding minerals.
2.14.4 Rinsing
Soaked beans are put into a large sieve and rinsed thoroughly under cold running water,
to wash away some of the “unusual saccharide” that render beans indigestible.

34
Additional parboiling-and –rinsing could be employed for enhancing further digestibility by
putting pulses into a saucepan, covering them with cold water and boiling for five minutes.
Then, turn them into a colander and rinse again under cold, running water.
2.14.5 Dehulling
Decortications (dehulling) involves the removal of the seed coat (testa). Dehulling in cereals
and legumes processing is essential for reducing the oligosaccharides (starchiose, verbascose
and rafinose). These are concentrated in the seed coat and are responsible for gassing
(bloating) and flatulence in the intestine that are usually associated with legume consumption
(Enwere, 1998). Dehulling enables the removal of some antinutritional factors and toxic
substances that abound in the seed coat, and improves the colour and texture of food
products. Osagie (1998) observed that abrasive dehulling removed saponins and reduced the
total level of indigestible fibre in legumes. Obizoba and Atii (1998) reported that soaking and
dehulling provided African yam bean flours with high quality nutrients.
2.14.6 Sprouting (germination)
Elliot (1994) defined sprouting as keeping the beans in damp condition for anything
from 2-5days and rinsing them off in cold running water two or three times a day
to remove toxins produced. This results in beans which are soft to eat without cooking, with
lovely crunchy “sprouts” on them. Nutritionally, they are rich in vitamins A and C. Esther
Munroe in “sprouts” (Elliot, 1994) observed that ‘one half cup of almost any sprouted seed
provides as much vitamin C as six glasses of orange juice.’ A handful of sprouts included in a
salad or stir-fry vegetable mixture immediately increases its food value.
Pilot study: Northerners add sprouted seeds to the ground “Kunu” ingredients to improve the
nutrient quality.
2.14.7 Sun-drying
This is the oldest and most widespread used preservation technique for different types of
food. It is achieved by allowing the direct heat of the sun on foods (under cover of muslin
sheet). Due to heat, light and air, oxidation of some nutrients like vitamins and minerals
might occur; infestation of the foods by micro organisms, dust and other contaminations due
to birds, insects and other animals, also occurs. These result in some forms of spoilage and
quality reduction (Okoye 2008).

35
2.14.8 Shade drying
This is drying food under a shade instead of the direct heat of the sun. It reduces the
bleaching (oxidizing) effect of sunlight and loss of heat labile vitamins and minerals. Okoye
(2008) observed that it concentrates proteins invegetables and destroys some nutrients.
2.14.9 Cooking
This softens, improves the taste and colour, kills certain germs and renders foods
more easily digestible. To cook a food, put into a saucepan or casserole and cover generously
with water or stock. Flavourings can be added salt should not be as it toughens the outside of
the beans and prevents them from cooking properly. Acids such as vinegar, lemon juice and
tomatoes, have similar effect on pulses; so are best added after the initial cooking.
Bicarbonate of soda speeds up the cooking time, but is disastrous from the point of view of
the flavour and nutritional value of pulses. Pulses can be cooked on top of the range (cooker)
or in the oven. Heating leads to the gelatinization of starch and denaturation of protein and
other interactions involving other ingredients in food (Enwere, 1998). The texture, taste,
flavour and acceptability of foods are increased with cooking.
2.14.10 Fermentation
Fermentation is an age-long processing technique in Nigeria and many other
developing countries of the world. Many studies identified fermentation as an economic
processing method that could be used in the homes to improve the nutritional quality of plant
foods. Adequate diets for infants, young children and adults had been made available through
fermentation methods. Enwere (1998) defined fermentation as a process of anaerobic or
partially anaerobic oxidation of carbohydrates, especially sugars, by microorganisms, such as
yeast, moulds and bacteria fermentation process may be complete oxidation in which sugars
are converted to carbon dioxide water or it may be partial oxidation in which the sugars are
converted to citric acid, butyric acid, alcohols, aldehydes and hydrogen and some flavour
compounds. It may impart new colour, flavour, taste, and texture to a product (Nnam, 1994).
It improves the taste of foods and reduces contamination with pathogenic bacteria.
FAO/WHO, (1996) defined fermentation as the biochemical modification of primary food
products brought about by the action of microorganisms and their enzymes. It is intentionally
carried out to enhance the taste, aroma, and other properties of foods.
Fermentation is the basis for the production o modern wine from various fruit juices
and palm wine from palm sap obtained from the palm tree and raffia palm. More desirable

36
and storable products could be obtained from cereals, legumes, roots, tubers, fruits and
vegetables through controlled fermentation conditions. In cases where microorganisms
capable of hydrolyzing higher carbohydrates, such as, cellulose, hemicellulose, pectins and
starch, are allowed to become active, adverse effect in texture, flavour and general
acceptability of products are enhanced. Some food flavouring agents are produced through
fermentation, for example, ‘dadawa’ produced from soyabean or locust bean seeds; ‘ogiri’
produced from castor seed oil or melon seeds; ‘okpei’ produced from locust bean or soyabean
seeds. These flavouring agents impart different aroma into soups, stews, pottage, and
vegetables. Fermented indigenous Nigerian foods produced from cassava roots are “gari”,
“foo-foo,” “lafun”and cassava flour. Fermented products from maize, rice, sorghum and
millet include pap (“akamu”) or “ogi”, “appa” and “agidi”.
Fermentation when well controlled leads to significant improvement in the nutritive value,
flavour, and texture of foods and and increases digestibility of proteins through hydrolysis to
amino acids. Carbohydrates such as raffinose, starchyose and verbascose are converted to
simple sugars, thus reducing flatulence (Enwere, 1998). It increases the availability of
minerals, such as calcium and phosphorus through the hydrolysis of phytate and oxalate. The
protein content of maize and lysine, methionine and isoleucine levels decrease (Obiakor,
2009). Tannins in legumes decrease with fermentation while ionizable irons increased.
Tannins may be important factor responsible for low iron absorption. Inedible foods are made
edible by fermentation. For instance, some legumes such as African locust bean and oil bean
are inedible in their unfermented state. However, during fermentation they are made edible
by the extensive hydrolysis of the indigestible components and the removal of the anti-
nutritional factors by the microorganisms.
The process of fermentation introduces a lot of beneficial bacteria and enzymes into foods,
therefore improving digestion and increasing their nutrient content in many cases.
Fermentation and germination increase water absorption capacity of food grains and legumes.
2.14.11 Pottage/Stew
Pottage is a thick soup.
Stew is cooked dish made from meat and vegetables that are cooked slowly together in
liquid e.g. beef stew (Longman dictionary of contemporary English (2003).

37
CHAPTER THREE
MATERIALS AND METHODS
3.1 Materials
The legume, mungbean (Vigna radiata) grain was purchased from Agronomy
Department, Michael Okpara University of Agriculture, Umudike, Umuahia, Abia State
Nigeria. Mungbean seeds that weighed 3.750kg were collected for the study. The seeds were
cleaned by removing dirts, stones and foreign materials. The clean seeds were washed in
cooled warm water and drained to remove any traces of dust and other possible contaminants.
The bakery material, beans and other ingredients used in sensory evaluation were purchased
from Eke Awka main market, Awka, Anambra State, Nigeria.
3.2 Experimental design
The experimental, analytical and qualitative research procedures were combined with
sensory evaluation. These were conducted in Anambra State College of Agriculture,
Mgbakwu, via Awka, Nigeria. Sensory properties were determined using a twenty-five
member panel consisting of lecturers (including nutritionists, home economists, dietitians)
and students of the college who had previously participated in similar sensory evaluation.
Cakes, moi-moi, akara and porridge samples were presented in china plates. The order of
presentation of samples was randomized. Warm water was provided for the judges to rinse
their mouths in between samples. The panelists were instructed to evaluate the coded samples
for colour, taste, texture, flavour and general acceptability. Each sensory attribute was rated
on a 9-point hedonic scale (1=disliked extremely and 9 =liked extremely).

38
3.3 Whole Mungbeans
39
3.4 Sample preparation
Two thousand four hundred grammes (2400g) of mungbean were weighed out from
the 3,750g total sample and kept aside for use in dry flours preparation. One thousand three
hundred and fifty grammes (1350g) were used for akara, moi-moi and porridge for sensory
evaluation. Two thousand four hundred grammes (2400g) of mungbean seeds were divided
into six equal portions as shown in figure I. Sample 1, the seeds were fermented for 24h,
dehulled and shade dried. Sample 2, this portion was fermented for 48h, the soaking water
was changed after the twenty-fourth hour to prevent the development of offensive odour, the
seeds were dried to be moisture free. Sample 3, this portion was soaked for 5h, dehulled, and
shade dried. Sample 4, these seeds were soaked for 5h, dehulled, and sun dried. Sample 5,
these seeds were washed in cooled warm water, undehulled and shade dried to serve as
control. Sample 6, these seeds were soaked for 5h, germinated for seven days and shade dried
until it became moisture free.
Samples 1-6 were milled and sifted thoroughly several times with 70mm screen sieve to
obtain free granule flour. No chaff was discarded, rather ploughed back into the rest of the
flour. Each sample was packaged and labeled correctly. Samples 3, 4 and 6, were soaked for
5h before dehulling or sprouting for easy removal of husk or germination (Figure I).

40
3.5
Figure1: Processing of Mungbean Seeds
MUNGBEAN SEEDS
Picked
Washed
Drained
Fermented 24h
1
Fermented 48h Soaked 5h Soaked 5h Notsoaked Soaked 5h
Dehulled Dehulled Dehulled Dehulled Undehulled Sprouted
Shade Dried Shade Dried Shade Dried Shade Dried Shade Dried Sun Dried
4 3 2 5 6
Milled flour Milled flour Milled flour Milled flour Milled flour Milled flour
Packaged Packaged Packaged Packaged Packaged Packaged
Named
labelled
Named
labelled
Named
labelled Named
labelled
Named
labelled Named
labelled
Stored Stored Stored Stored Stored Stored

41
3.6 Plate 2: 7-days Sprouted Mungbean

42
3.7 Orgonoleptic attributes of the products.
This was helpful in the achievement of objective and subjective responses about colour, taste,
flavour (aroma), texture and general acceptability of the various samples. Trained judges such
as staff and students of Anambra State College of Agriculture Mgbakwu were used as the
panelists. A 9- point hedonic scale was used for the product evaluation.
The beans for moi-moi and akara for sensory evaluation were picked, winnowed and washed
in mild warm water to remove stones, chaff, dust and dirt. The cleaned samples were soaked
for five hour, dehulled and milled. Prior to cooking, the beans for pottage/stew were soaked
using the short–long-soak method. One part of the beans were put in 3 volumes of cold water,
boiled for 3 minutes, brought down and covered, left for 65 minutes prior to final cooking
(Elliot, 1994).
3.8. Formulation of Blends (composite flour).
The flours developed from mungbean and their blends were used to prepare moi-moi, ‘akara’
balls and cakes for their organoleptic attributes. Ten composites (blends) on the whole were
obtained.
Flour Ratio of blends (%) Number of pmhroducts from blends
A B Cakes “Akara”& Moi-Moi
Mungbean: wheat flour 70:30 50: 50 DSU: W 70:30 DMB: V.spp 70:30
Mungbean: Vigna spp. 70:30 50:50 DSU: W 50:30 DMB: V.spp 50:50
Mungbean: Vigna spp. 70:30 50:50 SP7: W 70:30
SP7: W 50:50
F48: W 70:30
F48: W 50:50
3.9. Proportion of ingredients
A. Cake recipe
Ingredient Quantity Flour type
70:30 flour blends 175g/75g mungbean or wheat
50:50 flour blends 125g/ 125g mungbean or wheat
100% flour (controls) 250g mungbean or wheat
Margarine 125g
Sugar 125g
Egg 2 large
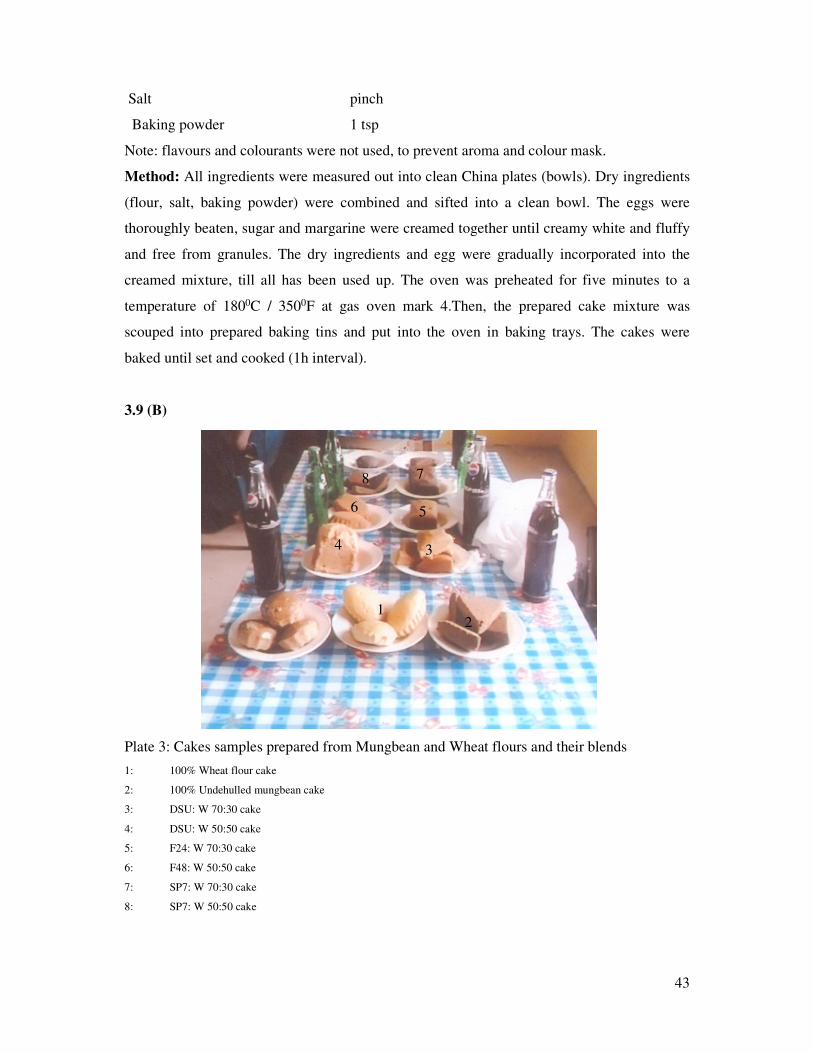
43
Salt pinch
Baking powder 1 tsp
Note: flavours and colourants were not used, to prevent aroma and colour mask.
Method: All ingredients were measured out into clean China plates (bowls). Dry ingredients
(flour, salt, baking powder) were combined and sifted into a clean bowl. The eggs were
thoroughly beaten, sugar and margarine were creamed together until creamy white and fluffy
and free from granules. The dry ingredients and egg were gradually incorporated into the
creamed mixture, till all has been used up. The oven was preheated for five minutes to a
temperature of 1800C / 3500F at gas oven mark 4.Then, the prepared cake mixture was
scouped into prepared baking tins and put into the oven in baking trays. The cakes were
baked until set and cooked (1h interval).
3.9 (B)
Plate 3: Cakes samples prepared from Mungbean and Wheat flours and their blends
1: 100% Wheat flour cake
2: 100% Undehulled mungbean cake
3: DSU: W 70:30 cake
4: DSU: W 50:50 cake
5: F24: W 70:30 cake
6: F48: W 50:50 cake
7: SP7: W 70:30 cake
8: SP7: W 50:50 cake
3 4
5 6
7 8
1 2

44
3.9(C) Akara recipe
Ingredients Quantity
Mungbean or Vigna spp. paste 250g
Ground onion 1tblsp
Ground pepper ½ tsp
Salt to taste 1/2 tsp)
Vegetable oil for deep frying to cover 2/3 of the deep fryer
Water I milk cup
Method:
All ingredients were thoroughly mixed in a very clean motar and blended with pestle. Scoups,
made using a desert spoon were fried in deep hot oil until golden brown and cooked.
3.9 (D)
Plate 4: Akara balls prepared from mungbean and Vigna spp. flours and their blends
i. Back left: 100% Dehulled mungbean akara
ii. Back right: 100% Vigna spp. akara
iii. Front Left: DMB: V.spp. 50:50 akara
iv. Front Right: DMB: V.spp. 70:70 akara

45
3.9 (E) Moi –moi recipe
Ingredients Quantity
Mungbean or Vigna spp. paste 250g
Ground crayfish 1tblsp
Ground onion 1tblsp
Ground pepper ½ tsp
Salt ` to taste (½tsp)
Knorr cube 1 cube
Vegetable oil 2 tblsp
Warm water 2 milk cups
Method: all ingredients were mixed together and thoroughly beaten in mortar with pestle.
They were scouped into prepared foil sheets and steamed for 1½ hour in boiling water.
3.9 (F)
Plate 5: Moi-moi samples prepared from Mungbean and Vigna spp. paste and their blends

46
3.9 (G) Preparation of Pottage.
Whole mungbean seeds were prepared and cooked as bean soup/stew using the ingredients
for bean pottage (stew) preparation, in proportion to the quantity of beans cooked (250g).
This was to evaluate the flavour, taste, texture, colour, and general acceptability of mungbean
pottage/stew to compare with those of cowpea (Vigna unguiculata) beans used in the normal
bean pottage/stew preparation. ‘Akara-balls” and moi–moi prepared from mungbean flours
were compared with those of black-eyed (Vigna spp.) beans.
3. 9 (H) Bean pottage (stew):
Ingredients Quantity
Mungbean or cowpea 250g
Ground crayfish 1tblsp
Ground “okpei” ½ tblsp
Salt ½ tblsp
Knorr cube to taste, 1tsp
Ground onion 1 tblsp
Red palm oil 4tblsp
Water:
Cowpea 1 litre
Mungbean
Method: washed beans were put into a saucepan, covered with plenty of cold water (1:2v/w)
and boiled vigorously for 2-3 minutes. Removed from heat, covered and left to soak for 45-
60minutes. The soaking water was sieved away. The beans were mixed with water and set to
the boil for 45 minutes, the red oil was added and allowed to stay for five minutes adding the
rest of the ingredients and the boiling continued until the seeds became very soft and ready
for eating. Cowpea took shorter cooking time (1h) than mungbean (1h 34 min). Cowpea also
consumed less cooking water (1 litre) than mungbean (11/3 litres).

47
3.9 (H)
Plate 6: Pottage prepared from mungbean and cowpea seeds
i. Left: Mungbean Soup
ii. Right: Cowpea Soup
48
3.10 Chemical analysis
Chemical analysis of the samples was carried out in triplicate.
Proximate
3.10 (A) Moisture:
Principle –the sample was dried at 100 -102oC for 16h in a draft air oven. The loss in weight
was reported as moisture. However, compounds, other than moisture may have been lost.
Procedure:
The moisture content of the samples was determined using oven drying method of AOAC
(2000). Stainless dishes were washed and dried in air oven and allowed to cool in a
dessicator. Three grammes of the samples were weighed into already prepared dishes, placed
uncovered in the well ventilated oven and maintained at 103± 2OC.
After sixteen hours the lids were replaced and dishes were transferred to a dessicator at room
temperature to cool. When cooled for (about 30 minutes), the dish and its content were
weighed quickly to 0.1mg. The dish and sample were replaced in the oven (with lid open) for
2h. The weighing and reheating were repeated until the decreases in mass between successive
weighing did not exceed 0.05mg per gramme of sample. The loss in weight was reported as
moisture content.
% moisture content = M1M0 X 100
M1 - M0
M o = weight in gramme of dish and lid
M 1 = weight in gramme of dish, lid and sample before drying
M 2 = weight in gramme of dish, lid and sample after drying
M 1-M 0 = weight of sample prepared for drying.
% moisture content = 100% moisture content.
3. 10(B) Crude protein:
The protein content of the samples was determined by the AOAC (1995) micro-Kjeldahl
method.
Principle:
The sample was digested in sulphuric acid in the presence of a catalyst. The nitrogen from
protein and some other constituents were converted to ammonium sulphate. The ammonia
was distilled into standard acid after the digest had been alkaline. The percentage of nitrogen

49
was calculated and the result, converted to “crude protein” by multiplying by a factor,
usually, 6.25.
Apparatus:
1. Kjeldahl flasks, borosilicate glass, 300,500 or 800ml,
2. Distilation unit.
Reagents:
1. Sulphuric acid
2. Catalyst
3. Saturated sodium hydroxide
4. 0.1.N hydrochloric acid
Principle: the ash determination was on the principle that when foods and food products are
heated to temperature of 5000 C and above, water and other volatile constituents are evolved
as vapours. Organic constituent was burnt to carbon dioxide and water. The mineral
constituent remained in the residue as oxides, sulfate and phosphate depending on conditions
of incineration in the food products.
Apparatus:
1. Muffle furnace
2. Porcelain crucible
3. Dessicator
4. Hot plate
Procedure:
Crucibles were washed and dried in the oven, allowed to cool in a dessicator and weighed.
Three grammes of each sample was weighed into the crucible, the crucible and its content
were placed in a muffle furnace maintained at a temperature of 6000C for six hours (6h) to
obtain carbon free grayish sample (white).The crucible containing the grayish sample was
transferred directly to a dessicator, cooled and weighed. % ash= (weight of crucible + ash)
minus (Weight of empty crucible) multiplied by 100 all over sample weight. I E,
(Weight of crucible + ash) - (weight of empty crucible) x 100
Sample weight
3. 10 (C) Fat:
The fat content of the samples was determined using automated method (soxtec system HT2)
(1976). The sample was milled and dried properly. Two grammes (2g) of sample were put

50
into thimble and plugged with cotton wool .The thimble was dried and inserted into the
Soxtec HT.
Fat was extracted for 15 minutes in boiling position and for 30-45 minutes in rising position.
After this, the solvent was evaporated, cups were released and dried at 100oC for 30 minutes.
The cups were cooled in a dessicator and re-weighed.
Calculation:
Weight of the cup with extracted oil= W3
Weight of the empty cup = W2
Weight of the sample =W1
% fat = W3 - W2 x 100
W1
3.10 (D) Ash determination
The ash content was determined by AOAC (1995) method. 5g of sample was weighed
into already weighted crucible and heated in a muffle furnace at 600 until light grey ash
was obtained. The crucible was removed from the furnace, put in a dessicator to cool. The
crucible was reweighed to obtain the weight of ash.
Principle:
The ash content of any food is the inorganic residue remaining after the food is ignited untilit
is carbon free, usually at the temperature not exceeding red heat. The obtained ash is not
necessarily the same composition as the mineral matter present in the original food, as there
may be losses due to volatilization.
Apparatus:
1. Porcelain dish
2. Drying oven
3. Muffle furnace
Procedure:
Weigh 5g of the sample into a weighed porcelain dish. Dry at 100 for 3-4h in a convection
oven. Remove the porcelain dish from the oven. Do an initial carbonization by placing dish
over a Bunsen flame. Heat gently until the contents turn black.
Transfer the dish and contents to a muffle oven and moisten this first ash with a few
drops of water. Re-dry in the oven at 100 for 3-4h and re-ash 500-600 for another 1h.

51
remove from muffle furnace, allow to cool for a moment ,place in a dessicator until cool and
weigh. Calculate and express result as % ash.
Calculation :
Ash % = [(B-C) x 100]/A
Where A = sample weight in gramme
B = weight in g of dish and contents after drying
C = weight in g of empty dish
3.10 (E) Crude fibre:
The fibre content was determined using acid and alkaline digestion (AOAC, 1995) method.
Principle: the crude fibre content of any food (raw or processed) is indicative of the
indigestible matter or roughage in the food. The method involved deflating the food material,
hydrolyzing the protein and carbohydrate in the food using a mixture of acids.
Principle 11: The H2SO4 method.
This method involved the digestion of the food material in boiled dilute acid to hydrolyze the
carbohydrate and protein. This is followed by digestion in dilute alkali to effect
saponification of the fat in the food material.
Apparatus:
1. 600ml long beaker
2. Buchner funnel
3. Muffle furnace
4. Crude fibre refluxing apparatus
5. Filter paper
6. Porcelain crucible.
Procedure:
A 2g-sample was weighed into a 600ml long beaker. About 200ml of hot 1.25 % H2SO4 was
added. The beaker was placed on digestion apparatus with the aid of vacuum /air pressure
pump. The beaker was rinsed with distilled water. The residue was washed on paper with
distilled water until the filtrate became neutral, transferred from paper back to the beaker with
the aid of hot 1.25% NaOH (200ml).The beaker was returned to the digestion apparatus to
boil and reflux for 30 minutes.The filtrate was filtered through GF/A paper, rinsed with
distilled water and transferred into crucible. The sample was dried at 1000C overnight, the
dried sample was cooled in a dessicator and weighed (weight A). Sample was put in furnace

52
at 6000C for six hours (6h), cooled in a dessicator and reweighed (weight B). The loss in
weight during incineration represents the weight of crude fibre in the sample.
% crude fibre = (weight A)-(weight B) x100
sample weight
3. 10 (F) Carbohydrates:
The carbohydrate content was determined by difference method (Triebold et al, 1973).
This was estimated as follows:
% carbohydrate =100% - %( a + b + c + d + e)
Where a = Moisture
b =Fat
c =Protein
d =Ash
e =fibre.
3.11 (A) Mineral determination
One gramme of each sample was used for mineral: phosphorus, calcium, potassium, iron and
zinc analysis using method described by Ranjiham and Gapal (1980). One gramme of each
sample was weighed into a 100ml round bottom flask. Five millitres (5ml) of percholate was
added and heated over electric heater in a fume chamber until the solution was colourless.
Each of the solution was made up to10 mililitres (10ml) mark with distilled water. The
diluted sample was set aside for further studies. Iron and zinc were determined using atomic
absorption spectrophotometre.
3.11 (B) Phosphorus: was determined spectrophotometrically as yellow phosphor-vanado-
molybdate complex.
Method
1. Weigh one gramme of finely ground sample in a crucible.
2. Ignite the sample in a muffle furnace for 6-8h or overnight at a temperature of 5000C to
obtain grey or white ashes.
3. Cool sample and add INHNO3 solution.
4. Evaporate to dryness on a steam bath.
5. Return sample to the furnace and heat at 4000C for 10-15 minutes until a perfectly white 0r
grayish white is obtained.

53
6. Cool and add 10ml INHCL and filter solution into a 50ml volumetric flask.
7. Wash the crucible and filter paper with additional 10ml portion of 0.1 NHCL three times
and make up to volume with 0.1 NHCL solution.
8. Store the filtrate for minerals determination.
Phosphorus determination by the Vanada-molybdate colorimetric method
1. Ash sample
2. Boil ash with 10ml of HCL and wash the solution into the 100ml flask with H2O.
3. Filter and neutralize by the addition of 0.88ml ammonia to 50-60ml volume.
4. Proceed as the standard graph.
5. Make just acid with dilute nitric acid, add 25ml of vanado-molybdate reagent.
6. Dilute to mark and measure the optical density after allowing to stand for 10 minutes.
Preparation of standard curve
1. To a series of 100ml volumetric flasks add 0, 2.5, 5, 10, 30, 40, and 50ml of the
standard phosphate solution (3.834g hydrogen phosphate (KH2PO4) per litre.
2. Dilute each to 50-60ml with distilled water.
3. Add a few drops of ammonia solution (0.88) and make just acid with nitric acid (1:2).
4. Ad. Then gradually add the molybdate solution to the acid vanadate solution with
stirring and dilute to a litre with water.
5. Dilute to the mark and mix.
6. Allow to stand for ten minutes and measure the optical density in a 0.25cm cell at
470nm.
7. Plot on a standard curve and read.
3.11(C) Calcium and potassium (EDTA titration method)
1. Use stock solution
2. Dilute 25ml sample to approximately 50ml with H2O.
3. Add 2ml buffer solution (dissolve 16.9g NH4CL in 143ml. NH4OH, and 1.25g EDTA
and dilute to 250ml with H2O.
4. Add 250mg Nach (pH 10.0) and 200mg indicator eriochrome black T and 100g
NaCL).
5. Titrate with 0.01m EDTA (3.723g NaEDTA2H2O and dilute to 1 litre with H2).
6. End point is when solution turns blue from reddish tinge.
[a x Tca x v1 x 100]/ w x v2.
54
a = ml EDTA
Tca = titration factor of EDTA
V1 = total volume
v2 = aliquot for determination
w = weight of sample
3.11 (D) Iron determination by volumetric method
Dry ash
Add H2SO4 and heat to to dissolve ash
Evaporate on steam bath and heat until copious fumes of SO4 evolve
Dissolve in water and let stand on steam bath to cool.
Pass H2S through solution to reduce Fe, ppt and any contamination.
3.11 (E) Determination zinc by atomic absorption spectrophotometer
Reagents
1. Zinc
2. HCL
3. Stock zinc standard
4. A stock solution was prepared by dissolving 1.00g of zinc in 30ml of 5m HCL.
Dilute to 1 litre in a volumetric flask with de-ionized water. Store in a polythene bottle.
1ml of the Wt. of sample x 106 (g)
3.12 (A) Anti-nutrients determination stock solution = 1mg =1000ug. The 1ml was
further dissolved in 1litre of deionized water. 0.2ml of the stock solution in 100ml of
deionized H2O = 2 g Znn-.
0.4ml of the stock solution in 100ml of deionized H2O = 4 g Zn ml-1.
0.6ml of the stock solution in 100ml of deionized H2O = 6 g Zn ml-1.
0.8ml of the stock solution in 100ml of deionized H2O = 8 g Z ml-1.
1.0ml of the stock solution in 100ml of deionized H2O = 10 g Zn ml-1.
Principle
Zinc is the residue remaining after the destruction of the organic matter of plant
material obtained.
Calculation
A calibration curve was constructed and used to calculate the concentration of zinc.

55
g of the curve x diluted factor x 100(%) x1000mg
Wt. of sample x 106 (g)
3.12 (B) Phytate determination: Phytate level was determined by a calourimetric
procedure described by Vaintraub and Lapteva (1988). Ground samples (0.5 g
each) were stirred in 10 minutes to obtain the supernatants. Suitable aliquots of
supernatants were diluted with distilled water to 3ml for the assay. The value was
expressed as percentage phytate.
3.13 (C) Tannins determination: This was determined by spectrophotometric method
described by Lattta and Eskin (1980). Five grammes (5g) of the sample were weighed into a
250ml conical flask to which 100ml of 2.4% HCL was added to extract tannins for one hour,
centrifuged and decanted. The supernatant was diluted 1ml /5ml of 2.4% to 2.5 ml with
distilled water. Ten millilitre of diluted sample was passed through AGI-X8 chloride anion
exchange column (200-400mesh), 0.05g phytate elude with 0.7m sodium chloride (NaC1).
Three millilitre (3ml) of 0.7m elutant fraction was pipetted into 15ml conical test tubes and
mixed on a vortex mixer for 5secs and centrifuged for 10 minutes. The absorbance of the
supernatant was read at 500nm using water to zero, the spectophometre was measured.
Phytate content was estimated using a standard curve.
3.13 (D) Oxalate determination: This was determined by a method described by Dye and
modified by Iwuoha and Kalu (1995). Two grammes (2g)of samples were suspended in a
mixture of 190ml distilled water and 10ml 6NHCI in 250ml volumetric flask, digested for 1h
at 1000C, cooled and made up to 200ml with distilled water. The digest was filtered through
Whatman number one filter paper using a suction pump. Duplicate portions of 125ml of the
filtrate was measured into 250ml beaker and four drops of methyl red indicator was added in
drops until the test solution changed from its salmon pink to a faint yellowish colour (pH4-
4.5). Each portion was heated to 90%, ten millilitres (10ml) of 5% CaCl2 was added in drops
until the test solution changed from its salmon pink to a faint yellowish colour (pH 4 -4.5 ).
Each portion was heated to 90%. Ten mililitres (10ml) of 5% CaCl2 was added and
centrifuged at full speed (200rpm) for 5minutes. The supernatant was decanted and the
precipitate was completely dissolved in 10ml of 20% (v/w) H2SO4 solution. At this point, the
filtrate resulting from digestion of the 2g sample was added and made up to 300ml. Aliquot
(125ml) of the filtrate was heated until near boiling to titrate against 0.05 m standard KMn04

56
solution to a faint pink colour which persists for 30seconds. Oxalic acid content was
calculated using the formula:
% Oxalic acid = TX (Vme) (DF) X 105
Me-MF
Where, = titre volume for KMnO4
Vme =Volume –mass equivalent (km3 of 0.05KMn04 solution is equivalent to
0.0022g anhydrous oxalic acid).
DF=the dilution factor VT/A (2.4) where VT is the total aliquot (125ml) used.
Me=the molar equivalent of KMnO4 in oxalic (KMnO4 redox potential is 5).
MF = the mass of sample used.
3.12 (E) Saponins determination: Total saponins (triterpenoid and steroidal) was
determined using the spectrophotometric method described by Iwuoha & Kalu (1995)
Ground samples (0.5g each) were stirred overnight in 10ml of 80% acqueous methanol using
a magnetic stirrer. The contents were centrifuged at 3500g for 10 minutes. The supernatants
were collected in 2.5ml volumetric flasks. The residues were washed three times with 5ml of
80% aqueous methanol. Aliquot samples from the flask were used for saponins
determination. The results were expressed as diosgenin equivalent from a standard curve of
different concentrations of diosgenin in 80% aqueous methanol.
3.13 Functional properties determination
3.13 (A) Water absorption capacity (WAC):
This was determined using Solsulski (1962) procedure. Fifteen millilitres (15ml) of distilled
water was added to 1g of flour in a weighed 25ml centrifuge tube. The tube was agitated with
a vortex mixer for two minutes and centrifuged at 400rpm for twenty minutes (20mins). The
clear supernatant was decanted and discarded. The adhering drop of water was removed prior
to reweighing the centrifuge tube.
Calculation: water absorption capacity was expressed as the weight of water bound by 100g
dry flour.
3.13 (B) Swelling property and solubility:
These were determined using the procedure describe by Solsuki (1962). The sample milled
into fine powder was dried to constant weight. One gramme (1g) dried sample was weighed
into 100ml conical flask. Fifteen millilitres (15ml) of distilled water was added to the sample
and shaken for five minutes (5mins) at low speed. The solution was transferred into water

57
bath heated for 40minutes at 80-850C with constant stirring. The sample was again
transferred into pre-weighed centrifuge tube; 7.5ml of distilled water was added and
centrifuged at 2.200rpm for (20) twenty minutes. A careful decantation of the supernatant
into a pre-weighed can was done, dried at 1000C to a constant weight, put in a dessicator and
weighed. The precipitate was weighed in a centrifuge tube.
Calculation:
1. Weight of can =A
2. Weight of can dried supernatant t=B
3. Weight of soluble =A-B
4. Weight of empty centrifuge tube =D
5. Weight of centrifuge +sediment =E
6. Weight of sediment =E-D
Swelling power = Wt of sediment
Sample weight-weight of soluble
% solublility = Wt of soluble x 100
Wt of sample
3.14. Statistical analysis
The data was analyzed using means, standard deviation and standard error of the
mean. One way analysis of variance (ANOVA) was performed and Duncan’s New
multiple Range Test was adopted to separate and compare means(P<0.05).

58
CHAPTER FOUR
RESULTS
Proximate Composition
Table 1 presents the effects of processing on proximate composition of six mungbean
flours (%, dry matter).
There were increases in values of protein from 25.67 to 32.44%. The dehulled shade dried
(DSH), the dehulled sundried (DSU) and the twenty four hour fermented (F24) samples had
higher and comparable (P>0.05) values (32.44, 32.24 and 32.02%, each) relative to the other
values. The control, the undehulled shade dried (UDSH), the forty-eight hour (F48) fermented
and the seven-day sprouted (SP7) samples had similar (P>0.05) protein values (26.22, 25.98 and
25.67%, each).
The control (UDSH) and the SP7 samples had similar (P>0.05) fat (2.03 and 2.15%, each).The
other samples had also similar (P>0.05) values that ranged from 1.74 to 1.91%.
Ash values varied and the variation was from 3.74 to 4.41%. The seven-day sprouted
(SP7) had 4.41mg ash. On the other hand, the control (UDSH) and the DSH had similar
(P>0.05) value (3.99%). The twenty four hour fermented (F24) and the forty-eight hour
fermented (F48) had varied and comparable ash (P>0.05) (3.74, 3.85%, each).
The fibre values varied. The range was from 3.76 to 4.42%. The control (UDSH) had
the highest fibre (4.42%). This value was comparable (P>0.05) to those of the DSU, the F24,
F48 and the SP7 samples (4.42, 4.24, 4.33, 4.04 and 4.10%, respectively). The dehulled
shade-dried (DSH) had 3.76% fibre.
Carbohydrate (CHO) values ranged from 50.57 to 57.05%. F48 and the SP7 samples had
57.05 and 56.48% (CHO). The other four samples had comparable (P>0.05) carbohydrate
(51.67, 50.82, 50.66 and 50.57%, each).

59
Table 1: Effects of Processing on Proximate Composition of Six Mungbean Flours (dry
matter %)
Samples Protein Fat Ash Fibre CHO
UDSH 26.22b 2.03a 3.99b 4.42a 51.67c
DSH 32.44a 1.88b 3.99b 3.76b 50.82c
DSU 32.24a 1.91b 4.27a 4.24a 50.66c
F24 32.02a 1.75b 3.74b 4.33a 50.57c
F48 25.98b 1.74b 3.85b 4.04a 57.05b
SP7 25.67b 2.15a 4.41a 4.10a 56.48b
Means in the same column with different superscript letters differed (P<0.05)
UDSH = Control, undehulled and shade dried mungbean
DSH = dehulled and shade dried mungbean
DSU = dehulled, sundried mungbean
F24 = 24h fermented mungbean
F48 = 48h fermented mungbean
SP7= 7days sprouted mungbean

60
Table 2 Presents the Effect of Processing on Mineral Contents of Six Mungnbean Flour
Samples (%, dry matter).
The F24 and the F48 samples had comparable (P>0.05) and highest calcium relative
to the other four samples (84.39 and 81.99mg). The remaining samples of various treatments
had closer (P>0.05) values which ranged from 76.45 to 79.22mg.
Iron values differed. The range was from 5.42 to 6.32mg. The F48 sample had highest
(P<0.05) value (6.32mg) relative to the other five samples (Table 2). The control (UDSH),
the DSU, the F24 and the SP7 samples had comparable (p>0.05) values that ranged from 5.67
to 5.97mg. The DSH had 5.42 mg iron.
The zinc (Zn) values for all samples differed (p<0.05). The undehulled shade-dried
(UDSH) had higher Zn (P<0.05) than the other samples (21.18mg). The DSH and the DSU
had very close values (2.22, 2.12mg, each). The remaining three samples had comparable
(P>0.05) values that ranged from 1.57 to 1.93mg (Table 2).
Sodium (Na) values differed. The F24 sample had 9.16mg Na which was different (P<0.05)
from the other values. The DSH, the DSU, the F48 and the SP7 samples had similar values
8.92, 8.99, 8.19 and 8.36mg, each.

61
Table 2: Effects of Processing on Mineral Content of Six Mungbean Flours (mg/ dry
matter).
Samples Calcium Iron Sodium Zinc
UDSH 76.45b 5.74b 7.51c 21.18a
DSH 78.39b 5.42b 8.92b 2.22b
DSU 79.22b 5.97b 8.99b 2.12b
F24 84.39a 5.67b 9.16a 1.93c
F48 81.99a 6.32a 8.19b 1.63c
SP7 78.56b 5.94b 8.36b 1.57c
Means in the same column with different superscript letters differed (P<0.05)
UDSH = control, undehulled shade dried mungbean
DSH = dehulled shade dried mungbean
DSU = dehulled, sundried mungbean
F24 = 24h fermented mungbean
F48 = 48h fermented mungbean
SP7 = 7 days sprouted mungbean

62
Table 3 Presents Anti-nutrient Content of Six Mungbean Flours (mg/100g).
The phytate content of the flours ranged from 5.55 to 6.25mg. The UDSH sample had 5.55mg
phytate. The SP7, the F24 and the DSU samples had 6.25, 6.18 and 6.20mg phytate. The
remaining two samples, the DSH and the F48 samples had 5.70 and 5.59mg phytate,
respectively.
Tannins content of the mungbean flours differed. The twenty-four hour fermented (F24)
sample had 5.29mg tannins and the SP7 had lower value (4.02mg). The DSH, the DSU, the
F48, and the UDSH samples, had 4.76, 4.31, 4.87 and 4.91mg tannins, respectively.
The oxalate content of the samples ranged from 2.07 to 2.68mg. The F24 and F48
samples had 2.68 and 2.32mg, each. The SP7 had 2. 07mg. The other samples, the UDSH, the
DSH, and the DSU samples had 2.16, 2.19, and 2.10mg, each.
Saponins values were low. The values ranged from 0.16 to 0.20mg. The UDSH had the
lowest saponin (0.16mg) as well as the F48 sample (0.17mg).Two samples, the DSH and the
SP7 had the same values of 0.18mg, each. The remaining samples, the F24 and the DSU had
0.20mg, each.

63
Table 3: Anti-nutrient Content of Six Mungbean Flour Samples (mg).
Samples Phytate Tannins Oxalate Saponins
UDSH 5.55b 4.91b 2.16a 0.16a
DSH 5.70b 4.76b 2.19a 0.18a
DSU 6.20a 4.31b 2.10a 0.20a
F24 6.18a 5.29a 2.68a 0.20a
F48 5.59b 4.87b 2.32a 0.17a
SP7 6.25a 4.02b 2.07a 0.18a
Mean values in the same column with different superscript letters differed (P<0.05).
UDSH = control, undehulled shade dried mungbean
DSH = dehulled shade dried mungbean
DSU = dehulled sundried mungbean
F24 = 24h fermented mungbean
F48 = 48h fermented mungbean
SP7 = 7 days sprouted mungbean

64
Table 4 presents the functional properties of six mungbean flour samples (mg/100g).
The water absorption capacity (WAC) of the flours was comparable except for the F48
(56.37mg) which was slightly higher than the others samples (56.37 vs 52.13 to 55.29mg).
The swelling capacity (SWP) of the flours varied. The range was from 5.06 to 6.68mg.
The DSH sample had a low value (5.06mg).The swelling property of the UDSH, the F24, the
F48, and the SP7 samples had values that ranged from 6.18 to 6.68mg.The values(5.06 and
5.60mg) were for the DSH and the DSU samples which were comparable with the other flours
(P>0.05).
The protein (N) solubility values differed. The range was from 4.70 to 5.28mg. The F24, the
F48 SP7 samples had 5.28, 5.16 and 5.28mg, respectively. The UDSH, the DSH and the DSU
samples had low values (4.70, 4.89, and 4.79mg, each) relative to those of the other flours (5.16
and 5.28mg, each).

65
Table 4: Functional Properties of Six Mungbean Flours (mg /100 g sample).
Samples WAC SWP P.sol
UDSH 54.21a 6.42a 4.70b
DSH 52.13a 5.06b 4.89b
DSU 54.20a 5.60b 4.79b
F24 53.24a 6.39a 5.28a
F48 56.37a 6.18a 5.16a
SP7 55.29a 6.68a 5.28a
Means in the same column with different superscript letters varied (P<0.05).
UDSH = control, undehulled shade-dried mungbean
DSH = dehulled shade dried mungbean
DSU = dehulled sundried mungbean
F24 = 24h fermented mungbean
F48 = 48h fermented mungbean
SP7 = 7 days sprouted mungbean

66
Table 5 presents proximate composition of cakes, moi-moi, akara and porridges based
on mungbean, blackeyed bean (Vigna spp. /cowpea) varieties and wheat flours, or their
blends.
The moisture content of cake products differed. The range was from 16.45 to 65.48%. Moi-moi
based on 100% Vigna specie had the highest moisture 75%. The 7-day sprouted and the wheat
blend (SP7: W 70:30) had the least moisture (16.45%). The two pottages based on cowpea and
mungbean had 62.20 and 68.30% moisture, each. Akara products based on 100% DMB or
100% V.spp. bean flours or their blends (DMB: V. spp. 70:30 or 50:50) had 53.00, 51.60, 54.10
and 55.50%, respectively. Moi-moi based on 100% V.spp bean or 100% DMB and their blends
DMB: V.spp 70:30 or DMB: V.spp 50:50) had 75.00%, 56.00%, 24.00% and 70.00%, each.
Cakes based on F48: W 70:30 and the DSU: W 50:50 had
65.48 and 42.24 % moisture, each. Cakes based on DSU: W70:30, F48: W 50:50 and SP7: W
50:50 had 31.15%, 31.27 and 31.00% moisture, respectively.
The protein content of the cakes varied. The values ranged from 2.85% to 38.75%. The
cakes based on the 100% UDSH mungbean and the 100% WF had each 7.66 and 31.74%
protein. The F48 and the wheat blend (F48: W 70:30) had 2.85%. Surprisingly, the two pottages
based on the 100% CP and the UDM had 9.85 and 10.95% protein, each.
Akara had varied protein values. The 100% DMB based akara had 24.08% protein relative to
that of the 100%. V. spp. bean based akara 5.25%. On the other hand, the DMB: V.spp 70:30
and the DMB: V.spp 50:50 akara had each 7.21 and 7.81% protein.
Moi-moi based on the 100% V. spp. or the 100% DMB had varied protein (14.01 and
17.73%). The DMB: V. spp. 70:30 and the DMB: V. spp. 50:50, moi-moi had 1.97 and 2.08%
protein, each. The DSU: V.spp 70: 30 and the DSU: V.spp 50:50 cakes had high and
comparable (38.75 and 38.09) protein.
The fat values for the 100% cowpea or mungbean based pottages were comparable 2.80
and 2.90%, each. Fat values for four (4) akara products differed. The range was from 2.00% to
6.90%. Akara based on DMB: V.spp. 50:50 had the highest fat (6.90%). The akara based on
the 100% DMB had the least fat (2.00%). On the other hand, akara based on the 100% V. spp.
and the DMB V. spp 70:30 had 5.10 and 4.30% fat, each.
Ash values for various products varied (Table 5). pottages based on the 100% mungbean
or cowpea had 2.25% and 1.75% ash, each. Akara based on either the 100% DMB or (V. spp.)
had 2.10% and 1.50% ash, each.
The fibre values for cakes ranged from 0.20 to 6.90%.The SP7: W 70:30 had the highest value
6.90%.The UDSH 100% had the second highest value 5.90%. The 100% WF, the DSU: W

67
50:50 and the F48: W 50:50 blends had 0.80, 1.30 and 1.30% fibre, each. The SP7: W 50:50
and the F48: W 70:30 had 2.90 and 2.40%, each. The moi-moi based on the DMB: W 70:30
had 9.30%. The DMB 100% and the DMB: V.spp 50:50, moi-moi had comparable values 4.70
and 4.20%.The V.spp moi-moi had the least value 1.00%. The akara based on V.spp 100% and
the DMB: V.spp 50:50 had 5.00 and 5.30%, each. The values for the DMB 100% and the DMB:
V.spp 70:30 were low and comparable 4.90 and 4.90%, each. The values for the UDM and the
CP pottages varied 3.90 and 0.30%, each.
The carbohydrate (CHO) values for all the products were low. The range was from
(3.64 to 59.13%). Moi-moi based on 100% V.spp. bean had the least CHO (3.64%). The moi-
moi that contained high proportion of mungbean, DMB: 70:30 had higher value (59.13%)
relative to others. The pottage based on mungbean contained 11.80% CHO.

68
Table 5
Proximate Composition of Cakes, Moi-moi, Akara and Porridges Based on Mungbean,
Cowpea, Vigna specie, Flours and Their Blends (%, dry matter)
Means in the same column with varied superscripts differed (P<0.05).
WF = wheat flour
UDSH = undehulled shade dried mungbean
DSU: W 70:30 = dehulled sun-dried mungbean: wheat flour 70:30 blend
DSU: W 50:50 = dehulled sun-dried mungbean: wheat flour 50:50 blend
SP7: W 70:30 = seven-day sprouted mungbean: wheat flour 70:30 blend
SP7: W 50:50 = seven-day sprouted mungbean: wheat flour 50:50 blend
F48: W 70:30 = 48h fermented mungbean: wheat flour 70:30 blend
F48: W 50:50 = 48h fermented mungbean: wheat flour 50:50 blend
DMB = dehulled mungbean
V.spp. = Vigna specie
DMB: V.spp. 70:30 = dehulled mungbean: V. spp 700:30 blend
DMB: V spp. 50:50 = dehulled mungbean: V. spp.50:50 blend
UDM = Undehulled mungbean
CP = Cowpea
Cake Ratio (%) Moisture Protein Fat Ash Fibre Carbohydrate
WF 100 37.02c 31.74a 10. 00b 2.00b 0.80e 18.01c
UDSH 100 34.40c 7.66c 10.10b 4.80a 5.90b 37.09a
DSU:W 70:30 31.15c 38.75a 8.10c 2.20b 0.20e 19.60c
DSU:W 50:50 42.24b 38.09a 7.90d 2.15b 1.30d 8.32d
SP7:W 70:30 16.45d 28.02b 22.60a 2.00b 6.90a 24.08b
SP7:W 50:50 31.00c 31.08a 3.80f 2.20b 2.90c 29.02b
F48:W 70:30 65.48a 2.85d 6.90e 2.35b 2.40c 20.02b
F48:W 50:50 31.27c 30.43a 6.40e 2.35b 1.30d 28.25b
MOI-MOI:3
V.sp 100 75. 00a 14.01b 3.70a 2.66a 1.00c 3.64d
DMB 100 56.00b 17.73a 3.40a 2.70a 4.70b 15.47c
DMB:V.spp 70:30 24.00c 1.97d 3.40a 1.60b 9.30a 59.13a
DMB:V.spp 50:50 70.00a 2.08c 2.80b 1.65b 4.20b 21.35b
AKARA:
DMB 100 53. 00a 24.08a 2.00d 2.10a 4.10b 14.72c
V.spp 100 51.60a 5.25c 5.10b 1.50b 5.00a 31.53a
DMB:V.spp 70:30 54.10a 7.21b 4.30c 1.90b 4.90b 27.59b
DMB:V.spp 50:50 55.50a 7.81b 6.90a 1.65b 5.30a 30.65a
SOUPS:
UDM 100 68.30a 10.95a 2.80a 2.25a 3.90a 11.80b
CP 100 62.20b 9.85b 2.90a 1.75b 0.30b 32.90a

69
Table 6 Presents four mineral content of cakes, akara, moi-moi and pottages based on
mungbean, wheat flour, cowpea and vigna spp. (sokoto) beans or their blends.
The DSU: W70:30 had the highest iron (Fe) (0.47mg) relative to the others 0.47 vs
0.10 to 0.27%mg (Table 6).
The SP7 mungbean and its blends influenced iron value. The (70:30) mungbean cake
blend had more iron than the 50:50 blend (0.27 and 0.25mg, each). The F48: W (70:30) and
the F48: W50:50) cakes had 0.10 and 0.25mg Fe, each. The DSU: W (70:30) had more Fe
than the DSU: W (50:50) 0.47 and 0.27mg, each. The iron values for the 100% cowpea and
the 100% mungbean pottages differed. Mungbean soup had slight edge in iron relative to the
cowpea soup 0.23 and 0.21mg, each.
The iron values for four akara products differed. The base flours and blends precipitated
the differences. The 100% V. spp. akara had slightly higher iron than the 100% DMB
(0.26mg vs 0.24mg, each). The DMB: V. spp. (70:30) blend had more iron than the 50:50
akara 0.41 and 0.30mg, each. The iron content of four moi-moi products differed. The V.spp.
100% and the DMB 100% had varied and similar (P>0.05) Fe values 0.26 and 0.27mg, each.
The DMB: V. spp. 70:30 moi-moi had higher (P>0.05) (0.42mg) Fe than the DMB: 50:50
moi-moi (0.42 vs 0.27mg). The difference was significant (P<0.05).
The phosphorus (P) values for the cakes varied. The 100% UDSH had more
phosphorus (0.93mg) than the 100% WF (0.74mg). The DSU: W (70:30) cake had more
phosphorus than the DSU: W (50:50) cake (0.93 vs 0.86mg, each). The cakes based on
seven-day sprouted mungbean flour and its various blends (SP7: W70:30 and SP7:W50:50)
had different phosphorus values (0.66 and 0.78mg, each). The F48: W (70:30) and the F48:
W (50:50) cakes had comparable (P>0.05) phosphorus (0.84mg, each).
The two pottages based on the 100% cowpea or the 100% mungbean had comparable
(P>0.05) phosphorus 0.80mg, each. The akara product based on the 100% V. spp. had lower
(0.43mg) phosphorus relative to the DMB (0.76mg). The phosphorus content of akara based
on the (70:30) and the (50:50) blends had 0.76 and 0.85mg each. The akara based on a lower
blend (50:50) had 0.85mg phosphorus relative to the higher blend(70:30) (0.76mg).The moi-
moi products had varied phosphorus, and the values were a function of type of flour and
blends. The 100% V.spp. moi-moi had a lower P (0.51mg) relative to the 100% DMB
(0.63mg).
The DMB: 50:50 moi-moi blend had lower Na (3.30g) than the 70:30 blend (5.96g).
Treatments, source of flours and their various blends controlled the sodium (Na) content of

70
the eleven cakes. The 100% WF and the 100% UDSH cakes had varied Na (6.03 and 3.29g,
respectively). The UDSH had the least Na (3.29g). The DSU: W70:30 blend had higher
sodium (10.23g). However, its counterpart DSU: W 50:50 had a lower value (6.43g) that was
significant (P<0.05).
The SP7: W 70:30 cake blend had 6.62g Na. The SP7: W (50:50) blend cake had a
lower value (6.05mg). On the other hand, the F48: W70:30 and the F48: W (50:50) cake
blends had comparable (P>0.05) values (6.95g). The two pottages based on 100% cowpea
and UDM 100% had 6.02 and 6.09g Na, each. The akara based on the 100% V. spp. bean and
the 100% DMB had each 3.30 and 6.65g Na. The latter, the 100% DMB akara had higher
value 6.65 vs 3.30g Na. The akara based on either the (70:30) or the (50:50) blend had
comparable (P>0.05) values 6.05 and 5.97g Na. The moi-moi based on the 100% V.spp. and
the 100% mungbean had 6.64 and 6.96g Na. The moi-moi based on the (70:30) and the
(50:50) blends had 5.96 and 3.30g Na, respectively. The (50:50) blend had lower Na (3.30g)
as against the (70:30) moi-moi (5.96 vs 3.30g).
The potassium (K) content of cakes, pottages, akara and moi-moi products ranged from
(30.17 to 44.10g). The 100% WF and the 100% DSH cakes had similar (P>0.05) values
(36.00 and 36.01g K, each). The DSU: W (70:30) and the DSU: W (50:50) blends had
different K concentrations. The DSU: W (50:50) blend had more K than the DSU: W (70:30)
blend (40:10 vs 36.05g). The SP7: W (70:30) and the (50:50) blends had established the same
trend as the DSU: W (70:30) and the DSU: W (50:50) cakes. The SP7: W (50:50) blend had
higher (P<0.05) K than the SP7: W (70:30) cake 40.01 and 36.27g K, each. The F48: W (70:
30) and the F48: W (50:50) blends had varied K (40.12 and 44.10g , each).
The pottage based on the 100% cowpea had higher K relative to that of the 100% UDM
(35.96 vs 30.20g). The akara based on the 100%s DMB and the 100% V.spp had comparable
(P>0.05) K (36.08 and 36.23mg, each). On the other hand, the akara based on the (50:50)
blend had more K than the (70:30) blend (40.03 and the 36.20g, each). The moi-moi values
for K varied. The moi-moi based on 100% Vigna spp. bean had lower K relative to the 100%
mungbean (30.27 vs 40.23g, K). The moi-moi based on either the 70:30 or the 50:50 blends
had comparable values 30.17 and 30.18g, K, each.

71
Table 6 Mineral Composition of Products
Product Ratio Iron Phosphorus Sodium Potassium
Samples % mg mg g g
Cakes:
WF 100 0.25b 0.74c 6.03b 36.00b
UDSH 100 0.11c 0.93a 3.29c 36.01b
DSU: W 70:30 0.47a 0.93a 10.23a 36.05b
DSU: W 50:50 0.27b 0.86b 6.43b 40.10a
SP7: W 70:30 0.27b 0.66d 6.62b 36.27b
SP7: W 50:50. 0.25b 0.78c 6.05b 40.01a
F48: W 70:30 0.10c 0.84b 6.95b 40.12a
F48: W 50:50 0.25b 0.84b 6.95b 44.10a
Moi-moi
V.spp 100 0.26b 0.51b 6.64a 30.27b
DMB 100 0.27b 0.63a 6.96a 40.23a
DMB:V.spp 70:30 0.42a 0.52b 5.96b 30.17b
DMB:V.spp 50:50 0.27b 0.56b 3.30c 30.18b
Akara:
DMB 100 0.24c 0.76b 6.65a 36.08b
V.spp 100 0.26c 0.43c 3.30b 36.23b
DMB:V.spp 70:30 0. 41a 0.76b 6.05a 36.20b
DMB:V.spp 50:50 0.30b 0.85a 3.91b 40.03a
Soups:
CP 100 0.21a 0.80 a 6.02a 35.96a
`UDM 100 0.23a 0.08b 6.09a 30.20a
Means in the same column with varied superscript letters differed (P<0.05).
WF = wheat flour
UDSH = undehulled shade-dried mungbean
DSU: W 70:30 = dehulled sun-dried mungbean: wheat flour 70:30 blend
DSU: W 50:50 = dehulled sun-dried mungbean: wheat flour 50:50 blend
SP7: W 70:30 = seven-days sprouted mungbean: wheat flour70:30 blend
SP7: W 50:50 = seven-day sprouted mungbean: wheat flour 50:50 blend
F48: W 70:30 = 48h fermented mungbean: wheat flour 70:30 blend
F48:W 50:50 = 48h fermented mungbean: wheat flour 50:50 blend
DMB = dehulled mungbean: Vigna specie 70:30 blend
DMB: V.spp 50:50 = dehulled mungbean: Vigna specie 50:50 blend
DMB = dehulled mungbean
V.spp = Vigna specie
F48: W = forty-eight hour fermented mungbean: wheat
DSU: W = dehulled sun-dried mungbean: wheat.
UDM = undehulled mungbean

72
Table 7 presents the sensory evaluation of cakes, pottages, akara and moi-moi products
based on mungbean, blackeyed bean (Vigna spp. (sokoto) and cowpea varieties), wheat
flour and their blends.
The cakes based on the 100% UDSH flour had low taste (4.2). The cake based on
the 100% WF had high taste score (8.6). The DSU: W (70.30) and the DSU: W (50:50) had also
comparable taste (6.10 and 6.00). The SP7:W70:30 and the 50:50 blends had varied scores for
taste (3.9 and 4.3). The values were below 50% of the 9–point hedonic scale. The F48: W
(70:30) and the F48: W (50:50) cakes had comparable low (P>0.05) taste scores (4.0 and 4.2).
The pottage based on the 100% cowpea had higher (6.80) taste score than the 100% UDM.
(4.00). The akara based on the DMB: V.spp. (70:30) and the (50:50) ratios had comparable taste
scores (4.80). The akara based on the 100% V. spp. bean and the 100% DMB had varied taste
scores (5.2 and 3.6, each).The moi-moi based on the DMB: V.spp. (70:30) flour had higher and
comparable taste score (6.0) than the DMB: V.spp (50:50) blend (5.8).
The colour for cake based on the 100% UDSH flour was low (3.7). The colour for the
100% WF was much higher (P<0.05) (8.4 vs 3.7). The cakes based on the DSU: W (70:30)
and the DSU: W (50:50) blends had high and comparable colour (6.4 and 6.1, each). The cakes
based on the SP7: W (70:30) and (50:50) had low and comparable colour (3.4 and 3.7, each).
The cakes based on either F48: W (70:30) or the (50: 50) blend had varied average colour
scores (5.2 and 4.1, each).
The pottages based on either the 100% CP or UDM had high colour values 6.2 and 5.1
each. Akara based on the 100% V.spp bean and the 100% DMB had high and low 6.8 and 3.6
colour scores, respectively. Akara based on either the DMB: V.ssp 70:30 or the 50:50 blends
had (5.4 and 6.4), each. The 50:50 blend had an edge over the 70:30 (6.4 vs 5.4) colour
scores.
Moi-moi colour scores were influenced by treatments and ratios of each blend. Moi-
moi based on the 100% V. spp. had 7.2. The moi-moi based on either the DMB: 70:30 or the
50:50 had (6.7 and 7.1) scores. The 50:50 blend had higher value (7.1 vs 6.7).
The flavour for cakes based on the 100% undehulled mungbean flour had slightly
above average value (4.6). The flavour for the 100% wheat flour was 8.2. The DSU: W 70:30
and the 50:50 cakes had 5.5 and 6.0, each. The SP7: W70:30 and the 50:50 blends had similar
values (3.8, each). The F48: W 70:30 and the 50:50 cakes had low and comparable values 3.7
and 3.9, respectively.
The flavour of the pottage based on the 100% cowpea, had higher (7.0) flavour relative to
the 100% mungbean pottage (4.7). However, the latter value was more than 50% of the 9-

73
point hedonic scale. The akara based on the 70:30 and the 50:50 DMB and V.spp
combinations had low and above average values of 4.2 and 5.0, each.
The values for moi-moi differed. Moi-moi based on the 100% DMB had 5.6 score. Moi-moi
based on the 70:30 and the 50:50 blends had 5.8 and 6.0, each.
The texture of the cake based on the 100% UDSH flour was (6.0). The cake based on
the 100% WF had 8.2. The DSU: W 70: 30 and the 50:50 cakes had texture scores of 6.3 and
5.6, each. The SP7: W 70: 30 and the SP7 W 50: 50 had comparable (P>0.05) texture score
(4.0 and 3.9, each).Texture values for cakes based on the F48: W 70:30 and the F48: W50: 50
blends had also similar low (P>0.05) values (4.0 and 4.2, respectively).
The soups based on the 100% CP and the 100% UDM had 6.4 and 5.3 texture scores. The
akara based on the 100% V. spp. and the 100% DMB blends had 5.2 and 3.4 texture scores.
The akara based on the the DMB: V.spp.70:30 and the 50:50 had comparable texture 5.0 and
5.4, each.
The texture for moi-moi based on 100% DMB paste was 4.6. The texture for the 70:30 and the
50:50 DMB: V. spp.moi-moi blends had 5.80 and 6.00, each.
The general acceptability score for the cake based on the UDSH was (3.0). The score for the
cake based on the 100% WF was 8.7. The general acceptability of the cakes based on the
DSU: W 70:30 and the 50:50 blends were 6.8 and 5.9, each. The F48: W 70:30 and the 50:50
blends had the same above average general acceptability score (4.9).The SP7: W 70:30 and the
50:50 blends had slightly below average score (4.3).
The pottages based on the 100% CP and the 100% UDM had varied general
acceptability scores of 6.8 and 4.8, each. Akara based on the 100% V spp. bean and the 100%
DMB paste had general acceptability scores of 5.3 and 3.8, each. The akara based on the
DMB: V.spp (70:30) and the (50:50) paste, had above average general acceptability scores of
4.8 and 5.1, each.
The general acceptability of moi-moi differed. Moi-moi based on the DMB: V.spp (70:30)
and the(50:50) paste had high acceptability (6.3 and 5.4) values.

74
Table7: Sensory Evaluation of Products Based on Mungbean.
Sample Ratio (%) Taste Colour Flavour Texture General
Cakes Acceptability
WF 100 8.6a 8.4a 8.2a 8.2a 8.7a
UDSH 100 4.2c 3.7e 4.6d 6.0b. 3.0e
DSU:W 70:30 6.1b 6.4b 5.5c 6.3b 6.8b
DSU:W 50:50 6.0b 6.1b 6.0b 5.6c 5.9c
SP7:W 70:30 3.9d 3.4e 3.8e 4.0d 4.3d
SP7:W 50:50 4.3c 3.7e 3.8e 3.9e 4.3d
F48:W 70:30 4.0c 4.1d 3.7e 4.0d 4.9d
F48:W 50:50 4.2c 5.2c 3.9e 4.2d 4.9d
Moi – moi
V.spp 100 4.9c 7.2a 5.12b 5.8b 5.4c
DMB 100 4.1c 5.8c 5.6b 4.6c. 9.0a
DMB:V.spp 70:30 6.0a 6.7b 5.8b 5.8b 6.3b
DMB:V.spp 50:50 5.8b 7.1a 6.0a 6.0a 5.4c
Akara
DMB 100 3.6c 3.6c 3.6c 3.4b 3.8c
V.spp 100 5.2a 6.8a 4.5b 5.2a 5.3a
DMB: V.spp 70:30 4.8b 5.4b 4.2b 5.0a 4.8b
DMB: Vspp. 50:50 4.8b 6.4a 5.0a 5.4a 5.1a
Pottage
CP 100 6.8a 6.2a 7.0a 6.4a 6.8a
UDM 100 4.0b 5.1b 4.7b 5.3b 4.8b
Means in the same column with different superscripts differed (P<0.05).
WF = Wheat flour
UDSH = Undehulled shade dried
DSU: W 70:30 = dehulled sundried mungbean: wheat flour 70:30 blend
DSU: W 50:50 = dehulled sundried mungbean: wheat flour 50:50 blend
SP7: W 70:30 = seven-day sprouted mungbean: wheat flour 70:30 blend
SP7:W 50:50 = seven-day sprouted mungbean: wheat flour: 50:50 blend
F48: W 70:30 = 48h fermented mungbean: wheat flour 70:30 blend
F48: W 50:50 = 48h fermented mungbean: wheat flour 50:50 blend
DMB = dehulled mungbean
V. spp. = Vigna spp.
DMB: V.spp 70:30 = dehulled mungbean: Vigna spp.70:30
DMB: V.spp 50:50 = dehulled mungbean: Vigna spp.50:50
CP = cowpea
UDM = undehulled mungbean

75
CHAPTER FIVE
DISCUSSION, CONCLUSION AND RECOMMENDATIONS
Proximate Composition
The higher (P>0.05) protein for the DSH, DSU and the F24 samples (32.44, 32.24 and
32.02%) showed that dehulling and shade-drying , dehulling sun-drying and twenty four hour
fermentation(F24) were better processing methods to improve mungbean protein, and were
comparable to the (31.31%) protein content of dehulled mungbean reported by Oburuoga
(2011). The high phytate content confirms the observation that phytates are associated with
protein bodies in legumes and they increase with increasing protein content (Rddy, 2002). The
difference between the F24 and the F48 sample values, showed the superiority of shorter
fermentation period over longer fermentation time to increase protein in mungbean. The lower
values for the F48, the SP7 and the UDSH were comparable to those obtained by many authors
(Sgarbieri, 1993; Mubarak, 2005; Khalil and Khan, 1995; Akpapunam, 1996) (22.96, 27.50,
23.1 and 23.6%, respectively). Agugo and Onimawo (2009) obtained protein value of 22.90%
in raw mungbean flour.This confirmed that mungbean protein could be comparable to any
animal protein. Bennink (1995) reported that appropriate combinations of beans and cereals,
consumed in adequate amounts, will prevent protein-energy-malnutrition (PEM).
The lower fat for all the samples (Table 1) except for the control and the seven day
sprouted meant that these samples would keep longer without rancidity relative to the two other
samples. Oburuoga (2011) reported fat content of (1.72% vs 1.75%) in dehulled and
undehulled mungbean flours. It is known that the higher the fat content of a food, the lower is
its chance to keep long. Rancidity renders a food undesirable. The lower fat content has health
and nutrition implications as the excesses of protein and carbohydrates in our diets are stored in
the body in form of fat. Secondly, most of the daily diets have fat or oil incorporated in them
during preparation. These fat excesses could result in unhealthy fatty deposits (plague) on the
coronary arteries. Legumes have the lowest fat content of the protein foods (Elliot, 1994).This
was also confirmed by the (1.43%) value observed inraw mungbean by Agugo & Onimawo
(2009).
The lower ash (table 1) for twenty-four hour fermentation (F24) suggested that the
other processing techniques were much more useful to increase ash in mungbean. The higher
(P<0.05) ash values appear to suggest that these processes were able to release ash (mineral)
from their organic complexes in mungbean. The lower value (3.74 to 3.99) were comparable to

76
the 3.30% and 3.32% vs 3.34% recorded by Oburuoga (2011) and Agugo Onimawo (2009) for
undehulled, dehulled, and raw mungbean flours, respectively.
The lower fibre (P<0.05) for the dehulled shade dried relative to the other five
samples showed the inferiority of the dehulled, shade-dried process to extract fibre in
mungbean. Fibre has some nutrition implications. It has been reported to control serum
cholesterol and diabetes mellitus, increases bowel movement and reduces cancer virus survival
(Bennink, 1997; Elliot1994). It also forms dietary bulk that aids reduction of caloric intake and
subsequent obesity by making one feel fuller. The higher dietary fibre for the rest of the
samples meant that these flours would provide adequate fibre to the consumer for the functions
of fibre in the diet. The high fibre would also be very important for many whose disease
conditions need high fibre intake Bruce et al. (2000); Bennink, (1997). It is reported to be very
important in the prevention and treatment of diverticulitis and appropriate combination of
beans and cereals might prevent protein-energy malnutrition (PEM) (Bennink, 1997). Elliot
(1994) reported that legumes have the lowest fat content than any of the protein foods, with
extremely high fibre content. Oburuoga (2011), obtained fibre values of (4.34% vs 3.98%) for
dehulled and undehulled mungbean, respectively. Agugo & Onimawo (2009) reported
relatively higher fibre values of 8.95% vs 7.97% for raw and boiled mungbeans from their
study but stated that other works reported a range of 1.6 to 3.3% fibre values in mungbean.
The low carbohydrate (CHO) values that ranged from 50.57 to 57.05% suggested that
any of the processes could release nearly equal quantities of mungbean in the diet. Higher
carbohydrate values of (63.38% vs 60.00%) were reported for raw mungbean and cowpea
(Agugo & Onimawo (2009); and similar value (53.38%) vs lower value (49.02%) for dehulled
and undehulled mungbean, by Oburuoga (2011).
Mineral composition of mungbean flours.
The general increase in mineral was due to loss of moisture. The higher and
comparable (P>0.05) calcium (84.39 and 81.99mg) for the F24 and the F48 flours relative to
that of the SP7 flour (78.56mg) meant that fermentation had an edge over sprouting to
release calcium from mungbean. Fermentation is known to hydrolyze the bonds among
nutrients, anti nutrients, enzymes and protein to release chelated minerals from organic
compounds of which calcium is one of them. Mubarak (2005) reported a calcium value of
84.0mg /100g dry weight in mungbean. Gittleman (2005) observed that: sprouted seeds have
high enzyme value; lends easily to digestion; are rich in phytochemicals so crucial to liver
detoxification, cancer prevention, immunity and defense against aging; were used by the

77
British on ships in the 18th century to prevent scurvy among their sailors. It had been a state
among the people of Northern China, well known for their virility and youthful appearance
even when they have reached their hundredth birthday.
The comparable (P>0.05) calcium for the control (UDSH) and the dehulled sun-dried flours
showed that dehulling, sun and shade drying mungbean had no advantage over untreated flours.
The higher (P>0.05) iron (Fe) for the F48 (6.32mg) relative to the other flours from
other treatments meant that forty-eight hour fermentation was the most optimum condition to
increase and release Fe from mungbean. This is important because legumes are known to be
the best source of non-heam iron. The control (UDSH), the DSU, F24 and the SP7 values were
comparable (P>0.05). This similarity ranged from 5.74 to 5.97mg. The comparable values
showed that any of the flours regardless of the processing techniques applied, would supply
nearly the same quantity of the nutrient (Fe). Mubarak (2005) reported iron values of
9.7mg/100g on dry weight basis in mungbean. Gittleman (2005) noted that sprouted
mungbeans are incomparable source of vitamins, minerals and other beneficial elements.
The lower sodium (Na) (P<0.05) for the control, UDSH (7.51mg) relative to the other
higher (P<0.05) values have some nutrition implications. The hypertensive and the diabetic
patients who need low sodium foods would accept purchasing the flour to prepare low sodium
finger foods. On the other hand, the highest (9.16mg) sodium content of the twenty-four hour
fermented (F24) flour might be useful to bakery and meat industries. They might need such
flours as preservatives for cakes and meats. The comparable (P>0.05) values for other flours
that ranged from 8.06 to 8.99mg showed that any of the flours could be used in place of the
other. Byrd-Bredbenner, Moe, Beshgetor & Berning (2007) reported that infants also need
sodium in moderation.
Pilot study conducted by the researcher confirmed that fermented samples have longer
shelf life.Thus making it possibly suitable for use as preservative in bakery industry. The
seven-day sprouted (SP7) would be best stored for six months after which it can deteriorate
through infestation by insects.
The differences in zinc were a function of loss of moisture as well as different food
processing techniques. The highest zinc (21.18mg) for the control (UDSH) relative to the
processed values showed that processing of mungbean had no beneficial effect on zinc. The
lower (P<0.05) zinc values for the rest of the samples regardless of treatment showed that most
of the zinc (Zn) content of mungbean leached into the processing media- a commonly observed
phenomenon. The high zinc value for the UDSH suggested that it is a good processing method
for preparing mungbean formula/meals for infants that require high zinc levels for different

78
body functions. Byrd-Bredbenner et al. (2007) reported that refined flour products are poor
sources of zinc.
Anti-nutrients
The lower phytate for the F48 sample than the SP7 showed that fermentation was a better
processing technique to reduce phytate in mungbean. The difference between the values of
the F24 and the F48 samples (Table 3) was an indication that longer fermentation time has an
edge over shorter fermentation time in reducing phytate. This observation is a confirmation of
many previous works (Akpapunam, 1996; Elliot, 1994). The higher values for the DSU, the
F24, and the SP7 samples (Table 3) could inhibit protein, zinc, iron and calcium absorption in
the body. High phytate content could be the reason for the longer cooking time of mungbean
than cowpea pottage, as observed by (Obiakor, 2009), that high phytate content of grains
increases cooking time. Mubarak (2005) reported a phytate value of 5.80mg/g in mungbean.
This is comparable to the high phytate for the rest of the samples ranging from (5.55 to
5.95mg). These values were higher than the safe level of 3.01mg phytate observed by
Heaney, Weaver & Fitzsimons (1991). The higer levels of phytate could be attributed to the
presence of other minerals which the equipment could not detect (Onwuka, 2005). Other
compounds might have been released or existed due to inter laboratory differences.
The lower tannins for the seven-day sprouted (SP7) sample (4.02mg) when regarded as
an anti-nutrient meant that more minerals chelated would be released for increased bio
availability. It is now established that plant phytochemicals, tannins inclusive, lower serum
cholesterol levels and combat atherosclerosis and other heart diseases. The higher value (Table
3) F24 sample than the F48 showed that twenty-four hour was the optimum fermentation time
to increase tannins in mungbean. The tannins levels for all the samples were lower than the safe
level, 150-200mg/100g (0.15-0.2%) observed by Schiavone et al (2007). Pamplona-Rogers
(2005) observed that tannins have astringent, anti-inflamatory, analgesic effects on the skin and
stops small surface hemorrhages (hemostatic action).
The lower values for oxalate content of the DSU, the SP7 samples meant that these
samples would contain more free calcium. It is known that oxalate chelates calcium to make it
much more unavailable. The higher values for the F24 and the F48, respectively, might
increase unbioavailability of calcium and other minerals. However, they have other health
benefits, especially, in the interrelationship among nutrients. Pamplona-Rogers (2005) noted
that as antioxidants, antinutrients combine with iron which behaves like a free radical of intense
oxidizing action and prevents excess of it from harming the intestinal linning and turning into a

79
factor of cancerous degeneration. The values for all the samples are lower than the safe levels,
4-5mg/g or 2mg/day observed by Onwuka (2005). High levels of oxalate are associated with
formation of kidney stones in the body.
The various samples have low values for saponins (Table 3). These values are far below the
safe level, 146mg/100g observed by Schiavone et al (2007). Saponin is known to have great
affinity for cholesterol and cancer virus cell membrane. This intensive affinity for cholesterol is
one of the major health benefits of saponins to react adversely with cancer virus cells to destroy
them, leaving unaffected cells intact. Many studies also provided that saponins improve
learning process and memory retention in experimental animals, has protective actions against
free radicals, and lower the risk of osteoporosis, and has antibiotic effect (Soetan,2008).
However, excessive consumption of foods high in saponins is said to cause inflammation and
leaky guts (Onwuka, 2005).
Functional properties:
The higher water absorption capacity (WAC) for all the samples regardless of the treatment
(52.13 to 56. 37%) is a very important characteristic of flour in bakery industries. It is known
that the higher the water absorption capacity of any flour, the higher is its suitability in bakery
industries. This is because of the interaction of protein with water for properties such as
hydration, swelling, solubility and gelation. High water absorption capacity enables bakers to
add more water to dough to improve handling characteristics (Onimawo and Akubor, 2005).
The higher swelling capacity for the undehulled shade-dried (UDSH), the twenty four
hour (F24) and the forty eight hour (F48) fermented, the seven day sprouted (SP7) samples
(6.42, 6.39, 6.18 and 6.68%.) relative to those of either the dehulled shade-dried or dehulled
sundried (DSH or DSU) samples (5.06 and 5.60%, each) were a function of treatment. Sun
drying as well as dehulling produced heat. The denaturation of protein content of the samples
caused the lower swelling capacity of the flours. It is well documented that foam stability is
adversely affected by protein denaturation (Onimawo & Akubor, 2005). The higher foam
stability for the undehulled, the unfermented and the sprouted samples is easy to explain. These
samples contain native protein known to give higher foam stability than denatured protein.
Basically, foam stability and capacity are used to assess formability of foam dispersion.
The low protein (N) solubility for the dehulled shade-dried or the sun-dried samples
(DSH and DSU) (4.89 and 4.79%) might be attributed to protein denaturation. It is known that
heat decreases protein in legume flours of which mungbean is among. Protein denaturation
precipitates its aggregation. The high values for the fermented, sprouted and undehulled

80
samples showed that they were better domestic food processing techniques to improve protein
solubility in mungbean flour. Many reseachers reported that mungbean had a good potential in
nitrogen solubility, water absorption, fat absorption, gelation capacity, whippability and foam
stability when determined as raw flour, blanched, sprouted and air classified high protein
fraction.
Proximate composition of cakes, moi-moi, akara and pottages based on dehulled,
undehulled, fermented and sprouted mungbean, cowpea, vigna spp. (sokoto) beans and
wheat flours.
The lower moisture (16.45 %) for the cake based on seven day sprouted mungbean
and the wheat combination, (SP7: W) (70:30) meant that the cake would have longer shelf-life
than others. It is known that the higher the moisture contained by a given food, the lower the
keeping quality. When the water activity (aw) of a given food is high, the shelf life would be
low because high aw would promote the growth of pathogenic microflora (Jay, 2005; Fellows,
2009). The moi-moi, akara and pottages contained high moisture except for moi–moi based on
DMB: W 70:30 (24. 0%), as such would be difficult to preserve.
The lower protein (Table 5) for moi-moi based on either DMB: Vigna spp.70:30 or
the DMB: Vigna spp. 50:50 relative to those of Vigna spp.100% or the DMB 100% might be
due to poor mutual supplementation effect between mungbean and Vigna spp. flours. The
relatively higher (P<0.05) protein for all cakes except for those of the F48 and the DSH:
W70:30 (2.85%) suggested that cake is the better source of protein in products based on blends
of mungbean and Vigna spp. flours. The lower protein for akara (5.25,7.21 and 7. 81% based
on the 100% Vigna spp., DMB Vigna spp. (70:30) or (50:50) blends might be due to
denaturation of protein at high temperature during frying in deep hot oil. Many scholars
observed the same in various foods subjected to high temperature frying medium (Enwere,
1998; Obiakor, 2009; Byrd- Bredbenner et al., 2009).
The higher fat for the SP7 and the wheat flour blend SP7: W70:30 (22.60%) might be
that sprouting caused cake to absorb and retain more fat than the other cakes. The comparable
values for ash (Table1) except for the undehulled shade dried mungbean (UDSH) cake showed
that the cakes and baking are good means of availing the consumers the mineral content of
both mungbean and wheat flours.
The high fibre (Table 1) for cakes based on the (SP7: W) (70:30) and (UDSH) was
expected. Husk is where most grains produce and store fibre for protection of the cotyledon
81
.The low fibre for cakes based on the processed (100%) wheat flour (0.80%) and (0.20%) for
the (DSU: W) (70:30) was not a surprise. During processing of wheat, fibre is lost as well as in
mungbean. The 0.3% fibre for cowpea pottage is expected. The fibre might have been lost
through many processing procedures. The high fibre for the 100% UDSH and the SP7 based
cakes might be that much fibre was intact in undehulled husk. Blending did not affect fibre in
SP7: W 70:30 cakes because the ratio of wheat to mungbean flour was small (30:70). The fibre
increase in the moi-moi based on the (DMB:W) (70:30)(9.30%) relative to the DMB 100%
cake (4.70%) suggested that a lower level of wheat flour (30%) to mungbean flour was an
optimum level to obtain maximum mutual supplementation effect between the two flours.
The lower fibre (4.20%) for the DSU: W 50:50 cake relative to the (DSU:W) (70:30)
showed that addition of wheat flour beyond 30% to mungbean flour would decrease the
fibre value from 9.30% to 4.20%. The higher fibre (5.00%) for akara based on the 100% V.
spp. flour relative to that of the 100% mungbean showed that V. spp. flour had an edge over
mungbean as source of fibre in akara (5.00 vs 4.10%). When the proportion of Vigna spp.
flour was increased from 30-50%, there was an increase in fibre content of akara from 4.90 to
5.30% (Table 5). This showed that at higher proportion of Vigna spp. flour to mungbean
flour, there was corresponding increase in fibre. The lower fibre (0.30%) for the 100%
cowpea porridge relative to that of mungbean pottages (3.90%) meant that mungbean is a better
source of fibre in pottage than cowpea.
The higher carbohydrate for the moi-moi based on the DMB: V. spp. 70:30 relative to
those based on the V. spp.100% (3.64%), the DMB 100% (15.47%) and the DMB: V. spp.50:50
(21.35%) demonstrated that when moi-moi consists of 70% mungbean and 30% Vigna spp.
bean flour, carbohydrate would be higher relative to those of the V. spp.100% or the DMB
100% and the DMB: V. spp. 50:50.
The higher CHO for cowpea pottage 100% relative to the UDM 100% pottage, showed that
cowpea was a better source of the nutrient than mungbean. The comparable (P>0.05)
carbohydrate for akara based on the 100% V. spp. flour and the DMB: V. spp.50.50 blends
suggested that any of the blends could equally supply the same nutrient in akara product. The
least carbohydrate for the 100% DMB relative to the DMB: V. spp. (70:30) blend and DMB: V.
spp. (50:50) showed that a higher proportion of V. spp. flour to mungbean flour would be a
better means of increasing carbohydrate in the product. Many research works had proved that
nutrients improve or increase with food complementation. The higher carbohydrate for the cake
based on the 100% UDSH flour relative to the the 100% WF or the (DSU: W 70:30) appeared
to suggest that both treatments (undehulling and shade-drying) might have controlled or

82
contributed to the higher CHO. The SP7:W50:50 higher carbohydrate relative to the (SP7: W
70:30) was due to increase in proportion of wheat flour to mungbean flour (50:50). Wheat, a
cereal has more carbohydrate than mungbean, a legume. The same explanation applies to the
higher carbohydrate value for the cake based on the F48: W 50:50 relative to the for F48:W
70:30 cake.
Mineral composition of products
Iron (Fe)
The higher (0.47) Fe for the cake based on the DSU: W 70:30 mungbean and wheat flour
blends is easy to explain. Anti-nutrients that chelate divalent minerals were removed from
the hulls and sank into dehulling medium to release more free Fe for higher bio availability.
The lower (0.11mg) Fe for the cake based on the undehulled shade dried mungbean flour might
be associated with high anti-nutrients inherent in unprocessed cereals and legumes
(Akpapunam, 1996; Obizoba & Atii, 1991; Brune,1992).
The higher Fe (0.47mg) for the DSU: W70:30 blend relative to the DSU: W50:50
cake (0.27mg) might be due to higher mutual supplementation effect of the 70:30 blend. The
comparable iron (0.27 and 0.25mg) for the cakes on a-seven day sprouted mungbean and wheat
flour blend might be that neither the 70% nor the 50% proportion had an edge over the other
blends. The higher Fe (0.25mg) for the cake based on the F48: W50:50 blend relative to the
F48:W70:30 blend (0.10mg) might be because at lower proportion 50:50, there was much more
mutual supplementation effect between mungbean and wheat flours. The slightly higher
(0.23mg) Fe for the pottage based on mungbean appeared to indicate that mungbean is a better
source of the nutrient than cowpea (C).
The higher (0.41mg) Fe for akara based on the DMB: V. spp.70:30 blend relative to a lower
value (0.30mg), for the (DMB: V. spp.) (50:50) suggested that there might be a better mutual
supplementation effect at higher ratio of mungbean (70:30). The higher (0.42mg) Fe for the
moi-moi based on the DMB: V. spp.70:30 blend meant that at this proportion Fe would be
much more available relative to the other proportions.
The lower phosphorus (P) (0.74mg) for the cakes based on the 100% wheat flour suggested that
the cakes based on the 100% dehulled shade-dried or any other mixtures based on mungbean
flour was a better source of the nutrient (P) (Table 6). The higher P. (0.78mg) for the cake
based on the (SP7: W 50:50) blend showed that the proportion (50:50) provided P. much more
than at a higher proportion. The comparable (P>0.05) P. (0.84mg) for the cakes based on either
the F48: W70:30 or the 50:50 blend showed that they had no advantage over each other
83
(P>0.05). The similarity in phosphorus (0.80mg) for the cakes based on either the 100% wheat
or the 100% mungbean flour (0.99mg) appeared to suggest that under optimal conditions the
two foods would be a good source of phosphorus.
The higher P. (0.85mg) for the akara based on a lower ratio (50:50) relative to the higher ratio
(70:30) showed that at 50:50 proportions, phosphorus would be much more available. The
higher phosphorus (P) (0.63mg) for the moi-moi based on the 100% mungbean relative to the
100% Vigna spp. is indicative that mungbean is a better source of phosphorus than the 100%
Vigna spp. Some of the P. in Vigna spp. might have been chelated by tannins or phytate – a
commonly known factor that militates against phosphorus utilization in foods.
The least sodium (Na) (3.29mg) of the cake based on the 100% UDSH relative to
those of the 100% wheat flour might be that Na is much more available in the wheat. The much
more sodium (Na) (10.23mg) for the cake based on the DSU: W 70:30 showed that at higher
proportion of mungbean to wheat flours, Na would be much more available.
The higher Na for the cakes based on the SP7: W 70:30 blend relative to the lower
SP7: W 50:50 suggested that the nutrient would be much more at higher proportion 70:30
than at lower proportion 50:50 (6.62 vs 6.05mg). The similarity in Na (6.95mg) for the F48:
W 70:30 and the F48: W 50:50 showed that any of the mixtures would supply equal Na in
cake. The comparable (P>0.05) Na (6.02 and 6.09mg) for pottage based on the 100% cowpea
or the 100% mungbean showed that either of the foods could equally supply the nutrient in
cakes. The lower sodium (6.05mg) for the akara based on the DMB: V. spp. 70:30 than the
DMB: V. spp. 50:50 blend indicated that it would be good for patients on low Na food (diet).
The lower Na (93.30mg) for the moi-moi, based on the DMB: V. spp.50:50 meant that it
would be suitable for patients that need low Na intake.
The comparable Na for the moi-moi based on either the 100% V. spp. or the 100% DMB
flour meant that any of them could supply equal amount of Na (6.64 and 6.96mg).
The high potassium (K) (Table 6) content of all the products based on blends of wheat
and mungbean flours suggested that they are good sources of the nutrient regardless of the
treatments and combinations. Potassium works in combination with sodium in the
intracellular fluid, to regulate the osmotic pressure and maintain proper water balance within
the body. Potassium is needed for cardiovascular function and a healthy nervous system. It
blunts the effects of high salt intake and help keeps blood pressure normal; suppresses the
rennin-angiotensin system and promotes the excretion of excess sodium and water from the
body (Byrd-Bredbenner et al, 2007).

84
Sensory evaluation:
The high scores for taste, colour, flavor, texture and general acceptability for the cakes based
the on 100% wheat (8.2 to 8.7) was not a surprise. The judges were much more familiar with
the qualities of the cake based on wheat. It is known that wheat flours are highly processed into
bright or clear colour that has long been accepted by the populace relative to many samples of
varied processed mungbean flours in their original colour as well as with husks and fibre intact.
Mungbean and their husk flours were never used to prepare and consume regular finger foods
(cakes, akara and moi-moi products). Based on these, they rated the products poorly (Table 7).
The high taste, colour, flavour, texture and general acceptability for the pottages based on
cowpea (6.8, 6.2, 7.0, 6.4, 6.8, respectively) was expected. The judges were familiar with the
product. The treatments given the mungbean and ratios of the blends contributed to the quality
and level of acceptance or rejection of the products. The SP7: W 70:30 and the 50: 50; the F48:
W70:30 and the 50:50 had poor flavour that caused low scores for taste, colour, texture, flavour
and general acceptability. The flavour scores (3.8, 3.8, 3.7, 3.9, respectively) were for cakes
based on the above blends.
However, the DSU mungbean and its blends of the wheat 70:30 and 50:50 had high
scores for all the cake qualities ranging from 5.5 to 6.8. The rejected samples had low scores in
the various attributes measured, and also scored below the 4.5 average value for acceptance.

85
CONCLUSION
Six mungbean flours, and products (cakes, akara, moi-moi) made from their blends with
wheat, and Vigna specie flour; and pottages from whole mundbean and cowpea were prepared,
using domestic food processing methods (soaking, dehulling, fermenting, sprouting, sun and
shade drying, and cooking).
Though all the protein values were high, the DSH, DSU, and F48 flour samples yielded higher
values than the rest. The DSU: W 70:30 and 50:50 cake blends had the highest protein,
followed by the WF 100%, the SP7: W 50:50, the F48: W 50:50 and the SP7: W 70:30 blends.
The F48: W 70:30 cake blend had the lowest protein of all the products. All the treated flour
samples had lower fat values than the control. The SP7: W70:30 cake had the highest while the
DMB 100% akara had the lowest fat content of the products. The SP7 and DSU flour samples
had high ash values, the UDSH, DSH, and the fermented samples had comparable but slightly
lower values than the control. The DSH 100% cake and the V.spp.100% akara, respectively,
had the highest and the lowest ash contents of all the products. The DSH flour had the lowest
fibre content but the other techniques released higher and similar fibre values as the control
sample. The DMB: V.spp.70:30 moi-moi had the highest fibre content while the DSU: W
70:30, the WF 100% cakes and the cowpea pottage had similar but very lower values.
The CHO content of the flours was moderate 50.57-57.05% and would be good for all age
groups. All the products were very low in CHO content, except for the DMB: V.spp. 70:30
that had an appreciable moderate value. Moisture content of the products were high, the
100% V.spp. moi-moi had the highest while the SP7: W 70:30 cake blend had the least value.
Very high calcium values were obtained from all the processed flour samples; the
UDSH samlpe had the highest zinc score; the F48 flour had the highest iron; thus, they would
be beneficial to growing children, and for controlling micro nutrient deficiency in infants. All
the processing techniques increased sodium in the flours samples. The mineral content of the
products showed poor mutual supplementation effect in the blends, however the inter
relationship among the nutrients, calcium, sodium, and potassium is good enough. None will
impair the absorption of the other. The iron and phosphorus contents were too low. The DSU:
W 70:30 blend had the highest sodium, the DSU: W 50:50, the F48:W 70:30 and 50:50, the
SP7:W 50:50 cakes; and the DMB: V.spp. 50:50 moi-moi blends had higher potassium than
the rest of the products. Conversely, the 100% UDSH cake, the 100% V.spp. and the DMB:
V.spp. 50:50 akara had lower sodium values; the DMB: V.spp. 50:50 and 70:30 moi-moi and
the UDM pottage had the lowest potassium content of all the products.

86
The various treatments precipitated significantly lower oxalate, tannins, and saponins
than their various recommended safe level, hence, they will function as phytochemicals
without any deleterious effect on the consumers. Phytate values for the processed samples
were higher than the control and the recommended safe level.
All the treatments released high and comparable WAC while fermentation and
germination processes increased the swelling capacity and protein solubility in mungbean
flours more than other processes, thus, indicated the suitability of the flours for use in bakery
industries.
The undehulled, the fermented and germinated mungbean flour products had poor
colour, flavour, taste and texture that contributed to their low general acceptability. Dehulling,
sun and shade drying methods produced good colour, flavour and taste in mungbean products
relative to other processes, resulting in their high general acceptability scores. This indicated
their suitability for use as wheat substitutes in baking. Mungbean pottage had below average
taste score. The other sensory parameters scored above average and indicated that mungbean
pottage would be equally accepted as that of cowpea, when consumers become familiar with it.
Thus the domestic food processing methods proved to be very useful for reducing
antinutrients, increasing nutrients, functional and organoleptic attributes of mungbean products.
RECOMMENDATIONS
Based on the results, the researcher hereby recommends the following:
• Adequate sensitization of the masses on the nutrient potentials and other properties of
mungbean and its products should be embarked upon by government and agricultural
institutions.
Individuals, families, nutritionists, dieticians, farmers etc. should apply the domestic food
processing methods in their daily preparation of mungbean seeds and other legumes to
decrease anti-nutritional factors, release and increase nutrients and bioavailability.
• Bakers and other food production and packaging industries should incorporate
mungbean flours in their products to boost their nutritional qualities and enhance good
health.
• Nigerian citizens are hereby adviced to purchase, process well, cook and eat mungbean
daily, to remain in good health.

87
• Natural means of improving the colours, taste and flavour of the undehulled, the
fermented, and the sprouted samples is important, since they were very high in nutrient
content
SUGGESTIONS FOR FUTHER STUDIES
The following suggestions for futher studies are deemed necessary:
• The flour extracts could be tried as therapeutic remedies for some diseases.
• The nutrient potentials of mungbean should be publicized and much detailed work is
needed prior to its industrial production.
• Extensive research is needed to investigate various micronutrient content of
mungbean and their effects on various blood constituents of healthy rats.
88
REFERENCES
Adebowale, Y. A., Adeyemi I. A., & Oshodi, A. A. (2005). Functional and Physico
Chemical Properties of Six Mucuna species. African Journal of Biotechnology, 4 (12):
1461-1468.
Adeyeye, E.I., & Aye, P. A. (1998).The effect of sample preparation on proximate
composition and functional properties of African yam bean flours.Note 1 La Rivast
Italiana Delta Sostanza Grasse, LXXV- Maggio, p 253-261.
Agugo, U.A. & Onimawo, I. A. Effects of Heat Treatment on the Nutritional Value of
Mungbean (Vigna radiata). Nigerian Journal of Nutritional Sciences; 2009: 30, pp 12-
16.
Akiyama, T., & Ogwara H. (1991). Use and specificity of genistein as inhibitors of protein
tyrosine kinase, Methods of Enzymology,201,362-370.
Akpapunam, M. (1996). Mungbean (Vigna radiata (L.)Wilczek). Legumes and oilseeds in
Nutrition. Chapman and Hall company Incorporated, New York Pp 209-213.
A.O.A.C. (1995). Official Methods of Analysis, Association of Official Analytical Chemists,
16th ed. Washington D.C.: Association of Official Analytical Chemists.
A.O.A.C. (2000).Official Methods of Analysis, Association of Official Analytical Chemists,
17th ed. Washington D.C.: Association of Official Analytical Chemists.
Atkins (1997). New Diet Revolution. New York, USA: Avon Books INC.
B.B.C. English Dictionary (1992), Nigeria, Africana Fep. Publishers.
Bennink, M.(1995). Eat Beans For Good Health. Science and Human Nutrition, Michigan
University. Retrieved from http://www.michiganbean.org/research.html.
Broughton, W.J., Hernandez, P., & Vanderleyden, J. (2003). Beans (Phaseolus spp.)
Model Food Legumes, Pp55. Adapted from FAO. Plant & soil, Netherlands:
Kluwer Academic Publishers.
Bruce, B., sSpiller, G.A., klevay L.M. & Gallagher S.K. (2002). A diet high in whole and
unrefined foods favourably alters lipids, antioxidant defenses and colon functions.
Journal of American College of Nutrition, 19(1): 61-67.
Brune, M. (1992). Iron absorption from bread in humans: inhibiting effects of cereal fibre,
phytate and inositol phosphate with different number of phosphate groups. Journal of
Nutrition, 122, 442-449.
Byrd-BredBenner, C., Moe, G., Beshgetor, D. & Berning J.(2009). Wardlaw’s Pespective in
Nutrition. 8th Edition, New York, Mc Graw-Hill Co. Inc

89
Campbell, J. B. (1995). Saponins-Adjuvants: theory and Practical Applications,
DES Stewart-Tull, chapter 4, (In press). New York, Heineman Inc.
Chandra, S. & Samsher (1991). Assessment of Functional properties of different
flours.Academic journals, 8 (38). 4849-4852, 3rd October, 2013. http://www Academic
journal org/AJAR. Chauhan, V. S. & Sharma A, (2010), Department of food and
Technology,
Guru Jambeshwar University. Pp 1-2, India c/o Dr. Phool Sing, 1101, Housing Board Colony,
Sector 15- A, Hisar -125001. Cheeke, P.R. (2000). Actual potential applications of
Yucca schidigera and Quillaja Saponaria Saponins in human and animal nutrition.
American Society of Animal Science, 97331, 1-6.
Clarke J., Santos-moore, A., Stevenson, L.E., & Frankellon, A. R. (1996). Effects of Tyrosine
Kinase on the proliferation of human breast cancer lines and proteins in the RAS
signaling pathway. International Journal on Cancer, 65, 186-191.
Constantinou, A. & Huberman E. (1995). Genistein as an inducer of tumour cell
differenciation. Possible mechanism of action. Proceedings Society ofexperimental
Biological Medicine, 208,109-115.
Consumer Guide (1992). Cholesterol Counter Guide. USA: Publications International Ltd.,
92-93.
Dement, M. W., Young, M. M. & Sensening R. L. (2003). Providing micronutrientThrough
Food-base solutions: A Key to Human and National Society for Nutritional Sciences,
00223166/0353; 00@ 2003.
Elkowiez, K. & Sosulki, F. W. (1992). Anti-nutritional factor in eleven legumes and their
air- classified protein and starch fractions. Journal of Food Science, 47, 1301-1304.
Elemo,G.N., Elemo,B.O., Mordi, J.I., Balogun, A.M. and Olakanpo, A.O. (2013). Nutrient
and Antinutrient Composition of Some Nigerian Leafy Vegetables, Nigerian Jounal of
Nutrional Sciences, 34, pp 26-29. [[[
Elliot, R. (1994). The Bean Book.2nd ed., Great Britain: Haper Collins Manufacturing
Glasgow.
Enwere, N. J. (1995). Foods of Plant Origin. Afro-obis Publication Ltd.,
Nsukka Nigeria, p 24 to-182.
FAO/ WHO (1996). Food Fermentation: a safety and nutritional assessment.

90
Joint FAO/WHO Workshop on assessment of fermentation as a household technology for
improving food safety. Bulletin of World Health Organization ,74, 53-559.
Fellows, J. P (2009). Food Processing Technology, Principles and Practice. 2nd ed. Nigeria:
Honey Land Resources Ltd.
Gittleman, A. I. (2005). The Fast track one-day detox diet. New York: Morgan Road Books.
Gomez, M. I., & Gupta, S. C. (1993). Encyclopaedia of Food Science, Food Technology
& Nutrition 5. New York: Academic Press.
Heaney, Weaver & Fitzsimmons (1991). Soybean phytate content effects on calcium
absorption. American Journal of Clinical Nutrition, 53, 745-755.
Huong, N. T., Matsumoto, k., Kasaim R., Yamasaki, K., & Watanabe, L. T. (1998). Effects
Of in-vitro anti-oxidant activity of Vietnamese Ginseng saponins and its
components, Biological and pharmaceutical Bulletin, 21(9): 973-981.
Jay, J. M. (2005). Modern food micro biology, 4th edition. New York: Chapman & Hall, Inc.
Kataki, P. K. (ed). The Rice-Wheat Cropping System of South-Asia: Trenas, constraints,
Productivity and Policy. New York: Food Products Press.
Kaur, M., Singh, N. (2006). Relationships between selected properties of seeds, flours, and
starches from different Chickpea cultivars. International Journal of Food Production, 9,
597-608.
Koratkar, R. & Rao, A. V. (1997). Effects of Soyabean saponins on azoxymethane-induced
Preneo-plastic lessions in the colon of Mice. Nutrition and cancer, 27, 206-209.
Kuo, S. M. (1996). Anti-proliferative potency of structurally distinct dietary flavonoids on
human colon cancer cells. Cancer Lett, 1104, 41-48.
Kuo, S. M., Morehouse, H. F,. & Lin, C. P. (1997). Effects of antiproliferative Flavonoids
On Ascorbic acid accumulation in human colon adenocarcinoma cells. Cancer Lett,
16, 13-137.
Kule, E., Neckers, l., Takimoto, C., Curt, G., & Bergan, R. (1997). Genistein-induced
apoptoisi Prosrate Cancer cells is preceeded by a specific decrease in focal adhesion
Kinase activity. Molecular pharmacology, 51, 193-200.
Lestienne, I., Verniere, C. I., Mouquet, C., Picq, C. & Treche, S. (2005). Effects of soaking
Whole cereal and legume seeds on iron, zinc and phytate content. Journal of Food
Chemistry, 89, 421-425.Longman dictionary of contemporary English (2003). Denmark
England: Pearson Education limited - Publication Data.

91
Marhuenda, E., Marbin, M. J. & Delacastra, C. A. (1993). Anti-ulcerogenic activity of
quillaja Saponin. In different rat experimental models. Phytotherapy Respiration,7, 13-
17.
Messina, M. J. (1999). Legumes and soyabeans : Overview of their nutritional profiles and
health effects. American journal of Clinical Nutrition, 70 (3), 439-450.
Mubarak, A. E. (2005). Nutritional composition and anti-nutritional factors of mungbean
seeds (phaseolus aureus) as affected by some traditional processes. Journal of Food
Chemistry, 89, 489-495. Naik, H. R., Lehr, J. E. & Pienta, K. J. (1994) Anticancer
Research 14, 2617-2620.
NAS (1997). Tropical legumes: resources for the future. National Academy of Sciences.
Washington D. C.USA, Pp 331.
Nnam, N. M. (1994). Nutritional and organoleptic evaluation of fermented products and
composite flours developed from plant foods. Ph.D. Thesis, Department of Home
Science, Nutrition & Dietetics, University of Nigeria, Nsukka.
Nwokeocha, I. N. (2012). Challenges of Enhancing the Provision of Nutritionally Adequate
Meals in Hospitality Indusries in Nigeria. Nigerian Jounal of Nutritional Sciences, 34,
pp 31-35.
Oakenfull, D. G. and Sidhu, G. S. (1990) Saponins: a useful treatment for hypo-
cholesterolemia. European Journal of Clinical Nutrition, 44, 79-88.
Obiakor, P.N. (2009). Effects of food processing techniques on chemical, functional and
Microbial properties of two varieties of Lima beans and Maize flours and sensory
properties of their products. Ph. D Thesis, Department of Home Science, Nutrition And
Dietetics, University of Nigeria, Nsukka.
Obizoba, I. C. (1991). Effects of sprouting on the nitrogenous constituents and mineral
composition of pigeon pea (cajanus cajan) seeds. Plant Foods for human Nutrition, 41,
21-26.
Obizoba, I. C. & Attii, J. V. (1991). Effects of soaking, sprouting, fermentation and cooking
on nutrient composition and some antinutritional factors of sorghum (Guinesia) seeds.
Plant Foods for Human Nutrition, 41, 203-212.
Oburuoga, A. C. (2011). Proximate Analysis, Sensory and Biological Evaluation of
Mungbean, Acha, and Crayfish Flours and Blends in Adult Rats. The Department of
Human Nutrition and Dietetics, Michael Okpara University of Agriculture, Umudike.
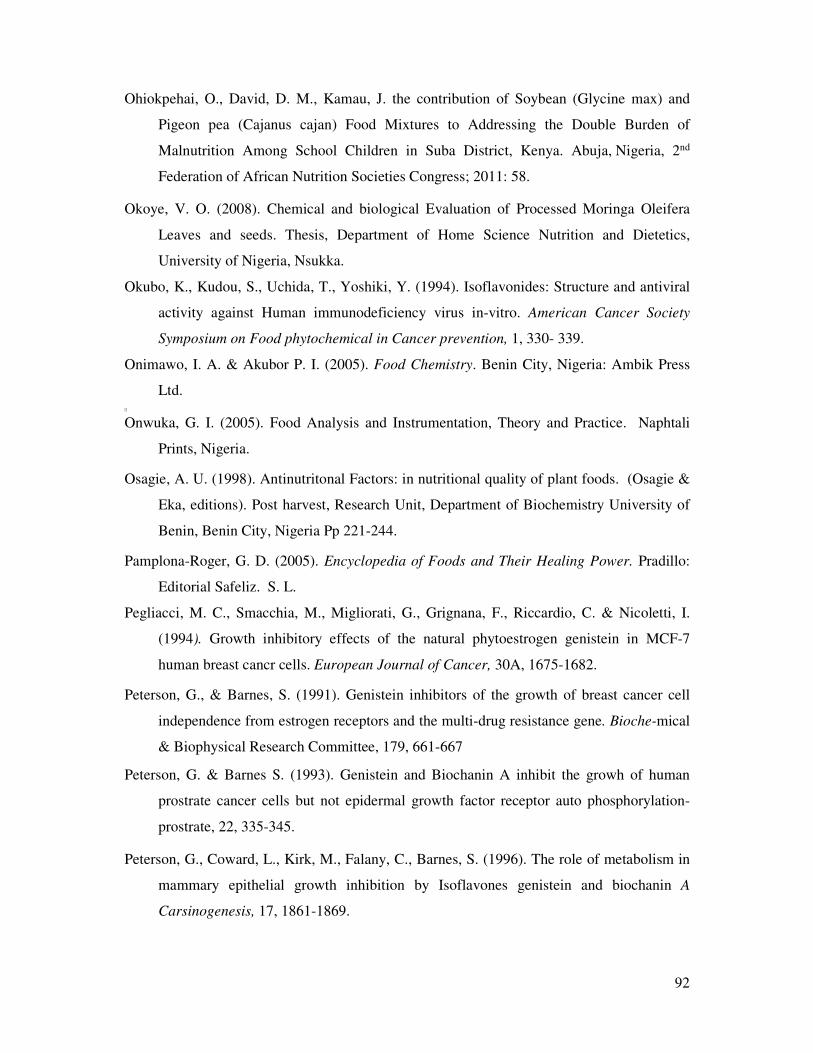
92
Ohiokpehai, O., David, D. M., Kamau, J. the contribution of Soybean (Glycine max) and
Pigeon pea (Cajanus cajan) Food Mixtures to Addressing the Double Burden of
Malnutrition Among School Children in Suba District, Kenya. Abuja, Nigeria, 2nd
Federation of African Nutrition Societies Congress; 2011: 58.
Okoye, V. O. (2008). Chemical and biological Evaluation of Processed Moringa Oleifera
Leaves and seeds. Thesis, Department of Home Science Nutrition and Dietetics,
University of Nigeria, Nsukka.
Okubo, K., Kudou, S., Uchida, T., Yoshiki, Y. (1994). Isoflavonides: Structure and antiviral
activity against Human immunodeficiency virus in-vitro. American Cancer Society
Symposium on Food phytochemical in Cancer prevention, 1, 330- 339.
Onimawo, I. A. & Akubor P. I. (2005). Food Chemistry. Benin City, Nigeria: Ambik Press
Ltd. [[
Onwuka, G. I. (2005). Food Analysis and Instrumentation, Theory and Practice. Naphtali
Prints, Nigeria.
Osagie, A. U. (1998). Antinutritonal Factors: in nutritional quality of plant foods. (Osagie &
Eka, editions). Post harvest, Research Unit, Department of Biochemistry University of
Benin, Benin City, Nigeria Pp 221-244.
Pamplona-Roger, G. D. (2005). Encyclopedia of Foods and Their Healing Power. Pradillo:
Editorial Safeliz. S. L.
Pegliacci, M. C., Smacchia, M., Migliorati, G., Grignana, F., Riccardio, C. & Nicoletti, I.
(1994). Growth inhibitory effects of the natural phytoestrogen genistein in MCF-7
human breast cancr cells. European Journal of Cancer, 30A, 1675-1682.
Peterson, G., & Barnes, S. (1991). Genistein inhibitors of the growth of breast cancer cell
independence from estrogen receptors and the multi-drug resistance gene. Bioche-mical
& Biophysical Research Committee, 179, 661-667
Peterson, G. & Barnes S. (1993). Genistein and Biochanin A inhibit the growh of human
prostrate cancer cells but not epidermal growth factor receptor auto phosphorylation-
prostrate, 22, 335-345.
Peterson, G., Coward, L., Kirk, M., Falany, C., Barnes, S. (1996). The role of metabolism in
mammary epithelial growth inhibition by Isoflavones genistein and biochanin A
Carsinogenesis, 17, 1861-1869.

93
Rauth, S., Kichia, J., & Green, A. (1997). Inhibition of growth and induction of
differentiation of metastatic melanoma cells in-vitro by genitein: chemosensitivity is
regulated by cellular protein, 53. British Journal of Cancer, 75, 2559-1566
Reddy, N. R. (2002). Occurrence, distribution, content and dietary intake of phytate: Food
phytates. CRC Press London. Pp 25-52.
Saddiq, M., Ravi R., Dolan, K. D., Butt, M. S. (2009). Effect of deffated maize germ addition
on the functional and textural properties of wheat flour. International Journal of food
Processing, 9, 597-608.
Santibanez, H. F., Navarro, A. & Martinez, J. (1997). Genistein inhibits proliferation and in-
vitro invasive potential of human prostatic cancer cell lines. Anticancer research,17,
1199-1204.
Schiavone, A., Guo, K., Tassone, G., Gasco, L., Hermandez, E., Denti, R. I. & Zeceoiate, I.
(2007). Effects of a natural extract of chestnut wood on digestibility, performance traits
and nitrogen balance of broiler chicks. Poultry Science, 87, 521-527.
Scholar, E. M. & Toewa, M. L. (1994). Inhibition of murine mammary carcinoma cells by
The tyrosine kinase inhibitor genistein. Cancer lecture, 87,159-162.
Schopke, T. H. & Hiller, K. (1990). Triterpenoid weight-loss Diet. New York: Dell
Publishing company Inc.
Sgarbieri, V. C. (1993). Legumes: Encyclopaedia of Food Science, Food Technology and
Nutrition, 4, 2726-2730. London: Academic Press.
Singh, U. (2001). Functional properties of grain legume flours. Journal of Food Science and
Technology, 38, 191-199.
Soetan, K. O. (2008). Pharmacological and other beneficial effects of antinutritional factor in
plants-A review. African Journal of Biotechnology, 7 (25), 4713-4721. Retrieved Dec.,
2008 from http://www. academic journals org./AJB.
Steel, R. G. D., & Torrie, J. H. (1960). Principles and Procedures of Statistics. New York:
McGraw Hills Book Company Incorporated
Savage King, F. & Burgess, A. (1992). Nutrition For Developing Countries. Great Britain,
Oxford University Press 2nd ed.: pp 22, 57-64.
Temple, V. J., & Bassa, J. D. (1991). Proximate, chemical composition of ‘acha’ (Digitalia
exilis) grain. Journal of Science, Food and Agriculture, 56, 561-563.

94
Triebold, H. & Aarand, l. (1973). Food Composition and Analysis. New York: Van
NostrandReinhold Company.
Vaintraub, I. A. & Lapteva, N. A. (1988). Colorimetric determination of phytate in unpurified
Extracts of seeds and the products of their processing. Analytical Biochemistry, 175,
227-230.
Wakabayashi, C., Hasegawara, H., Murata, T., Ichiyama, M. & Saiki, I. (1997). Expression
of In-vitro antimetastatic effect on ginseng profopanaxtriol is mediated by their
Intestinal Bacteria Metabolites after oral Administration. Chemical Abstract, 129 (7),
44.
Whitney, E. and Rolfes, S. R. (2008). Understanding Nutrition, International Students
Edition. 11th ed. Thomson and Wadsworth, England. Pp. 125-126,195.
Yamaguchi, A. (1993). Antidiabetic containing acqueous extract of piltosporum Plants.
Japan, kokai, Tokyo, koho Japan: 05, 271, 086: Chemistry Abstract, 129.
Yoshiki, Y. & Okubor, K. (1995). Active oxygen scavenging Activity of DDMP (213
Dihydro-2, 5 dihydroxy-6 methyl-4H-Pyran-4-one) Saponins in soyabean seed.
Bioscience, Biotechnology, Biochemistry, 59 (8): 1557- 1559.
You, J., Wang, X. Yan, Y., Jin, F. & Huang B. (1993). Effects of active constituents of
Chinese herbal medicine on HMG- GA Reductase. Abstract, 120 (7): 70.
Zava, D. T. & Duwe, G. (1997). Estrogenic and anti-proliferative properties of Genistein and
Other flavonoids in human breast cancer cells in-vitro. Nutrition and Cancer, 27, 31-
40.

95
APPENDICES
Appendix 1
Abbreviations and Meanings
F24 = mungbean fermented for 24 hours and dried
F48 = mungbean fermented for 48 hours and dried.
DSH = mungbean dehulled and shade-dried.
DSU = mungbean dehulled and sun-dried.
UDSH = mungbean undehulled and shade-dried (control).
SP7 = mungbean sprouted for seven days and dried.
SD = )2/N
N-1
SEM = SD
Calculation of moisture content
Sample F24 F48 DSH DSU UDSH SP7
1 12.12 11.56 12.333 12.06 12.17 11.76
2 12.13 11.56 11.35 12.63 12.18 11.75
3 13.15 12.58 13.37 12.45 13.20 12.78
∑x 37.40 35.68 38.05 38.14 37.55 36.29
12.46 11.89 12.68 12.71 12.51 12.09
∑ 466.94 425.05 483.29 485.86 470.69 439.67
(∑x)2/N 466.29 424.35 482.60 484.88 470.00 438.98
SD 0.58 0.59 0.58 0.70 0.58 0.58
SEM 0.33 0.34 0.33 0.40 0.33 0.33
SD =
SEM = SD÷

96
Appendix 1b
Protein calculation
Sample F24 F48 DSH DSU UDSH SP7
1 28.01 22.59 28.32 28.15 22.93 22.56
2 28.02 22.90 28.33 28.13 22.94 22.57
3 29.05 23.87 29.35 29.34 23.96 23.59
∑ 84.09 68.68 85.00 84.42 68.83 67.72
28.03 22.89 28.33 28.14 22.94 22.59
∑x2 2414.14 1619.60 2465.62 2442.84 1626.10 1574.38
(∑x)2/N 2357.04 1572.77 24078.33 2375.54 1579.18 1528.66
SD 5.34 4.84 1.9 5.79 4.84 4.78
SEM 3.08 2.79 1.09 3.34 2.79 2.72
Fat calculation (1c)
F24 F48 DSH DSU UDSH SP7
1 1.78 1.69 1.81 1.75 1.98 1.93
2 1.77 1.71 1.82 1.79 1.95 1.93
3 1.25 1.19 1.30 1.47 1.43 1.61
∑x 4.60 4.59 4.93 5.01 5.36 5.67
X 1.53 1.53 1.64 1.67 1.78 1.89
∑x2 7.85 8.85 8.27 8.41 9.88 10.03
(∑x)2/N 7.05 7.02 8.10 8.36 9.64 9.97
SD 0.63 0.95 0.28 0.14 0.26 0.17
SEM 0.36 0.54 0.16 0.08 0.15 0.09

97
Calculation of ash (1d)
F24 F48 DSH DSU UDSH SP27
1 3.24 3.47 3.76 3.66 3.56 3.93
2 3.27 3.44 3.74 3.68 3.53 3.92
3 3.30 3.26 2.95 3.85 3.38 3.75
∑x 9.81 10.17 10.43 11.19 10.47 11.60
X 3.27 3.39 3.48 3.73 3.49 3.88
∑x2 32.07 34.49 36.81 41.75 38.67 45.86
(∑x)2/N 32.01 34.47 36.40 41.73 36.54 44.85
SD 1.73 0.1 0.44 0.1 1.03 0.7
SEM 1.00 0.57 0.25 0.57 0.59 0.4
Carbohydrate calculation (1e)
Sample F24 F48 DSH DSU UDSH SP7
1 44.31 50.26 44.47 44.46 48.51 49.42
2 44.32 50.35 44.45 43.82 48.59 49.42
3 44.20 50.20 44.23 44.40 48.55 50.12
∑X 132.82 150.81 133.15 132.68 135.65 148.96
X 44.27 50.27 44.38 44.22 45.21 49.65
∑X2 5881.27 7581.22 5909.67 5868.24 7071.30 7396.67
(∑x)2/N 5881.25 7581.21 5909.64 5867.99 6133.64 7396.36
SD 2.23 2.23 0.12 0.35 21.65 0.39
SEM 1.28 1.28 0.07 0.2 12.4 0.22

98
Appendix 2 Mineral calculation
(2a) Calcium (Ca)
Sample F24 F48 DSH DSU UDSH SP7
1 77.66 75.62 71.15 72.65 70.25 72.55
2 77.70 75.66 71.14 72.67 70.28 72.58
3 66.32 65.45 63.07 62.14 60.15 62.05
∑× 221.65 216.73 205.36 207.46 200.68 207.18
× 73.88 72.24 68.45 69.15 66.89 69.07
∑×2 16.14 15.75 14.03 14.46 13.47 14.37
(∑×)2/N 16.37 15.65 14.05 14.34 13.42 14.30
SD 0.25 0.22 0.14 0.59 0.15 0.18
SEM 0.14 0.12 0.08 0.34 0.09 0.10
2b Iron calculation (Fe)
Sample F24 F48 DSH DSU UDSH SP7
1 4.77 5.63 4.47 5.18 4.86 5.22
2 4.79 5.66 4.48 5.22 4.87 5.27
3 5.34 5.45 5.26 5.25 5.34 5.17
∑× 14.90 14.21 14.21 15.65 15.06 15.66
× 4.96 4.73 4.73 5.21 5.02 5.22
∑×2 76.20 67.64 67.64 70.83 75.83 81.72
(∑×)2/N 74.00 67.30 67.30 81.64 75.60 81.74
SD 1.04 0.41 0.41 0.31 0.33 0.60
SEM 0.60 0.23 0.23 0.18 0.19 0.35
2c Zinc calculation (Zn)
Sample F24 F48 DSH DSU UDSH SP7
1 1.86 2.15 2.33 2.19 2.66 1.84
2 1.88 2.13 2.36 2.20 2.67 1.86
3 1.34 1.05 1.15 1.17 1.22 1.17
∑× 5.08 4.33 5.84 5.56 6.55 4.87
× 1.69 1.44 1.94 1.85 21.18 1.62

99
∑×2 8.78 10.25 12.28 10.99 15.67 8.18
(∑×)2/N 8.60 6.24 11.36 10.30 14.30 7.90
SD 0.30 1.41 0.67 0.58 0.82 0.37
SEM 0.17 0.81 0.38 0.33 0.47 0.21
2d Sodium calculation
Sample F24 F48 DSH DSU UDSH SP7
1 8.35 7.62 8.55 8.94 7.25 8.18
2 8.48 7.68 8.56 8.97 7.28 8.20
3 7.24 6.38 6.26 5.66 5.20 5.67
∑× 24.07 21.68 23.38 23.57 19.73 22.05
× 8.02 7.22 7.79 7.85 6.57 7.35
∑×2 194.0Z4 156.74 185.72 192.41 132.59 66.29
(∑×)2/N 193.12 156.67 182.20 185.18 129.75 162.106
SD 0.67 0.72 1.32 1.90 1.12 1.45
SEM 0.38 0.41 0.76 1.09 0.62 0.83
Appendix 3: Anti-nutrient calculation
Phytate
Sample F24 F48 DSH DSU UDSH SP7
1
6.25
5.63 5.78 6.12 5.48 6.13
2 6.33 5.69 5.77 6.14 5.63 6.I7
3 6.00 5.45 5.55 6.35 5.54 6.64
∑x 18.54 16.77 17.10 18.61 16.65 18.75
X 6.18 5.59 5.70 6.20 5.5 6.25
∑x2 115.24 93.76 97.49 115.46 92.41 117.27
(∑x)2/N 114.45 93.74 97.47 115.44 92.40 117.18
SD 5.78 0.1 0.1 0.1 2.2 0.15
SEM 3.34 0.05 0.05 0.05 1.2 0.08

100
Tannins
Sample F24 F48 DSH DSU UDSH SP7
1 5.12 4.78 4.62 4.28 4.78 4.63
2 5.22 4.73 4.64 4.20 4.81 4.62
3 5.58 5.12 5.03 4.45 5.16 5.02
∑x 15.83 14.63 14.29 12.93 14.75 14.27
X 5.29 4.87 4.7 4.31 4.91 4.02
∑x2 84.14 71.42 68.14 55.75 72.59 67.97
(∑x)2/N 84.05 71.34 68.08 55.72 72.52 67.87
SD 0.21 0.2 0.2 3.87 0.17 0.22
SEM 0.12 0.11 0.11 2.23 0.09 0.12
Saponins
Sample F24 F48 DSH DSU UDSH SP7
1 0.12 0.11 0.12 0.14 0.10 0.12
2 0.13 0.10 0.13 0.15 0.09 0.13
3 0.35 0.32 0.31 0.33 0.31 0.31
∑x
0.60
0.53
0.56
0.62
0.50
0.56
X 0.20 0.17 0.18 0.20 0.16 0.18
∑x2 0.15 0.12 0.12 0.14 8.20 0.12
(∑x)2/N 0.12 0.09 0.10 0.12 0.25 0.10
SD 0.12 0.12 0.10 0.10 1.99 0.10
SEM 0.06 0.06 0.05 0.05 1.15 0.05

101
Oxalate
Appendix iv: Functional Properties
Water absorption capacity
Sample F24 F48 DSH DSU UDSH SP7
1 53.20 56.32 52.05 54,12 54.18 55.23
2 53.18 56.29 52.08 54.13 54.16 55.19
3 53.36 56.51 52.27 53.35 54.30 55.45
∑× 159.74 169.13 156.40 162.60 162.64 165.87
× 53.24 56.37 52.13 54.20 54.21 55.29
∑×2 8539.78 9535.00 8153.67 8812.44 8817.26 9170.98
(∑×)2/N 8505.62 9534.98 8153.65 8812.92 8817.25 9170.95
SD 4.13 0.10 0.10 0.10 2.2 1.12
SEM 2.38 0.05 0.05 0.05 1.2 0.06
Nitrogen solubility
Sample F24 F48 DSH DSU UDSH SP7
1 5.28 5.13 4.88 4.77 4.69 5.12
2 5.22 5.14 4.86 4.76 4.67 5.16
3 5.36 5.22 4.76 4.85 4.75 5.56
∑× 15.86 15.49 14.68 14.38 14.11 15.84
× 5.28 5.16 4.89 4.79 4.70 5.28
Sample F24 F48 DSH DSU UDSH SP7
1 2.66 2.28 2.15 2.06 2.13 2.02
2 2.63 2.29 2.17 2.08 2.11 2.04
3 2.75 2.40 2.27 2.18 2.25 2.16
∑× 8.04 6.97 6.59 6.32 6.49 6.22
× 2.68 2.32 2.19 2.10 2.16 2.07
∑×2 21.56 16.20 14.48 13.32 14.05 12.91
(∑×)2/N 21.55 16.19 14.47 13.31 14.04 12.89
SD 2.2 2.2 2.2 2.2 2.2 0.10
SEM 1.2 1.2 1.2 1.2 1.2 0.05

102
∑×2 83.86 79.99 71.83 68.93 66.37 83.74
(∑×)2/N 83.85 79.98 71.83 68.92 66.36 83.63
SD 2.2 2.2 2.2 2.2 2.2 0.23
SEM 1.2 1.2 1.2 1.2 1.2 0.13
Swelling properties (SWP)
Sample F24 F48 DSH DSU UDSH SP7
1 6.35 6.18 5.66 5.58 6.33 6.29
2 6.33 6.20 5.68 5.50 6.38 6.28
3 6.51 6.36 5.86 5.74 6.55 6.47
∑× 19.19 18.51 17.20 16.82 19.26 19.04
× 6.39 6.18 5.06 5.60 6.42 6.68
∑×2 122.79 117.07 98.62 99.36 123.66 120.85
(∑×)2/N 122.75 114.57 98.61 94.30 123.64 120.84
SD 2.2 1.11 2.2 1.59 2.2 2.2
SEM 1.2 0.64 1.2 0.91 1.2 1.2
APPENDIX V: SENSORY EVALUATION OF PRODUCT
Sensory evaluation questionnaire for cakes .
Instruction:
Please, taste the coded samples before you and indicate how much tou like or dislike each of
them. Evaluate these samples for colour, taste, texture, flavour and general acceptability.
Check the point on the scale that best describes the products as they appeal to you, by ticking
( . Always rinse your mouth with (the provided) warm water after each tasting.
Hedonic scale SENSORY ATTRIBUTES
Description TASTE
Scores WF
001
UDSH
002
DSU:W
70:30
003
DSU:
W
50:50
004
F24:
W
70:30
005
F24:
W
50:50
006
SP7:
W
70:30
007
SP7:W50:50
008
Like extremely 9

103
Like very much 8
Like moderately 7
Like slightly 6
Neither like nor dislike 5
Dislike slightly 4
Dislike moderately 3
Dislike very much 2
Dislike extremely 1
Comments- -----------------------------------------------------------------------------------------
------------------------------------------------------------------------------------------------------------
------------------------------------------------------------------------------------------------------------
Hedonic scale SENSORY ATTRIBUTES
Description COLOUR
Scores WF
001
UDSH
002
DSU:W
70:30
003
DSU:
W
50:50
004
F24:
W
70:30
005
F24:
W
50:50
006
SP7:
W
70:30
007
SP7:
W50
:50
008
Like extremely 9
Like very much 8
Like moderately 7
Like slightly 6
Neither like nor dislike 5
Dislike slightly 4
Dislike moderately 3
Dislike very much 2
Dislike extremely 1
Comments- -----------------------------------------------------------------------------------------
------------------------------------------------------------------------------------------------------------

104
Hedonic scale SENSORY ATTRIBUTES
Description TEXTURE
Score
s
DS
H
W
F
00
1
UDS
H
002
DSU:
W
70:30
003
DSU:
W
50:50
004
F24:
W
70:30
005
F24:
W
50:50
006
SP7:
W
70:30
007
SP7:
W50:
50
008
Like extremely 9
Like very much 8
Like moderately 7
Like slightly 6
Neither like nor dislike 5
Dislike slightly 4
Dislike moderately 3
Dislike very much 2
Dislike extremely 1
Comments- -----------------------------------------------------------------------------------------
------------------------------------------------------------------------------------------------------------
------------------------------------------------------------------------------------------------------------
Hedonic scale SENSORY ATTRIBUTES
Description FLAVOUR
Scores WF
001
UDSH
002
DSU:W
70:30
003
DSU:W
50:50
004
F24:W
70:30
005
F24:
W
50:50
006
SP7:W
70:30
007
SP7:W
50:50
008
Like extremely 9
Like very much 8
Like moderately 7

105
Like slightly 6
Neither like nor dislike 5
Dislike slightly 4
Dislike moderately 3
Dislike very much 2
Dislike extremely 1
Comments- -----------------------------------------------------------------------------------------
------------------------------------------------------------------------------------------------------------
------------------------------------------------------------------------------------------------------------
Hedonic scale SENSORY ATTRIBUTES
Description GENERAL ACCEPTABILITY
Scores WF
001
UDSH
002
DSU:W
70:30
003
DSU:W
50:50
004
F24:W
70:30
005
F24:
W
50:50
006
SP7:W
70:30
007
SP7:W5
0:50
008
Like extremely 9
Like very much 8
Like moderately 7
Like slightly 6
Neither like nor dislike 5
Dislike slightly 4
Dislike moderately 3
Dislike very much 2
Dislike extremely 1
Comments- -----------------------------------------------------------------------------------------
------------------------------------------------------------------------------------------------------------
------------------------------------------------------------------------------------------------------------
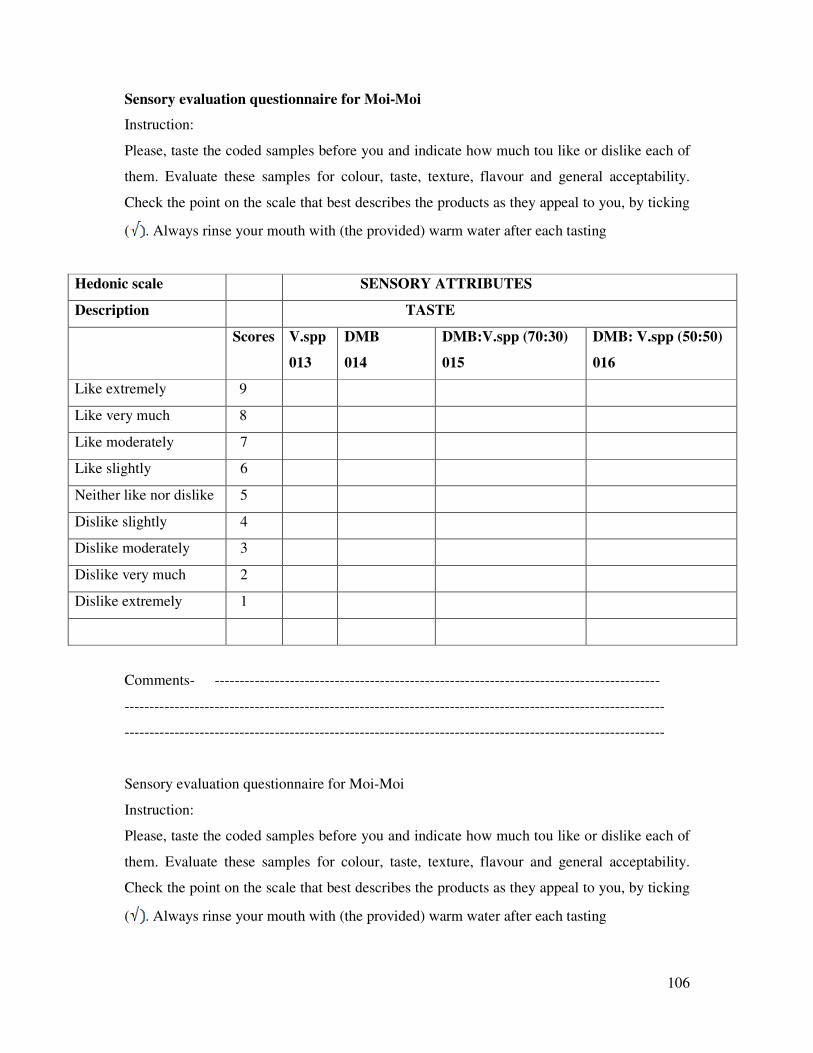
106
Sensory evaluation questionnaire for Moi-Moi
Instruction:
Please, taste the coded samples before you and indicate how much tou like or dislike each of
them. Evaluate these samples for colour, taste, texture, flavour and general acceptability.
Check the point on the scale that best describes the products as they appeal to you, by ticking
( . Always rinse your mouth with (the provided) warm water after each tasting
Hedonic scale SENSORY ATTRIBUTES
Description TASTE
Scores V.spp
013
DMB
014
DMB:V.spp (70:30)
015
DMB: V.spp (50:50)
016
Like extremely 9
Like very much 8
Like moderately 7
Like slightly 6
Neither like nor dislike 5
Dislike slightly 4
Dislike moderately 3
Dislike very much 2
Dislike extremely 1
Comments- -----------------------------------------------------------------------------------------
------------------------------------------------------------------------------------------------------------
------------------------------------------------------------------------------------------------------------
Sensory evaluation questionnaire for Moi-Moi
Instruction:
Please, taste the coded samples before you and indicate how much tou like or dislike each of
them. Evaluate these samples for colour, taste, texture, flavour and general acceptability.
Check the point on the scale that best describes the products as they appeal to you, by ticking
( . Always rinse your mouth with (the provided) warm water after each tasting
107
Hedonic scale SENSORY ATTRIBUTES
Description COLOUR
Scores V.spp
013
DMB
014
DMB:V.spp (70:30)
015
DMB: V.spp (50:50)
016
Like extremely 9
Like very much 8
Like moderately 7
Like slightly 6
Neither like nor dislike 5
Dislike slightly 4
Dislike moderately 3
Dislike very much 2
Dislike extremely 1
Comments- -----------------------------------------------------------------------------------------
------------------------------------------------------------------------------------------------------------
------------------------------------------------------------------------------------------------------------
Sensory evaluation questionnaire for Moi-Moi
Instruction:
Please, taste the coded samples before you and indicate how much tou like or dislike each of
them. Evaluate these samples for colour, taste, texture, flavour and general acceptability.
Check the point on the scale that best describes the products as they appeal to you, by ticking
( . Always rinse your mouth with (the provided) warm water after each tasting
Hedonic scale SENSORY ATTRIBUTES
Description TEXTURE
Scores V.spp
013
DMB
014
DMB:V.spp (70:30)
015
DMB: V.spp (50:50)
016
Like extremely 9
Like very much 8
Like moderately 7

108
Like slightly 6
Neither like nor dislike 5
Dislike slightly 4
Dislike moderately 3
Dislike very much 2
Dislike extremely 1
Comments- -----------------------------------------------------------------------------------------
------------------------------------------------------------------------------------------------------------
------------------------------------------------------------------------------------------------------------
Sensory evaluation questionnaire for Moi-Moi
Instruction:
Please, taste the coded samples before you and indicate how much tou like or dislike each of
them. Evaluate these samples for colour, taste, texture, flavour and general acceptability.
Check the point on the scale that best describes the products as they appeal to you, by ticking
( . Always rinse your mouth with (the provided) warm water after each tasting
Hedonic scale SENSORY ATTRIBUTES
Description FLAVOUR
Scores V.spp
013
DMB
014
DMB:V.spp (70:30)
015
DMB: V.spp (50:50)
016
Like extremely 9
Like very much 8
Like moderately 7
Like slightly 6
Neither like nor dislike 5
Dislike slightly 4
Dislike moderately 3
Dislike very much 2
Dislike extremely 1

109
Sensory evaluation questionnaire for Moi-Moi
Instruction:
Please, taste the coded samples before you and indicate how much tou like or dislike each of
them. Evaluate these samples for colour, taste, texture, flavour and general acceptability.
Check the point on the scale that best describes the products as they appeal to you, by ticking
( . Always rinse your mouth with (the provided) warm water after each tasting
Hedonic scale SENSORY ATTRIBUTES
Description GENERAL ACCEPTABILITY
Scores V.spp
013
DMB
014
DMB:V.spp (70:30)
015
DMB: V.spp (50:50)
016
Like extremely 9
Like very much 8
Like moderately 7
Like slightly 6
Neither like nor dislike 5
Dislike slightly 4
Dislike moderately 3
Dislike very much 2
Dislike extremely 1
Comments- -----------------------------------------------------------------------------------------
------------------------------------------------------------------------------------------------------------
------------------------------------------------------------------------------------------------------------
Sensory evaluation questionnaire for Akara
Instruction:
Please, taste the coded samples before you and indicate how much tou like or dislike each of
them. Evaluate these samples for colour, taste, texture, flavour and general acceptability.
Check the point on the scale that best describes the products as they appeal to you, by ticking
( . Always rinse your mouth with (the provided) warm water after each tasting

110
Hedonic scale SENSORY ATTRIBUTES
Description TASTE
Scores V.spp
013
DMB
014
DMB:V.spp (70:30)
015
DMB: V.spp (50:50)
016
Like extremely 9
Like very much 8
Like moderately 7
Like slightly 6
Neither like nor dislike 5
Dislike slightly 4
Dislike moderately 3
Dislike very much 2
Dislike extremely 1
Comments- -----------------------------------------------------------------------------------------
------------------------------------------------------------------------------------------------------------
------------------------------------------------------------------------------------------------------------
Sensory evaluation questionnaire for Akara
Instruction:
Please, taste the coded samples before you and indicate how much tou like or dislike each of
them. Evaluate these samples for colour, taste, texture, flavour and general acceptability.
Check the point on the scale that best describes the products as they appeal to you, by ticking
( . Always rinse your mouth with (the provided) warm water after each tasting
Hedonic scale SENSORY ATTRIBUTES
Description COLOUR
Scores V.spp
013
DMB
014
DMB:V.spp (70:30)
015
DMB: V.spp (50:50)
016
Like extremely 9
Like very much 8
Like moderately 7
Like slightly 6
Neither like nor dislike 5

111
Dislike slightly 4
Dislike moderately 3
Dislike very much 2
Dislike extremely 1
Comments- -----------------------------------------------------------------------------------------
------------------------------------------------------------------------------------------------------------
------------------------------------------------------------------------------------------------------------
Sensory evaluation questionnaire for Akara
Instruction:
Please, taste the coded samples before you and indicate how much tou like or dislike each of
them. Evaluate these samples for colour, taste, texture, flavour and general acceptability.
Check the point on the scale that best describes the products as they appeal to you, by ticking
( . Always rinse your mouth with (the provided) warm water after each tasting
Hedonic scale SENSORY ATTRIBUTES
Description TEXTURE
Scores V.spp
013
DMB
014
DMB:V.spp (70:30)
015
DMB: V.spp (50:50)
016
Like extremely 9
Like very much 8
Like moderately 7
Like slightly 6
Neither like nor dislike 5
Dislike slightly 4
Dislike moderately 3
Dislike very much 2
Dislike extremely 1

112
Sensory evaluation questionnaire for Akara
Instruction:
Please, taste the coded samples before you and indicate how much tou like or dislike each of
them. Evaluate these samples for colour, taste, texture, flavour and general acceptability.
Check the point on the scale that best describes the products as they appeal to you, by ticking
( . Always rinse your mouth with (the provided) warm water after each tasting
Hedonic scale SENSORY ATTRIBUTES
Description FLAVOUR
Scores V.spp.
100%
013
DMB
100%
014
DMB:V.spp
(70:30)
015
DMB: V.spp
(50:50)
016
Like extremely 9
Like very much 8
Like moderately 7
Like slightly 6
Neither like nor dislike 5
Dislike slightly 4
Dislike moderately 3
Dislike very much 2
Dislike extremely 1
Comments- -----------------------------------------------------------------------------------------
------------------------------------------------------------------------------------------------------------
------------------------------------------------------------------------------------------------------------
Sensory evaluation questionnaire for Akara
Instruction:
Please, taste the coded samples before you and indicate how much tou like or dislike each of
them. Evaluate these samples for colour, taste, texture, flavour and general acceptability.
Check the point on the scale that best describes the products as they appeal to you, by ticking
( . Always rinse your mouth with (the provided) warm water after each tasting

113
Hedonic scale SENSORY ATTRIBUTES
Description GENERAL ACCEPTABILITY
Scores V.spp
013
DMB
014
DMB:V.spp (70:30)
015
DMB: V.spp (50:50)
016
Like extremely 9
Like very much 8
Like moderately 7
Like slightly 6
Neither like nor dislike 5
Dislike slightly 4
Dislike moderately 3
Dislike very much 2
Dislike extremely 1
Comments- -----------------------------------------------------------------------------------------
------------------------------------------------------------------------------------------------------------
------------------------------------------------------------------------------------------------------------
Sensory evaluation questionnaire for Soup
Instruction:
Please, taste the coded samples before you and indicate how much tou like or dislike each of
them. Evaluate these samples for colour, taste, texture, flavour and general acceptability.
Check the point on the scale that best describes the products as they appeal to you, by ticking
( . Always rinse your mouth with (the provided) warm water after each tasting
Hedonic scale SENSORY ATTRIBUTES
Description TASTE
Scores Cowpea
016
UDM
017
Like extremely 9
Like very much 8
Like moderately 7
Like slightly 6

114
Neither like nor dislike 5
Dislike slightly 4
Dislike moderately 3
Dislike very much 2
Dislike extremely 1
Comments- -----------------------------------------------------------------------------------------
------------------------------------------------------------------------------------------------------------
------------------------------------------------------------------------------------------------------------
Sensory evaluation questionnaire for Soup
Instruction:
Please, taste the coded samples before you and indicate how much tou like or dislike each of
them. Evaluate these samples for colour, taste, texture, flavour and general acceptability.
Check the point on the scale that best describes the products as they appeal to you, by ticking
( . Always rinse your mouth with (the provided) warm water after each tasting
Hedonic scale SENSORY ATTRIBUTES
Description COLOUR
Scores
Cowpea
016
UDM
017
Like extremely 9
Like very much 8
Like moderately 7
Like slightly 6
Neither like nor dislike 5
Dislike slightly 4
Dislike moderately 3
Dislike very much 2
Dislike extremely 1
Comments- -----------------------------------------------------------------------------------------
------------------------------------------------------------------------------------------------------------

115
Sensory evaluation questionnaire for Soup
Instruction:
Please, taste the coded samples before you and indicate how much tou like or dislike each of
them. Evaluate these samples for colour, taste, texture, flavour and general acceptability.
Check the point on the scale that best describes the products as they appeal to you, by ticking
( . Always rinse your mouth with (the provided) warm water after each tasting
Hedonic scale SENSORY ATTRIBUTES
Description TEXTURE
Scores
Cowpea
016
UDM
017
Like extremely 9
Like very much 8
Like moderately 7
Like slightly 6
Neither like nor dislike 5
Dislike slightly 4
Dislike moderately 3
Dislike very much 2
Dislike extremely 1
Comments- -----------------------------------------------------------------------------------------
------------------------------------------------------------------------------------------------------------
------------------------------------------------------------------------------------------------------------
Sensory evaluation questionnaire for Soup
Instruction:
Please, taste the coded samples before you and indicate how much tou like or dislike each of
them. Evaluate these samples for colour, taste, texture, flavour and general acceptability.
Check the point on the scale that best describes the products as they appeal to you, by ticking
( . Always rinse your mouth with (the provided) warm water after each tasting

116
Comments- -----------------------------------------------------------------------------------------
------------------------------------------------------------------------------------------------------------
------------------------------------------------------------------------------------------------------------
Sensory evaluation questionnaire for Soup
Instruction:
Please, taste the coded samples before you and indicate how much tou like or dislike each of
them. Evaluate these samples for colour, taste, texture, flavour and general acceptability.
Check the point on the scale that best describes the products as they appeal to you, by ticking
( . Always rinse your mouth with (the provided) warm water after each tasting
Hedonic scale SENSORY ATTRIBUTES
Description GENERAL ACCEPTABILITY
Scores
Cowpea
016
UMB
017
Like extremely 9
Like very much 8
Like moderately 7
Like slightly 6
Hedonic scale SENSORY ATTRIBUTES
Description FLAVOUR
Scores
Cowpea
016
UDM
017
Like extremely 9
Like very much 8
Like moderately 7
Like slightly 6
Neither like nor dislike 5
Dislike slightly 4
Dislike moderately 3
Dislike very much 2
Dislike extremely 1

117
Neither like nor dislike 5
Dislike slightly 4
Dislike moderately 3
Dislike very much 2
Dislike extremely 1
Comments- -----------------------------------------------------------------------------------------
------------------------------------------------------------------------------------------------------------
-----------------------------------------------------------------------------------------------------------