Embed Size (px)
Citation preview
SSFL Property Boundary Monitoring Wells Near-Surface Groundwater TCE Soil Vapor Results (Micrograms per Liter Vapor) Vapor Validation Sampling Locations ~re0S' SLSana F
Administrative Boundary ChffisNOrlh fonnalion Well Maiozimete leteielsxtent olneei-.virtem 0 <Ue[eNOn Lim it 0 Control Area Lorfions
Vanmt,ra co",
BFI Sites
Sha e Units
NeanSudace Groundwater /!'nC oncenieun ieeei a S yyL
Chatsworth formation Groundwater
O 010 pg/Lv
S 10 to 100 pg,'Lv
X"*
Distal Ares Location s
Source Area Locations
FIGURE 3- 1
SUMMARY OF W HO 100to1000pg- A LOXWorkPlan Sampling Location i MW I, 0 SAMPLING LOCATION S
0%.0 _ ~TCE Concentralon Graver than 1000 pg/L 0 1,O/B ro 10,000 pg/La s-plesFOR VALIDATI ON STUDY
• > 001'9/1 v
F I G U R ESAMPLE LOCATIONS A T
SW M U 6 . 4 Santa Susana Field Laboratory © MWH 3-2COMPOUND A FACILITY rw011rc9naErtvwarsaN a za
Legend 178 4m 178 800 12 20 o 178 600
Vapor Migration Model Validation Sample Locations O JCCL-D 00 P Z
J✓-02 41,_,0h 1
Control Area LocationsPARKING 0 G PZ-028
y
A Distal Area Locations 0P'-106 !, v P~ PZ-
W\'Source Area Locations
.
. ,,gggi.1
0RS-5 0 PZ029
Near - Surface Groundwate rNear-Surface Groundwater TCE
I ♦♦ avatp '~~a ,'
PZ-01 8~/ 1 Concentration Greater than 5 pg/L ~~•` , ♦ -,-, 0
Approximate Lateral Extent of Near-
♦
10 ~~ 0 dPZ-030 0Surface Groundwater - February 2005
Chatsworth Formation GroundwaterES 25 C
.; -2C,` jo ~g
P' 0F0 OPZ03 1TCE Concentration Greater than 5 pg/ L
TCE Concentration Greater than 1000 pg/L
- aea
0F
Approximate Extent of Alluvium Thickness > 5 Feet
TCE Soil Vapor Results ( Micrograms per Liter Vapor )
orm,
`♦♦ R
Notes :t ti Li it0 D
+ +e ec on m I d ngsoopel d dValidatio n
d d l dWS-1 1
~' ♦ rII
•
4co o te gin ,u es ca ccate groun wate r
sit a n0 10 pg/Lv face no, d fp eNI 0
~♦♦ (Huc eFlpem e
Q ~~I ports I al samples.10 to 100 pg/Lv 2) N o g dwal r
extend Chat rlhf ationan
c 0 100 to 1000 p9/Lv grorm d to TCEox to
♦♦ _TTZ e,0 RS-1 7. p
0PZv15
~o ♦♦i,
present rm nl 06
0 1,000 to 10,000 pg/Lv inform albr bt d fro mH,Iev &wd h N rf ce
0 >10,000 pg /Lv gmundwate TCE conpi-rs
su p 1'~~ barge a Caulm Ograin, R P,,, , ~~ ,nxugc
C• a apresent alai conditions
ficm MWH
Base Map LegendO M W ll
F7nIrN .,..^.~ . zy ~g Oo; OgnPit , . .. "t,. .~;
0w67A ,
♦rrnmg Pit 0 ,' •e sonitoring
dEevoronS~I~1~J 6.4 - f Ci'a nF c, • .
cR dR ra Compoung11 lag
T l Rla10 r ~m/eam, Facility 26
' Valve -Plait 3Sc -. ll
A g POgme ronAa ve (onnrox oca 7
Arco e wjarvo/`q/ =ences
RF I seoaadonea
rad5 oavons Pps
~ro/ ek,/•
•• AR '( / AREA III• o ♦ axEA m
_ Tic sraoam sT Urv ES- / "0 ♦ ♦ ~C=o l' iRp ~~ous ~~ II BOUNDAR -{usEA Tr ♦ `
55B ~IJJ0 €o ~_. . . rcrete Bern
PZ-036 o HAR 1 7A•L-hooldq / -
'RD-SSA 0 / !/rank N 00 P,/y
R
Daze opesl,zaosma\a7==k\1=h\m\vmmvs co
_as.♦ 7 L /// ♦ /
Fina l• r n p ~'-S3 •E!nAa~C _ ♦ ~ Po,lln .
gill in 2582 tl ~~o 0~/ / AREA IIIa I aat cn)a I
v ioaa 7j~µ21 AREA II BOUNDARY
(par a) •^ ~.
-v cv
N
0 Im
'
en srana w
se- 18 wNRJ 6. 5
X253 HR=Vcl TLI V
est Area~~ ~ool _ ~
_ ` cva'1
~ s ~ 0PZ-054
FY
•
ea
Rrv2
m T ,. .0 D 255 oa Il
a,cl aTen k
l'OfJ
jown~, l >s f rY~,
I~^^
178 4N 17£ 800 178 200 174600
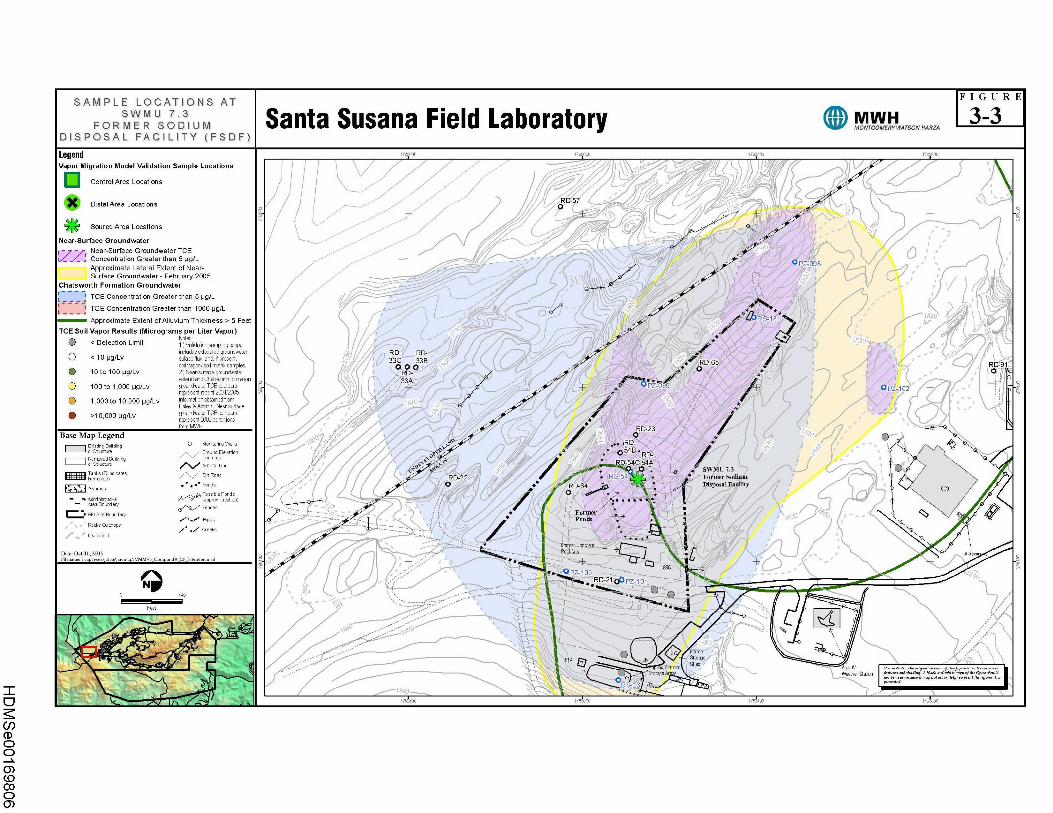
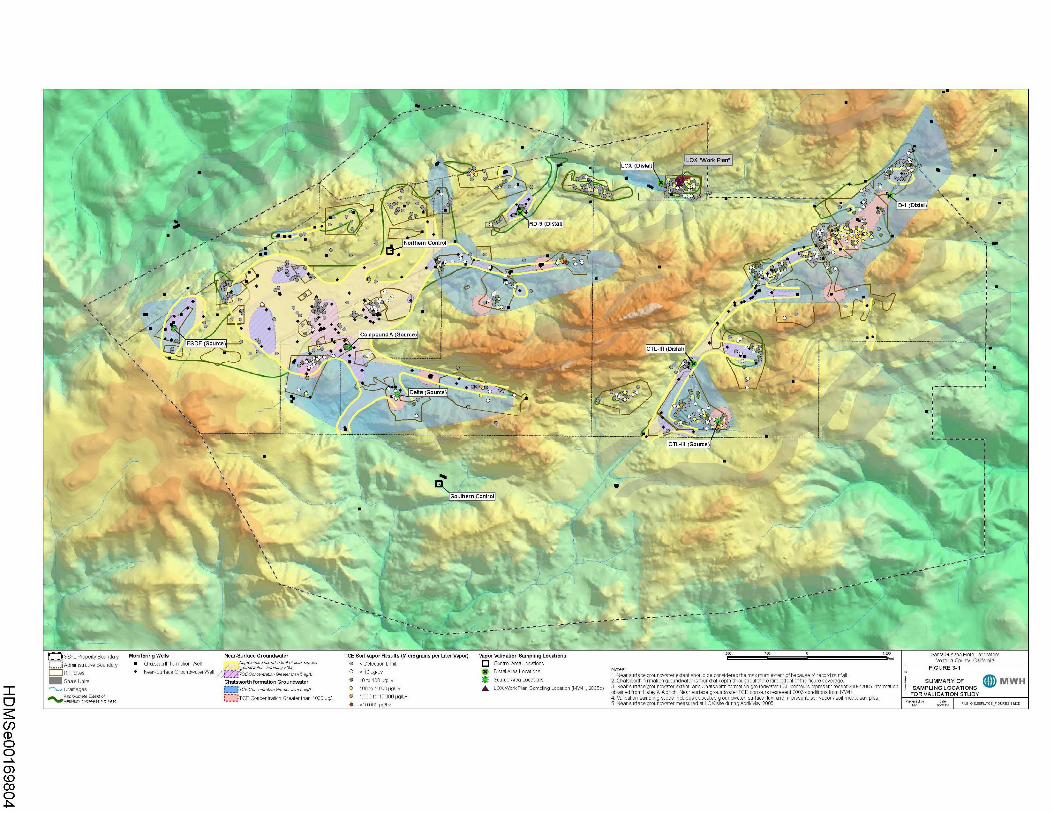
SAMPLE LOCATIONS A TS W M U '
FORMER SODIUM
F I G U R E
3-3Santa Susana Field Laboratory © MWHrwot rconaErtvwarsaN v r zau a r
DISPOSAL FACILITY (FSDF )
Legend 178J600 178 000 178 400 178J800
Vapor Migration Model Validation Sample Location s
❑ Control Area Locations
RD-57 1Distal Area Location s
Source Area Locations
O
Near - Surface Groundwate rNear-Surface Groundwater TCE j-Concentration Greater than 5 pg/L -
0 P 09 8Approximate Lateral Extent of Near-
Surface Groundwater- February 2005
Chatsworth Formation Groundwate r
TCE Concentration Greater than 5 pg/ L
TCE Concentration Greater than 1000 pg/L
'
Z-
Approximate Extent ofAlluvium Thickness 5 Fee t
TCE Soil Vapor Results ( Micrograms per Liter Vapor )
0
0 < Detection Limit Notes
1)Validation sampling scoped t d7 d -t r,
1820'Uir . ' 0 1
RD- RD-0 <10 pg/Lv t fl . dfpresent ,
sit 1 p soil al samples' -33C 33B
O 00 /~♦ RD-65 RD 91'
10 to 100 pg/Lv 2) N- rf g dwAe rextend Char nh f rrratonan
c 0 100 to 1,000 pg/Lv 2 ndwate TCE "hoursp sent rm M LIX7Mo
Al obtained fro m0 1,000 to 10,000 pg/Lv informatinti-Hale1 &Nd h Neaurface
>10,000 pg /Lv gmresent e TCE tours present I T CE
RD- O O33A ♦+ + Opt-102 +
d/
_
bcmMWH RD-2 3Base Map Legend
1, tlrn t'Dg 11, o Monitoring wu ss s dE varo n
R d a mm °
1 / ORD-
054B I o '~~/\548. ^qf` ~¢(/
~'o 05
~ew
. .e
eaj d r~ ° 1,1 R-~m
/ ~ ~ax PC1 RD-54C ~ ~ P ~O
X;
'NIU 7.3 0J
RD-22 rmer Sodiu m
~o v
Awn ngs. . : Ponds
aogme POntlsAd traiv,
O ♦ / Rp_gq00
III, :LLLLL~//`~/"̀I`Easposal FacutTy f~ 00
9
.(approx -ton )A B uNa
=ences
aFl sre eowdary
• • ~
'~-O /\
11
'
t
~` ♦ Former/ ~ • / ~&y1 0 ~
~®
R-,
0-rap,
. v`~ W
tPamrem FDate Oct 31,2005
"•aA at~o~p tin\ m . Avmmvsc
ormer GonerPcol An 6 + + ma(rem
-
+ +-'•
_
~ 88f .
N
,
~~RD-2100 v'
to o
Feet--- ----------
0 37 Former
114 Stoaerox Fnrmer Shed Area IV
„VStorage An Weather StA'on Ip°'n v ~r y°P i on
OR&23 arq
178 1600 na o0o 178 1400 178 1800
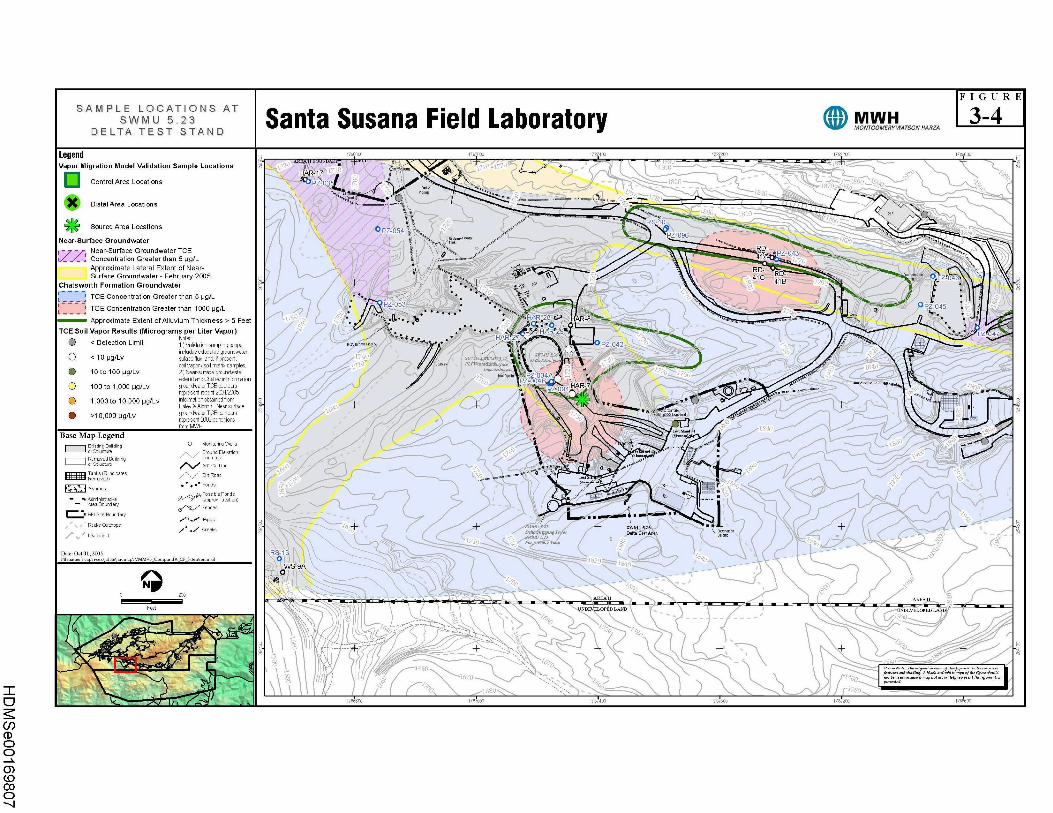
SAMPLE LOCATIONS ATSWMU 5 .2 3
DELTA TEST STAN D
LegendVapor Migration Model Validation Sample Location s
11
xControl Area Locations
Distal Area Locations
Source Area Location s
Near - Surface GroundwaterNear-Surface Groundwater TC E
r/ 1 • Concentration Greater than 5 pg/LApproximate Lateral Extent of Near-Surface Groundwater - February 2005
Chatsworth Formation Groundwate r
TCE Concentration Greater than 5 pg/L
TCE Concentration Greater than 1000 pg/L
Approximate Extent of Alluvium Thickness > 5 Feet
TCE Soil Vapor Results ( Micrograms per Liter Vapor)
0 < Detection Limit
0 < 10 pg/Lv
10 to 100 pg/Lv
0 100 to 1,000 pg/Lv
0 1,000 to 10,000 pg/Lv
0 >10,000 pg/Lv
Base Map Legend
11
0, "r.
.
. iltli g
-O ed Building
EHHTank (R hdiatesR moved)
RFI S ltd Rngnd&
L,ad,del dData O t31,zco5
I h for-lion
O Monitnnng Well s
od ElutionJCC rdn g1,1 R-Ponds
Po-dledond,(agg ro, n )
-dnee =Pgcreek
,
m oiiiia
Feet
Santa Susana Field Laboratory
RS-130
WS-9A0
UNDEVELOPED LAND
MWHM0NTG0MERY6YASct -RZA
F I G U R E
3-4
AEEA 11
UNDEVELOP ED LAND
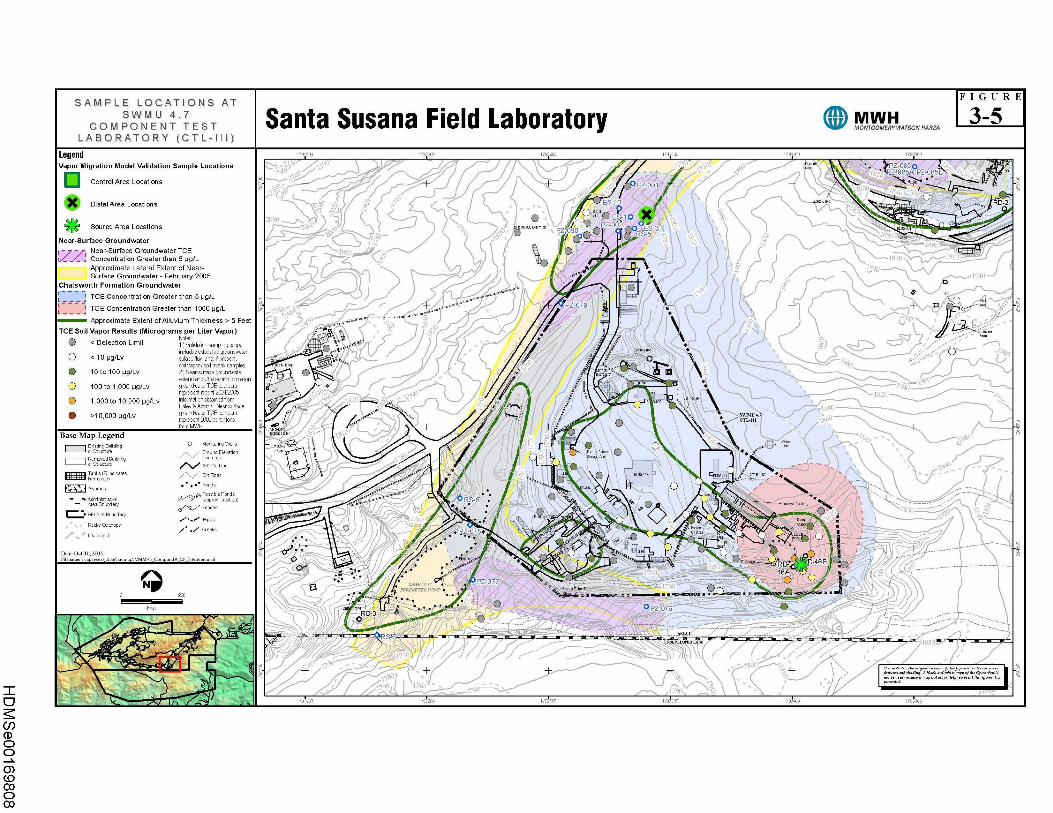
SAMPLE LOCATIONS A T
S W M U 4 . 7COMPONENT T TEST
FIGUR E
rwoN3-5Santa Susana Field Laboratory Q MWH
rconaErtvwarsaN varrza
LABORATORY (CTL-III )
Legend 179 800 17el 179 ec 179j: 00 179 100 179j8 0
Vapor Migration Model Validation Sample Location s
❑ Control Area Locations
~, yam PZ 0850PZ'085A PZ 085
+ + + PZ-091 + ~~\• • • /~ II
0DistalArea Location s
ource Area Locations
RD-2qe yE E^-.14 ~~L Q10
x 1C E
0 s G-602A O 8 oe0~aOE~1 _ 90 CC RSE 3PZxQ so OR9' ~ 95
Near - Surface Groundwate r
r- Near Surface Groundwater TC EJ
Approximate Lateral Extent of Nea l
Surface Groundwater February 2005
'9"
p},1980 G1 Jo
i• >~
e
Chatsworth Formation Groundwate r
TCE Concentration Greater than 5 pg/ L
TCE C t t G t th 1000 IL
1 ~~ ) 1 ~~ o
0+ + °Z 'T`' ~+ + +t - - - oncen ra ion rea er an p g
Approximate Extent of Alluvium Thickness > 5 Feet s. -
Y
V
TCE Soil Vapor Re sults ( Micrograms per Liter Vapor ) Ifl_
~
NotesC < Detection Limit 1Validation sampling scope
onC <10 Ng/Lv fW.ace and f present
t
I lI ll
- ~~ • m~n~naa i ~f w S~ ~ ~0
.e 198- _
eamNY0
p aso samp es10 to 100 pg/Lv C NeIi urf y d,,d, irsol
p~_.
0 ~~extend ancChat nhf motion
0 100 to 1,000 ug/Lv g ndwate TCE contoursrepresent re cart 21400b
C 1,000 to 10,000 pg/Lv rhorm formal or ht if from ale,&Nher Near urfa :e
>1 0,000 Ng /Lv ground- erTCE contours condition
s present resent
frcm MWH
~
~ C r In
\\W
Base Map LegendO Monterng Well s
3 dEl-rn nR tlBUdd ng -D o, m(R cmion g
TI, (R I d s art Rna c
tl)Ponds
\°Am '~ z
Po, otia~,oqqt
me
0 sai: - Ce,o[aii etenc •~_
(I 'r C0
0® A
Pghle nd,- Ad cap- o n ,A a 0 Crm_' C dNEep w .v ~~
aee 6Leadtfeltl
g • o•r3r,z~s~aa a r~o~k1 ~MMee Co- ~~A e,1 aeo~m d
ItI078 ♦e C• • - ,
o • 9u m•T ,
co • I• ~1~~ • + t• • T i Td 1C har~a~r as e
~ Ro-- -A oe•
rear Er ro~; 0 zRD
0
\ ormeveioQ
+ + + + + fe ~, owm;,h
J f+s~
179T800 1791200 1]s ON 1)9 goo 179 1100 179 1800
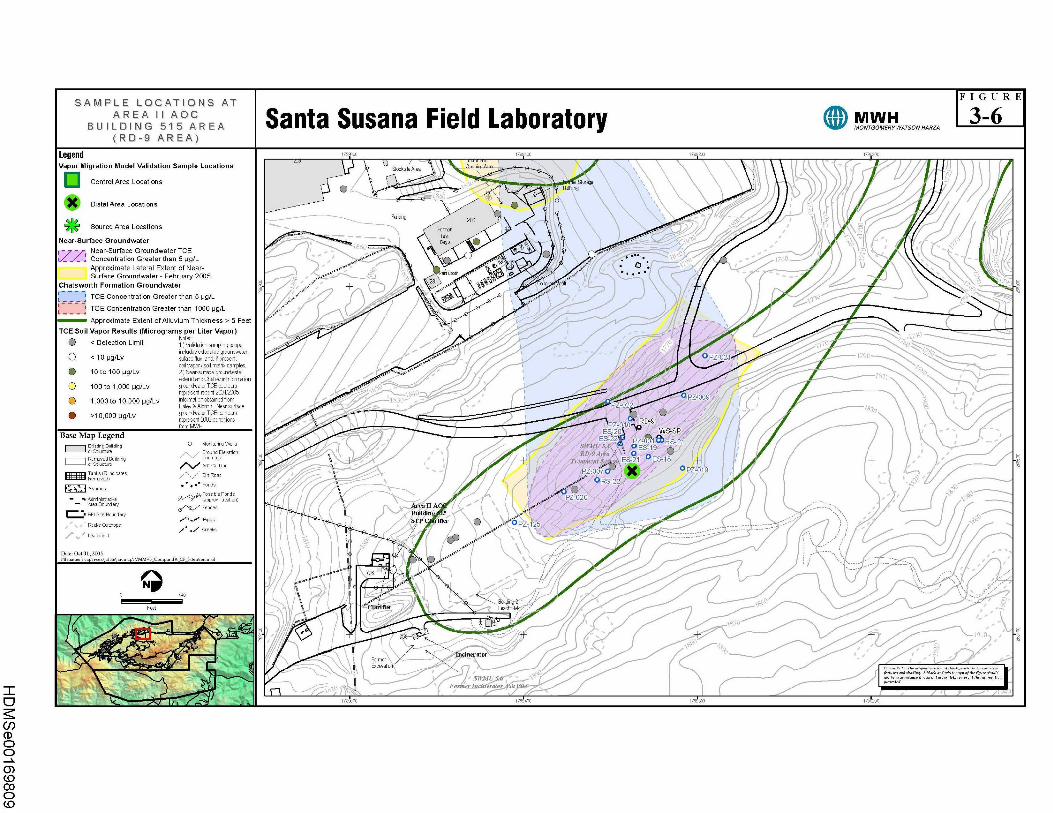
SAMPLE LOCATIONS A TAREA II AOC
FIGUR E
MM 3-6nt n Fi ld L r rS S b tBUILDING 51 5 AREA ya a usa a e a o a o MONTGOMERY, NArsoNHARZA
(RD-9 AREA )
Legend ,I8 00 ,7a 400 17a aw 1I0 200
Vapor Migration Model Validation Sample Location s
Control Area Locations
Stockpile Area Cleaning Are a
n er Stor eag0 Bullcing
A Distal Area Locations
Perking>---,06
Source Area Location s
Near - Surface Groundwate rNear-Surface Groundwater TC E
1/ 1 ,t Concentration Greater than 5 pg/L
Former ',L
Bays I
0 ••
• 'Approximate Lateral Extent of Near-Surface Groundwater- February 2005
Chatsworth Formation Groundwater
v~ •0• ' ~am eoo p /
231 ~gd~6 t /
TCE Concentration Greater than 5 pg/ L
t - - - TCE Concentration Greater than 1000 pg/ L
vi p Thickness > r FeetApproximat e
TCE Soil Vap
or
or Re (Microgramss per L
ite r
iter Vapor) Notes
Results
0 < Detection Limit Validation sampling copen,l,d d , nip dwater,
10 pg/Lv and f sufacem, 0 present ,
1 pr/s matrix samples.
O.
40 10 to 100 pg/Lv 2) N- . surf y-- dfownruextend one Chalswodh rrrlion
~~~ Ara- -°'-151 6
0 00 to 1,000 pg/Lv reresent
t groundwater TCE contoursue res recent 214005r pp
0 1 000 to 10,000 pg/Lv formal or b, i fro mHale &Nd h N rf e
O
P Z-022 --y
0 >10,000 pg /Lv gmunosed e TCE contoursrepresent ~T ]Cons
1330
RD-9,mm MWH .
Base Map LegendtF~ 2 WS-SP '
8) R So Monitoring well s or s. 1e a tlE vdton
ntoR tla lan °O 0
'> 18 'O Eg
gT d (RI ha-td,1,rt Fe-Removed)
PontlsA 9s
PProetl_ Atl ~., ppmn od[on 7
A e pd ences
- + +1,oyi E&2
.
X 0PZ-019 /
G RS-22 /00
P 02 0
Mel II A __
000.1101-00000RFI s e d ary P PBS
FbclS OUt topsGeelS
Leadtfeltl
Butldin 5..0
- 3TP l._O
Date Oct 31,2W5
14 0
Feet
-- -
76 51/
11, .
Bu Id ng 211 .' / ~' 1Sy0 tClarifier Leach Fdd
758-
~Indne a orFe- rI.-ton
1I8 01 1781400 1I8 a00 179 200
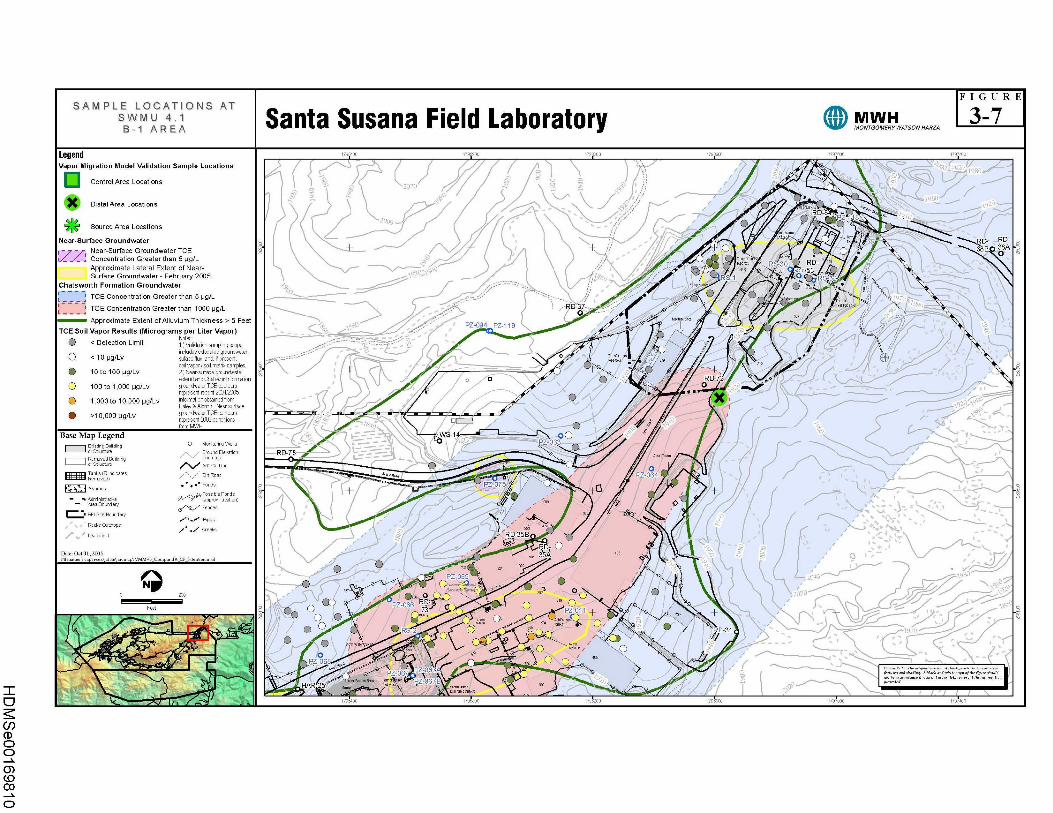
F I G U R ESAMPLE LOCATIONS A T
S W M U 4 .1 nnAA ~~//~~~~ uu 13-7Santa Susana Field Laboratory ©B-1 AREA MONrcoMEnnrsoNNnaza
Legend 179J400 179 800 179 200 179 600 179 000 179 '00
Vapor Migration Model Validation Sample Location s
❑ Control Area Location s
Distal Area Locations
'1 y
c~ ti Ail ! '
ource Area Location s
Near - Surface Groundwate rNear-Surface Groundwater TC E
/ ~ Concentration Greater than 5 pg/ LApproximate Lateral Extent of Near-
"
,
4 Ad
~ ~ 0 ~ ~U 19
3
...
~ cr~ ~ t x tm. fd
. "~ ~ a wYam
`
Surface Groundwater - February 2005
Chatsworth Formation Groundwate r
_ TCE Concentration Greater than 5 pg/ L
1 TCE Concentration Greater than 1000 /L
~5,
O ~,\___ J/ r~mo
-i } Ox0u50 0,-R 637 or 0 Mdcl \\
/'e 7 r
0
p g
Approximate Extent of Alluvium Thickness 5 Feet
TCE Soil Vapor Results (Micrograms per Liter Vapor)Notes
, . •~ v
-~~ -PZ-004 PZ 1 1 9
0 Limit< Detection 1)Validation sampling scopeI d t d t r
0 < 10 pg/Lv outdoor . d f f present "m ,I p Is I d pies
10 to 100 pg/Lv 2) N- . rf g - d~.vat-r
_ ~ .o"
ao ) 41 7xt + + . + +
°
extend one Chatsworth formation .o 0- RD-72
0 100 to 1,000 pg/Lv groundwater TCE contours,.
0
'represent recm 2140050 1,000 to 10,000 pg/Lv formal or ht fro m
Hale awe N rte
~. • _ -0
gmu>1 0 ,000 pg /Lv nosed to TC E contoursrepresent dl IX3 conditions,mm MWH
~~~. .❑~~
0
Base Map Legend
s O Monitoring Wls
dE io n-
WS-14 00
RD-78 III((( tea. _R tlBUldng
TxwtRhd-td, T Roo oR d1
n,dxga,n FZ-po -• Eondsg
Ad e (appmx opt on)
('7_ 075
r
R71 sn,Rnundary Elga=owed, ourrog s
L,omfem
Daz o tsr zaos
'
RD-35B
RDA O`'e o ,
edr. . ,r 1 a rrorkl irnl~rmo lvmm-vs com -n ce mmau-me N O .
o a7oO 0 0
w ~. ., R O 0 ! 02 ,,.
OO O cc pZ g p 0 0
73 +
C. T.k l0 O Pei,
O0
D-3 10
Ile
PZ-08 w, O 0 10F r r
w047 r~ 7 r .rr .~w,a r
arr FZOS 7sn sHAR-25
s17 9 . .11, ns aoo ns zoo 174600 rs 000 17010n
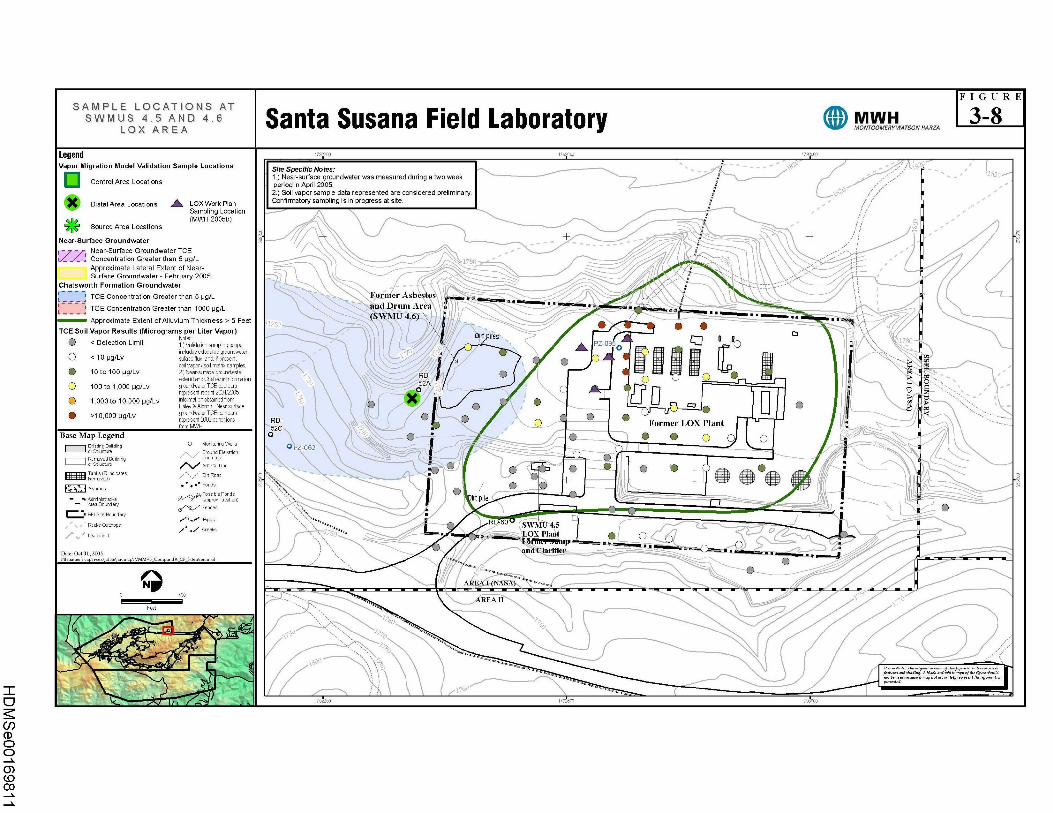
F I G U R ESAMPLE LOCATIONS A T
S W M U S 4 .5 AND 4 .6 Santa Susana Field Laboratory © MWHQ3- O
LOX AREA woNrcon ErtvwarsaN a za
Legend ns zoo 179J60) 1)s co o
Vapor Migration Model Validation Sample LocationsSite Specific Notes:
❑ Control Area Locations1 .) Near-su rface groundwater was measured dur i
i d i A il 2005ng a two week
per o n pr .2.) Soil vapor sample data represented are consi dered preliminary . ,y
A Distal Area Locations . LOX Work Plan Confi rmatory sampling is in progress at site .Sampling Location(MWH 20051d) - ..~
Source Area Location s
Near - Surface Groundwater} ppp
Near-Surface Groundwater TC Er ~Concentration Greater than 5 pg/ L/ 1 .:
Approximate Lateral Extent of Near-Surface Groundwater Februa ry 2005
1780
01Chatsworth Formation Groundwate r
TCE Concentration Greater than 5 pg/ L
TCE Concentration Greater than 1000 pg /L
Former As b
and Drum A
esto s
rea . (' , ~
Approximate Extent ofAlluvium Thickness > 5 Feet
TCE Soil Vapor Results ( Micrograms per Liter Vapor )
(SWDIL7 4.6)
Dirt Iles0 Detection Limit 1 )U lidallo sampling scope
d al t dd d ter,0 1 10 pg/Lv f Fl d f p m ,
p Js l at p l40 10 to 100 pg/Lv L f s,- d o
Al, PZ-095 o
0RD- 0
010
go of r-extend end anc Chalswodh orrraliongroundwaterTCE content s0 100 t 1 000 /L 02A
00
O
o , vp9represent receN 2W400b
X
I 2inform allor obtained fro m0 1,000 to 10,000 pg/LvHaley awe h N urfaee
>1 0,000 pg /Lv gmund to TCE contoursrepresent xtal conditionsfrcm MWH
0
RD-52C
0
0 0 ®0
® ~~ mo C~ a
•^Former LOX Plant
Base Map Legend 0 0 00 00 Monitoring Weis swingol,
deg erpn 0 PZ OSZ
o,eo„Ce°,lang =
a g0
T, ~ (R Sea aru ~rcr a ~EEEEHII0 0 0
D
0mpeem
PondsA g +~. 01 O OPOgble Ponds
- Aa ~~oe ;1,1 approo nt in pile71
A Toom
Ft sro 3-dory ~Pp. .
~~cu1 mpsee~
•/R80 SW MU 4.5
~YI
~amaem ,,. LOX Plant 0 0L 1 mI1PPeeW- -e- ~_ 0
Dazeooe3L,20o5 and Clarifier °_• ./
ma:f k\ ,1,1,\ fvmm-vs_Co0
N AREA I (NASA)
0 0~
rear
- .. _
.., - AREA II
r ~ b
f~ ~ J~Asn
1791200 1I9 6N 1I9 coo
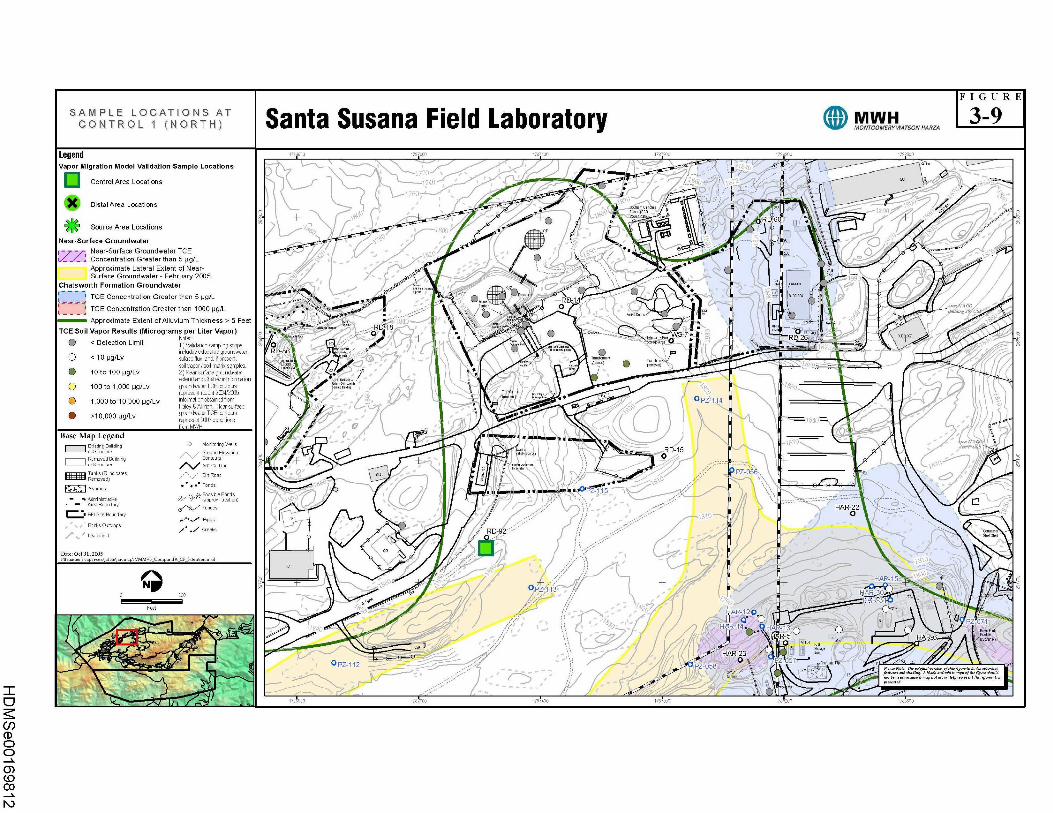
FIG U R E
SAMPLE LOCATIONS AT (~MWH 3-Fi l LS SCONTROL 1 (NORTH) 7anta usana aboratorye d rwo,vrconaersvwnrsoty vaaza
Legend 17 ;66)0 170 000 170 400 170 Boo 178 200 178600
Vapor Migration Model Validation Sample Locations -~~
201Control Area Location s
Distal Area Location s
Source Area Locations
. n
o L -• ~~ seNn°mcu1~+ 0 aseas°°isc11
1
N S f G d t
cal0
'>'- s Iear- ur ace roun wa e rNear-Surface Groundwater TCE
_~-n 0 \v~Ct ~~• n0 t .1
✓_ 1_ .~ Concentration Greater than 5 pg/L-
020
Approximate Lateral Extent of Near-Surface Groundwater February 2005 \~
Chatsworth Formation Groundwate r
TCE Concentration Greater than 5 pg/ L
f ~ f TCE Concentration Greater than 1000 pg/L
x701
O•"' "'
•• • •CC " ter
Approximate Extent of Alluvium Thickness > 5 Feet
TCE Soil Vapor Results ( Micrograms per Liter Vapor )N t
_'R Dj18
~ ` S 2
.
--RD 26o esaDetection Limit )u fdatt pt g p
d d t dg d t0 < 10 /L
+ 1 ~saasea` O+O
RD 86 ^.^°/ o.^^ `^
.~,. 0
~~•
,a
pg v f Fl d f p m,
p rl s al samples°a/
+
®10 to 100 pg/Lv 2Neasufin you bie r
end C orrralioncontourseC
Ean
, 0 100 to 1,000 pg/Lv groundwater 0rs4i • a~~ 1 -
✓
^~
rrecent
2represent t zwaz3ob ~
iwmw°m °"""°"' ~ O0 1, 000 to 10, 000 pg/Lv Iformallorobtained fro mHaley&Ndtoh Near-surface
♦- >` ~~ PZ-11 4®
0 >10,000 pg/Lv gmundwaterTCE contours
present cUIX3 conditions,mm MWH
~~r •✓ LLL
A f l~
-
Base Map Legend.
0 sO Monitoring Wl s
dE ato p
R dalano =RD-1 5
I+ 0 +oT, w(Rhd-~ ~ ,k~ac ~ x4 FZ 5 5
POntls
A a aa,Ens me EnndsAa e (aoomx nmrnn )
RFI sre anunddo,
- • •.n .~ . . .yrra•+ iJPZ-115
3
...-
HAR 220
O
rad5 out mys./ aeek, RD-92
~'~amtem /' J~ °sn°a
Daze o°t31,zao5m° waer,°°kve1,hv-vVneMVS
~ t(
,y p
ear + <- +V
0 HAR-1\
vo
~OPZ 413 11 ;i
teatsay`e
OHA4
-BAR-31 eeye
r.
17 o bHAR- 1 4
1 ^ . 1 0 A
\\U
R5 Rz6
~
O
- -f" HAR-23
0 V'O PZ-112
Iy on
h a
wn~, °°° °
.
y t ~ y v mot ; o
1I3 6J0 178170 0 1'8 400 178 800 178 200 178.600
F I G U R E
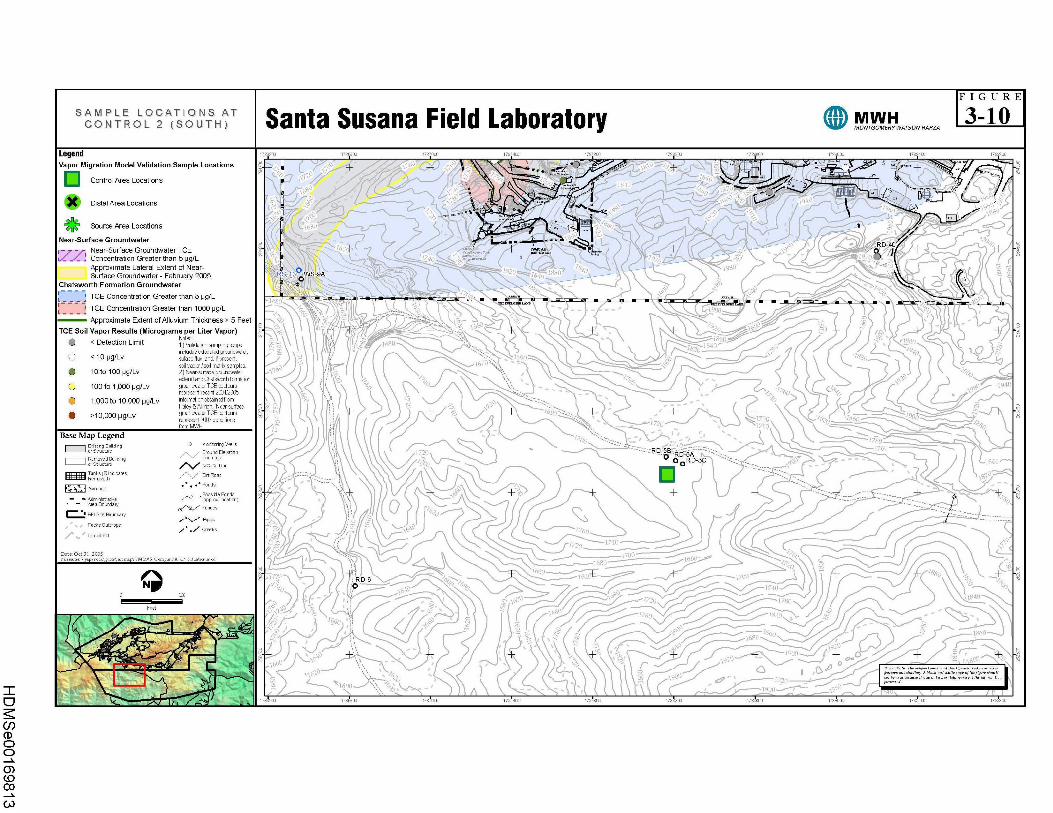
SAMPLE LOCATIONS A TCONTROL 2 (SOUTH) Santa Susana Field Laboratory MWH 3-10
MONTGOMERYWATSON HARZA
Legend na 200 1786300 178 11000 17a 4m 17e aoo e q200 "I 'loo 8 ooo 178 aoo 178 ao o
Vapor Migration Model Validation Sample Location s
Control Area Locations
+ + + +
W-W 67,~'Distal Area Locations
Source Area Locations
IJ ~- '° ,h "•~- ~' ✓ I '
»~ „: •.. ,
. .~- u
Near-Su rface Groundwater
Near-Surface Groundwater TCE + + + +i.. + + Q D + +- i -Concentration Greater than 5 pg/L ~ %
/Approximate Lateral Extent of Near-Surface Groundwater - February 2005
Chatswort h Formation Groundwater
_ -0 WS-9 A
TCE Concentration Greater than 5 pg/ L
TCE Concentration Greater than 1000 pg/ L
Approximate Extent of Alluvium Thickness> 5 Fee t
TCE Soil Vapor Results ( Micrograms per Liter Vapor) + + '::. + + + + + + +~, ., . ..< Detection Limit
N
1d,Validatio n d- somping scope
< 10 pg/Lv r d e and f d od ar
solval mat in samplest 4 - d t
_10 to 100 pg/Lv z) Ne
_._~_-~. - ._ •}680 t0- ( 'rL
16711
' ' AVA PPPa
extend anc Ch t dhformation
100 to 1,000 pg/Lv pou r, d, vaterTCE contoursre resert recent2W4/LJLb
" .
ro mC 1,000 to 10,000 pg/Lv informal lot bt d fHaley&Aid h N f e
>10,000 pg /Lv gourdMate ice mpresent yUW condition
s f MWH
>4 ?
ry + + + + + ~_. + +
.~' ,✓."", -~- ~
Base Map Legendrns -11 ,
a,nnnd EeVarn ncon mars
,. .
/ -- ;..... , ...-1780
-17, D SB_- RD-SA
R tl a I e, sm,cwr IIICmmn o
T k (R lnd aNS III Fd-R tl
ODRD SC
\ -~11
Atl zPProx Drat on lA B ]
~ `
ry• O~`y~ once,
RFI S B tl r,
FN,:,OU2rops Cree
L-mold ks
/ ~C -✓~
J,
Dete 0 Ct31 2005ma \YaP\~o~\P~~h\~m~p\vknknvs I l ~
NRD-6
Faat vim-v°
✓
~J + + + + + + + +mt, .o,..,u. m,, . o a
keno v~frx~f{q,a.a~s<, a ro<~ . a r.~.nrr fi+r~~ar,la
,a,zoo 178 300 170000 1704W 170800 174200 1781600 IT8 ooo 178 400 17 81800


![[DTSC] Alternatives Analysis Symposium II …dtsc.ca.gov/PollutionPrevention/.../Thompson_AAII-Presentation.pdf[DTSC] Alternatives Analysis Symposium II Chemical Compliance Systems,](https://img.pdfslide.net/doc/110x75/5ae656d97f8b9a08778cee1a/dtsc-alternatives-analysis-symposium-ii-dtsccagovpollutionpreventionthompsonaaii-.jpg)