Embed Size (px)
Citation preview
South Dakota Public University
System
Facility Utilization Report
Fall 2016
Table of Contents
Page
Introduction ........................................................................................................................1 Section 1: Overall Space Analysis
Assignable Area by Room Codes ............................................................................6
Percent Distribution of Assignable Area by Room Use ........................................7
Net-Assignable Square Feet per Student FTE ......................................................8
Square Feet of Academic Facilities per Student FTE ...........................................9
Residence Hall Utilization .....................................................................................10
Section 2: Classroom Utilization
Average Weekly Room Hours of Instruction in Classrooms .............................12
Average Weekly Use of Student Station in Classrooms .....................................14
Percent Student Station Utilization in Classrooms .............................................16
Assignable Square Feet per Student Station in Classrooms ..............................18
Average Class Size .................................................................................................20
Section 3: Class Lab Utilization
Average Weekly Room Hours of Instruction in Class Labs ..............................23
Average Weekly Use of Student Stations in Class Labs .....................................25
Percent Student Station Utilization in Class Labs ..............................................27
Assignable Square Feet per Student Station in Class Labs ...............................29
Average Class Size .................................................................................................31
Appendix – Room Use Code Definitions ..................................................................... A-1
1
Introduction
The efficient use of campus facilities is a concern to most colleges and universities. This concern is partially a reflection of the high costs involved in constructing and maintaining buildings, but it also stems from a broader recognition of the importance of facility planning. The effective allocation and utilization of space is essential if an institution of higher education is to maximize its resources in accomplishing its objectives in the areas of instruction, research, and public service. The primary purpose of the Facilities Inventory and Utilization Study is to provide higher education administrators with a detailed statistical profile of the facilities on their own campus and of the other public universities in South Dakota. The study was first commissioned by the Board in the fall of 1992. To assure consistency, a facilities manual was developed by the Facilities Task Force, composed of a representative from each institution and the Executive Director’s office, and staff from the Regents Information Systems. The facilities manual is based on the Postsecondary Education Facilities Inventory and Classification Manual, published in May 2006 by the National Center for Education Statistics, and prepared by the National Working Group on Postsecondary Facilities. The current facilities inventory and utilization system functions on Datatel’s Colleague product and is maintained by Regents Information Systems (RIS). The inventory system allows the institutions to track building data including: building name and alpha code, ownership, use (revenue, academic, mixed, etc.), type of construction, year of construction, gross area, construction cost, replacement cost, condition, location, disabled accessibility, and year of major renovation. The system allows the institutions to track room data (classrooms, gyms, labs, offices, etc.) including: room number, floor location, disabled access, room use alpha code (standard set of codes indicating the room use), category code (related to NACUBO programs), department assignment, net square feet, and the number of stations. The inventory system provides the institutions with various reports which sort their inventory in a number of ways. The facilities utilization programs use the inventory data combined with student enrollment data from the Colleague student system to determine classroom and class laboratory facilities utilization. The data you find in this report are summary data taken from the inventory and utilization reports which have been reviewed and verified by the institutions. The study’s purpose is to provide the user with summary data which provide insight into and comparative assessments of the intensity and efficiency of facility utilization and space availability. In short, this publication is intended as an important analytical tool for use in facilities planning.
2
Institutions Included
The study provides data for the six public Regental institutions of higher education in South Dakota as well as the Centers in Sioux Falls and Rapid City. The universities are listed below along with the name of the facilities and registrar contact person from each institution. The inventory of facilities is maintained by the Physical Plant operation and the scheduling of classes is done by the Registrar’s Office. Black Hills State University and Black Hills State University – Rapid City Mr. Randy Culver – Physical Plant Director Ms. April Meeker – Registrar’s Office
Dakota State University Mr. Corey Braskamp – Physical Plant Director Ms. Sandy Anderson – Registrar’s Office
Northern State University Mr. Monte Mehlhoff – Physical Plant Director Ms. Judy Lapka – Registrar’s Office
South Dakota School of Mines & Technology Ms. Jerilyn Roberts – Physical Plant Director Ms. Carla Tiu – Registrar’s Office
South Dakota State University Mr. Dean Kattelmann – V.P. of Facilities & Services Mr. Aaron Aure – Registrar’s Office
University of South Dakota Ms. Roberta Ambur – V.P. of Administration and ITS Ms. Jennifer Thompson – Registrar’s Office
University Center – Sioux Falls Mr. Jim Barkema – Physical Plant Manager Mr. Aaron Anthony – Student Success Coordinator
Types of Data Collected
The study is divided into two sections which attempt to look at various elements of instructional space and overall space assignment and availability. The first section looks at overall instructional space, provides gross space measures per FTE students and breaks down the space into its assigned components. The second section on the
3
utilization of instructional space provides ratios, percentages, and indices which relate the amount of instructional activity in classrooms and class laboratories.
This study is designed to provide only a “snapshot” of institutional facilities at a
particular point in time. Facilities data reflect all buildings which were completed as of October 17, 2016 and only the courses which were scheduled as of October 17, 2016, which is the system extract file date used for reporting information to the U.S. Department of Education's Integrated Postsecondary Education Data System (IPEDS). The data does not take into account any additional instructional activity scheduled off campus.
It should also be noted that different types of institutions will often have very
different space needs. As a result, two institutions with facilities which are equally well-utilized may have significantly different utilization data. Thus, it is generally unwise to attempt to make comparisons between two institutions which are dissimilar in terms of their levels or the instructional programs which they offer. In our environment, comparisons are best made between our comprehensive institutions (BHSU, DSU, NSU) and our research / specialty institutions (USD, SDSU, SDSM&T). Peer comparisons or standards provide the most reliable means of assessment.
Procedures Used in Collecting Data
The South Dakota Board of Regents maintains an annually updated computer-
based facilities inventory of each institution included in the study. A facilities inventory is comprised of a Building Characteristic Report and a Room Characteristic Report. The Building Characteristic Report lists and provides detailed information about each building on an institution's campus. The Room Characteristic Report lists every room in each building and provides information about its size and capacity. Each room is also coded to reflect its use and the institutional programs which it supports.
The institutions maintain their own inventory on the online facilities inventory
system. Each fall the institutions are given a deadline whereby they must have their inventory up to date. RIS extracts the inventory file as of the deadline date. That information is merged with live facility use data and then becomes the file used for utilization purposes.
Space utilization data are based on the fall term courses and student data entered in the Colleague student system by each institution. For each course, the institution provides information indicating when and where the class meets and the number of students enrolled. The Colleague student system data is extracted and run against the updated facilities inventory to generate the Instructional Space Utilization Report. This report indicates how effectively an institution uses its facilities and measures its needs for classroom and laboratory space in relation to comparable institutions.
Both the facilities inventory updates and the utilization data from each school are reviewed by a Board of Regents staff member and the institutions. After each report is
4
run, the institutions are provided with their report so the data can be verified. Extensive computer edits are also used as a means of ensuring accuracy and consistency. When problems are discovered, the institutions are contacted for additional information or corrections. The data integrity and accuracy is ultimately the responsibility of the universities.
Limitations and Special Situations
This study contains reliable and useful information concerning the facilities of
universities in South Dakota and their utilization for instructional purposes. It is important, however, to note two limitations in the data provided.
Although campus facilities would generally be viewed as including such assets as
parking lots, tennis courts, and radio towers, this study is limited to data relating to buildings. For purposes of the study, a building is defined as any roofed structure.
The data elements collected, formats maintained, and statistics generated by the
South Dakota Board of Regents adhere very strongly to nationally developed standards and procedures for facilities inventory and utilization surveying. The standard procedures occasionally will not allow state or individual campus idiosyncrasies to be treated as uniquely as some users would like. For example, classes held in telecommunications studios are not included in classroom utilization data as the rooms are considered special use facilities and not regular classrooms.
It should be noted that the Agricultural Experiment Station farm facilities and
research facilities have been excluded from the analysis. Agricultural Experiment related courses are included in the study.
Analysis of the University Centers in Sioux Falls and Rapid City will be limited
to Sections 2 & 3. Since they do not have the makeup of a traditional college campus, Section 1 would not give a comparable picture.
Black Hills State University – Rapid City
5
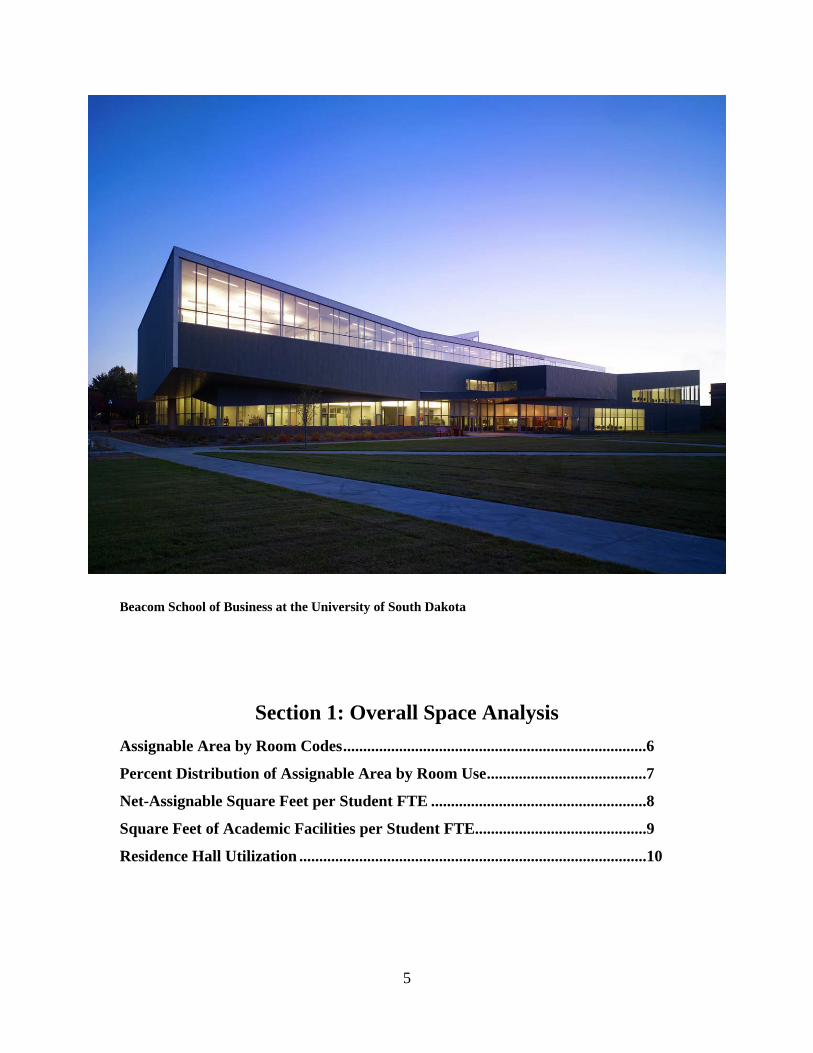
Beacom School of Business at the University of South Dakota
Section 1: Overall Space Analysis
Assignable Area by Room Codes ............................................................................6
Percent Distribution of Assignable Area by Room Use ........................................7
Net-Assignable Square Feet per Student FTE ......................................................8
Square Feet of Academic Facilities per Student FTE...........................................9
Residence Hall Utilization .......................................................................................10
6
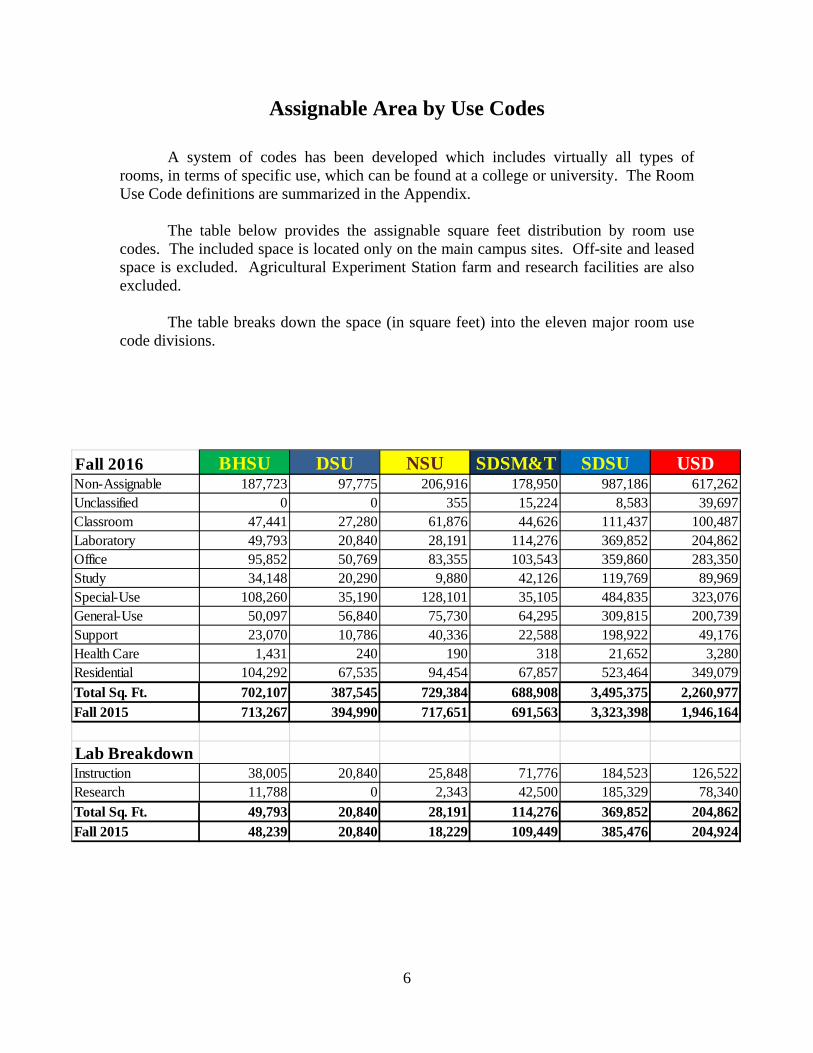
Assignable Area by Use Codes A system of codes has been developed which includes virtually all types of rooms, in terms of specific use, which can be found at a college or university. The Room Use Code definitions are summarized in the Appendix. The table below provides the assignable square feet distribution by room use codes. The included space is located only on the main campus sites. Off-site and leased space is excluded. Agricultural Experiment Station farm and research facilities are also excluded. The table breaks down the space (in square feet) into the eleven major room use code divisions.
Fall 2016 BHSU DSU NSU SDSM&T SDSU USDNon-Assignable 187,723 97,775 206,916 178,950 987,186 617,262Unclassified 0 0 355 15,224 8,583 39,697Classroom 47,441 27,280 61,876 44,626 111,437 100,487Laboratory 49,793 20,840 28,191 114,276 369,852 204,862Office 95,852 50,769 83,355 103,543 359,860 283,350Study 34,148 20,290 9,880 42,126 119,769 89,969Special-Use 108,260 35,190 128,101 35,105 484,835 323,076General-Use 50,097 56,840 75,730 64,295 309,815 200,739Support 23,070 10,786 40,336 22,588 198,922 49,176Health Care 1,431 240 190 318 21,652 3,280Residential 104,292 67,535 94,454 67,857 523,464 349,079
Total Sq. Ft. 702,107 387,545 729,384 688,908 3,495,375 2,260,977Fall 2015 713,267 394,990 717,651 691,563 3,323,398 1,946,164
Lab BreakdownInstruction 38,005 20,840 25,848 71,776 184,523 126,522Research 11,788 0 2,343 42,500 185,329 78,340
Total Sq. Ft. 49,793 20,840 28,191 114,276 369,852 204,862Fall 2015 48,239 20,840 18,229 109,449 385,476 204,924
7
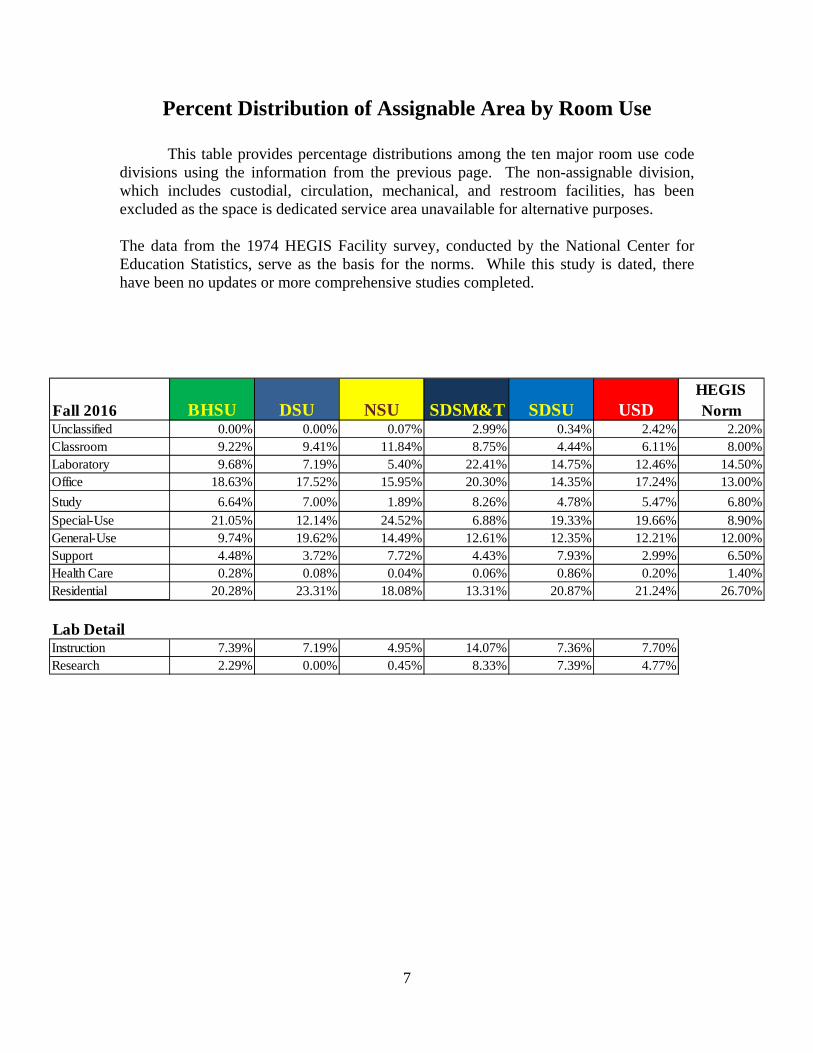
Percent Distribution of Assignable Area by Room Use
This table provides percentage distributions among the ten major room use code divisions using the information from the previous page. The non-assignable division, which includes custodial, circulation, mechanical, and restroom facilities, has been excluded as the space is dedicated service area unavailable for alternative purposes. The data from the 1974 HEGIS Facility survey, conducted by the National Center for Education Statistics, serve as the basis for the norms. While this study is dated, there have been no updates or more comprehensive studies completed.
Fall 2016 BHSU DSU NSU SDSM&T SDSU USDHEGIS Norm
Unclassified 0.00% 0.00% 0.07% 2.99% 0.34% 2.42% 2.20%Classroom 9.22% 9.41% 11.84% 8.75% 4.44% 6.11% 8.00%Laboratory 9.68% 7.19% 5.40% 22.41% 14.75% 12.46% 14.50%Office 18.63% 17.52% 15.95% 20.30% 14.35% 17.24% 13.00%
Study 6.64% 7.00% 1.89% 8.26% 4.78% 5.47% 6.80%Special-Use 21.05% 12.14% 24.52% 6.88% 19.33% 19.66% 8.90%General-Use 9.74% 19.62% 14.49% 12.61% 12.35% 12.21% 12.00%Support 4.48% 3.72% 7.72% 4.43% 7.93% 2.99% 6.50%Health Care 0.28% 0.08% 0.04% 0.06% 0.86% 0.20% 1.40%Residential 20.28% 23.31% 18.08% 13.31% 20.87% 21.24% 26.70%
Lab DetailInstruction 7.39% 7.19% 4.95% 14.07% 7.36% 7.70%Research 2.29% 0.00% 0.45% 8.33% 7.39% 4.77%
8
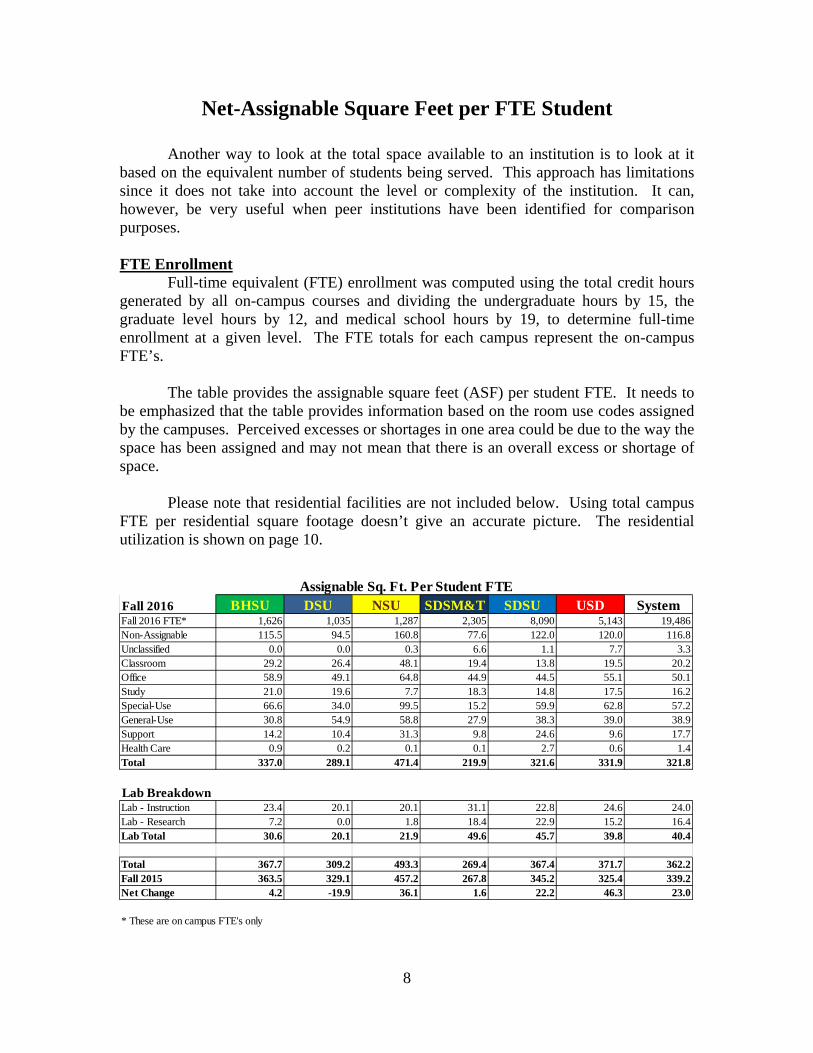
Net-Assignable Square Feet per FTE Student
Another way to look at the total space available to an institution is to look at it based on the equivalent number of students being served. This approach has limitations since it does not take into account the level or complexity of the institution. It can, however, be very useful when peer institutions have been identified for comparison purposes. FTE Enrollment
Full-time equivalent (FTE) enrollment was computed using the total credit hours generated by all on-campus courses and dividing the undergraduate hours by 15, the graduate level hours by 12, and medical school hours by 19, to determine full-time enrollment at a given level. The FTE totals for each campus represent the on-campus FTE’s.
The table provides the assignable square feet (ASF) per student FTE. It needs to
be emphasized that the table provides information based on the room use codes assigned by the campuses. Perceived excesses or shortages in one area could be due to the way the space has been assigned and may not mean that there is an overall excess or shortage of space.
Please note that residential facilities are not included below. Using total campus
FTE per residential square footage doesn’t give an accurate picture. The residential utilization is shown on page 10.
Fall 2016 BHSU DSU NSU SDSM&T SDSU USD SystemFall 2016 FTE* 1,626 1,035 1,287 2,305 8,090 5,143 19,486Non-Assignable 115.5 94.5 160.8 77.6 122.0 120.0 116.8Unclassified 0.0 0.0 0.3 6.6 1.1 7.7 3.3Classroom 29.2 26.4 48.1 19.4 13.8 19.5 20.2Office 58.9 49.1 64.8 44.9 44.5 55.1 50.1Study 21.0 19.6 7.7 18.3 14.8 17.5 16.2Special-Use 66.6 34.0 99.5 15.2 59.9 62.8 57.2General-Use 30.8 54.9 58.8 27.9 38.3 39.0 38.9Support 14.2 10.4 31.3 9.8 24.6 9.6 17.7Health Care 0.9 0.2 0.1 0.1 2.7 0.6 1.4Total 337.0 289.1 471.4 219.9 321.6 331.9 321.8
Lab BreakdownLab - Instruction 23.4 20.1 20.1 31.1 22.8 24.6 24.0Lab - Research 7.2 0.0 1.8 18.4 22.9 15.2 16.4Lab Total 30.6 20.1 21.9 49.6 45.7 39.8 40.4
Total 367.7 309.2 493.3 269.4 367.4 371.7 362.2Fall 2015 363.5 329.1 457.2 267.8 345.2 325.4 339.2Net Change 4.2 -19.9 36.1 1.6 22.2 46.3 23.0
* These are on campus FTE's only
Assignable Sq. Ft. Per Student FTE
9
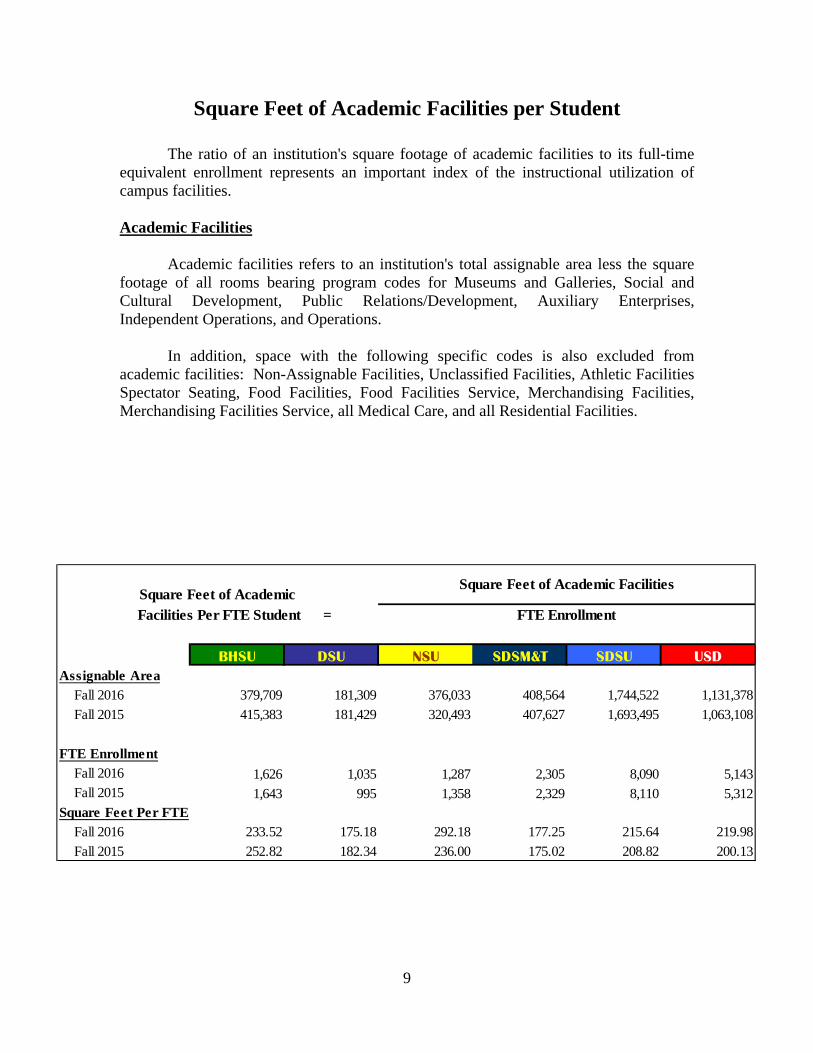
Square Feet of Academic Facilities per Student
The ratio of an institution's square footage of academic facilities to its full-time equivalent enrollment represents an important index of the instructional utilization of campus facilities.
Academic Facilities
Academic facilities refers to an institution's total assignable area less the square footage of all rooms bearing program codes for Museums and Galleries, Social and Cultural Development, Public Relations/Development, Auxiliary Enterprises, Independent Operations, and Operations.
In addition, space with the following specific codes is also excluded from
academic facilities: Non-Assignable Facilities, Unclassified Facilities, Athletic Facilities Spectator Seating, Food Facilities, Food Facilities Service, Merchandising Facilities, Merchandising Facilities Service, all Medical Care, and all Residential Facilities.
BHSU DSU NSU SDSM&T SDSU USD
Assignable Area
Fall 2016 379,709 181,309 376,033 408,564 1,744,522 1,131,378
Fall 2015 415,383 181,429 320,493 407,627 1,693,495 1,063,108
FTE Enrollment
Fall 2016 1,626 1,035 1,287 2,305 8,090 5,143 Fall 2015 1,643 995 1,358 2,329 8,110 5,312Square Feet Per FTE
Fall 2016 233.52 175.18 292.18 177.25 215.64 219.98
Fall 2015 252.82 182.34 236.00 175.02 208.82 200.13
Square Feet of Academic Facilities
FTE EnrollmentSquare Feet of Academic
Facilities Per FTE Student =
10
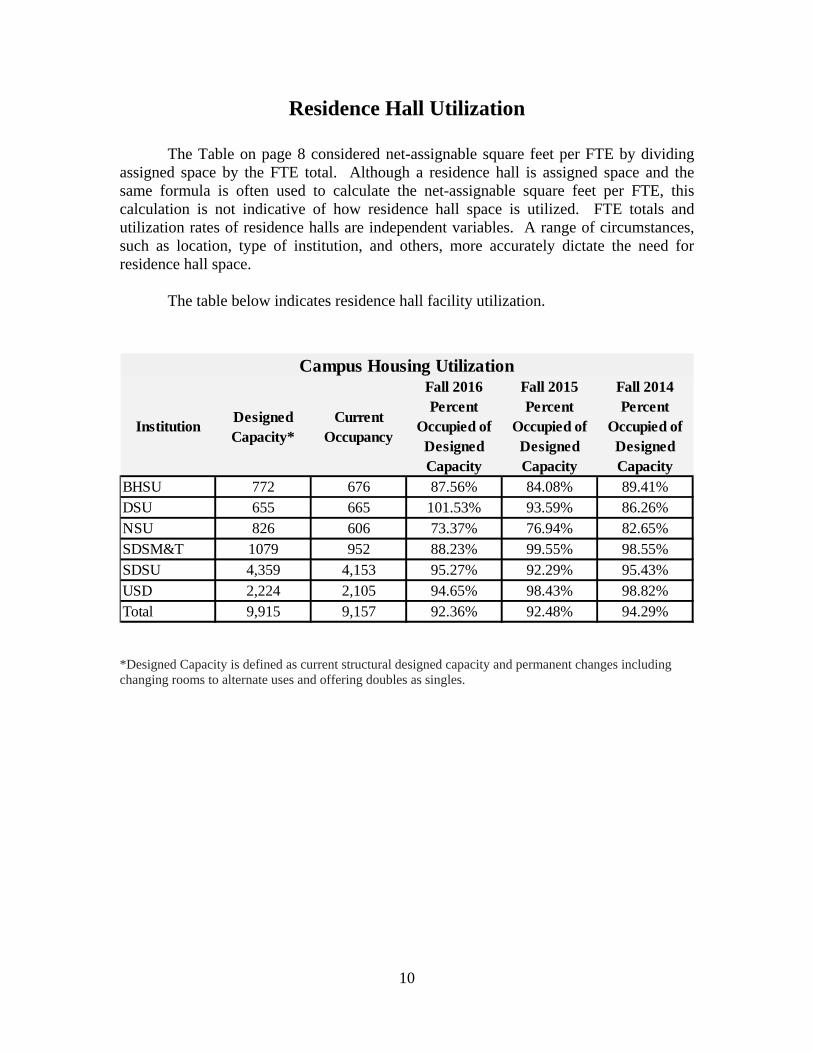
Residence Hall Utilization
The Table on page 8 considered net-assignable square feet per FTE by dividing assigned space by the FTE total. Although a residence hall is assigned space and the same formula is often used to calculate the net-assignable square feet per FTE, this calculation is not indicative of how residence hall space is utilized. FTE totals and utilization rates of residence halls are independent variables. A range of circumstances, such as location, type of institution, and others, more accurately dictate the need for residence hall space.
The table below indicates residence hall facility utilization.
InstitutionDesigned Capacity*
Current Occupancy
Fall 2016 Percent
Occupied of Designed Capacity
Fall 2015 Percent
Occupied of Designed Capacity
Fall 2014 Percent
Occupied of Designed Capacity
BHSU 772 676 87.56% 84.08% 89.41%DSU 655 665 101.53% 93.59% 86.26%NSU 826 606 73.37% 76.94% 82.65%SDSM&T 1079 952 88.23% 99.55% 98.55%SDSU 4,359 4,153 95.27% 92.29% 95.43%USD 2,224 2,105 94.65% 98.43% 98.82%Total 9,915 9,157 92.36% 92.48% 94.29%
Campus Housing Utilization
*Designed Capacity is defined as current structural designed capacity and permanent changes including changing rooms to alternate uses and offering doubles as singles.
11
Chemical and Biological Engineering and Chemistry Building at SD School of Mines and Technology
Section 2: Classroom Utilization
Average Weekly Room Hours of Instruction ....................................................................12
Average Weekly Use of Student Stations ...........................................................................14
Percent Student Station Utilization ....................................................................................16
Assignable Square Feet per Student Station .....................................................................18
Average Class Size ...............................................................................................................2
12
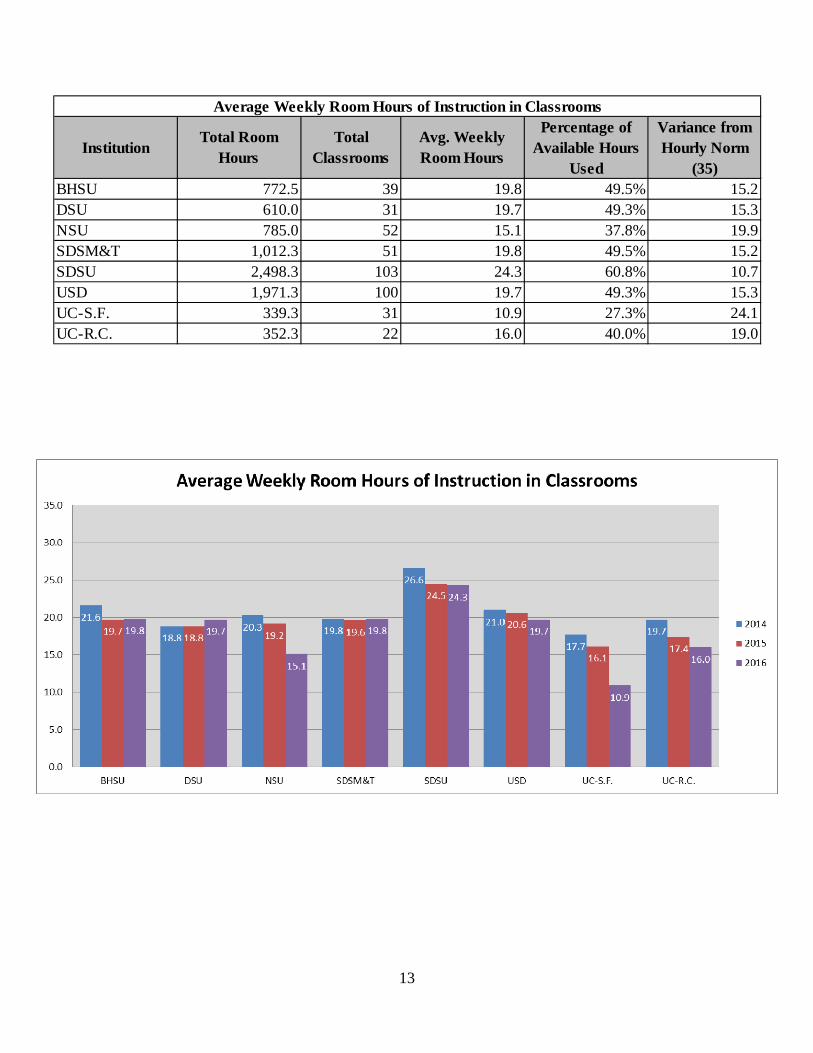
Average Weekly Room Hours of Instruction in Classrooms
The average weekly room hours of instruction is calculated by dividing the total room hours of instruction by the total number of classrooms. In more general terms, it is the average number of hours that an institution's classrooms are used for instructional purposes each week. The total room hours of instruction is the number of hours each week that each classroom is used for regularly scheduled classes. Thus, a classroom which is used Mondays, Wednesdays, and Fridays from 9:00 a.m. until 10:00 a.m. and on Tuesdays and Thursdays from 8:30 a.m. until 10:45 a.m. would generate 5.5 room hours (1 hour/day x 3 days/week + 1.25 hour/day x 2 days/week).
Average Weekly Room Hours of Instruction
=
Total Room Hours of Instruction Total Number of Rooms
The column “Percentage of Available Hours Used” assumes that every classroom
is available for use 40 hours per week. This percentage is calculated by taking the total room hours and dividing it by the product of the number of classrooms multiplied by 40.
Classrooms
For purposes of this study, a classroom is defined as a room used to conduct class that doesn’t require special-purpose equipment for student use. Thus, a classroom is, by definition, a general use facility which could be used for teaching the lecture portion of any course. If a room is used for regularly scheduled classes but has special equipment which ties it to a particular subject matter, the room is a class laboratory and its use would not be taken into account in this calculation.
The average weekly room hours of classroom instruction can serve as an indicator
of the adequacy of the number of classrooms at an institution. An average of 35 hours of classroom instruction per week is the norm sought after. All of the South Dakota institutions fall well below the 35 hours of use per week, indicating ample classroom availability.
13
InstitutionTotal Room
HoursTotal
ClassroomsAvg. Weekly Room Hours
Percentage of Available Hours
Used
Variance from Hourly Norm
(35)BHSU 772.5 39 19.8 49.5% 15.2DSU 610.0 31 19.7 49.3% 15.3NSU 785.0 52 15.1 37.8% 19.9SDSM&T 1,012.3 51 19.8 49.5% 15.2SDSU 2,498.3 103 24.3 60.8% 10.7USD 1,971.3 100 19.7 49.3% 15.3UC-S.F. 339.3 31 10.9 27.3% 24.1UC-R.C. 352.3 22 16.0 40.0% 19.0
Average Weekly Room Hours of Instruction in Classrooms
14
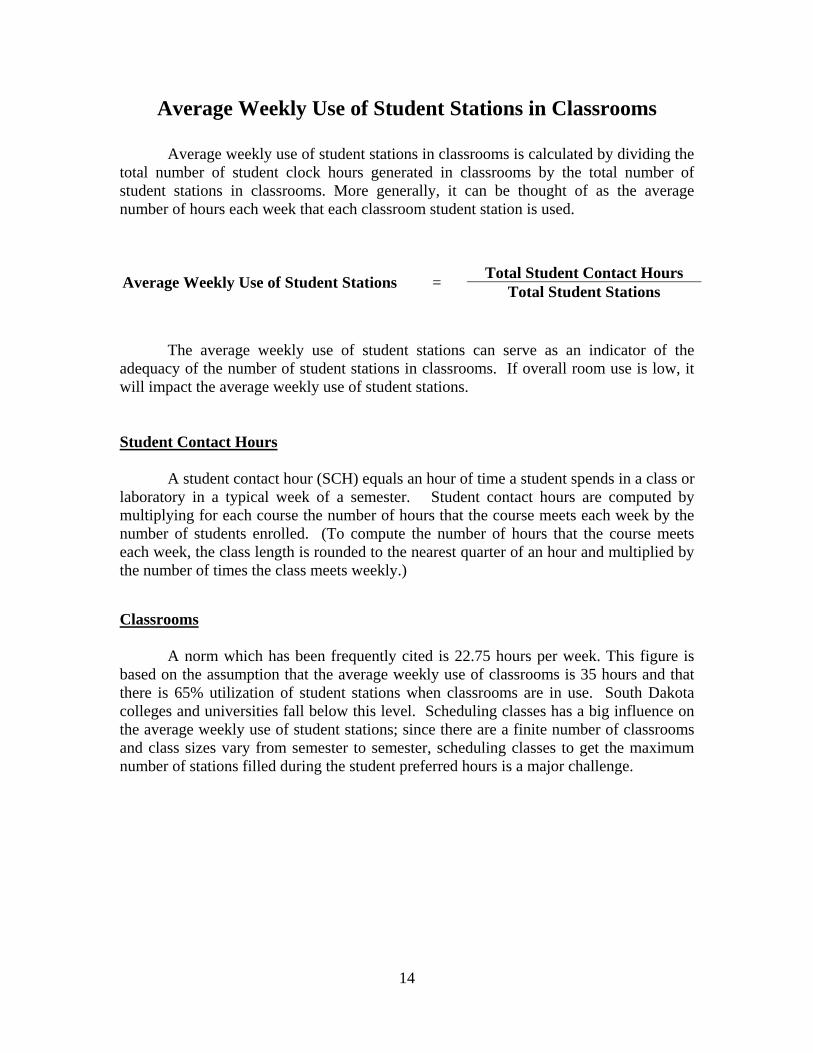
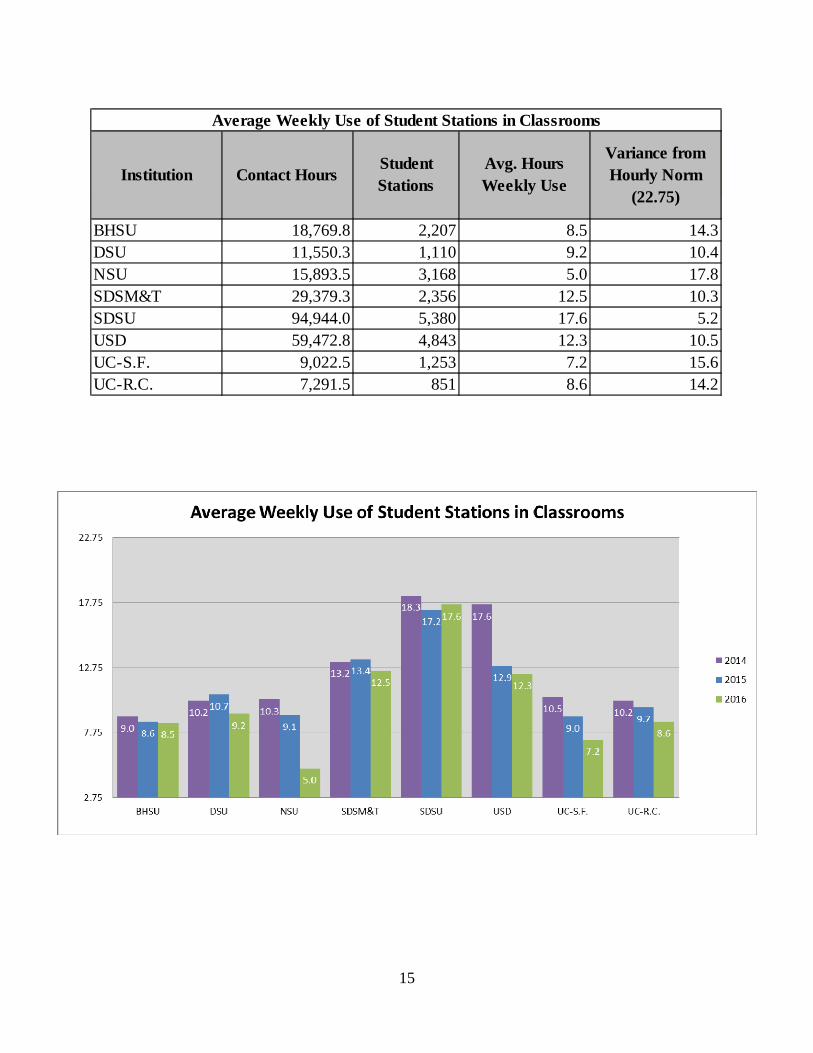
Average Weekly Use of Student Stations in Classrooms
Average weekly use of student stations in classrooms is calculated by dividing the
total number of student clock hours generated in classrooms by the total number of student stations in classrooms. More generally, it can be thought of as the average number of hours each week that each classroom student station is used.
Average Weekly Use of Student Stations = Total Student Contact Hours
Total Student Stations
The average weekly use of student stations can serve as an indicator of the adequacy of the number of student stations in classrooms. If overall room use is low, it will impact the average weekly use of student stations. Student Contact Hours A student contact hour (SCH) equals an hour of time a student spends in a class or laboratory in a typical week of a semester. Student contact hours are computed by multiplying for each course the number of hours that the course meets each week by the number of students enrolled. (To compute the number of hours that the course meets each week, the class length is rounded to the nearest quarter of an hour and multiplied by the number of times the class meets weekly.)
Classrooms
A norm which has been frequently cited is 22.75 hours per week. This figure is based on the assumption that the average weekly use of classrooms is 35 hours and that there is 65% utilization of student stations when classrooms are in use. South Dakota colleges and universities fall below this level. Scheduling classes has a big influence on the average weekly use of student stations; since there are a finite number of classrooms and class sizes vary from semester to semester, scheduling classes to get the maximum number of stations filled during the student preferred hours is a major challenge.
15
BHSU 18,769.8 2,207 8.5 14.3DSU 11,550.3 1,110 9.2 10.4NSU 15,893.5 3,168 5.0 17.8SDSM&T 29,379.3 2,356 12.5 10.3SDSU 94,944.0 5,380 17.6 5.2USD 59,472.8 4,843 12.3 10.5UC-S.F. 9,022.5 1,253 7.2 15.6UC-R.C. 7,291.5 851 8.6 14.2
Average Weekly Use of Student Stations in Classrooms
Variance from Hourly Norm
(22.75)Institution Contact Hours
Student Stations
Avg. Hours Weekly Use
16
Percent Student Station Utilization in Classrooms
Percent student station utilization indicates the average percentage of student stations that are occupied when classroom are in use. It is calculated by dividing the student clock hours generated in classrooms by the potential student clock hours for classrooms or class labs and multiplying by 100 to convert to a percentage. Potential student clock hours are computed on a room-by-room basis by multiplying the number of student stations in each room by the room hours of instruction generated by the room. It indicates the number of student clock hours which would be generated if every room were filled to capacity (i.e., if the number of students equaled the number of stations) each time a course met in the room.
It needs to be emphasized that the percent student station utilization assesses the
utilization of rooms only when they are in use. This figure is therefore a helpful indicator of how close to capacity an institution's courses are to the rooms in which they are scheduled. It does not, however, indicate the overall efficiency of utilization since it does not take into account how frequently a room is used.
Percent Student Station Utilization = Student Contact Hours
Potential Student Contact Hours
Classrooms
A frequently cited norm for percent student station utilization is 65% for classrooms.
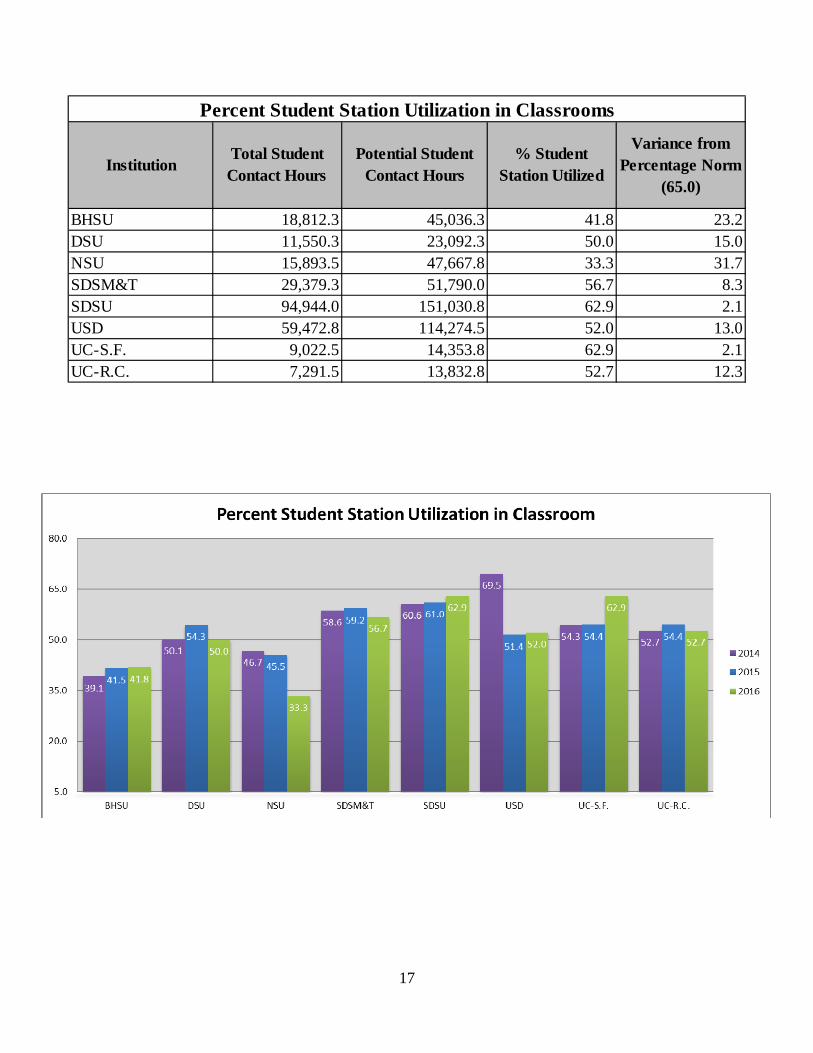
17
BHSU 18,812.3 45,036.3 41.8 23.2DSU 11,550.3 23,092.3 50.0 15.0NSU 15,893.5 47,667.8 33.3 31.7SDSM&T 29,379.3 51,790.0 56.7 8.3SDSU 94,944.0 151,030.8 62.9 2.1USD 59,472.8 114,274.5 52.0 13.0UC-S.F. 9,022.5 14,353.8 62.9 2.1UC-R.C. 7,291.5 13,832.8 52.7 12.3
Percent Student Station Utilization in Classrooms
Variance from Percentage Norm
(65.0)Institution
Total Student Contact Hours
Potential Student Contact Hours
% Student Station Utilized
18
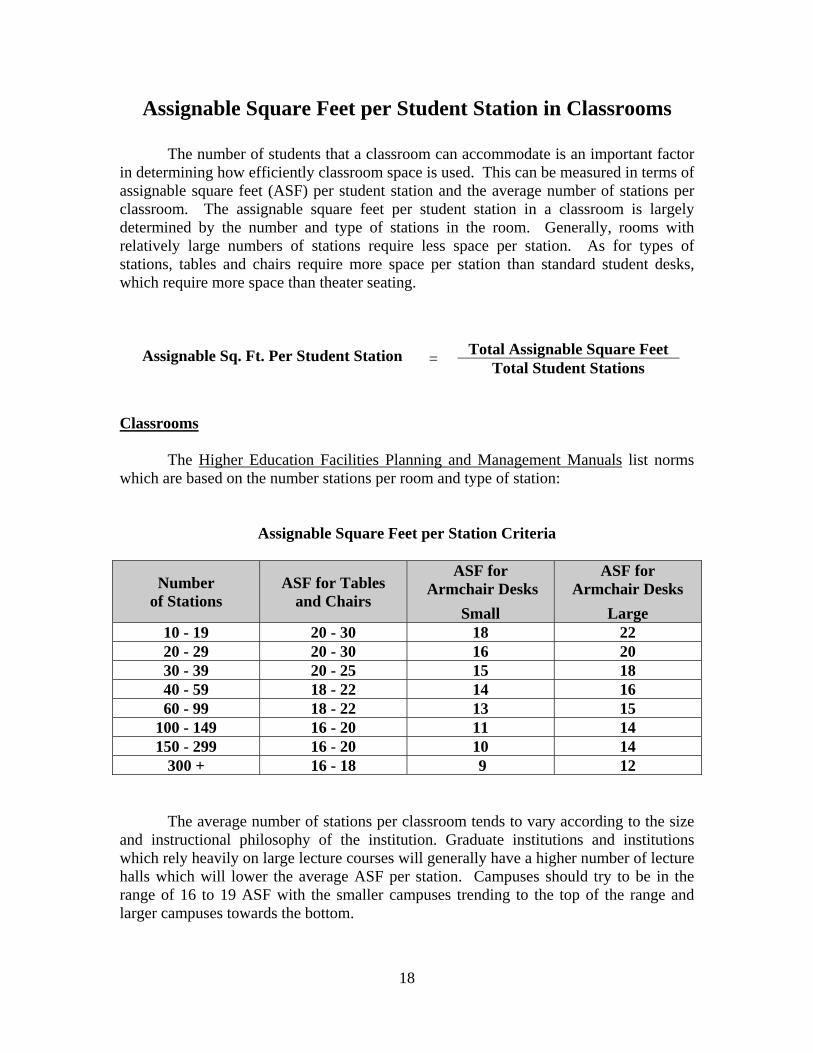
Assignable Square Feet per Student Station in Classrooms
The number of students that a classroom can accommodate is an important factor
in determining how efficiently classroom space is used. This can be measured in terms of assignable square feet (ASF) per student station and the average number of stations per classroom. The assignable square feet per student station in a classroom is largely determined by the number and type of stations in the room. Generally, rooms with relatively large numbers of stations require less space per station. As for types of stations, tables and chairs require more space per station than standard student desks, which require more space than theater seating.
Assignable Sq. Ft. Per Student Station
= Total Assignable Square Feet
Total Student Stations Classrooms
The Higher Education Facilities Planning and Management Manuals list norms
which are based on the number stations per room and type of station:
Assignable Square Feet per Station Criteria
Number of Stations
ASF for Tables and Chairs
ASF for Armchair Desks
Small
ASF for Armchair Desks
Large 10 - 19 20 - 30 18 22 20 - 29 20 - 30 16 20 30 - 39 20 - 25 15 18 40 - 59 18 - 22 14 16 60 - 99 18 - 22 13 15
100 - 149 16 - 20 11 14 150 - 299 16 - 20 10 14
300 + 16 - 18 9 12
The average number of stations per classroom tends to vary according to the size
and instructional philosophy of the institution. Graduate institutions and institutions which rely heavily on large lecture courses will generally have a higher number of lecture halls which will lower the average ASF per station. Campuses should try to be in the range of 16 to 19 ASF with the smaller campuses trending to the top of the range and larger campuses towards the bottom.
19
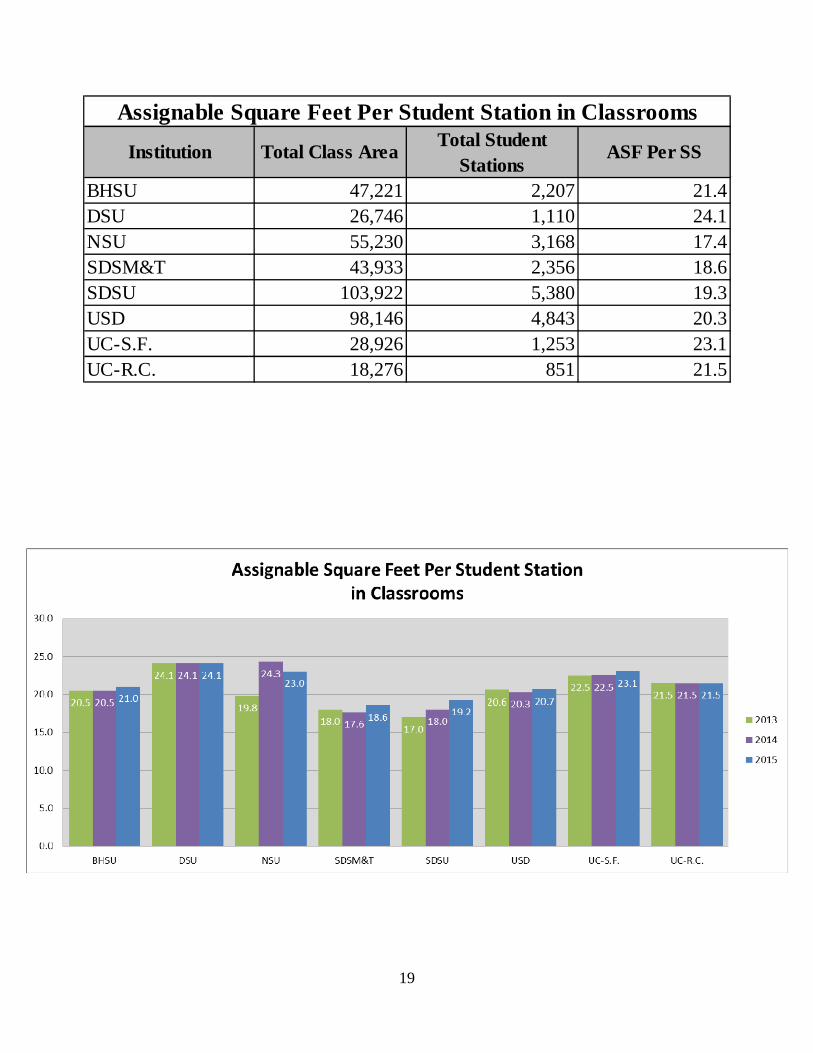
BHSU 47,221 2,207 21.4DSU 26,746 1,110 24.1NSU 55,230 3,168 17.4SDSM&T 43,933 2,356 18.6SDSU 103,922 5,380 19.3USD 98,146 4,843 20.3UC-S.F. 28,926 1,253 23.1UC-R.C. 18,276 851 21.5
Assignable Square Feet Per Student Station in Classrooms
Institution Total Class AreaTotal Student
StationsASF Per SS
20
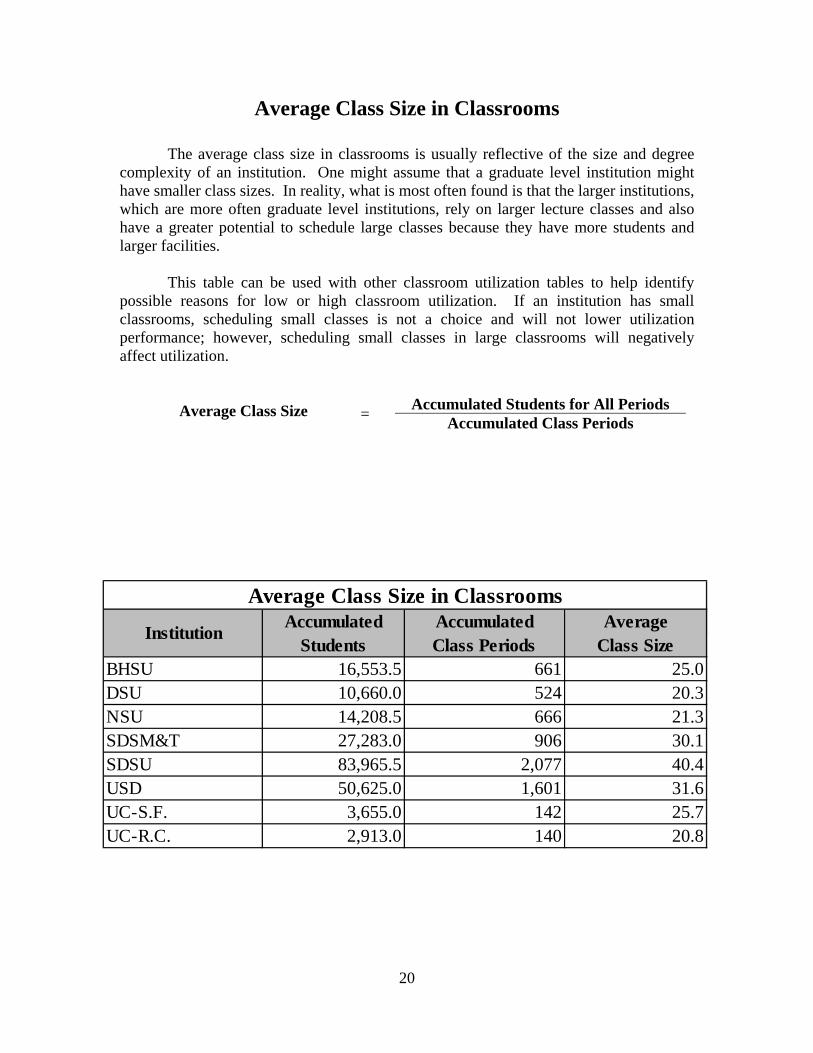
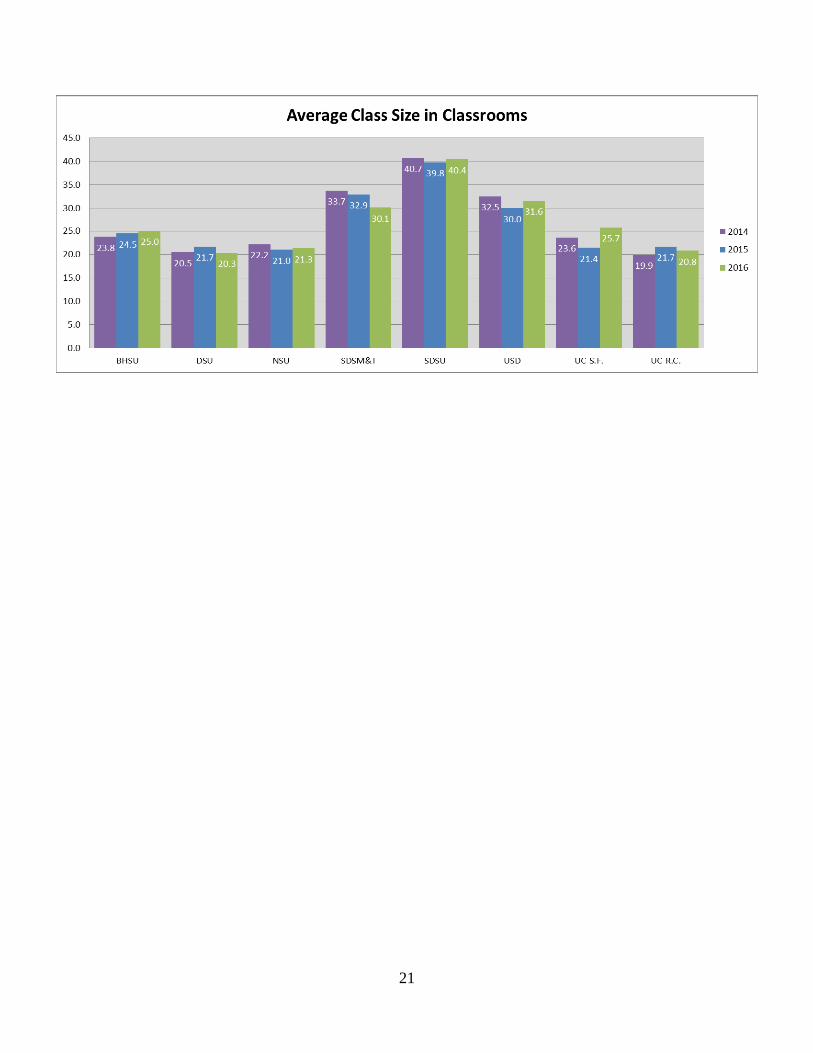
Average Class Size in Classrooms The average class size in classrooms is usually reflective of the size and degree complexity of an institution. One might assume that a graduate level institution might have smaller class sizes. In reality, what is most often found is that the larger institutions, which are more often graduate level institutions, rely on larger lecture classes and also have a greater potential to schedule large classes because they have more students and larger facilities. This table can be used with other classroom utilization tables to help identify possible reasons for low or high classroom utilization. If an institution has small classrooms, scheduling small classes is not a choice and will not lower utilization performance; however, scheduling small classes in large classrooms will negatively affect utilization.
Average Class Size
= Accumulated Students for All Periods
Accumulated Class Periods
BHSU 16,553.5 661 25.0DSU 10,660.0 524 20.3NSU 14,208.5 666 21.3SDSM&T 27,283.0 906 30.1SDSU 83,965.5 2,077 40.4USD 50,625.0 1,601 31.6UC-S.F. 3,655.0 142 25.7UC-R.C. 2,913.0 140 20.8
Average Class Size in Classrooms
InstitutionAccumulated
StudentsAccumulated Class Periods
Average Class Size
21
22
Avera Health Science Center at South Dakota State University
Section 2: Class Laboratory Utilization
Average Weekly Room Hours of Instruction ....................................................................23
Average Weekly Use of Student Stations ...........................................................................25
Percent Student Station Utilization ....................................................................................27
Assignable Square Feet per Student Station .....................................................................29
Average Class Size ...............................................................................................................31
23
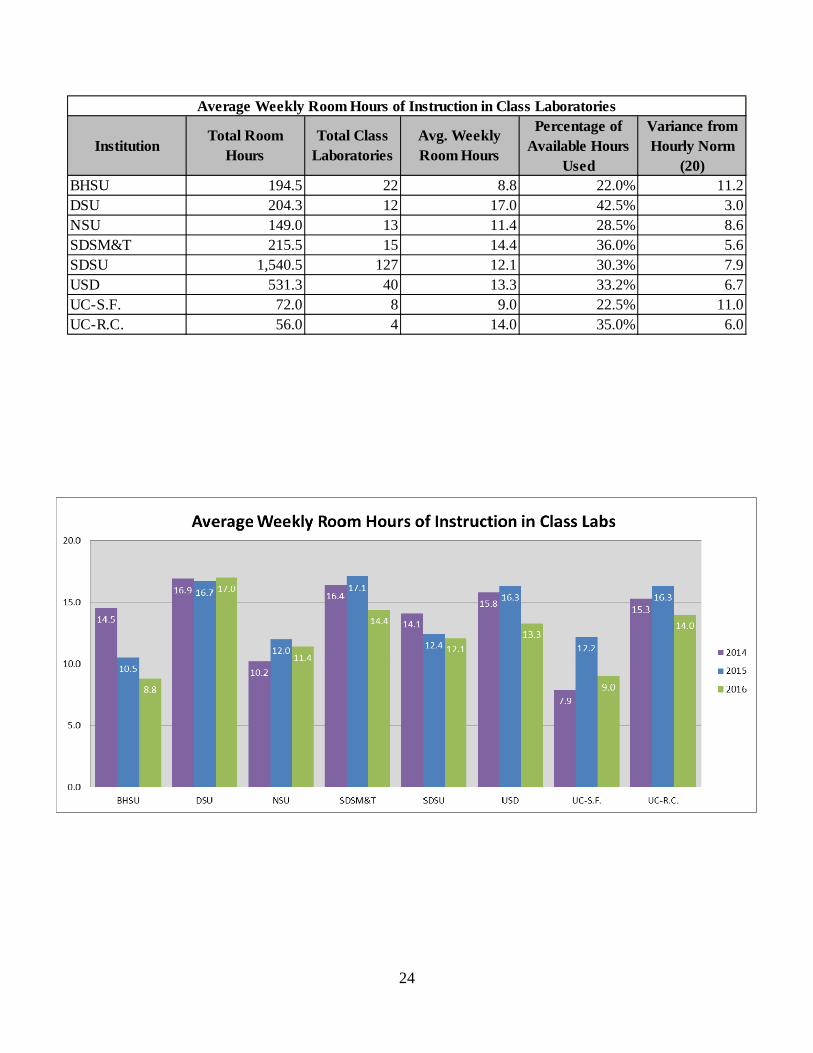
Average Weekly Room Hours of Instruction in Class Labs
The average weekly room hours of instruction is calculated by dividing the total room hours of instruction by the total number of class labs. In more general terms, it is the average number of hours that an institution’s class labs are used for instructional purposes each week. The total room hours of instruction is the number of hours each week that each class lab is used for regularly scheduled classes. Thus, a class lab which is used Mondays, Wednesdays, and Fridays from 9:00 a.m. until 10:00 a.m. and on Tuesdays and Thursdays from 8:30 a.m. until 10:45 a.m. would generate 5.5 room hours (1 hour/day x 3 days/week + 1.25 hour/day x 2 days/week).
Average Weekly Room Hours of Instruction
=
Total Room Hours of Instruction Total Number of Rooms
The column “Percentage of Available Hours Used” assumes that every class lab is
available for use 40 hours per week. This percentage is calculated by taking the total room hours and dividing it by the product of the number of classrooms multiplied by 40. Class Laboratories For purposes of this study, a class laboratory is defined as a room used primarily for regularly scheduled classes that require special-purpose equipment for student participation, experimentation, observation, or practice in a field of study. This definition excludes room use for regularly scheduled classes (i.e., classrooms) which have no special-purpose equipment and also excludes rooms with special-purpose equipment which are not used for regularly scheduled classes (i.e., other kinds of laboratories).
Because each class laboratory is designed for use in a particular field of study, most of them are not used as frequently as classrooms. A commonly cited norm for the average use of class laboratories is 20 hours per week. BHSU, DSU, and SDSU show the highest use of class labs. NSU and USD fall well below the norm. SDSM&T labs are very specialized which would lower their average.
24
InstitutionTotal Room
HoursTotal Class
LaboratoriesAvg. Weekly Room Hours
Percentage of Available Hours
Used
Variance from Hourly Norm
(20)BHSU 194.5 22 8.8 22.0% 11.2DSU 204.3 12 17.0 42.5% 3.0NSU 149.0 13 11.4 28.5% 8.6SDSM&T 215.5 15 14.4 36.0% 5.6SDSU 1,540.5 127 12.1 30.3% 7.9USD 531.3 40 13.3 33.2% 6.7UC-S.F. 72.0 8 9.0 22.5% 11.0UC-R.C. 56.0 4 14.0 35.0% 6.0
Average Weekly Room Hours of Instruction in Class Laboratories
25
Average Weekly Use of Student Stations in Class Labs
Average weekly use of student stations in class laboratories is calculated by
dividing the total number of student clock hours generated in class laboratories by the total number of student stations in class laboratories. More generally, it can be thought of as the average number of hours each week that each class laboratory student station is used.
Average Weekly Use of Student Stations = Total Student Contact Hours
Total Student Stations
The average weekly use of student stations can serve as an indicator of the adequacy of the number of student stations in class laboratories. Student Contact Hours A student contact hour (SCH) equals an hour of time a student spends in a class or laboratory in a typical week of a semester. Student contact hours are computed by multiplying for each course the number of hours that the course meets each week by the number of students enrolled. (To compute the number of hours that the course meets each week, the class length is rounded to the nearest quarter of an hour and multiplied by the number of times the class meets weekly.)
Class Laboratories
A norm which has been frequently cited is 16 hours per week. This figure is based on the assumption that the average weekly use of class laboratories is 20 hours and that there is 80% utilization of student stations when class laboratories are in use. All South Dakota universities fall below this norm. This fact suggests a surplus of class laboratory student stations but gives no indication whether this surplus exists for all types of class laboratories or is limited to the laboratories of certain academic disciplines.
26
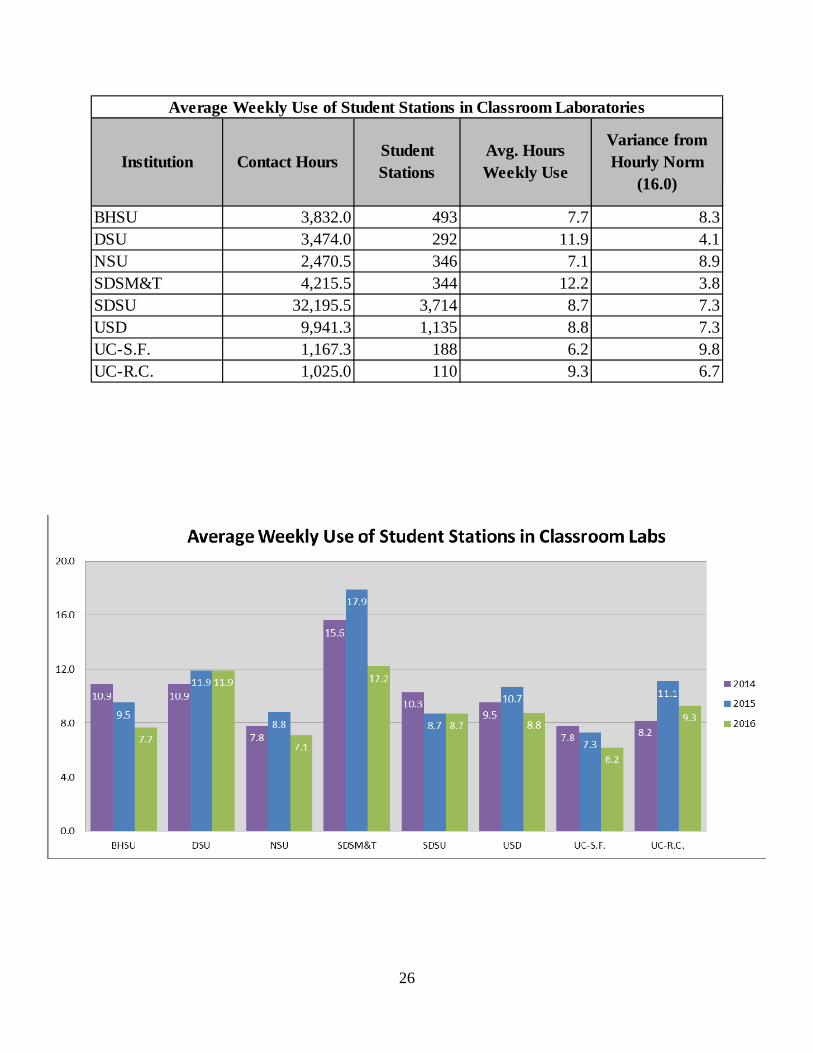
BHSU 3,832.0 493 7.7 8.3DSU 3,474.0 292 11.9 4.1NSU 2,470.5 346 7.1 8.9SDSM&T 4,215.5 344 12.2 3.8SDSU 32,195.5 3,714 8.7 7.3USD 9,941.3 1,135 8.8 7.3UC-S.F. 1,167.3 188 6.2 9.8UC-R.C. 1,025.0 110 9.3 6.7
Average Weekly Use of Student Stations in Classroom Laboratories
Variance from Hourly Norm
(16.0)Institution Contact Hours
Student Stations
Avg. Hours Weekly Use
27
Percent Student Station Utilization
Percent student station utilization indicates the average percentage of student
stations that are occupied when class laboratories are in use. It is calculated by dividing the student clock hours generated in class labs by the potential student clock hours for class labs and multiplying by 100 to convert to a percentage. Potential student clock hours are computed on a room-by-room basis by multiplying the number of student stations in each room by the room hours of instruction generated by the room. It indicates the number of student clock hours which would be generated if every room were filled to capacity (i.e., if the number of students equaled the number of stations) each time a course met in the room.
It needs to be emphasized that the percent student station utilization assesses the
utilization of rooms only when they are in use. This figure is therefore a helpful indicator of how close to capacity an institution's courses are to the rooms in which they are scheduled. It does not, however, indicate the overall efficiency of utilization since it does not take into account how frequently a room is used.
Percent Student Station Utilization = Student Contact Hours
Potential Student Contact Hours
Class Laboratories
A frequently cited norm for percent student station utilization is 80% for class laboratories. The higher percentage for class labs versus classrooms reflects the assumption that these rooms, although used less frequently than classrooms because of their specialized equipment, are usually closer to being filled to capacity when they are in use.
28
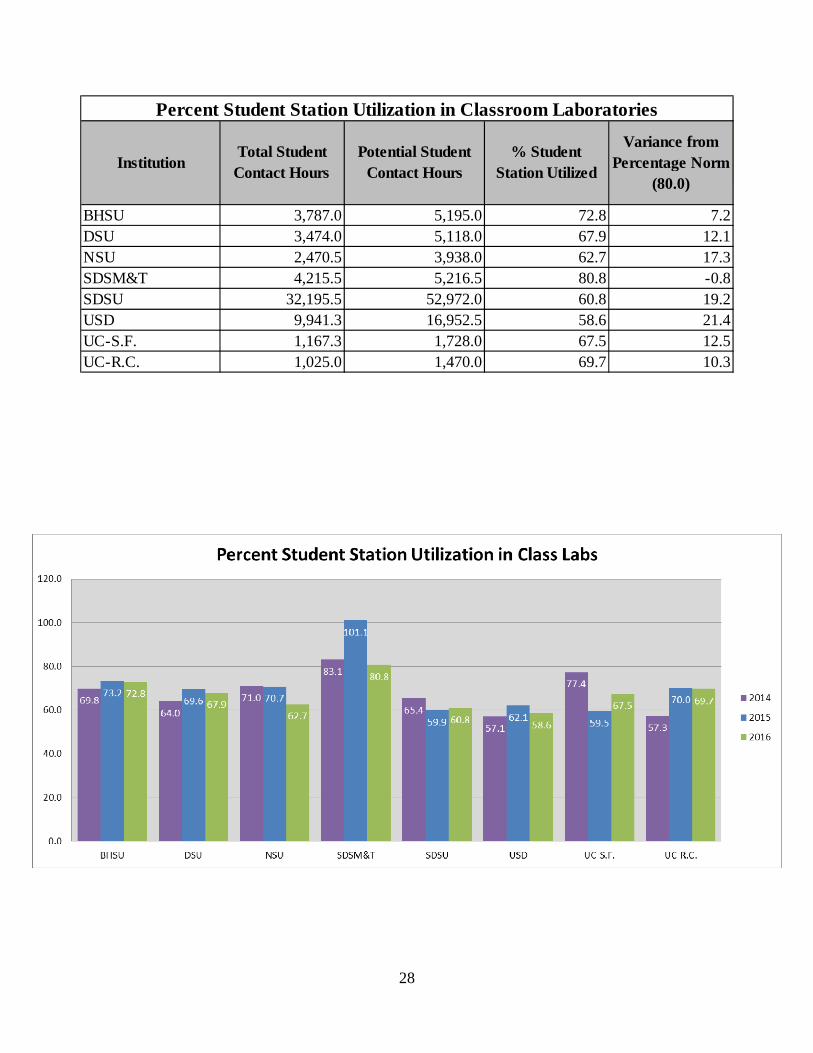
BHSU 3,787.0 5,195.0 72.8 7.2DSU 3,474.0 5,118.0 67.9 12.1NSU 2,470.5 3,938.0 62.7 17.3SDSM&T 4,215.5 5,216.5 80.8 -0.8SDSU 32,195.5 52,972.0 60.8 19.2USD 9,941.3 16,952.5 58.6 21.4UC-S.F. 1,167.3 1,728.0 67.5 12.5UC-R.C. 1,025.0 1,470.0 69.7 10.3
InstitutionTotal Student
Contact HoursPotential Student
Contact Hours% Student
Station Utilized
Percent Student Station Utilization in Classroom Laboratories
Variance from Percentage Norm
(80.0)
29
Assignable Square Feet per Student Station
The number of students that a classroom can accommodate is an important factor in determining how efficiently classroom space is used. This can be measured in terms of assignable square feet per student station and the average number of stations per classroom. The assignable square feet per student station in a classroom is largely determined by the number and type of stations in the room. Generally, rooms with relatively large numbers of stations require less space per station. As for types of stations, tables and chairs require more space per station than standard student desks, which require more space than theater seating.
Assignable Sq. Ft. per Student Station
= Total Assignable Square Feet
Total Student Stations Class Laboratories The square footage per student station (SS) in class laboratories varies to a greater extent than in classrooms because of the widely differing space requirements of the various kinds of laboratories. An automotive lab, for example, usually requires much more space per station than a chemistry lab. In general, institutions which offer academic programs in such areas as agriculture, engineering, or medicine require more class lab space per station than do institutions which focus on liberal arts, business, and education. Moreover, graduate level laboratories usually require more space per station than undergraduate labs. Based on ranges provided by the Higher Education Facilities Planning and Management Manuals, South Dakota laboratories could range from 30 ASF for a biology lab to 70 ASF for an engineering lab. Given the various types of laboratories and the wide range of standards it is difficult to analyze class laboratories without giving some consideration to the level of the institution and the disciplines offered.
30
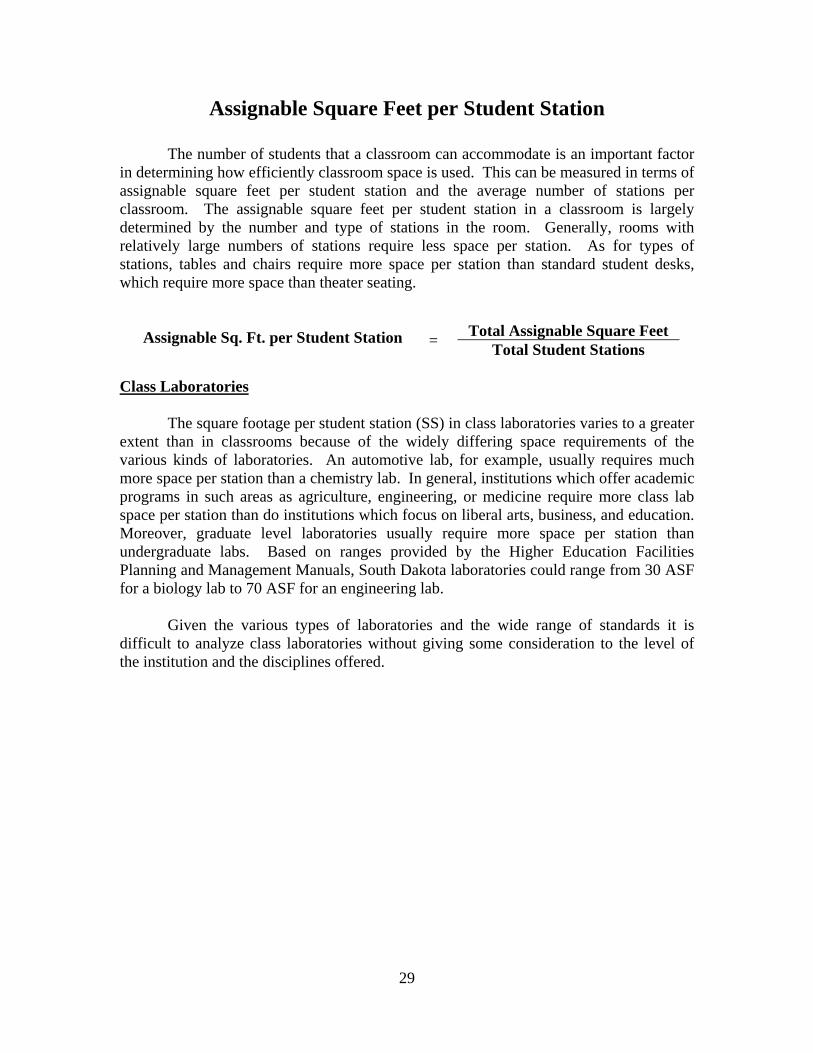
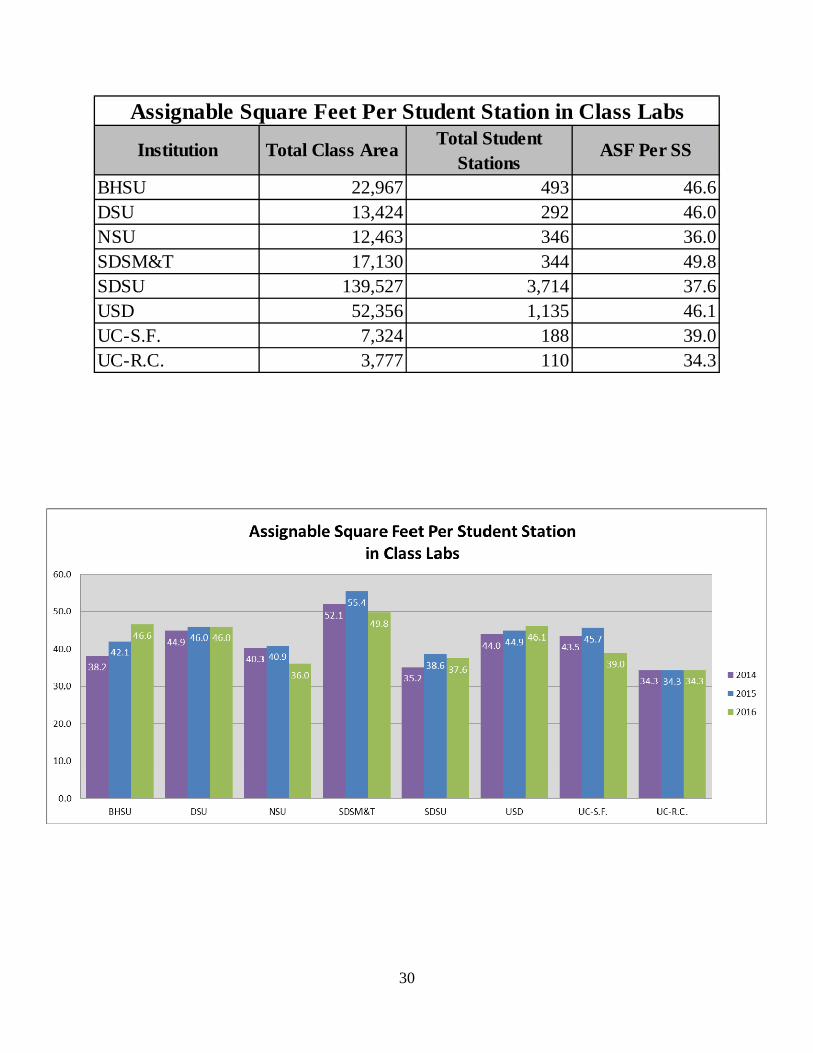
BHSU 22,967 493 46.6DSU 13,424 292 46.0NSU 12,463 346 36.0SDSM&T 17,130 344 49.8SDSU 139,527 3,714 37.6USD 52,356 1,135 46.1UC-S.F. 7,324 188 39.0UC-R.C. 3,777 110 34.3
Institution Total Class AreaTotal Student
StationsASF Per SS
Assignable Square Feet Per Student Station in Class Labs
31
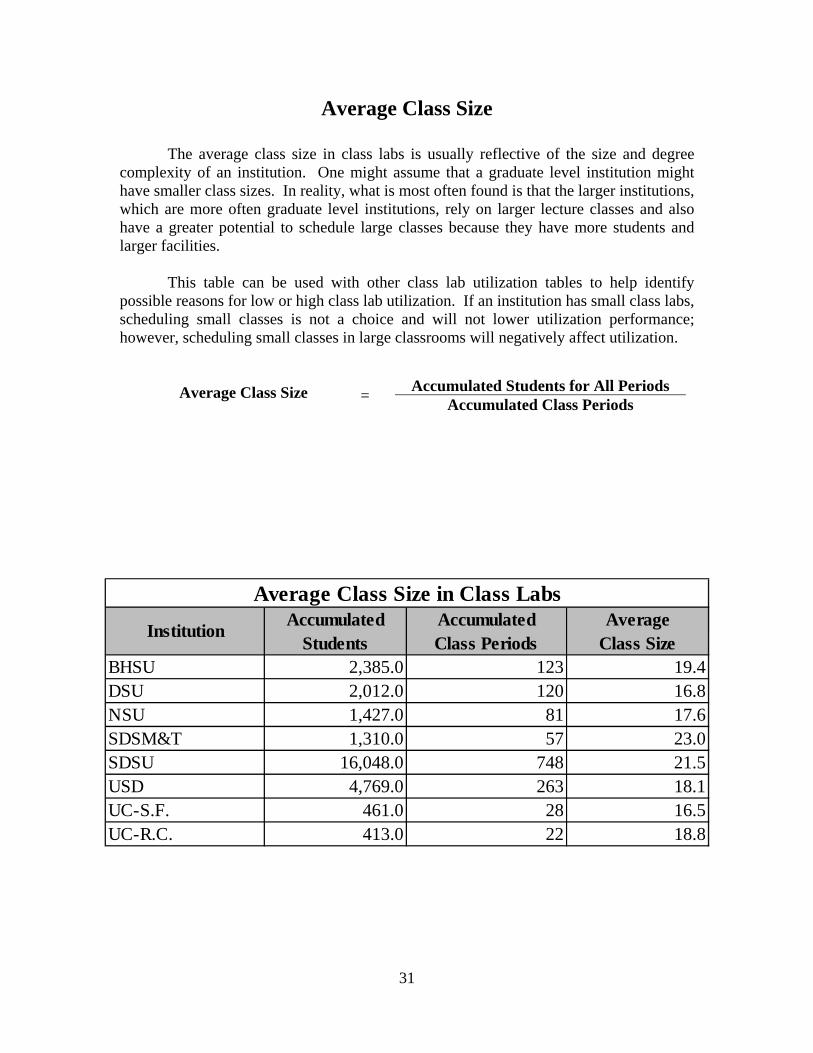
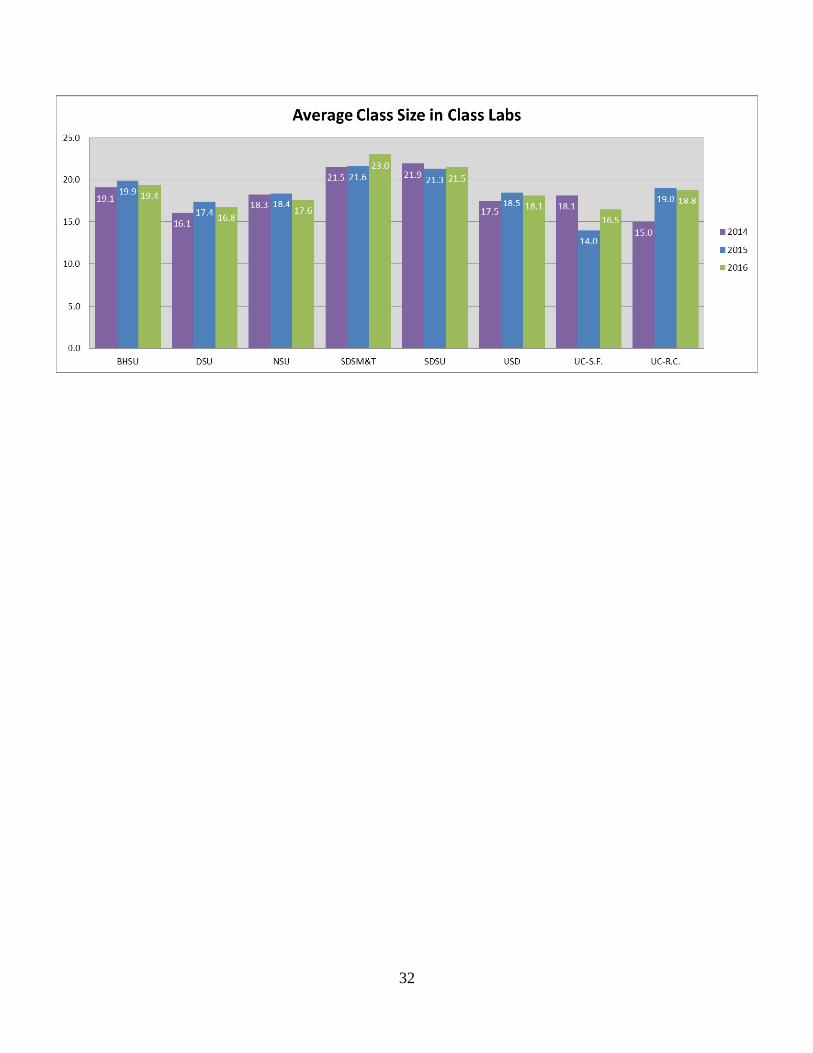
Average Class Size The average class size in class labs is usually reflective of the size and degree complexity of an institution. One might assume that a graduate level institution might have smaller class sizes. In reality, what is most often found is that the larger institutions, which are more often graduate level institutions, rely on larger lecture classes and also have a greater potential to schedule large classes because they have more students and larger facilities. This table can be used with other class lab utilization tables to help identify possible reasons for low or high class lab utilization. If an institution has small class labs, scheduling small classes is not a choice and will not lower utilization performance; however, scheduling small classes in large classrooms will negatively affect utilization.
Average Class Size
= Accumulated Students for All Periods
Accumulated Class Periods
BHSU 2,385.0 123 19.4DSU 2,012.0 120 16.8NSU 1,427.0 81 17.6SDSM&T 1,310.0 57 23.0SDSU 16,048.0 748 21.5USD 4,769.0 263 18.1UC-S.F. 461.0 28 16.5UC-R.C. 413.0 22 18.8
Average Class Size in Class Labs
InstitutionAccumulated
StudentsAccumulated Class Periods
Average Class Size
32
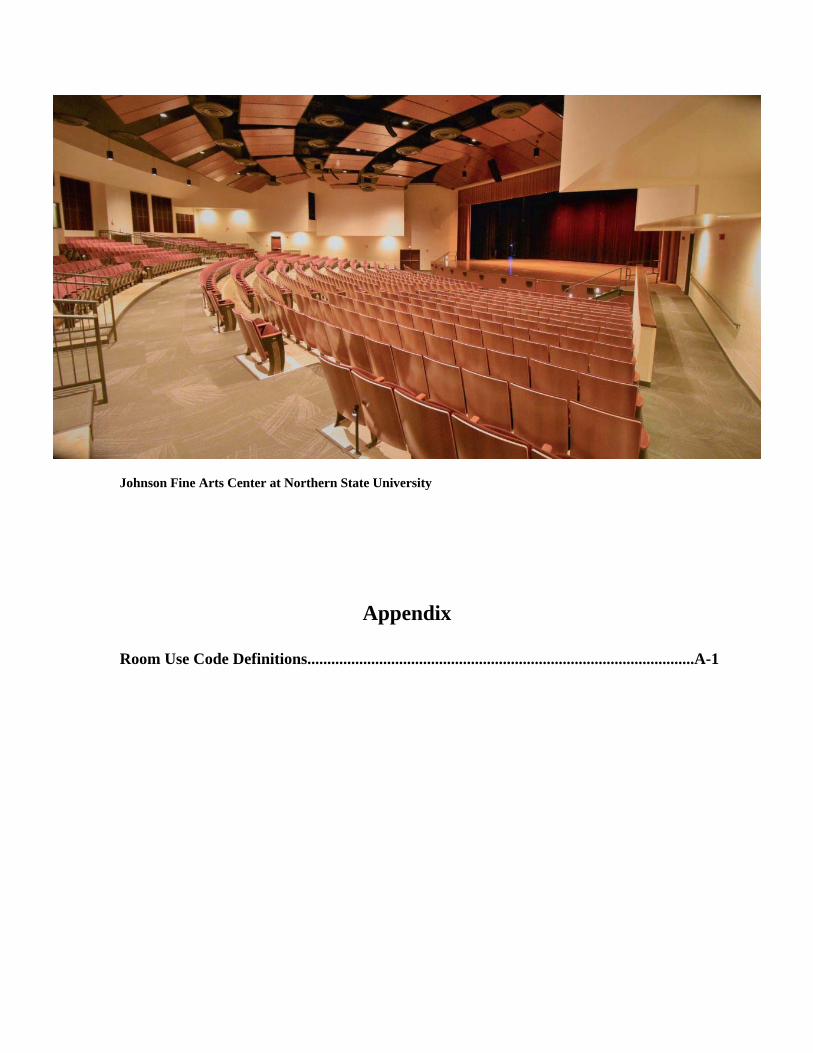
Johnson Fine Arts Center at Northern State University
Appendix
Room Use Code Definitions.................................................................................................A-1
A-1
Room Use Code Definitions Non-Assignable Facilities – The sum of all areas on all floors of a building not available for assignment to an occupant or for specific use, but necessary for the general operation of a building. Included should be space subdivisions of the three non-assignable space use categories – building service, circulation, and mechanical – that are used to support the building’s general operation. Unclassified Facilities – Inactive, remodeling and unfinished are the three areas that make up this classification. These rooms are temporarily unavailable for assignment. Classroom Facilities – Classroom facilities are potentially an institution wide resource. Even though these areas may fall under different levels of organizational control, the need for this type of space should be evaluated for the entire campus. The term “classroom” includes not only general purpose classrooms, but also lecture halls, recitations rooms, seminar rooms, and other room used primarily for scheduled non-laboratory instruction. Classroom facilities include any support rooms that serve the classroom activity. A classroom may contain various types of instructional aides or equipment which do not tie the room to instruction in a specific subject or discipline. Laboratory Facilities – a laboratory is a facility characterized by special purpose equipment or a specific room configuration which ties instructional or research activities to a particular discipline or a closely related group of disciplines. These activities may be individual or group in nature, with or without supervision. Laboratories may be found in all fields of study including letters, humanities, natural sciences, social sciences, vocational and technical disciplines, etc. Laboratory facilities can be subdivided into three categories: class, open, and research laboratory. A class laboratory is used for scheduled instruction. An open laboratory supports instruction but is not formally scheduled. A research laboratory is used for research, experimentation, observation, research training, or structured creative activity which supports extension of a field of knowledge. Office Facilities – Office facilities are individual, multi-person, or workstation space specifically assigned to academic, administrative, and service functions of a college or university. While some institutions may wish to classify all office space as Office, others may wish to differentiate through additional codes for academic administrative, staff, secretarial, clerical, or student assistant offices, etc. Study Facilities – Study space is classifies into five categories: study room, stack, open-stack study room, processing room, and study service. Offices used for library activities are coded as office facilities. A study room may contain equipment or materials which aid the study or learning process and which do not restrict the room to a particular academic discipline or discipline group. Whereas a study room may appear in almost any type of building on campus, stacks, open-stack study rooms, and processing rooms are typically located in, but not limited to, central, branch, or departmental libraries.
A-2
Special-Use Facilities – This category includes several room use types that are sufficiently specialized in their primary activity, function, or design to merit a unique room code. Areas and rooms for military training, athletic activity, media production, clinical activities, demonstration, agricultural field activities, and animal and plant shelters are included here. Although many of these special use facilities provide service to other areas, their special use, design, or configuration dictates that these areas not be coded as service rooms. General-Use Facilities – General use facilities are characterized by a broader availability to faculty, students, staff, or the public than are special use facilities, which are limited to a small group or special population. Together, general use facilities comprise a campus’ general service or functional support system for the institutional and participant community populations. Supporting Facilities – Support facilities, which provide centralized space for various auxiliary support systems and services of a campus, help keep all institutional programs and activities operational. While not as directly accessible to institutional and community members as general use facilities, these areas provide a continuous, indirect support system to faculty, staff, students, and the public. Support facilities are centralized in that they typically serve an area ranging from an entire building or organizational unit to the entire campus. Included are centralized areas for computer-based data processing and telecommunications, shop services general storage and supply, vehicle storage, central services, and hazardous materials areas. Health Care Facilities – This series provides room use classification for patient care rooms that are located in separately organized health care facilities: student infirmaries, teaching hospitals and clinics, and veterinary and medical schools. Residential Facilities – Residential facilities include housing for students, faculty, staff and visitors to the institution. Hotel or motel and other guest facilities are included in this series if they are owned or controlled by the institution and used for purposes associated with defined institutional missions.