Embed Size (px)
Citation preview

This is a n Op e n Acces s doc u m e n t dow nloa d e d fro m ORCA, Ca r diff U nive r si ty 's
ins ti t u tion al r e posi to ry: h t t p s://o rc a.c a r diff.ac.uk/126 8 6 9/
This is t h e a u t ho r’s ve r sion of a wo rk t h a t w as s u b mi t t e d to / a c c e p t e d for
p u blica tion.
Cit a tion for final p u blish e d ve r sion:
Qu ac h, S t a c ey, Pop a t , H a s h m a t , Ka rki, Anup, Playle, Re b e cc a a n d Rich mo n d,
S t e p h e n 2 0 1 9. Fac to r s influe ncing o r t ho don tic t r e a t m e n t ou tco m e in So u t h
E a s t Wales a n d implica tions for s e rvice co m missioning. Jou r n al of
Or t hodo n tics 4 6 (4) , p p . 3 1 1-3 2 2. 1 0.11 7 7/14 6 5 3 1 2 5 1 9 8 8 1 4 5 4 filefile
P u blish e r s p a g e: h t t p s://jou r n als. s a g e p u b.co m/doi/10.11 7 7/14 6 5 3 1 2 5 1...
< h t t p s://jou r n als. s a g e p u b.co m/doi/10.11 7 7/146 5 3 1 2 5 1 9 8 8 1 4 5 4 >
Ple a s e no t e:
Ch a n g e s m a d e a s a r e s ul t of p u blishing p roc e s s e s s uc h a s copy-e di ting,
for m a t ting a n d p a g e n u m b e r s m ay no t b e r eflec t e d in t his ve r sion. For t h e
d efini tive ve r sion of t his p u blica tion, ple a s e r ef e r to t h e p u blish e d sou rc e. You
a r e a dvise d to cons ul t t h e p u blish e r’s ve r sion if you wish to ci t e t his p a p er.
This ve r sion is b ein g m a d e av ailable in a cco r d a n c e wit h p u blish e r policie s.
S e e
h t t p://o rc a .cf.ac.uk/policies.h t ml for u s a g e policies. Copyrigh t a n d m o r al r i gh t s
for p u blica tions m a d e available in ORCA a r e r e t ain e d by t h e copyrig h t
hold e r s .
i
Factors influencing Orthodontic Treatment Outcome in South East Wales
and Implications for Service Commissioning.
Aim: To determine factors that may influence orthodontic treatment outcomes undertaken in
General Dental Services/Personal Dental Services in South East Wales. Design and setting: A
retrospective study of a requested 20 consecutively treated cases (for the year 2014-15)
provided by 26 performers in South East Wales. Method: Performer and patient information
was obtained by use of a questionnaire and FP17OW forms respectively. A calibrated
investigator recorded the Index of Orthodontic Treatment Need (IOTN), Peer Assessment
Rating (PAR) and the Index of Complexity, Outcome and Need (ICON) on start- and end-
study models for each case. Descriptive and regression analyses were undertaken to identify
any predictive factors of a good treatment outcome. Results: 2 respondents completed less
than 20 cases, so all of their cases were assessed. A total of 495 cases were assessed. The
mean end-PAR score of 5 achieved is collectively a good occlusal outcome. Predictive
factors of a good quality of occlusal outcome (end-PAR score being ≤5) were: dual arch
treatment, use of functional with fixed appliances, treatment undertaken in non-corporate
practices and treatment undertaken by registered specialists (p<0.001). Predictive factors for
occlusal improvement (change in PAR score) were: IOTN AC, IOTN DHC (1-3 or 4-5),
number of arches treated and malocclusion type (p<0.001). Conclusions: When renegotiating
NHS orthodontic contracts, commissioning bodies should consider procurement of quality
services and value for money. Dual arch fixed appliances undertaken by orthodontic
specialists in non-corporate environments produced the highest quality orthodontic outcomes.
Those who have the highest need for treatment according to IOTN DHC and AC benefit most
in terms of improvement achieved in PAR score. With future national contract changes, a
system set up to continuously monitor outcomes, should continually improve the value of
NHS orthodontic care.
Keywords: Orthodontics, treatment need, outcome, performer, performance

2
Introduction
In the UK, National Health Service (NHS) funded orthodontic treatment is undertaken upto
16 years of age. Ideally, the patient is assessed by their General Dental Practitioner (GDP)
and referred to a practitioner providing orthodontic treatment if the patient presents with an
Index of Orthodontic Treatment Need (IOTN) score that has a Dental Health Component
(DHC) 4-5 or DHC 3 plus an Aesthetic Component (AC) ≥ 6. Referral criteria ensures
standardised entry into NHS funded care (Department of Health 2006, Primary Care
Commissioning 2014). If the patient does not meet the eligibility criteria and wishes to appeal
the decision, they are recommended to contact the Local Health Board (LHB) and the case
would be taken forwards to the Orthodontic appeals panel to reassess for eligibility or
consider exceptional circumstances.
The NHS orthodontic workforce is currently made up of specialist orthodontists,
GDPs who are Dentists with Enhanced Skills (DwES) in orthodontics and orthodontic
therapists.
Orthodontic activity is monitored by LHBS by the means of FP17OW forms. It is a
mandatory requirement for performers to complete the same form at the start and within two
months from the end of treatment for every patient (National Assembly for Wales 2006). The
form records data regarding: the provider, patient, exemptions and remissions, orthodontic
assessment, orthodontic treatment (appliance type, extractions, number of arches treated) and
orthodontic completion (including if the treatment was completed of discontinued). The data
could be analysed to identify any outliers although this is not currently undertaken.
An inquiry into orthodontic services was undertaken by the National Assembly for
Wales Health and Social Care Committee to ascertain whether the current level of funding for
orthodontics is sustainable with spending pressures faced by the NHS (National Assembly for
Wales 2014). Several respondents including the British Orthodontic Society, Cardiff and Vale

3
University Health Board, South East Wales Local Orthodontic Committee and Managed
Clinical Network (MCN), British Medical Association Wales and the Welsh Consultant
Orthodontic Group noted that there was insufficient funding to meet the treatment needs of
the population. They suggested that to ensure that patients who are most in need of treatment
receive appropriate care, the IOTN threshold could be increased from IOTN DHC 3 with a
minimum AC of 6 to IOTN DHC 4 and 5 only. It has also been recommended that existing
contracts should not automatically be extended and that value for money and quality be
assessed. As a consequence, Local Health Boards were requested by the National Assembly
to conduct detailed assessments of performer treatment profiles and consider re-negotiation of
contracts (Richmond 2015).
Although efficiency is critical for a modern orthodontic service, reducing the cost of
each case should not be at the expense of clinical outcomes.
There are increased NHS spending pressures, upcoming renegotiation of orthodontic
contracts and prioritisation of the dental budget towards other dental specialties (National
Assembly for Wales 2018). Therefore, research is required to assess the quality of
orthodontics provided and potential predictors of treatment outcome to assist in justifying
government spending and enable procurement of high quality services.
Known patient factors affecting outcome include social class (Joury et al. 2011,
Turbill et al. 1999) and malocclusion severity in terms of start-PAR score (Firestone et al.
1999, Taylor et al. 1996). There is varying evidence regarding which patient gender (John et
al. 1994, Willems et al. 2001) and malocclusion type (Burden et al. 1998, Vu et al. 2008,
Willems, Heidbuchel, Verdonck and Carels 2001) achieves a better occlusal outcome.
Regarding practitioner factors affecting outcome, evidence suggests that practitioners
with specialist status are able to achieve a better outcome (Richmond et al. 1992). There is a
lack of evidence regarding other practitioner factors that may affect treatment outcome.

4
There is a consensus that the treatment factors affecting outcome include the number
of arches treated (Fox 1993, Teh et al. 2000), appliance type (Richmond, Shaw, et al. 1993)
and completion/discontinuation status (Richmond and Andrews 1995). There are varying
results regarding treatment duration (Dyken et al. 2001, Knierim et al. 2006). Most of the
studies reporting on number of arches treated and appliance type used were conducted when
use of removable appliances and single arch treatment were undertaken more commonly -
their use has reduced over the years and currently, dual arch fixed appliances are the most
common treatment modality (Health and Social Care Information Centre 2015).
The PAR index is valid, reliable and reproducible with excellent intra- and inter-
examiner reliability (Richmond 1990). Quality of care and outcome of treatment is monitored
using the PAR index and has become a contractual NHS requirement. Twenty consecutively
completed cases are selected by the LHB to be rated by a named, independent and calibrated
examiner each year. With PAR being regarded as a British index, representing British
opinion, Index of Complexity, Outcome and Need (ICON) was developed as an international
index which can also assess complexity and need as well as outcome. It has been suggested
that ICON is more stringent at assessing outcome than PAR (Fox et al. 2002).
Previous studies commonly report outcome as a change in PAR/ICON score and few
with end-PAR/ICON score. Change in a score is useful for measuring the amount of
improvement achieved. If outcome is considered as change or percentage change in
PAR/ICON score, a confounding factor is that the start-PAR/ICON score is used to calculate
the change in score. This makes it difficult to assess other predictive factors against outcome
without the possible confounding factor of the start-score. It has also been suggested that
improvement measures are less sensitive than end-treatment scores as they introduce more
errors into the analysis (Norman 1989). For that reason, end-scores should also be taken into
consideration when reporting outcome. An end PAR score of 5 indicates an almost ideal

5
occlusion, end PAR score of 10 indicates acceptable (Richmond, Shaw, Roberts and
Andrews 1992). An end ICON score of <31 indicates an acceptable occlusal outcome
(Daniels and Richmond 2000).
This study was a result of a collaboration between South East Wales orthodontic
Managed Clinical Network and Cardiff University School of Dentistry. The aim of this
exploratory study was to determine if provider, patient and treatment factors can predict
treatment outcomes measures with PAR/ICON.
Material and Methods
A retrospective, observational cross-sectional study.
Setting
Specialist orthodontic practices (providing orthodontic treatment only) or general dental
practices (providing a mix of general dentistry, orthodontic and potentially other specialist
services) providing NHS orthodontic treatment in the three Local Health Boards (LHBs) in
South East Wales: Aneurin Bevan University Health Board, Cardiff and Vale University
Health Board and Cwm Taf University Health Board. The population covered by the three
LHBs was 1,363,276 which is 41.3% of the total population of Wales (Welsh Government
2015).
Participants
All primary care NHS orthodontic performers identified by the three LHBs in South East
Wales.

6
Sample
The contract managers of each LHB were asked by the MCN and researcher to provide a list
of all orthodontic performers in their region.
The LHBs randomly selected 20 consecutively submitted cases treated in the year
2014-15 for each performer. When less than 20 cases per year were treated, all completed
cases were selected. If a complete set of study models was not available for a case, the
performer would have to state the reason why and request the LHB to select the next
consecutively treated case.
Inclusion and Exclusion criteria
There were no specific inclusion/exclusion criteria in the selection of cases by LHBs. Any
cases not submitted at the end of treatment would not have been able to be included although
it is a mandatory requirement that FP17OW forms be submitted as completed within 2
months of completion of treatment.
Variables
Details regarding the patient, treatment, performer and outcome measures were recorded
(Error! Reference source not found.).
The LHBs provided patient and treatment factors from FP17OW forms for each of the
selected 20 cases. This was electronically provided to the researcher. LHBs also provided
details of the type of practice the performer worked in and UOA value for each performer.
Analysis of the study models provided the remaining patient factors and outcome
measures.
Performer details were collected by questionnaire. The performer questionnaire was
piloted with two specialists and two non-specialist orthodontists not involved in either the

7
study or main sample of participants to ensure understanding and eliminate any ambiguity.
Each performer was posted an invitation pack which included a consent form and Performer
Questionnaire to complete if they agreed to participate in the study. Performers were given
four weeks to consider participation and express any queries before the researcher contacted
the practice to seek a response. The questionnaire sought information on: gender, specialist
status, years of orthodontic experience, number of sessions practicing orthodontics, use of
orthodontic therapists (percentage of cases where an orthodontic therapist is involved in the
majority of the treatment), practice worked in (orthodontic only or mixed).
Outcome measures were collected by the investigator applying occlusal indices to start- and
end-study models. Performers were asked to provide any supplemental information they felt
necessary for PAR, IOTN and ICON such as missing teeth, impacted teeth, displacements).
Data was entered directly into Statistical Package for the Social Sciences (SPSS) (v.20.0.0).
Bias
Consecutive case sampling with no exclusion criteria increases the validity of the study and
reduces the risk of selection bias.
All occlusal indices (IOTN, PAR and ICON) were recorded by one examiner
calibrated to the gold standard to reduce the risk of measurement bias. Intra-operator
reliability was assessed twice by the investigator re-scoring 30 randomly selected cases
halfway through and at the end of data collection.
For performer factors, the performer questionnaires were collected by the researcher
after all study models had been assessed in order to prevent the researcher knowing
unecessary performer information prior to analysing study models. Due to the nature of
assessing the study models at practice locations, the researcher was unable to be blinded to the

8
practice setting and would have been able to identify if a practice was a specialist or mixed
practice but not necessarily if it was corporate or independent.
Patient and treatment factors were unaffected and free from bias as this information
was obtained from the LHBs after analysis of study models had been undertaken.
Statistical methods
Since the study was an exploratory study of factors that predict or influence treatment
outcomes and not a simple comparative trial, there was no hypothesis.
Reliability testing
The reliability of PAR, ICON and IOTN was assessed by the investigator rescoring 30
randomly selected cases at two different phases – phase 1 was completed once half of the 495
cases had been assessed and phase 2 once all 495 cases had been assessed.
Intra-operator reliability was assessed for IOTN, DHC and AC using Kappa statistics. The
predetermined level of agreement required was a lower confidence interval >0.6 indicating
‘substantial’ agreement. For PAR and ICON, Bland-Altman plots (Bland and Altman 1999)
were used. For PAR, the mean difference should be less than 2 PAR points with the Root
Mean Square (RMS) of less than 5 with no bias. For ICON, the mean difference should be
less than 7 with a RMS of 9 with no bias (Brown and Richmond 2005).
Predictive modelling
Individual variable significance testing was undertaken as a screening tool, initially
investigating for association with a good occlusal outcome. Chi square tests were used for
categorical data while Independent T-tests/Kruskal-Wallis H and Pearsons correlation were
used for continuous data. A multivariate logistic regression model was undertaken to
determine predictive factors of End-PAR score (≤5). All independent variables that indicated

9
clinical relevance and/or statistical significance in univariate analyses were tested in the
model. The modelling strategy employed was to start with a full model with the least
predictive variable removed at each iteration. Predictors of end-PAR score (≤5) were
tabulated with Odds Ratios (OR) and associated 95% CI.
Checks for potential multicollinearity of predictors were undertaken using crosstabs and Chi
Square tests of association, Independent T-tests and correlation where appropriate for data
types. For prediction of change in PAR score, a multiple linear regression model was
undertaken. Correlation was undertaken to ensure no multicollinearity was present as assessed
by Durbin Watson statistics. This ensures that there are no confounding factors within the
analysis.
Results
A total of 28 performers were identified. One performer had no orthodontic activity in the
chosen year and one performer failed to respond. Therefore 26 respondents were included in
the study (96.3% response rate). Two respondents completed less than 20 cases in the year, so
all of their completed cases were assessed. Four hundred and ninety-five sets of models were
assessed.
Of the respondents, 19 out of 26 (73.1%) were registered as an orthodontic specialist
with the UK General Dental Council. Six non-specialist respondents had gone through the
local accreditation process of being recognised as a DwES by the LHB and one performer
was recognised as a DwES although had not undergone the accreditation process. There were
more female respondents than males (n-16, 10 respectively). The respondents worked on
average 4.5 (SD 2.8) sessions in the GDS/PDS per week. Twenty-two respondents worked in
non-corporate practices with the remaining four respondents working in corporate owned

10
practices. Four respondents used orthodontic therapists to treat their caseload which ranged
from 5-100%. Specific cases treated by therapists were not identified.
The Units of Orthodontic Activity (UOA) – which is an activity target used for
commissioning NHS orthodontic services in England and Wales, value ranged from £62.78 to
£67.66 (mean £65.93). The mean UOA was marginally higher for non-specialists (£66.23)
than specialists (£65.85).
Only 23% of respondents (n-6) provided all the study models that were requested. The
reason for this in 93.3% of unavailable cases was that the study models could not be located.
Other reasons included the patient being transferred to hospital, the patient being too
distressed to take impressions and that a digital scan was taken in a different practice location.
The initial rate of cases not available was 9.1% prior to further cases being selected by the
LHBs.
Reliability of Measurements
Reliability of IOTN was ‘substantial’ to ‘almost perfect’ (Error! Reference source not
found.). The Kappa scores were all above 0.60 which was pre-determined to the be level
where substantial agreement has been achieved (Landis and Koch 1977). The mean difference
in reliability testing for PAR and ICON is also seen in Error! Reference source not found..
Error! Reference source not found. presents Bland-Altman plots used to assess the
reliability of PAR and ICON in phase 1 and 2. The mean difference for PAR was: phase 1: -
0.40 (SD 1.80, 95% limits of agreement: -3.99 to 3.99), phase 2: 0.03 (SD 1.59, 95% limits of
agreement: -3.15 to 3.22). This represents a potential error of up to 3.99 and 3.19 respectively

11
which is below the level of pre-defined clinical significance of +/-12 for PAR (Brown and
Richmond 2005).
The mean difference for ICON was: phase 1: 0.45 (SD 4.55, 95% limits of agreement:
-8.65 to 9.95), phase 2: 0.47 (SD 3.39, 95% limits of agreement: -6.32 to 7.25). This
represents a potential error of up to 9.30 and 6.79 respectively which is below the level of pre-
determined clinical significance of +/-18 for ICON (Brown and Richmond 2005).
Patient sample
There were 495 patients (females, 62.4%; males, 37.6%) assessed with an age range from 8.3
to 20.0 years (mean age 14.0 years; SD 1.7). The most common malocclusion was Class II
division 1 (45.0%) followed by Class I (39.6%), Class II division 2 (8.7%) and Class III
(6.7%). An incidental finding was that 20 cases (4%) that received NHS orthodontic treatment
did not meet the eligibility criteria according to IOTN (
Table 1: Variable data
Patient factors Treatment factors Performer factors Outcome measures
• Gender
• Age
• Malocclusion type (Class I, II/1, II/2 or III)
• Deprivation according to the Welsh Index of Multiple
Deprivation
• IOTN:
• DHC
• AC
• Start-PAR score
• ICON
• Start score
• Need
• Complexity
• Extraction decision (yes/no)
• Appliance type (fixed/removable/
functional)
• Single or double arch treatment
• Duration of treatment
(months)
• Treatment status (completed/discontinued)
• Gender
• Orthodontic specialist status as registered with the General Dental
Council (yes/no)
• Years of Orthodontic experience excluding training
• Number of sessions practicing
Orthodontics
• Use of Orthodontic therapist (yes/no)
• Type of practice worked in (specialist/mixed)
• Type of practice worked in
(independent/corporate)
• Unit of Orthodontic Activity value
• PAR:
• End-PAR score
• Change/percentage change in PAR
score
• PAR outcome category
• ICON:
• End ICON
• ICON improvement
grade
Table 2: Reliability results for IOTN, PAR and ICON
Kappa P-value Standard
Error
95% Confidence
Interval
Lower Upper
IOTN DHC Phase 1 0.83 0.000 0.12 0.60 1.06
IOTN DHC Phase 2 1.00 0.000 0.00 1.00 1.00
IOTN AC Phase 1 0.72 0.000 0.09 0.53 0.90
IOTN AC Phase 2 0.74 0.000 0.09 0.56 0.92

12
Mean
Difference
P-value Standard
Deviation
95% Confidence
Interval
Lower Upper
PAR Phase 1 -0.40 0.090 1.80 -0.86 0.06
PAR Phase 2 0.03 0.870 1.59 -0.38 0.45
ICON Phase 1 0.45 0.470 4.55 -0.73 1.63
ICON Phase 2 0.47 0.290 3.39 -0.41 1.34
Table 3: Bland-Altman plots to show intra-operator reliability for PAR and ICON
Table 4). No cases had been through an appeal procedure. There were 33 cases where the start
ICON was ≤43 indicating no need for treatment (6.7%). There was an even distribution of
patients treated from different areas of deprivation (Welsh Index of Multiple Deprivation) in
South East Wales (Figure 1).

13
In 94.6% of cases, upper and lower fixed appliances were used. Extractions were
undertaken in 52.5% of patients. Fourteen cases (2.8%) did not complete treatment and were
recorded as ‘discontinued’. Treatment duration ranged from 4-73 months (mean 21.6 months,
SD 8.8). Sixty per cent of treatments were completed within 1-2 years.
Treatment outcome
The PAR score analysis is presented in
Table 5. The start PAR score ranged rom 5 to 65 with a mean of 28.8. The mean end-PAR
score of 5 (SD 3.5) is collectively a good outcome. There were 28 cases (5.6%) that had an
end-PAR score greater than 10 indicating further need for orthodontic treatment.
An acceptable occlusal outcome according to ICON (end-ICON score <31) was
achieved in 94.9% of cases, although 1.0% of cases had an end-ICON of > 43 indicating a
residual need for treatment.
Predictors of outcome
The end-PAR and end-ICON scores were assessed. The cut-off point for PAR score
was 5, indicating an almost ideal occlusion when ≤5 (Richmond, Shaw, Roberts and Andrews
1992) and for ICON it was 31, where <31 indicates an acceptable occlusal outcome (Daniels
and Richmond 2000). As 94.9% achieved an acceptable outcome (based on end-ICON score),
it was decided to assess the predictors of high quality outcomes based on the end-PAR score
of ≤5.
Therefore, outcomes measures were:
End PAR score ≤5 = High Quality of outcome achieved
Change in PAR score = Improvement achieved
Individual variable significance testing was undertaken as a screening tool for further
multivariate modelling (

14
Table 6). Tests for association were undertaken purely as a screening tool to reduce the
number of independent variables used in the regression model and the results do not represent
definitive significance.
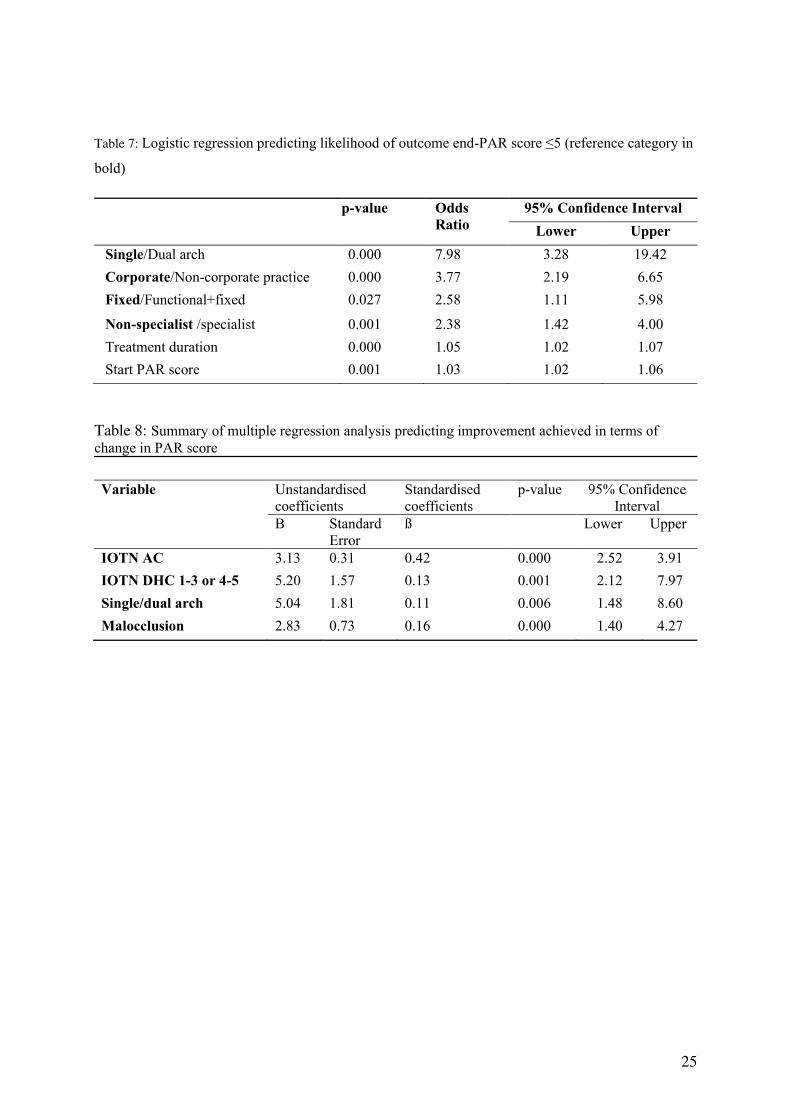
The multivariate logistic regression analysis was statistically significant (X2(4) = 81.64, p<0.001) to assess for
predictors of a high quality outcome (End PAR score ≤5). There were no confounding factors between
significant independent variables. Those who have dual arch treatment were 7.98 times more likely to achieve a
good outcome compared to single arch treatments. In addition, non-corporate practices, use of functional
appliances prior to fixed appliances and specialist respondents were more likely to also achieve high quality
orthodontic outcomes (
Table 7). Although treatment duration and start PAR score were statistically
significant, as the odds ratio is close to 1, these factors are not likely to be clinically
significant.
The multiple regression model was statistically significant in predicting the improvement
achieved (the change in PAR score): (F(4,488)=49.74, p<0.001; Change in PAR score = -6.21
+ (3.13 x IOTN AC) + (5.20 if IOTN DHC 4-5) + (5.04 if dual arch treatment) + (2.83 x
malocclusion type)). There was no correlation between factors/confounding factors (Durbin-
Watson statistic of 1.87). The regression coefficients (
Table 8) indicate that an increased start-Aesthetic Component by 1 is associated with
a change in PAR of 3.13. An increased start-Dental Health Component from 1-3 to 4-5
increases the change in PAR by 5.20. A change in malocclusion type from Class I is
associated PAR score of 2.83 for Class II and 5.66 for Class III. The predicted change in PAR
score for dual arch treatment is 5.04 PAR points higher than that predicted for single arch
(dependent on all other variables being constant).
Discussion
Although it is mandatory under the NHS contract to record PAR scores in a significant
proportion of treatment cases and this study was supported by the Managed Clinical Network
with memberships from LHBs, orthodontic service providers, academia and dental public
health, one performer failed to respond. It is of concern that 9% of the dental casts requested
15
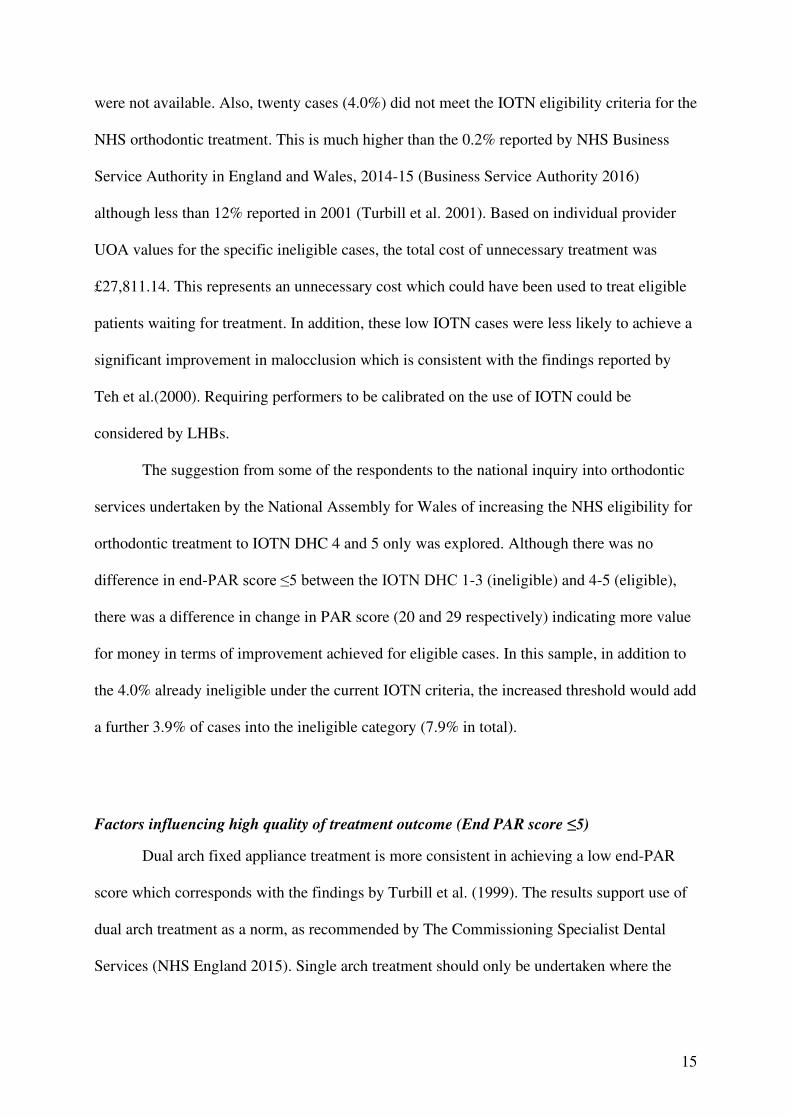
were not available. Also, twenty cases (4.0%) did not meet the IOTN eligibility criteria for the
NHS orthodontic treatment. This is much higher than the 0.2% reported by NHS Business
Service Authority in England and Wales, 2014-15 (Business Service Authority 2016)
although less than 12% reported in 2001 (Turbill et al. 2001). Based on individual provider
UOA values for the specific ineligible cases, the total cost of unnecessary treatment was
£27,811.14. This represents an unnecessary cost which could have been used to treat eligible
patients waiting for treatment. In addition, these low IOTN cases were less likely to achieve a
significant improvement in malocclusion which is consistent with the findings reported by
Teh et al.(2000). Requiring performers to be calibrated on the use of IOTN could be
considered by LHBs.
The suggestion from some of the respondents to the national inquiry into orthodontic
services undertaken by the National Assembly for Wales of increasing the NHS eligibility for
orthodontic treatment to IOTN DHC 4 and 5 only was explored. Although there was no
difference in end-PAR score ≤5 between the IOTN DHC 1-3 (ineligible) and 4-5 (eligible),
there was a difference in change in PAR score (20 and 29 respectively) indicating more value
for money in terms of improvement achieved for eligible cases. In this sample, in addition to
the 4.0% already ineligible under the current IOTN criteria, the increased threshold would add
a further 3.9% of cases into the ineligible category (7.9% in total).
Factors influencing high quality of treatment outcome (End PAR score ≤5)
Dual arch fixed appliance treatment is more consistent in achieving a low end-PAR
score which corresponds with the findings by Turbill et al. (1999). The results support use of
dual arch treatment as a norm, as recommended by The Commissioning Specialist Dental
Services (NHS England 2015). Single arch treatment should only be undertaken where the
16
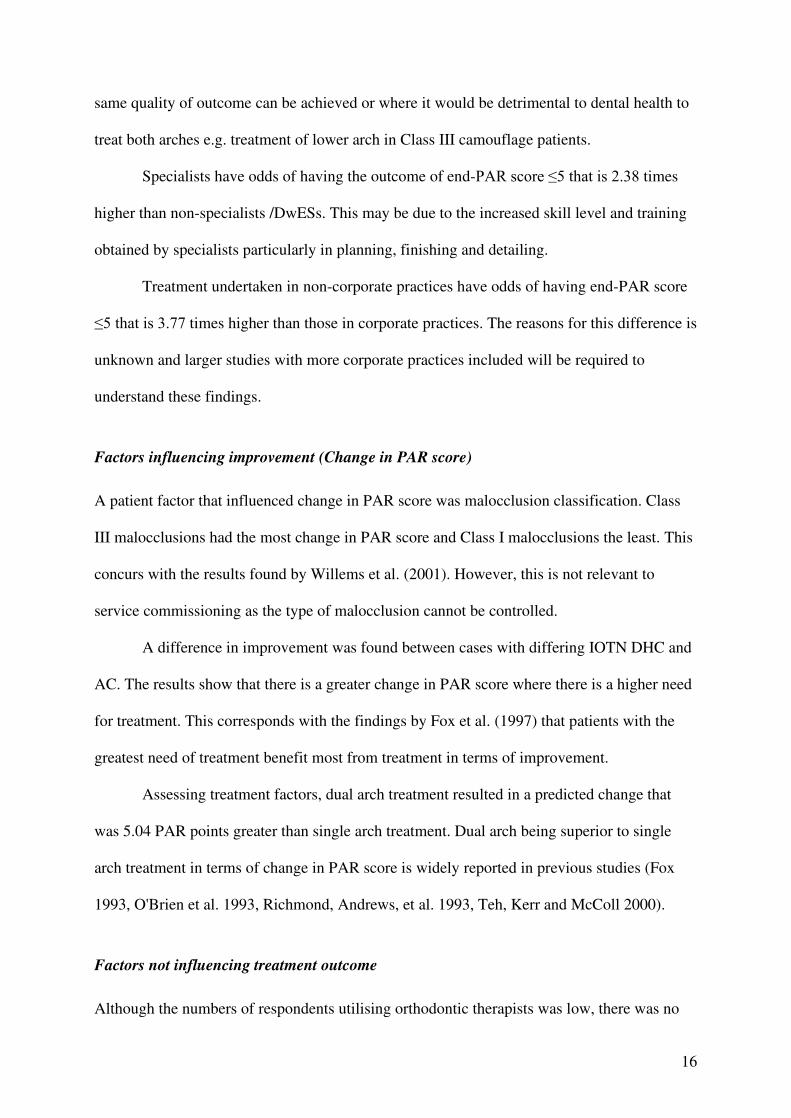
same quality of outcome can be achieved or where it would be detrimental to dental health to
treat both arches e.g. treatment of lower arch in Class III camouflage patients.
Specialists have odds of having the outcome of end-PAR score ≤5 that is 2.38 times
higher than non-specialists /DwESs. This may be due to the increased skill level and training
obtained by specialists particularly in planning, finishing and detailing.
Treatment undertaken in non-corporate practices have odds of having end-PAR score
≤5 that is 3.77 times higher than those in corporate practices. The reasons for this difference is
unknown and larger studies with more corporate practices included will be required to
understand these findings.
Factors influencing improvement (Change in PAR score)
A patient factor that influenced change in PAR score was malocclusion classification. Class
III malocclusions had the most change in PAR score and Class I malocclusions the least. This
concurs with the results found by Willems et al. (2001). However, this is not relevant to
service commissioning as the type of malocclusion cannot be controlled.
A difference in improvement was found between cases with differing IOTN DHC and
AC. The results show that there is a greater change in PAR score where there is a higher need
for treatment. This corresponds with the findings by Fox et al. (1997) that patients with the
greatest need of treatment benefit most from treatment in terms of improvement.
Assessing treatment factors, dual arch treatment resulted in a predicted change that
was 5.04 PAR points greater than single arch treatment. Dual arch being superior to single
arch treatment in terms of change in PAR score is widely reported in previous studies (Fox
1993, O'Brien et al. 1993, Richmond, Andrews, et al. 1993, Teh, Kerr and McColl 2000).
Factors not influencing treatment outcome
Although the numbers of respondents utilising orthodontic therapists was low, there was no

17
significant association in outcome for both end-PAR score ≤5 and change in PAR score.
There was no significant association detected in change in PAR and end-PAR score ≤5
between varying UOA values within the range included in this study. Although these findings
are only exploratory, It is the opinion of the authors that they could potentially indicate value
for money in NHS orthodontics with utilisation of therapists and standardising the national
UOA value and aligning it to be consistent with patient reported and objective clinical
outcomes. Once a national UOA value and expected level of outcomes are agreed, LHBs as
local commissioners could be advised to use local flexibility to adjust the UOA value taking
into considerations of certain criteria such as rurality and other performance indicators.
Considerations for service commissioning
For the upcoming renegotiation of NHS contracts, commissioning bodies should consider
procurement of high quality services and value for money by setting standardised criteria. The
following could be considered:
• All records must be available for monitoring.
• All performers should be calibrated in the use of IOTN and undertake
recalibration every 5-10 years. Undertake audits on IOTN reporting.
• Increasing the eligibility threshold to accept IOTN DHC 4-5 only would
mean that 7.9% of cases would not be funded in this study.
• Ensure the majority of treatments undergo dual arch fixed appliances
where appropriate. The ratio of single and dual arch treatments could be
used as a performance indicator to highlight any outlying performers.
• Encourage a multi-skilled model whereby specialists lead the service,
supporting DwES and orthodontic therapists. With an increased use of
therapists, further studies can be conducted on outcomes achieved.
Study limitations
This study is undertaken in 3 Local Health Boards in South East Wales and may not be
representative of the whole of Wales or other areas of the UK. This study is retrospective and

18
not all records for the consecutive cases selected by the LHB’s were available which may
have introduced a selection bias if poor outcome cases were not available. The scope of the
study restricted full examination of all the factors influencing the outcome of orthodontic
treatment and therefore the generalisability of the study findings is reduced. There were small
sample sizes for: single arch treatment (5.5%); cases treated with functional appliances and
subsequent fixed appliances (8.5%); respondents who work in corporate practices (15.4%);
and non-specialists (26.9%). These are factors were predictive of an end-PAR score ≤5 and
explain the wide confidence intervals (Table 4 and 5) in predicting treatment outcome.
Nevertheless, the findings do provide insight in to the local provision of orthodontic treatment
in South East Wales.
Conclusions
Dual arch fixed appliances undertaken by orthodontic specialists in non-corporate
environments produced the highest quality orthodontic outcomes. Those who have the highest
need for treatment according to IOTN DHC and AC benefit most in terms of improvement
achieved in PAR score.
Overall, good orthodontic treatment outcomes were achieved by NHS practitioners in
South East Wales. However, this study also highlights the importance of regular monitoring
of the IOTN criteria for NHS orthodontic treatment and any variation in orthodontic treatment
outcomes achieved by practitioners and practices. Future national contract changes,
development of orthodontic service specifications and local commissioning exercises should
consider the findings of this study and ensure effective systems of monitoring and evaluation
of existing services are in place.
Acknowledgements
The authors would like to thank to all orthodontic respondents in South East Wales for their

19
help during this study as well as the South East Wales Managed Clinical Network and Local
Health Boards for their support and data management.
Disclaimer statement
The authors report no conflicts of interest. There were no sources of funding.
Ethical approval for the study was granted by National Research Ethics Service (Ref:
15/LO/0209). In addition, local approval was granted by the Research Governance
Departments of Aneurin Bevan University Health Board (Ref: RD/1335/15) Cardiff and Vale
University Health Board (Ref: 15/DEN/6125) and Cwm Taf University Health Board (Ref:
CT/511/168063/15).
References
Bland JM, Altman DG. 1999. Measuring agreement in method comparison studies. Statistical
Methods in Medical Research. Jun;8:135-160.
Brown R, Richmond S. 2005. An update on the analysis of agreement for orthodontic indices.
European Journal of Orthodontics. Jun;27:286-291.
Burden DJ, McGuinness N, McNamara T. 1998. Treatment outcome for a sample of patients
with Class II division 1 malocclusion treated at a regional hospital orthodontic department.
Journal of the Irish Dental Association.44:67-69.
Business Service Authority. 2016. Update from NHSBSA Dental Services.
Daniels C, Richmond S. 2000. The development of the index of complexity, outcome and
need (ICON). Journal of Orthodontics. Jun;27:149-162.
Department of Health. 2006. Strategic commissioning of primary care orthodontic services.
Gateway Approval
Reference Number: 7105.
Dyken RA, Sadowsky PL, Hurst D. 2001. Orthodontic outcomes assessment using the peer
assessment rating index. Angle Orthodontist. Jun;71:164-169.
Firestone AR, Hasler RU, Ingervall B. 1999. Treatment results in dental school orthodontic
patients in 1983 and 1993. Angle Orthodontist. Feb;69:19-26.
Fox NA. 1993. The first 100 cases: a personal audit of orthodontic treatment assessed by the
PAR (peer assessment rating) index. British Dental Journal. 24 Apr;174:290-297.
20
Fox NA, Daniels C, Gilgrass T. 2002. A comparison of the index of complexity outcome and
need (ICON) with the peer assessment rating (PAR) and the index of orthodontic treatment
need (IOTN). British Dental Journal. Aug 24;193:225-230.
Fox NA, Richmond S, Wright JL, Daniels CP. 1997. Factors affecting the outcome of
orthodontic treatment within the general dental service. British Journal of Orthodontics.
Aug;24:217-221.
Health and Social Care Information Centre. 2015. Children's Dental Health Survery 2013.
Report 1: Attitudes, Behaviours and Children's Dental Health. England, Wales and Northern
Ireland, 2013.
John W, Kerr S, Buchanan IB, McNair FI, McColl JH. 1994. Factors influencing the outcome
and duration of removable appliance treatment. European Journal of Orthodontics.
Jun;16:181-186.
Joury E, Johal A, Marcenes W. 2011. The role of socio-economic position in predicting
orthodontic treatment outcome at the end of 1 year of active treatment. European Journal of
Orthodontics. June;33:263-269.
Knierim K, Roberts WE, Hartsfield Jr J. 2006. Assessing treatment outcomes for a graduate
orthodontics program: Follow-up study for the classes of 2001-2003. American Journal of
Orthodontics and Dentofacial Orthopedics. November;130:648-655.
Landis JR, Koch GG. 1977. The measurement of observer agreement for categorical data.
Biometrics. Mar;33:159-174.
National Assembly for Wales. 2006. The National Health Service (General Dental Services
Contracts) (Wales) Regulations 2006 and the National Health Service (Personal Dental
Services Agreements) (Wales) Regulations 2006. Statutory Instruments. 2006 No 490 (W.59)
and 2006 No 489 (W.58).
National Assembly for Wales. 2014. Consultatation - Orthodotnic Services in Wales.
National Assembly for Wales. 2018. Dentistry in Wales Consultation Responses.
NHS England. 2015. Guide for Commissioning Specialist Dentistry Services.
Norman GR. 1989. Issues in the use of change scores in randomized trials. Journal of Clinical
Epidemiology.42:1097-1105.
O'Brien KD, Shaw WC, Roberts CT. 1993. The use of occlusal indices in assessing the
provision of orthodontic treatment by the hospital orthodontic service of England and Wales.
British Journal of Orthodontics. Feb;20:25-35.
Primary Care Commissioning DAF. 2014. Policy & Corporate Procedures, OPS_01272.
Richmond S. 1990. A critical evaluation of orthodontic treatment in the General Dental
Services of England and Wales. In: PhD Thesis: University of Manchester.
Richmond S. 2015. Review of the Orthodntic Services in Wales 2013-14.

21
Richmond S, Andrews M. 1995. Discontinued orthodontic treatment in the general dental
services of England and Wales (1990-1991). British Journal of Orthodontics. Aug;22:263-
268.
Richmond S, Andrews M, Roberts CT. 1993. The provision of orthodontic care in the general
dental services of England and Wales: extraction patterns, treatment duration, appliance types
and standards. British Journal of Orthodontics. Nov;20:345-350.
Richmond S, Shaw WC, Roberts CT, Andrews M. 1992. The PAR Index (Peer Assessment
Rating): methods to determine outcome of orthodontic treatment in terms of improvement and
standards. European Journal of Orthodontics. Jun;14:180-187.
Richmond S, Shaw WC, Stephens CD, Webb WG, Roberts CT, Andrews M. 1993.
Orthodontics in the general dental service of England and Wales: a critical assessment of
standards. British Dental Journal. May;174:315-329.
Taylor PJ, Kerr WJ, McColl JH. 1996. Factors associated with the standard and duration of
orthodontic treatment. British Journal of Orthodontics. Nov;23:335-341.
Teh LH, Kerr WJ, McColl JH. 2000. Orthodontic treatment with fixed appliances in the
General Dental Service in Scotland. Journal of Orthodontics. Jun;27:175-180.
Turbill EA, Richmond S, Wright JL. 1999. A closer look at General Dental Service
orthodontics in England and Wales. I: Factors influencing effectiveness. British Dental
Journal. Aug 28;187:211-216.
Turbill EA, Richmond S, Wright JL. 2001. The time-factor in orthodontics: what influences
the duration of treatments in National Health Service practices? Community Dentistry Oral
Epidemiology. Feb;29:62-72.
Vu CQ, Roberts WE, Hartsfield Jr JK, Ofner S. 2008. Treatment complexity index for
assessing the relationship of treatment duration and outcomes in a graduate orthodontics
clinic. American Journal of Orthodontics and Dentofacial Orthopedics. January;133:9.e1-
9.e13.
Welsh Government. 2015. Population for small areas in Wales (2001 onwards), by broad age
bands and gender
Willems G, Heidbuchel R, Verdonck A, Carels C. 2001. Treatment and standard evaluation
using the Peer Assessment Rating Index. Clin Oral Investig. Mar;5:57-62.
Table 1: Variable data
Patient factors Treatment factors Performer factors Outcome measures
• Gender
• Age
• Malocclusion type (Class I, II/1, II/2 or III)
• Deprivation according to the
Welsh Index of Multiple Deprivation
• IOTN:
• DHC
• AC
• Extraction decision
(yes/no)
• Appliance type (fixed/removable/
functional)
• Single or double arch treatment
• Duration of treatment (months)
• Gender
• Orthodontic specialist status as registered with the General Dental
Council (yes/no)
• Years of Orthodontic experience excluding training
• Number of sessions practicing Orthodontics
• Use of Orthodontic therapist (yes/no)
• PAR:
• End-PAR score
• Change/percentage change in PAR
score
• PAR outcome category
• ICON:
• End ICON

22
• Start-PAR score
• ICON
• Start score
• Need
• Complexity
• Treatment status (completed/discontinued)
• Type of practice worked in (specialist/mixed)
• Type of practice worked in (independent/corporate)
• Unit of Orthodontic Activity value
• ICON improvement
grade
Table 2: Reliability results for IOTN, PAR and ICON
Kappa P-value Standard
Error
95% Confidence
Interval
Lower Upper
IOTN DHC Phase 1 0.83 0.000 0.12 0.60 1.06
IOTN DHC Phase 2 1.00 0.000 0.00 1.00 1.00
IOTN AC Phase 1 0.72 0.000 0.09 0.53 0.90
IOTN AC Phase 2 0.74 0.000 0.09 0.56 0.92
Mean
Difference
P-value Standard
Deviation
95% Confidence
Interval
Lower Upper
PAR Phase 1 -0.40 0.090 1.80 -0.86 0.06
PAR Phase 2 0.03 0.870 1.59 -0.38 0.45
ICON Phase 1 0.45 0.470 4.55 -0.73 1.63
ICON Phase 2 0.47 0.290 3.39 -0.41 1.34

23
Table 3: Bland-Altman plots to show intra-operator reliability for PAR and ICON
Table 4: Cross-tabulation of IOTN DHC and AC (shaded scores = ineligible)
IOTN DHC
2 3 4 5 Total
IOTN
AC
2 0 (0.0%) 0 (0.0%) 5 (1.0%) 2 (0.4%) 7 (1.4%)
3 0 (0.0%) 2 (0.4%) 4 (0.8%) 0 (0.0%) 6 (1.2%)
4 0 (0.0%) 3 (0.6%) 15 (3.0%) 1 (0.2%) 19 (3.8%)
5 2 (0.4%) 13 (2.6%) 49 (9.9%) 8 (1.6%) 72 (14.5%)
6 0 (0.0%) 14 (2.8%) 99 (20.0%) 10 (2.0%) 123 (24.8%)
7 0 (0.0%) 5 (1.0%) 110 (22.2%) 18 (3.6%) 133 (26.9%)
8 0 (0.0%) 0 (0.0%) 103 (20.8%) 6 (1.2%) 109 (22.0%)
9 0 (0.0%) 0 (0.0%) 13 (2.6%) 5 (1.0%) 18 (3.6%)
10 0 (0.0%) 0 (0.0%) 2 (0.4%) 6 (1.2%) 8 (1.6%)
Total 2 (0.4%) 37 (7.5%) 400 (80.8%) 56 (11.3%) 495 (100%)

24
Table 5: PAR score results for all cases
PAR variable Minimum Maximum Mean Standard
deviation
95% Confidence
Interval
Lower Upper
Start-PAR 5 65 28.8 10.9 27.8 29.7
End-PAR 2 36 5.0 3.5 4.7 5.3
Change in PAR -1 62 23.7 10.8 22.8 24.7
Percentage change
in PAR
-20.0 96.9 80.5 14.7 79.1 81.7
Table 6: Results of individual variable significance testing against outcomes: End-PAR score; and
Change in PAR score (bold values significant)
Independent variable p-values
End-PAR
score ≤5
p-values
Change in
PAR score
Patient
factors
Gender 0.803 0.631 Age 0.232 0.194
Malocclusion type (Class I/II/III) 0.120 0.000
Deprivation 0.511 0.265
IOTN DHC (1-3 or 4-5) 0.367 0.000
IOTN AC 0.052 0.000
Start-PAR score 0.000 -
Start-ICON score 0.060 0.000
ICON complexity 0.448 0.000
ICON need 0.165 0.000
Treatment
factors
Extraction/non-extraction 0.632 0.000
Single/Dual arch 0.000 0.045
Fixed appliance/Functional+Fixed appliance 0.048 0.039
Treatment duration 0.000 0.000
Treatment completion/discontinuation 0.042 0.261
Performer
factors
Gender 0.001 0.597
Years of orthodontic experience 0.195 0.437
Registered specialist status 0.001 0.767
UOA value 0.194 0.093
Consultant status 0.248 0.975
Use of orthodontic therapist (Y/N) 0.547 0.237
Percentage use of orthodontic therapist 0.060 0.883
GDS/PDS sessions worked per week 0.730 0.604
Total sessions worked per week 0.664 0.662
Type of practice (Orthodontic only/Mixed) 0.000 0.704
Type of practice (Non-Corporate/ Corporate) 0.000 0.308
25
Table 7: Logistic regression predicting likelihood of outcome end-PAR score ≤5 (reference category in
bold)
p-value Odds
Ratio
95% Confidence Interval
Lower Upper
Single/Dual arch 0.000 7.98 3.28 19.42
Corporate/Non-corporate practice 0.000 3.77 2.19 6.65
Fixed/Functional+fixed 0.027 2.58 1.11 5.98
Non-specialist /specialist 0.001 2.38 1.42 4.00
Treatment duration 0.000 1.05 1.02 1.07
Start PAR score 0.001 1.03 1.02 1.06
Table 8: Summary of multiple regression analysis predicting improvement achieved in terms of
change in PAR score
Variable Unstandardised
coefficients
Standardised
coefficients
p-value 95% Confidence
Interval
B Standard
Error
ß Lower Upper
IOTN AC 3.13 0.31 0.42 0.000 2.52 3.91
IOTN DHC 1-3 or 4-5 5.20 1.57 0.13 0.001 2.12 7.97
Single/dual arch 5.04 1.81 0.11 0.006 1.48 8.60
Malocclusion 2.83 0.73 0.16 0.000 1.40 4.27