Embed Size (px)
Citation preview

FACTS &
FIGURES of the
us. PLASTICS INDUSTRY

FACTS &
FIGURES of the
U.S. PLASTICS INDUSTRY

Text printed on recycled paper @ FACTS &I FIGURES is prepared annually by The Society of the Plastics Industry All inquiries regarding its content should be addressed to The Society of the Plastics Industry, Inc., 1801 K Street, N.W , Suite 600K, Washington, D.C. 20006.
0 1997 The Society of the Plastics Industry, Inc. All rights reserved. No part of this publication may be reproduced in any form without permission from SPI.
Released: September 1997
Price: $95.00 (SPI members); $190.00 (non-members)

he Society of the Plastics Industry, rnc. is a trade association of more than 2,000 members T representing all segments of the plastics
industry in the United States. SPl's business units and committees are composed of plastics processors, raw material suppliers, machinevy manufacturers, moldmakers and other industry-related groups and individuals. Founded in 1937, SPf serves as the "voice" ofthe plastics industvy.
SPI's mission is to promote the continued development of the plastics industry and enhance public understanding of plastics' contributions while meeting the needs of society
SPI represents the plastics industry before government bodies, the public and industry groups with which the plastics industry has marketplace relationships. SPI provides forums
Headquarters: 1801 K Street, N.W, Suite 600K Washington, DC 20006 (202) 974-5200
Northeast Regional Office: 400 W Cummings Park, Suite 6900 Woburn, MA 01801
Coleman, Betty
Midwest Regonal Office: 8600 West Bryn Mawr Avenue Suite 960-N Chicago, IL 60631
Faurot, Susan Czizik, Patti
that enable diverse interests within the industry to set policy and develop common goals and objectives, as well as programs to carry them out.
-
-
SPI communicates the value of the plastics industry and its products to various audiences. I t serves as a technical and information resource for the plastics industry, providing expertise, statistical data, publications and general industry information. SPI also sponsors two major industly trade shows: NPE and Plastics USA.
SPI's 36 business units and special committees serve the specialized needs of various industry segments such as materials, manufacturing processes and end markets. In addition, four regional offices serve member needs on a more localized basis.
Southern Regional Ofrice: Nations Bank Building, Suite 606 7 North Laurens Street Greenville, SC 29601
Sturgis, Richard A. Rastatter. Pamela
Westem Regional Office: 2151 Michelson Drive, Suite 240 Irvine, CA 92715
Capolupo, Frank Godwin, Mike Plummer. Debbie
New York Office: 355 Lexington Avenue New York,, NY 10017

he SPI Committee on Resin Statistics is composed of over 100 representatives from T plastics resin producing companies, trade
publications, industry -related professional organizations, and various agencies ofthefederal government. All members of the Committee are quite knowledgeable about the rapidly growing plastics industry and have a special interest in developing marketing and economic data.
The Committee is responsible for developing and maintaining a monthly report on the major plastics materials. This report shows monthly and cumulative data on production and sales &I use (including captive operations), with percent change from the previous year. It is the only detailed monthly report on plastics materials now available. Nearly one hundred producers participate in the monthly program, and are believed to
represent about 95% of total U.S. plastics production. Many of the materials covered reflect 100% industry coverage. The data are compiled by the Association Services Group, LLC, a business of the accounting firm Johnson Lambert & Co. located in Bethesda, Maryland.
The Committee is actively involved with various federal government agencies (International Trade Commission, Department of Commerce, Bureau of the Census, Federal Reserve, etc.), and assists them in developing and improving the plastics segments of their reports.
The Committee also is responsible for monitoring all resin data that appear in FACTS & FIGURES, thus ensuring the most accurate and timely data.

General Statistics Development of Today's Plastics . . . . . . . . . . . . . . . . . . . . . . . . . . . . . . . . . . 3 Introduction of Plastic Resins . . . . . . . . . . . . . . . . . . . . . . . . . . . . . . . . . . . . 6 Plastics Monomer Derivatives . . . . . . . . . . . . . . . . . . . . . . . . . . . . . . . . . . . . 7
Ethylene . . . . . . . . . . . . . . . . . . . . . . . . . . . . . . . . . . . . . . . . . . . . . . . . . 7 Methane . . . . . . . . . . . . . . . . . . . . . . . . . . . . . . . . . . . . . . . . . . . . . . . . . 8 Acetylene . . . . . . . . . . . . . . . . . . . . . . . . . . . . . . . . . . . . . . . . . . . . . . . . 9 Butadiene . . . . . . . . . . . . . . . . . . . . . . . . . . . . . . . . . . . . . . . . . . . . . . . 10 Propylene . . . . . . . . . . . . . . . . . . . . . . . . . . . . . . . . . . . . . . . . . . . . . . . 11 Benzene . . . . . . . . . . . . . . . . . . . . . . . . . . . . . . . . . . . . . . . . . . . . . . . . 12 Naphthalene, Toluene and Xylenes . . . . . . . . . . . . . . . . . . . . . . . . . . . 13
Plastics SIC Codes . . . . . . . . . . . . . . . . . . . . . . . . . . . . . . . . . . . . . . . . . . . . 14 Plastics Materials and Products Industry Trends . . . . . . . . . . . . . . . . . . . . . 16
Plastics Materials and Resins (SIC 2821) . . . . . . . . . . . . . . . . . . . . . . . 16 Miscellaneous Plastics Products (SIC 308) . . . . . . . . . . . . . . . . . . . . . . 16
Plastics Compared to Other Manufacturing Industries . . . . . . . . . . . . . . . . 17 Financial and Operating Ratios - Processing Industry . . . . . . . . . . . . . . . . . 18
Balance Sheet . . . . . . . . . . . . . . . . . . . . . . . . . . . . . . . . . . . . . . . . . . . . 18 Income Statement . . . . . . . . . . . . . . . . . . . . . . . . . . . . . . . . . . . . . . . . . 18 Statistical Data . . . . . . . . . . . . . . . . . . . . . . . . . . . . . . . . . . . . . . . . . . . 19
Major Markets Definitions of Major Market Categories . . . . . . . . . . . . . . . . . . . . . . . . . . . 23 Total Sales & Captive Use by Major Market (1992-1996) . . . . . . . . . . . . . 25 Percentage Distribution of Resins by Major Market . . . . . . . . . . . . . . . . . . 26
All Resins (1991-1996) . . . . . . . . . . . . . . . . . . . . . . . . . . . . . . . . . . . . . 26 Thermoset Resins . . . . . . . . . . . . . . . . . . . . . . . . . . . . . . . . . . . . . . . . . 28 Thermoplastic Resins . . . . . . . . . . . . . . . . . . . . . . . . . . . . . . . . . . . . . . 28
Major Market Report . . . . . . . . . . . . . . . . . . . . . . . . . . . . . . . . . . . . . . . . . 29 Total Thermoset Resins . . . . . . . . . . . . . . . . . . . . . . . . . . . . . . . . . . . . . 29 Total Thermoplastic Resins . . . . . . . . . . . . . . . . . . . . . . . . . . . . . . . . . . 29 Individual Plastics Resins . . . . . . . . . . . . . . . . . . . . . . . . . . . . . . . . . . . 30
Resin Statistics Production and Sales & Captive Use . . . . . . . . . . . . . . . . . . . . . . . . . . . . . 35
All Resins (1971-1996) . . . . . . . . . . . . . . . . . . . . . . . . . . . . . . . . . . . . . 35 Individual Plastics Resins (1987-1996) . . . . . . . . . . . . . . . . . . . . . . . . 36
Domestic Merchant Sales by Plastics Resins . . . . . . . . . . . . . . . . . . . . . . . 39 Apparent U.S. Consumption of Selected Plastics Resins . . . . . . . . . . . . . . . 40
.

Resin Statistics Summary Statistics . . . . . . . . . . . . . . . . . . . . . . . . . . . . . . . . . . . . . . . . . . . . 43
Manufacturers . . . . . . . . . . . . . . . . . . . . . . . . . . . . . . . . . . . . . . . . . . . . 44 Production and Sales & Captive Use . . . . . . . . . . . . . . . . . . . . . . . . . . 44 Domestic Consumption by End-Use . . . . . . . . . . . . . . . . . . . . . . . . . . 44 Distribution by Major Market . . . . . . . . . . . . . . . . . . . . . . . . . . . . . . . . 45 Typical Applications . . . . . . . . . . . . . . . . . . . . . . . . . . . . . . . . . . . . . . . 45
Manufacturers . . . . . . . . . . . . . . . . . . . . . . . . . . . . . . . . . . . . . . . . . . . . 46 Production and Sales & Captive Use . . . . . . . . . . . . . . . . . . . . . . . . . . 46 Typical Applications . . . . . . . . . . . . . . . . . . . . . . . . . . . . . . . . . . . . . . . 46 Domestic Consumption by End-Use . . . . . . . . . . . . . . . . . . . . . . . . . . 47 Distribution by Major Market . . . . . . . . . . . . . . . . . . . . . . . . . . . . . . . . 47
Unsaturated Polyester . . . . . . . . . . . . . . . . . . . . . . . . . . . . . . . . . . . . . . . . . 48 Manufacturers . . . . . . . . . . . . . . . . . . . . . . . . . . . . . . . . . . . . . . . . . . . . 48 Production and Sales & Captive Use . . . . . . . . . . . . . . . . . . . . . . . . . . 48 Typical Applications . . . . . . . . . . . . . . . . . . . . . . . . . . . . . . . . . . . . . . . 48 Domestic Consumption by End-Use . . . . . . . . . . . . . . . . . . . . . . . . . . 49 Distribution by Major Market . . . . . . . . . . . . . . . . . . . . . . . . . . . . . . . . 49
Manufacturers . . . . . . . . . . . . . . . . . . . . . . . . . . . . . . . . . . . . . . . . . . . . 50 Production and Sales 6r Captive Use . . . . . . . . . . . . . . . . . . . . . . . . . . 50 Domestic Consumption by End-Use . . . . . . . . . . . . . . . . . . . . . . . . . . 52 Distribution by Major Market . . . . . . . . . . . . . . . . . . . . . . . . . . . . . . . . 52 Typical Applications . . . . . . . . . . . . . . . . . . . . . . . . . . . . . . . . . . . . . . . 52
Isocyanates . . . . . . . . . . . . . . . . . . . . . . . . . . . . . . . . . . . . . . . . . . . . . . . . . . . 53 Manufacturers . . . . . . . . . . . . . . . . . . . . . . . . . . . . . . . . . . . . . . . . . . . . 53 Production and Sales & Captive Use . . . . . . . . . . . . . . . . . . . . . . . . . . 53
Polyether Polyols . . . . . . . . . . . . . . . . . . . . . . . . . . . . . . . . . . . . . . . . . . . . 54 Manufacturers . . . . . . . . . . . . . . . . . . . . . . . . . . . . . . . . . . . . . . . . . . . . 54 Production and Sales & Captive Use . . . . . . . . . . . . . . . . . . . . . . . . . . 54
Polyester Polyols . . . . . . . . . . . . . . . . . . . . . . . . . . . . . . . . . . . . . . . . . . . . . 55 Manufacturers . . . . . . . . . . . . . . . . . . . . . . . . . . . . . . . . . . . . . . . . . . . . 55 Production and Sales & Captive Use . . . . . . . . . . . . . . . . . . . . . . . . . . 55
Polyurethane . . . . . . . . . . . . . . . . . . . . . . . . . . . . . . . . . . . . . . . . . . . . . . . . 56 Sales by Material . . . . . . . . . . . . . . . . . . . . . . . . . . . . . . . . . . . . . . . . . . 56 Domestic Consumption by End-Use . . . . . . . . . . . . . . . . . . . . . . . . . . 56
Epoxy . . . . . . . . . . . . . . . . . . . . . . . . . . . . . . . . . . . . . . . . . . . . . . . . . . . . . 44
Phenolic . . . . . . . . . . . . . . . . . . . . . . . . . . . . . . . . . . . . . . . . . . . . . . . . . . . 46
UreaandMelamine . . . . . . . . . . . . . . . . . . . . . . . . . . . . . . . . . . . . . . . . . . . 50
Thermodastic Resins 1 . Summary Statlstics . . . . . . . . . . . . . . . . . . . . . . . . . . . . . . . . . . . . . . . . . . . 59
Latex Materials . . . . . . . . . . . . . . . . . . . . . . . . . . . . . . . . . . . . . . . . . . . . . . 61 ABSandSAN . . . . . . . . . . . . . . . . . . . . . . . . . . . . . . . . . . . . . . . . . . . . . . . 62
Manufacturers . . . . . . . . . . . . . . . . . . . . . . . . . . . . . . . . . . . . . . . . . . . . 62 Production and Sales & Captive Use . . . . . . . . . . . . . . . . . . . . . . . . . . 62 Distribution by Major Market . . . . . . . . . . . . . . . . . . . . . . . . . . . . . . . . 63 Typical Applications . . . . . . . . . . . . . . . . . . . . . . . . . . . . . . . . . . . . . . . 63
...

Engineering Thermoplastic Resins . . . . . . . . . . . . . . . . . . . . . . . . . . . . . . . 64 Typical Applications . . . . . . . . . . . . . . . . . . . . . . . . . . . . . . . . . . . . . . . 64 Manufacturers . . . . . . . . . . . . . . . . . . . . . . . . . . . . . . . . . . . . . . . . . . . . 65 Production and Sales & Captive Use . . . . . . . . . . . . . . . . . . . . . . . . . . 65 Distribution by Major Market . . . . . . . . . . . . . . . . . . . . . . . . . . . . . . . . 65
High Density Polyethylene . . . . . . . . . . . . . . . . . . . . . . . . . . . . . . . . . . . . . 66 Manufacturers . . . . . . . . . . . . . . . . . . . . . . . . . . . . . . . . . . . . . . . . . . . . 66 Capacity and Utilization . . . . . . . . . . . . . . . . . . . . . . . . . . . . . . . . . . . . 66 Production and Sales 65 Captive Use . . . . . . . . . . . . . . . . . . . . . . . . . . 66 Domestic Consumption by End-Use . . . . . . . . . . . . . . . . . . . . . . . . . . 67 Distribution by Major Market . . . . . . . . . . . . . . . . . . . . . . . . . . . . . . . . 67 Typical Applications . . . . . . . . . . . . . . . . . . . . . . . . . . . . . . . . . . . . . . . 67 Distribution by Selected End-Uses . . . . . . . . . . . . . . . . . . . . . . . . . . . . 69
Low Density Polyethylene . . . . . . . . . . . . . . . . . . . . . . . . . . . . . . . . . . . . . 70 Manufacturers . . . . . . . . . . . . . . . . . . . . . . . . . . . . . . . . . . . . . . . . . . . . 70 Capacity and Utilization . . . . . . . . . . . . . . . . . . . . . . . . . . . . . . . . . . . . 70
Domestic Consumption by End-Use . . . . . . . . . . . . . . . . . . . . . . . . . . 70 Distribution by Selected End-Uses . . . . . . . . . . . . . . . . . . . . . . . . . . . . 71
Linear Low Density Polyethylene . . . . . . . . . . . . . . . . . . . . . . . . . . . . . . . . 72 Manufacturers . . . . . . . . . . . . . . . . . . . . . . . . . . . . . . . . . . . . . . . . . . . . 72 Capacity and Utilization . . . . . . . . . . . . . . . . . . . . . . . . . . . . . . . . . . . . 72
Domestic Consumption by End-Use . . . . . . . . . . . . . . . . . . . . . . . . . . 72
Nylon . . . . . . . . . . . . . . . . . . . . . . . . . . . . . . . . . . . . . . . . . . . . . . . . . . . . . 74 Manufacturers . . . . . . . . . . . . . . . . . . . . . . . . . . . . . . . . . . . . . . . . . . . . 74 Capacity and Utilization . . . . . . . . . . . . . . . . . . . . . . . . . . . . . . . . . . . . 74
Production and Sales & Captive Use . . . . . . . . . . . . . . . . . . . . . . . . . . 70
Production and Sales & Captive Use . . . . . . . . . . . . . . . . . . . . . . . . . . 72
Distribution by Selected End-Uses . . . . . . . . . . . . . . . . . . . . . . . . . . . . 73
Production and Sales & Captive Use . . . . . . . . . . . . . . . . . . . . . . . . . . 74 Domestic Consumption by End-Use . . . . . . . . . . . . . . . . . . . . . . . . . . 75 Distribution by Major Market . . . . . . . . . . . . . . . . . . . . . . . . . . . . . . . . 75 Typical Applications . . . . . . . . . . . . . . . . . . . . . . . . . . . . . . . . . . . . . . . 75 Material Flow Chart . . . . . . . . . . . . . . . . . . . . . . . . . . . . . . . . . . . . . . . 76
Polystyrene . . . . . . . . . . . . . . . . . . . . . . . . . . . . . . . . . . . . . . . . . . . . . . 77 Material Flow Chart . . . . . . . . . . . . . . . . . . . . . . . . . . . . . . . . . . . . . . . 77 Manufacturers . . . . . . . . . . . . . . . . . . . . . . . . . . . . . . . . . . . . . . . . . . . . 78 Capacity and Utilization . . . . . . . . . . . . . . . . . . . . . . . . . . . . . . . . . . . . 78 Production and Sales & Captive Use . . . . . . . . . . . . . . . . . . . . . . . . . . 78 Domestic Consumption by End-Use . . . . . . . . . . . . . . . . . . . . . . . . . . 79 Distribution by Major Market . . . . . . . . . . . . . . . . . . . . . . . . . . . . . . . . 79 Typical Applications . . . . . . . . . . . . . . . . . . . . . . . . . . . . . . . . . . . . . . . 79

.
Polypropylene . . . . . . . . . . . . . . . . . . . . . . . . . . . . . . . . . . . . . . . . . . . . 80 Manufacturers . . . . . . . . . . . . . . . . . . . . . . . . . . . . . . . . . . . . . . . . . 80
Production and Sales & Captive Use . . . . . . . . . . . . . . . . . . . . . . . . . . 80 Domestic Consumption by End-Use . . . . . . . . . . . . . . . . . . . . . . . . . . 81 Distribution by Major Market . . . . . . . . . . . . . . . . . . . . . . . . . . . . . . . . 81 Typical Applications . . . . . . . . . . . . . . . . . . . . . . . . . . . . . . . . . . . . . . . 81
Polyvlnyl Chloride . . . . . . . . . . . . . . . . . . . . . . . . . . . . . . . . . . . . . . . . . . . 82 Manufacturers . . . . . . . . . . . . . . . . . . . . . . . . . . . . . . . . . . . . . . . . . . . . 82 Capacity and Utilization . . . . . . . . . . . . . . . . . . . . . . . . . . . . . . . . . . . . 82 Production and Sales & Captive Use . . . . . . . . . . . . . . . . . . . . . . . . . . 82 Typical Applications . . . . . . . . . . . . . . . . . . . . . . . . . . . . . . . . . . . . . . . 82 Domestic Consumption by End-Use . . . . . . . . . . . . . . . . . . . . . . . . . . 83 Distribution by Major Market . . . . . . . . . . . . . . . . . . . . . . . . . . . . . . . . 83
Thermoplastic Polyester . . . . . . . . . . . . . . . . . . . . . . . . . . . . . . . . . . . . . . . 84 Manufacturers . . . . . . . . . . . . . . . . . . . . . . . . . . . . . . . . . . . . . . . . . . . . 84 Capacity and Utilization . . . . . . . . . . . . . . . . . . . . . . . . . . . . . . . . . . . . 84 Production and Sales & Captive Use . . . . . . . . . . . . . . . . . . . . . . . . . . 84 Domestic Consumption by End-Use . . . . . . . . . . . . . . . . . . . . . . . . . . 85 Distribution by Major Market . . . . . . . . . . . . . . . . . . . . . . . . . . . . . . . . 85 Typical Applications . . . . . . . . . . . . . . . . . . . . . . . . . . . . . . . . . . . . . . . 85 Material Flow Diagram . . . . . . . . . . . . . . . . . . . . . . . . . . . . . . . . . . . . . 88
by Process Grade . . . . . . . . . . . . . . . . . . . . . . . . . . . . . . . . . . . . . . . . . 86
Capacity and Utilization . . . . . . 80 . . . . . . . . . . . . . . . . . . . . . . . . . . .
Domestic Sales and Captive Use of Selected Thermoplastics
Integrated Solid Waste Management v .
The American Plastics Council. . . . . . . . . . . . . . 90 PlasticsRecycling . . . . . . . . . . . . . . . . . . . . . . . . . . . . . . . . . . . . . . . . . . . . 91 Municipal Solid Waste . . . . . . . . . . . . . . . . . . . . . . . . . . . . . . . . . . . . . . . . 91
Flow Chart: Raw Material to Finished Product . . . . . . . . . . . . . . . . . . . . . 94
Overview . . . . . . . . . . . . . . . . . . . . . . . . . . . . . . . . . . . . . . . . . . . . 95
Fabricated Plastic Products Composites . . . . . . . . . . . . . . . . . . . . . . . . . . . . . . . . . . . . . . . . . . . . . . 95
Shipments by Market . . . . . . . . . . . . . . . . . . . . . . . . . . . . . . . . . . . . . . 95 Vinyl Siding and Soffit . . . . . . . . . . . . . . . . . . . . . . . . . . . . . . . . . . . . . . . . 96
U.S. Shipments . . . . . . . . . . . . . . . . . . . . . . . . . . . . . . . . . . . . . . . . . . . 96 Participating Producers . . . . . . . . . . . . . . . . . . . . . . . . . . . . . . . . . . 96
.

Processing & Machinery Description of Processing Methods . . . . . . . . . . . . . . . . . . . . . . . . . . . . . . . 98 Shipments of Plastics Machinery . . . . . . . . . . . . . . . . . . . . . . . . . . . . . . . 101
Injection Molding Machinery . . . . . . . . . . . . . . . . . . . . . . . . . . . . . . . 101 Single Screw Extrusion Machinery . . . . . . . . . . . . . . . . . . . . . . . . . . . 101
Glossary
Other Sources of Plastics Information
Additives for Plastics . . . . . . . . . . . . . . . . . . . . . . . . . . . . . . . . . . . . . . . . . 105 Definitions of Resins . . . . . . . . . . . . . . . . . . . . . . . . . . . . . . . . . . . . . . . . . 107 Definitions of Selected Plastics Properties . . . . . . . . . . . . . . . . . . . . . . . . . 114
Business Consulting Groups . . . . . . . . . . . . . . . . . . . . . . . . . . . . . . . . . . . 121 Government Publications . . . . . . . . . . . . . . . . . . . . . . . . . . . . . . . . . . . . . 121 Newspapers . . . . . . . . . . . . . . . . . . . . . . . . . . . . . . . . . . . . . . . . . . . . . . . 122 Trade Associations and Professional Organizations . . . . . . . . . . . . . . . . . 122
. . . . . . . . . . . . . . 122 Trade Publications . . . . . . . . . . . . . . . .
Order Forms Monthly Statistical Report . Resins . . . . . . . . . . . . . . . . . . . . . . . . . . . . . . 125 Facts & Figures of the U.S. Plastics Industry . . . . . . . . . . . . . . . . . . . . . . 129
Index Index . . . . . . . . . . . . . . . 133


!

i
i
day’s plastics are one of the most used materials on a volume basis in U.S. T industrial and commercial life. Plastics are
broadly integrated into today’s lifestyle and make a majol; irreplaceable contribution to virtually all product areas. Although the plastics industvy in the United States is now in its second centuvy, the most important developments have occurred since 1910. However; the roots ofthese modern developmentsgo back not only to the research of cellulose nitrate byJohn Wesley Hyatt in the 1860s, but also to the plastic-like compositions used by man through the centuries.
Following work by Pelouze, Schonbein established conditions of controlled nitration of cellulose. The product soon became of interest as an explosive and in the manufacture of collodion, a cellulose solution in an alcohol-ether mixture. In the 1850s, the English inventor Alexander Parkes observed that the solid residue left after the evaporation of the solvent of photographic collodion was a “hard, horny elastic and waterproof substance.” In 1856, he patented the process of waterproofing woven fabrics by the use of such materials.
Origin of Plastics One can go as far back as the Old Testament to find references about natural materials used as fillers, adhesives, coatings, and the like. These materials were the precursors of modem plastic materials. Historians continue to differ as to the exact year or decade that the plastics industry began because the definition of “plastic” is a matter of interpretation.
Certainly, the history of the rubber industry has a bearing on plastics. This is because ebonite, or hard rubber, discovered in 1851, was the first thermosetting material to be prepared and the first material that involved a distinct chemical modification of a natural material. But ebonite was not exploited commercially for some years after its discovery; for that reason, its historical importance has become somewhat blurred.
European Developments While the basic processes of rubber technology were developing, other important discoveries were taking place in Europe.
In 1862, at the Great Exhibition in London, Parkes introduced a new material named for himself- Parkesine. Parkesine was obtained by dissolving cellulose nitrate in a minimum of solvent. The mixture was then put on a heated rolling machine from which some of the solvent was then removed. While still in the plastic state the material was then shaped by dies or pressure. In 1866, Parkes organized the Parkesine Company to manufacture products from his new material, but the company failed in 1868. This appears to be due, in part, to Parkes’ attempt to reduce production costs that resulted in the production of inferior items.
One year after the failure of the Parkesine Company, an associate of Parkes, Daniel Spill, formed the Xylonite Company to manufacture products similar to Parkesine. Once again, economic failure resulted and Spill’s company went bankrupt in 1874. Undaunted, Spill moved to a new site, established the Daniel Spill Company, and continued production of his material, Xylonite.

First Plastics in the U.S. n the United States during the I860sJohn Wesley Hyatt experimented with cellulose I nitrate. In 1865, Hyatt became involved in
devising a methodfor producing billiard balls from materials other than ivory. Originally using mixtures ojcloth, ivory dust, and shellac, he patented in 1869 the use of collodionfor coating billiard balls. The patent came one year after his collodion material was introduced commercially.
John W Hyatt and his brother Isaiah took out U.S. Patent 105,338 in 1870 for a process of producing a horn-like material using cellulose nitrate and camphor. Although Parkes and Spill had mentioned camphor in their work, the Hyatt brothers recognized the value of camphor as a plasticizer for cellulose nitrate. In 1872, the term “celluloid was coined by Isaiah Hyatt to describe the Hyatts’ commercially successful product.
The validity of Hyatts’ patents was challenged by Spill, and a number of court actions took place between 1877 and 1884. In the final action, it was found that Spill had no claim on the Hyatt brothers’ patents, the judge ruling that Parkes was the true inventor of the process because he had mentioned the use of camphor in his patents. Thus, there was no restriction on the use of these processes and any company, including the Hyatts’ Celluloid Manufacturing Company, was free to use them. After that decision, the Celluloid Manufacturing Company prospered, changed its name to the American Cellulose Chemical Corporation, and eventually was absorbed by the Celanese Corporation.
Formaldehyde Resins ext to cellulose nitrate, the most important material in the early history ofplastics was Nf ormaldehyde. Around 1897 there was a
demand in German schoolsfor a white chalkboard. Efforts to obtain such a product resulted in the discovery of casein plastics, produced by reacting casein (milk protein) with formaldehyde. The material soon became established under the trade names of Galalith and Erinoid. Today, casein still is used by the button industry
In 1899, Arthur Smith took out British Patent 16,275, the first dealing with phenol- formaldehyde resins for use as an ebonite substitute in electrical insulation. During the next decade, the phenol-formaldehyde reaction was investigated mainly for academic interest. In 1907, however, Leo Hendrik Baekeland discovered techniques to control and modify the reaction so that useful products could be made from it. Thus, phenolics were the first fully synthetic resins to become commercially successful.
Prompted by the success of phenolic moldings, research began on reacting other materials, such as urea and thiourea, with formaldehyde. These materials were used to manufacture molding powders. Unlike phenolics, they could be molded into light- colored articles and rapidly achieved commercial success. Today, these urea-based resins are used for molding powders, adhesives, and textile and paper finishing, while the related melamine-formaldehyde resins are used in decorative laminates.

Growth of Modern Plastics ellulose acetate, a themoplastic, was developed about the same time as the urea- C based resins. Similar in structure to cellulose
nitrate, it wasJuund tu be safer to process and use. Cellulose acetate was introduced as a molding compound in 1927.
The period 1930-1940 saw the initial commercial development of today's major thermoplastics: polyvinyl chloride, low density polyethylene, polystyrene, and polymethyl methacrylate. The advent of World War I1 in 1939 brought plastics into great demand, largely as substitutes for materials in short supply, such as natural rubber. In the United States, the crash program leading to large-scale production of synthetic rubbers resulted in extensive research into the chemistry of polymer formation and, eventually, to the development of more plastic materials.
The first decade after World War I1 saw the development of polypropylene and high density polyethylene and the growth of the new plastics in many applications. Linear low
density polyethylene was introduced in 1978 and made it possible to produce polyethylenes with densities ranging from 0.90 to 0.96. Large-scale production of these materials reduced their cost dramatically, The new materials began to compete with the older plastics and even with the more traditional materials such as wood, paper, metal, glass, and leather. The introduction of alloys and blends of various polymers made it possible to tailor properties to fit certain performance requirements that a single resin could not provide. The demand for plastics has increased steadily; plastics are now accepted by designers and engineers as basic materials along with the more traditional materials. The automotive industry, for instance, relies on plastics to reduce weight and thus increase energy efficiency

YEAR MATERIAL EXAMPLE 1868 . . . . . . . . . . . . . . . . . . . Eyeglass Frames 1909 . . . . . . . . . . . . . . . Phenol-Formaldehyde . . . . . . . . . . . . . . . . . . . Telephone Handset
. . . . . . . . . . . . . . . . . . . . . . . . . . . . . . . Electrical Bases . . . . . . . . . . . . . . Toothbrushes
1929 . . . . . . . . . . . . . . . Urea-Formaldehyde. . . . . . . . . . . . . . . . . . . . . Lighting Fixtures
1936 . . . . . . . . . . . . . . . Acrylic . . . . . . . . . . . . . . . . . . . . . . . . . . . . . . . Brush Backs 1935 . . . . . . Ethyl Cellulose . . . . Flashlight Cases
1936 . . . . . . . . . . . . . . . Polyvinyl Acetate. . . .
1938 . . . . . . . . . . . . . . .
1939 . . . . . . . . . . . . . . . Polyvinylidene Chloride . . . . . . . . . . . . . . . . . Packaging Film . . . . . . . Melamine-Formaldehyde . . . . . . . . . . . . . Unsaturated Polyester
. . . . . . . . . . Low Density Polyethylene . . . . . . . Fluoropolymers . . . . .
Epoxy . . . . . . . . . . . .
1943 . . . . . . . . . . . . . . . Silicone Motor Insulation Cellulose Propionate . . . . . . . . . . . . . . . . . . . . Pens and Pencils
Acrylonitrile-Butadiene-Styrene (ABS) . . . . . . Luggage Styrene-Acrylonitrile (SAN) . . . . . . . . . . . . . . . Housewares Polyurethane . . . . . . . . . . . . . . . . . . Foam Cushions
. . . . Tools and Jigs
1956 . . . . . . . . . . . . . . . Acetal. . . . . . . . . . . . . . . . . . . . . . . . . . . . . . . . Automotive Parts 1957 1957 . . . . . . . . . . . . . . . Polypropylene . . . . . . . . . . . . . . . . . . . . . . . . . Safety Helmets
. . . High Density Polyethylene . . . . . . . . . . . .
. . . . . Polycarbonate . . . . . . . . Appliance Parts
. . . . . . . . . . . . . . . . . . . . . . . . . . . . . . Skin Packaging
Valves and Fittings Bottles
Battery Cases
Adhesives and Coatings
1964 . . . . . . . . . . . . . . . Polyphenylene Oxide Polymide. . . . . . . . . . . . . . . . . . . . . . . . . . . . . Bearings
. . . . . . . . . . . . . . . . . . ElectricaVElectronic Parts r . . . . . . . . . . . . . . . . . ElectricaVElectronic Parts
. . . . . . Polybutylene . . . . . . . . . Piping 1973 . . . . . . . . . . . . . . . Polyphenylene Sulfide . . . . . . . . . . . . . . . . . . . Telecommunications
1975 . . . . . . . . . . . . . . . . . . . . . Polyethersulfone . . . . . Printed Circuit Boards
Nitrile Barrier Resins . . . . . . . . . . . . . . . . . . . . Non-food Packaging
Polyetherimide . . . . . . . . . . . . . . . . . . ElectricaVElectronic Parts Linear Low Density Polyethylene . . . . . . . . . . Extruded Film
1983 . . . . . . . . . . . . . . . Polyetheretherketone. . . . . . . . . . . . . . . . . . . . Wire and Cable 1984 . . . . . . . . Aromatic Copolyester . . . . ElectricaVElectronic Parts 1985 . . . . . . . . . . . . . . . Liquid Crystal Polymers ElectricaVElectronic Parts 1988 . . . . . . . . . . . . . . . Polymethylpentene . . . High Temp.mransparent
Polyethylene Naphthala Films,Containers, Bamer Resin

rE thylene From Refinery Gas Liquefied Petroleum Gases Liquid Hydrocarbons
__
E SBR Rubber Styrene-butadiene Copolymers Styrene-alkyd Polyesters Polystyrene -I Other Styrene Resins
Ethylbenzene --f Styrene
High Density Polyethylene + Law Density
EthyleneNinyl Acetate Copolymers
I Linear Low Density
Ethylene Glycol - Polyethylene Terephthalate
Tnethylene Glycol }+{ Polyesters Diethylene Glycol
Ethylene Oxide +
Propylene Copolymers Linear Alpha-olefins + Linear Low-density Polyethylene
Ethylene-propylene Elastomers
Polyester Polyols -Polyurethanes { Propionic Acid - Cellulose Acetate Propionate Trimethylolethane -Alkyds
Propionaldehyde +
{ Trichloroethane---bVinylidene Chloride -Polpnylidene Chloride Ethylene Dichloride -+ Vinyl Chloride- Polynnyl Chloride & Copolymers
Polyvinyl Butyral Polyvinyl Formal
Acetic Acid Cellulose Acetate+ Copolymers Acetaldehyde - Vinyl Acetate {Polyvinyl Acetate+Polyvinyl Alcohol-
Polyvinyl Butyral Polyinyl Formal Polyvinyl Acetate -Polyvinyl Alcohol
Other Copolymers Vinyl Acetate --r, EthyleneNinyl Acetate Copolymers
Vinyl Toluene -Polyesters
- ~~~~~
Source: Extracted in pan irom SRI Intemational, Chemical Origins G Markets.

Source. Exrracted in part from SRI Intemationsl, Chumical Origins & Markcti

3 0
L L 2 1 i 0 a
i
8 3 c7
_-
Source: Exlrmed ~n part tmni SRI Intematv". Chrmical Ongins 0 Murkeh.

Butadiene D From:
Olefin Coproduct Butylene Dehydrogenation
I I
- ABS
Styrene-butadiene Latexes
Adiponitnle P H e x a m e t h y I e n e d i a m e - Bamer Resins
MBS (Impact Modifien)
SBR Rubber
Polybutadiene Rubber
Thermoplastic Elastomers
Cyclododecatnne - 1, 12 - Dodecanedioic Acid
- Nylon 66
Nylon 612
Hexmethylem -
Nylon 612
: Diisocyanate -Polyurethanes

Source: Extracted in part from SRI Intemational. Chemical O@inr 0 Markets.

-r
I
Source. Extracted in pan Iron? SRI Imcmmonal, Chemical Ongm DMarkeli .
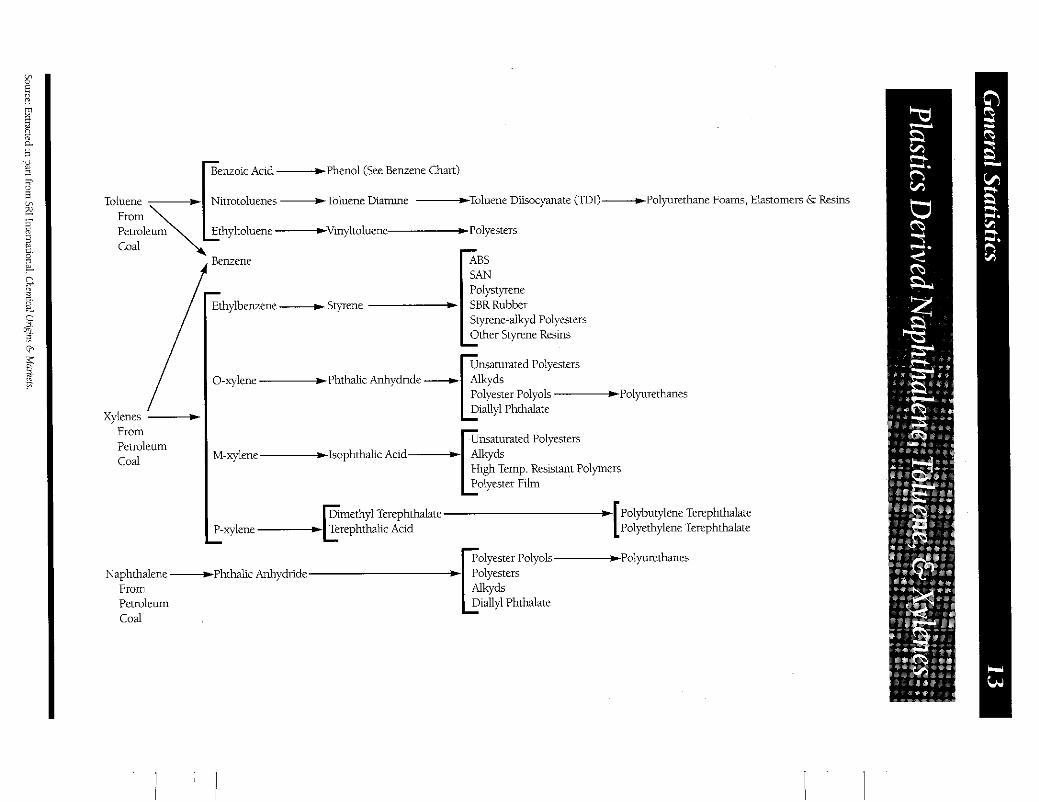
Benzoic Acid -Phenol (See Benzene Chart)
Toluene - Nitrotoluenes -Toluene Diamine -Toluene Dilsocyanate (TDI)-Polyurethane Foams, Elastomers 6s Resins From \[ Petroleum Ethyltoluene -Vinyltoluene-Polyesters Coal
/i:b:mene - Styrene - PoIystFene
Styrene-alkyd Polyesters
Polyester Polyols -Polyurethanes Diallyl Phthalate
0-xylene -Phthalic Anhydride
Xvlenes - Unsaturated Polyesters I M-xvlene-Isoohthalic Acid-Lkds
From Petroleum ,.,
I coal High Temp. Ramant Polymers
Polybutylene Terephthalate Polyethylene Terephthalate
Dimethyl Terephthalate P-xylene - Terephthalic Acid
Polyester Polyols -Polyurethanes * Polyesters
I C L W s
Naphthalene -Phthalic Anhydride From Petroleum Diallyl Phthalate Coal
I 1 I ' I

The Plastics Industrv I
and SIC Codes he Standard Industrial Classijcation (SIC) is a numerical system developed by thefederal T government to classiJy the total economy
into different industry segments. It is a classijcation of establishments’ by type of economic activity in which they are engaged. Its puyposes are (1) to facilitate the collection, tabulation, presentation, and analysis of data relating to establishments and (21 to promote unformity and comparability in the presentation of statistical data collected by various agencies of thefederal government, state agencies, trade associations, and private research organizations.
Among the uses for the SIC system, the two- and four-digit SIC codes are the basis for agencies such as EPA and OSHA to target certain industry segments for regulatory activity
The History of SICS The SIC system was inaugurated in 1945 and at first covered only manufacturing industries. Four years later, the program was revised and enlarged to include all sectors of economic activity
Periodically since then the program has been refined further to reflect changes in the composition and structure of the U.S.
economy The incorporation of these changes and updates takes place about every five years. Changes may include refinements in industry detail or coverage, improvements in industry definitions, or clarification of industry classifications.
Major revisions, such as the addition of new industry codes, occur only once every 10 years. The 1987 edition of the Standard Industrial Classification Manual that was released in May 1989 reflects such a major revision that affects the plastics industiy
What’s New According to the Office of Management and Budget, the 1987 SIC revision has taken into account technological changes; institutional changes such as deregulation in the banking, communications, and transportation industries; and the tremendous expansion in the service sector.
For the plastics industry this revision includes the division of “miscellaneous plastics products” into nine separate SIC industry codes as opposed to the single listing for that category (3079) that had been in existence since 1947. The breakdown reflects the tremendous growth of the plastics industry and was intended to allow the industry to keep track of more detailed statistics.
‘An establishment is a single location at which economic actwily (i E . manufacturing) t a l e place. 11 is s)monymous with ‘‘plani;

How It Works 1987 Census of In most of these publications, each project or service is identified by a seven-digit code. This classification system operates so that the industrial coverage is progressively narrower with the successive addition of digits.
Classification of Major Industries
SIC Code Economic Division 01,02,07-09 Agriculture, Forestry, Fishing
10-14 Mining 15-17 Construction 20-39 Manufacturing* 40-49 Transportation, Public Utilities 50-51 Wholesale Trade 52-59 Retail Trade 60-67 Finance, Insurance, Real Estate 70-89 Services 91-97 Public Administration
Manufactures and the Plastics Industry New industry data include the addition of the nine new codes that have now replaced the single four-digit listing (3079) for "miscellaneous plastics products."
Industry Code 3081
3082
3083
3084 3085 3086 3087
3088 3089
Description
Unsupported plastics film &
Unsupported plastics profile
Laminated plastics plate, sheet &
Plastics pipe Plastics bottles Plastics foam products Custom compounding of
purchased resins Plastics plumbing fixtures Plastics products, not elsewhere
sheet
shapes
profile shapes
classified
* Plasacs fall under "Manufactunng".

Plastic Materials & Resins (SIC 2821) (millionsofdollars)
1994
Percent Change
1995 1994-95
Industry Data Value of shipment9 37,305 43,529 Total employment (000) 68.9 69.7 Production workers (000) 40.4 41.5 Average hourly eamings ($) 19.39 19.96 Capital expenditures 2,536 2,337
16.7 1.2 2.7 2.9
-7.7
Miscellaneous Plastics Products (SIC 308) (millions of dollars )
Percent Change
1994 1995 1994-95
Industry Data Value of shipmentsi 100,837 Total employment (000) 730.2 Production workers (000) 572.8 Average hourly eamings ($) 10.36 Capital expenditures 4,597.8
108,555 763.4 599.4 10.47
5,433.3
' Value of all products and S ~ M C C S sold by establishments in the plastics material and resin industry 'Value of all produas and seMccs sold by establishments in the mix plastics products.
7.7 4.5 4.6 1.1
18.2
Source: U.S. Department of Commerce. Bureau of the Census, Economics & Sratisucs Administration

Relative 1995Rank SIC Industry
1995' Industry
Shipments (Mil. Dollars)
1 2 3 4
* 5
6 7 8 9 10
11
13 14 15
* 12
16 17 18 19 20
3711 26
2911 367 308
3714 331 3674 275 2834
3721 2821 2711 3812 3663
2015 2653 281 3577 3761
Motor vehicles & car bodies Paper & allied products Petroleum refining Electronic components 6s accessories Misc. plastics products, n.e.c.
Automotive parts & accessories Steel mill products Semiconductors Commercial printing Pharmaceutical preparations
Aircraft Plastics materials & resins Newspapers Search and navigation equipment Radio and TV communications equipment
Poultry slaughtering and processing Corrugated and solid fiber boxes Industrial inorganic chemicals, exc. pigments Computer peripheral equipment Guided missiles and space vehicles
' Most rccent actual data available from the Orpartmen1 n i Commerce ~ .
$200,939 172,638 136,023 119,288 108,555
107,417 74,547 65,623 65,093 57.943
49,504 43,529 37,732 29,435 29,360
28,887 27,521 26,722 14,719 14,315
Source U 5. Depailment of Commcrce, Rurcau ofthe Census, Economics & Statistics Administration

- -~
Plastics Processing Industry - 1996 BALANCE SHEET‘ TOTAL
Cash and Marketable Securities . . . . . . . . . . . . . . 3.4 Accounts Receivable . . . . . . . . . . . . . . . . .21.8
. . . . . . . . . . . . . . . . -0.8
TOTAL CURRENT ASSETS . . . . . . . . . . . . . . . . . ,43.3 12.4
Other Currenl Ass . . . . . . . .
Land and Buildings (net of depreciation) Machinery, Equipment and Tooling (net o
depreciation) . . . . . . . . . . .27.0 Other Long Term Assets . . . . . . . . . . . . . . . . . . . . . . . 17.3 TOTAL ASSETS .......................... 100.0
Accounts Payable . . . . . . . . . . . . . . Other Current Liabilities . . . . . . . . . Current Portion of Long Term Debt
Deferred Income Taxes . . . . . . . TOTAL CURRENT LIABILITIES . . . . . . . . . . . . . .21.1
. . . . 1.1
TOTAL LIABILITIES . . . . . . . . . . . . . . . . . . .45.4 EQUITY (NET WORTH) .................... .54.6 TOTAL LIABILITIES and NET WORTH , . , . . , . 100.0 INCOME STATEMENT’
Long Term Liabilities (less current portion) . . . . 22.5
$5MM
7.0 28.3 14.3 7.1 1.0 5.3
-0.2 2.5
52.1 18.9
26.6 2.4
100.0 9.5 9.5 5.5
24.5 0.4
40.1 66.4 33.7
100.0
S. ,LES 5-10MM
7.1 27.0 23.4 11.5 6.3 6.5
-0.6 1.9
59.3 7.7
32.0 1.0
100.0 13.9 11.5 5.4
30.7 0.1
10.9 41.7 58.3
100.0
~
__
~
ILUME 10-25Mk
6.2 23.4 14.6 7.5 1.2 6.3
-1.4 2.0
46.3 14.4
31.9 7.4
100.0 10.3 13.8 4.4
28.5 1.8
20.1 51.3 48.7
100.0
NET SALES (1) ........................... 100.0 Direct Materials . . . . . . . . . . . . . . . . . . . . . . . . .45.8 Direct Labor . . . . . . . . . . . . . . . . . . . . . . . . . . . . .8.7 Indirect Labor . . . . . . . . . . . . . . . . . . . . . . . . . . . . 6.2
Depreciation Expense . . . . . . . . . . . . . . . . . . . . . .3 .5 Other Manufacturing Expense . . . . . . . . . . . . . . 10.1
Inventory Revaluations &LIFO Adjustments . . . . . . . -0.1 Total Production Related Expenses (COGS) . . . . . 78.1 GROSS MARGIN ......................... .21.9
Sales Salaries, Commissions, Fringe Benefits , , , . 2.9 Other Selling Expense . . . . . . . . . . . . . . . . . . . . . 1.9 Administrative Expense . . . . . . . . . . . . . . . . . . . : 7.3 (includes Engineering & R&D Salaries)
Total Non-Production Related Expenses . , . . , . , . 12.1
Manufacturing Personnel Fringe Benefits . . . . . . . 3.9
100.0 36.4 13.2 5.3 3.1 4.0
14.7 -0.1 76.6 23.4
4.0 1.2
14.4
19.6
100.0 39.0 14.0 6.8 4.6 2.6
13.2 -0.1
80.1 19.9 2.6 0.8
10.6
14.0
(1) Not all companies surveyed responded to every question; therefore. some details may not sum to totals. ‘Average as a percent of Total h e & . I Average as 8 percent of Net Sales.
100.0 40.9 8.8 7.0 4.7 4.2
13.3 -0.1 79.0 21.0
3.3 1.7 9.7
14.7
4 2 5 M M
2.0 19.7 12.8 5.1 0.8 5.3
-0.9 5.6
40.0 10.6
25.5 23.9
100.0 11.4 4.0 2.2
17.5 1.0
28.7 48.0 52.0
100.0
100.0 48.6 7.6 5.4 3.2 3.1 8.1
-0.1 76.9 23.1
2.7 2.3 5.0
10.0

Income Statement' (continued from page 17) Total
OPERATING PROFITRBIT Interest Expense (Income) Other Expense (Income)
PROFIT BEFORE INCOME TAXES Income Taxes
PROFIT AFTER INCOME TAXES
Under $5MM- $10MM- $5MM $10MM 525MM
-
Statistical Data . . . . . . . . . . . . . . . . . . . . . . . . . . . . . . . . . . . . . .
Net SaIedAverage I
Number Employees
Value Added per Employee . . . . . . . . . . . .
Net Sales per Employee Hour. . . . . . . . . . . .
Value Added per Employee
Net Sales per Production Worker Hour. . , .
Value Added per Production Worker
Total Employment CosWNet Sales. . . . . . . .
Production Worker Emp. CosWNet Sales . .
Production Worker Emp. CostsRbs. Proc.. ,
Total Employment CostsRbs. Processed . . .
Total Production Related ExpenseiLb. Proc.
Productive Machine HrdAvail. Mach. Hrs.. ,
Inventory Tumover (times) . . . . . . . . . . . . .
Average Collection Period (days) . . . . . . . . .
Asset Turnover (times) , , , , , , , , , , , , . , , , ,
Return on Equity (after tax) . . . . . . . . . . . . .
Retum on Invested Capital (before tax) . . . .
Percent Change in Net Sales (1995-1996) . . . . . . . . . . . . . . . . . . .
- -
N
98
98
90
90
89
89
98
38
79
79
79
90
96
98
97
34
26
-
28 -
- -
Total
133,353
672,216
$64
$34
$85
$46
25.9%
18.8%
$0.31
$0.43
$1.34
54.0%
9.0
48
1.6
15.9%
16.5%
~
9.2%
9.9 1.4 0.3 8.2 2.7 5.5
- -
N
28
24
19
19
19
19
24
24
20
20
20
22
23
24
23
22
23
-
24 -
4.1 2.0 0.3 3.6 1.5 2.1
Under $5MM
b81,377
651,463
$45
$29
$60
$38
32.5%
21.5%
$0.63
$0.94
$2.26
41.5%
8.0
47
1.3
8.3X
6.6%
8.4%
- -
N
16
16
15
15
15
15
16
16
11
11
__
11 13
15
16
16
15
15
L6 -
6.3 0.7
-0.4 6.0 1.6 4.4
$5MM- $10MM
;86,950
i52,929
$42
$26
$51
$31
34 8%
25.3%
$0.81
$1.14
$2.75
51.9%
8.4
38
1.2
17.5%
18.4%
11.1%
- -
N
2 i
27
2:
25
24 24
27
27
21
2 1
-
21 25
27
27
17
17
27
27 -
6.4 1.4
-0.4 5.4 2.2 3.2
$10MM- 25MM
i118,187
$69,833
$56
$33
$73
$43
30.0%
20.5%
$0.36
$0.53
$1.46
54.3%
8.5
54
1.6
10.3%
11.5%
8.8%
N = Number or operating plants included m calculation. 2 Each avcragc LS calculated using only those companies providing data necessary for the spcciiled calcuisticr.
Source: SP1 Financial & Operaling Ratios Survey.

______
Plastics Processing Companies by Percent
Factory Overhead 25.2 ' Includes CUSlOl" processors and propric,ary pr"CfsS0".


L

he primary product groupsfor each Major Market category are listed below: T
Transportation Motor Vehicles and Parts: including autos, trucks, buses, motorcycles, and bicycles All Other: including railroad equipment, travel trailers, campers, golf carts, snowmobiles, aircraft, military vehicles, ships, boats, and recreational vehicles.
Packaging Bottles, Jars, Vials Food Containers: excluding disposable cups Flexible Packaging: including household and institutional refuse bags and film All Other: including tubes, tape, strapping, drums, caps, baskets, trays, boxes, pallets, shipping crates, pails, buckets, shipping cases, and blister and bubble containers.
Building and Construction Pipe, Conduit and Fittings: including drainage, irrigation, plumbing fixtures, and septic tanks Building Material for All Structures: including siding, flooring, and insulation materials All Other: including panels, doors, windows, skylights, bathroom units, gratings, and railings.
ElectricaVElectronic Home and Industrial Appliances: including electrical industrial equipment, wire and cable coverings, communications equipment Electronic Components: including resistors, magnetic tape, records, and batteries.
Furniture and Furnishings Rigid and Flexible Types: including household and office furniture, bedding, carpets, rugs, backing, curtains, blinds, awnings, lamps, picture frames, and wall coverings.
Consumer and Institutional Products Disposable Food Serviceware: including disposable cups Dinner and Kitchenware: including picnicware Toys and Sportings Goods Health Care and Medical Products: including laboratory supplies Hobby and Graphic Arts Supplies: including photographic equipment and supplies All Other: including footwear, luggage, buttons, lawn & garden tools, signs & displays, and credit cards.

Indus triamachiner y All Types: including engine and turbine parts, farm and garden machinery, construction and related equipment, machine tools, ordnance and firearms, and chemical process equipment.
Ad hesiveshn kslC oa t ings Adhesives and Sealants All Other: including printing ink, magnet wire enamels, core binders, foundry facings, paper coating and glazing, paints, varnishes, and enamels.
All Other Sales of Resins Sold to Resellers and Compounders Other sales of resins which cannot be classified under any of the Major Market categories previously listed.
Exports Sales of Plastic Resin Exported from the U.S

ajor market volumes are derived from plastic resins sales and captive use data as M compiled by Association Services Group
LLC. This study reflects data collectedfor the following individual resin categories:
Thermosets Epoxy Polyester, Unsaturated Urea and Melamine Phenolic
Thermoplastics Low Density Polyethylene Linear Low Density Polyethylene High Density Polyethylene Polypropylene Acrylonitrile-Butadiene-Styrene (ABS),
Styrene-Acrylonitrile (SAN) E3 Other Styrene Based Polymers (OSBP)
Polystyrene Styrene Butadiene Latexes (SBL) Nylon Polyvlnyl Chloride Thermoplastic Polyester Engineering Resins
Total Resin Sales & Captive Use by Major Market (millions of pounds, dry weight basis)
Major Market 1992 1993 1994 1995 1996
Transportation Packaging Building and Construction ElectricaElectronic Furniture and Furnishings Consumer and Institutional Industrialhlachinery AdhesiveshksKoatings All Other Exuorts
2,817 3,221 3,795 18,284 19,569 19,551 11,876 12,885 14,715 2,766 2,98 1 3,325 2,559 2,759 3,118 6,093 6,015 9,266
617 768 836 1,723 1,572 1,789 6,877 7,234 7,515 6.950 6.632 6,889
3,916 19,334 14,321 2,966 3,198 9,054
818 1,795 8,050 7.742
3,964 21,271 16,199 3,137 3,477 9.804
980 1,833 9.361 8.722
Total 60,562 63,636 70,799 71,194 78,748

Major Markets - All Resins Major Market 1992 1993 1994 1995 1996
Transportation Packaging Building and Construction ElectricaVElectronic Furniture and Furnishings Consumer and Institutional IndustriaUMachinery Adhesives/Inks/Coatings All Other Exports
4.7 5.1 5.4 5.5 5.0 30.2 30.8 27.6 27.2 27.0 19.6 20.2 20.8 20.1 20.6 4.6 4.7 4.7 4.2 4.0 4.2 4.3 4.4 4.5 4.4
10.1 9.4 13.1 12.7 12.5 1.0 1.2 1.2 1.1 1.2 2.8 2.5 2.5 2.5 2.3
11.3 11.4 10.6 11.3 11.9 11.5 10.4 9.7 10.9 11.1
Total 100.0 100.0 100.0 100.0 100.0
Major Markets - All Resins Major Market 1991/92 1992/93 1993194 1994/95 1995/96
Transportation Packaging Building and Construction Electrical/Electronic Furniture and Furnishings Consumer and Institutional IndustriaVMachinery AdhesiveslInkslCoatings All Other Exports
Total
21.0 14.3 17.8 3.2 1.2 9.3 7.0 -0.1 -1.1 10.0
11.5 8.5 14.2 -2.7 13.1 -4.5 7.8 11.5 -10.8 5.8 13.5 7.8 13.0 2.6 8.7 7.1 -1.3 54.0 -2.3 8.3 5.1 24.5 8.9 -2.2 19.7
23.9 -8.8 13.8 0.3 2.1 3.9 5.2 3.9 7.1 16.3
-6.3 -4.6 3.9 12.4 12.7
7.1 5.1 11.3 0.6 10.6

All Resins -
Transuortation 5.0%
AdhesivesLnks Coatings 2.3 o r / /o
/ A \
/ 4- IndustriaVMachinery
1.2% Consumer & Institutional 12.5%
Electrical/ Electronic
4.0%
Furniture & Furnishings 4.4%

Packaging 0.7% Thermoset Resins ~
Transportation 8.4%
All Others & Exoorts 11.9%
Adhesiveshnks Coatings 4.0%
IndustriaVMachinery 2.5%
Consumer & Institutional 3.5%
Furniture & Furnishings 6.1%
ElectricaVElectronic 3.1%
Thermoplastic Resins
IndustriaVMachinery 1.1% L-h
Consumer & / Institutional 13.5%
f Transportation 4.6%
Construction 15.4% Furniture & Furnishings 4.2% ElectricaVElectronic 4.1%

Total Thermosets & Thermoplastics (thousands of pounds, dry weight basis)'
Major Market
Transportation . . . . . . . . . . . . . . . .
Packaging, . . . . . . . . . . . . . . . . . . .
Building & Construction . . . . . . .
ElectricaElectronic . . . . . . . . . . . .
Furniture & Furnishings . . . . . . . .
Consumer & Institutional Products
Industrial/Machiner y . . . . . . . . . . .
AdhesivesLnWCoatings . . . . . . . .
All Other '. . . . . . . . . . . . . . . . . . . .
Exports. . . . . . . . . . . . . . . . . . . . . .
Total
I
Total Thermosets
Quantity
680,966
54,746
5,341,894
253,563
496,452
283,474
205,014
326,593
215,676
278,348
8,136,726
~
Percent 3f Total
8.4
0.7
65.6
3.1
6.1
3.5
2.5
4.0
2.7
3.4
100.0
Total Thermoplastics
Quantity
3,282,541
!1,216,492
10,856,632
2,883,666
2,980,468
9,520,894
774,483
1,506,562
9,145,658
8,443,550
'0,610,946
~
Perceni If Tota
4.6
30.0
15.4
4.1
4.2
13.5
1.1
2.1
13.0
12.0
-00.0
Grand Total
__
Quantity
3,963,507
21,271,238
16,198,526
3,137,229
3,476,920
9,804,368
979,497
1,833,155
9,361,334
8,721,898
78,747,672
'ercent f Total
5.0
27.0
20.6
4.0
4.4
12.5
1.2
2.3
11.9
11.1
LOO.0
' Phenolic is an a gross waghi baas. All Other totals do nut include disclosure data; therefore. these to& may not equal the sum of their repcctive components.
Source SPI Cammiltee on Resin Statistics; Annual Major Markets Survey as compiled by Associauon Semccs Group LLC

Thermosets & Thermodastics Resins (thousands of pounds, dry weight basis)'
Packaging.. . . . . . . . . . . . . . . . . . .31,000
Building & Construction . . . . . . . . 74,771
Electrical/Electronic . . . . . . . . . . . . 78,953
Fumiture & Furnishings . . . . . . . . .3,798
Consumer & Institutional . . . . . . .53,820
1ndustriaVMachinei-y . . . . . . . . . . .95,125
AdhesiveflnMCoatings . . . . . . . . . . . . . 0
AllOther . . . . . . . . . . . . . . . . . . . .85,117
Exports . . . . . . . . . . . . . . . . . . . . 154,336
1
EPOXY
Transportation . . . . . . . . . . . . . . . .
4.8
11.6
12.3
0.6
8.4
14.8
0.0
13.2
24.0
Total.. . . . . . . . . . . . . . . . . .
Unsaturated Polye
Quantity
494,983
0
786,217
51,145
0
141,665
0
0
1,429
89,661
565,100
____
-
__
-
r - trcent Total -
31.6
0.0
50.2
3.3
0.0
9.1
0.0
0.0
0.1
5.7
10.0
-
-
Urea Melam
Quantity
D
D
L,576,685
D
D
D
D
D
8,37,184
17,982
,43 1,851
'Phenolic is on a Gross Weight Basis. 'Includes total ofU.S.A. and Canada. D= Disclosure. Amount is included in All Other. NIR= Not reported in order to mask disclosure m another c a t e g q Amount E included in ALL OTHER,
Phenolics - 2uantity
NII
t
,904,221
Nfi
I:
NiF
c
NiE
575,853
16,369
496,443
-
Low Density PE
Quantity
56,678
3,073,762
167,212
51,948
30,269
1,141,881
227,748
624,613
1,023,762
.,475,926
7,873,799
- 'b1Ce"I fTorsl - 0.7
59.0
2.1
0.7
0.4
4.5
2.9
7.9
3.0
8.8
10.0
-
-
Source: SPI Commmee on Resin Statistics: Annual Major Markets Survey as campiled.by Associarmn Services Group LLC.

Thermoplastics (thousands of pounds, dry weight basis)
Polystyrene Linear Low Density PE
Major Market
I Styrene Based -
'kKC"1 f T d
0.0
23.5
8.1
12.9
1.4
31.5
0.0
0.0
15.8
6.8
00.0 Total.. . . . . . . . . . . . . . . . . . .7,7!18,8851100.0
Latex
Quantity o,T,,tal
D
D
D
D
473,481 34.4
D
0 0.0
720,084 52.4
181,840 13.2
D
1,375,405 100.0
Percent
' Sales to Canada included in Exports. * Includes total of U S.A. and Canada. D= Disclosure. Amount is included m All Other.
Transportation . . . . . . . . . . . . . . . . 13,715
Packaging . . . . . . . . . . . . . . . . .3,817,756
Building & Construction , . . , , , . .53,535
ElectricaVElectronic . . . . . . . . . . ,257,146
Fumiture & Furnishings . . . . . . . .23,699
Consumer & Institutional. . . . . 1,286,154
IndustriaVMachinery . . . . . . . . . . . . . . . . 0
Adhesives/lnks/Coatings . . . . . . . . 57,153
AUOther . . . . . . . . . . . . . . . . . 1,182,265
Exports.. . . . . . . . . . . . . . . . . . 1,107,462
High Density PF
0.2
48.9
0.7
3.3
0.3
16.5
0.0
0.7
15.2
14.2
_I
Quantity
533,505
5,787,429
L,187,462
125,586
0
879,744
265,998
0
.,493,540
.,937,445
3,210,705
- :Tc" Total - 4.0
51.4
9.0
0.9
0.0
6.7
2.0
0.0
11.3
14.7
00.0
-
-
Polypropylene
Quantity
724,535
2,435,235
D
396,583
2,066,054
2,829,437
0
0
2,647,224
1,021,878
12,120,946
- " 1 ' Total -
6.0
20.1
3.3
17.1
23.3
0.0
0.0
21.8
8.4
00.0
- -
- Juantity
(
,427,89:
491,36:
782,395
84,825
,912,49C
C
C
962,551
409,928
,071,445
Source: SPI Committee on Resin Statistics; Annual Major Markets Survey as compiled by Association Semcer Group LLC
Thermoplastics (thousands of pounds, dry weight basis)
Orcent Tom1
55.1
1.6
0.2
0.4
16.6
L6.1
10.0
Quantity
678,303
D
156,467
D
28,817
218,142
102,041
D
578,887
331,168
2,093,825
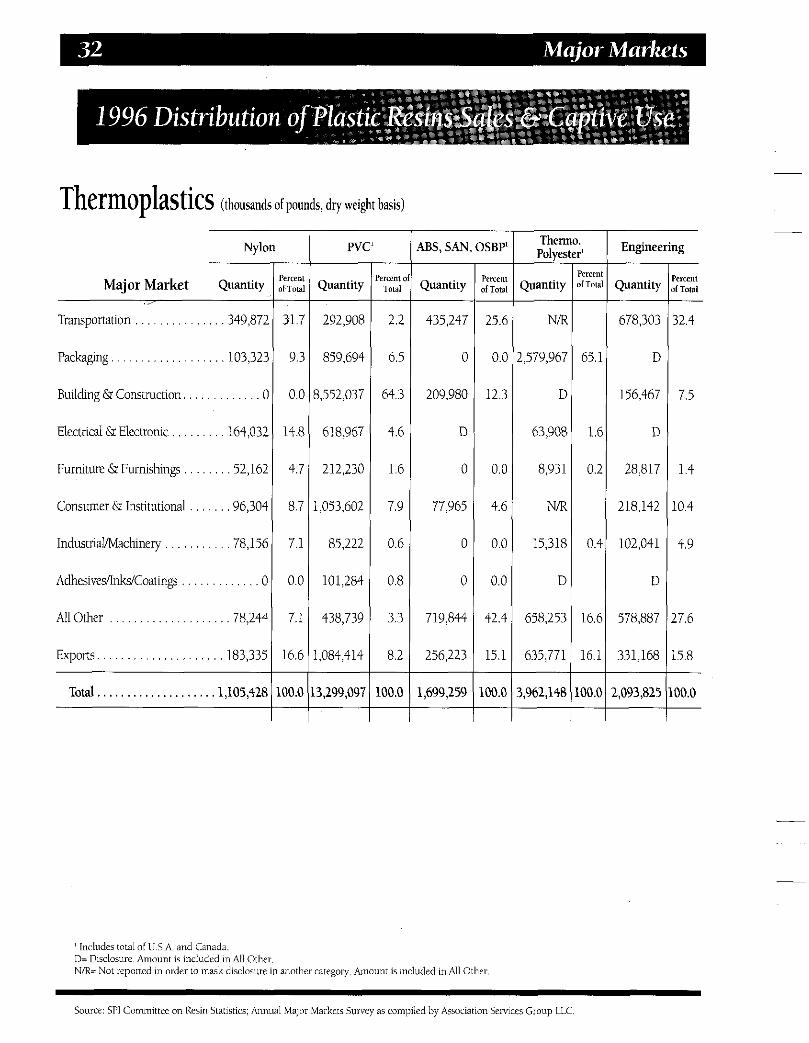
Major Market Quantity
Transportation . . . . . . . . . . . . . . . 349,872
Packaging.. . . . . . . . . . . . . . . . . . 103,323
Building & Construction. . . . . . . . . . . . . 0
Electrical & Electronic . . . . . . . . . 164,032
Fumiture &Furnishing . . . . . . . .52,162
Consumer 6s Institutional . . . . . . .96,304
Industriaiflvlachinery . . . . . . . . . . .78,156
AdhesivesflnMCoatings . . . . . . . . . . . . . 0
All Other . . . . . . . . . . . . . . . . . . . .78,244
Exports.. . . . . . . . . . . . . . . . . . . . 183,335
J
PVC' 1 ABS, SAN, OSBP
zy:t 31.7
9.:
O.C
14.E
4.7
8.7
7.1
0.0
7.1
16.6
- Quantity
6.5
292,908
859,694
;,552,037
618,967
212,230
,053,602
85,222
101,284
438,739
,084,414
0
5,299,097 __
4.6
1.6
I
D
0
2.2 1 435,247
0.6
0.8
0
0
Total.. . . . . . . . . . . . . . . . . . .1,105,428
7.9 1 77,965
100.0
:::I ::::: 00.0 1,699,259
- PWCC",
fTlofa -
25.f
0.C
12.3
0.c
4.t
0.c
0.0
42.4
15.1
00.0 -
-
' Includes total of U S.A. and Canada. D= Disclosure Amount is includcd in All Other N/R= Not reported in order IO inask disclosure in another category. Amount i s included in All Other,
Them Polyes
Quantity
~
NB
.,579,967
D
63,908
8,931
N R
15,318
D
658,253
635,771
8,961,148 -
1 I Engineering - .we", TOtd - 2.4
7.5
1.4
0.4
4.9
7.6
5.8
10.0 -
-
~~ ____
Source: SPI Committee on Resin Siaiistics; Annual Major Mailiers Survey as compiled by Asociatmn Services Group LLC.


Total U.S. Production and Sales & Captive Use' (millionsofpounds)
Year Production Sales & Captive Use2 1971" 21,161 19,813 1972 26,475 25,504 1973 29,213 28,719 1974 29,274 27,890 1975 22,828 22,278 1976 29,196 28,379 1977 33,948 32,771 1978 37,605 36,818 1979 41,577 40,607 1980 37,347 36,896 1981 39,867 38,801 1982 36,607 36,639 1983 42,777 42,212 1984 46,336 45,221 1985 47,946 47,470 198@ 50,849 50,452 1987 55,751 55,818 1988 59,762 58,554 1989 58,529 59,676 1990 61,960 63,039 1991 62,786 63,369 1992 66,371 67,675 1993 68,854 71,094 1994 75,971 78,744 1995 78,684 79,240 1996 84,295 86,426
I Includes polyurethane. Sales and Captive Use is defined as Merchant Sales plus Intra-Company Captive Use.
" 1971-1996 includes cellulosics. SPI data used for 1971-1996.
'1986-1996 include SPI Estimates.
Compound Growth Rates (%) YEARS PRODUCTION SALES & CAPTIVE USE
1971-1996 1981-1996 1986-1996 1991-1996 1995-1996
5.6 5.1 5.2 6.0 7.1
6.2 5.7 5.5 6.5 9.0

Production and Sales & Captive Use (millionsofpounds)
1987 RESIN - P
Epoxy . . . . . . . . . . . . . . . . 433 Phenolic. . . . . . . . . . . . .2.869 Polyester (Unsaturated) . . 1,367 Urea., . . . . . . . . . . . . . 1,382 Melamine . . . . . . . . . . . . 212
Total Selected . . . . . . . . 6,263 Thermosets
ABS . . . . . . . . . . . . . . . . 1,175 SAN . . . . . . . . . . . . . . . . 126 HDPE.. . . . . . . . . . . . . .7,995 LDPE.. . . . . . . . . . . . . .9,599 LDPE, . . . . . . . . . . . . . . . NA LLDPE . . . . . . . . . . . . . . . NA
Nylon. . . . . . . . . . . . . . . . 507 Polypropylene . . . . . . . .6,647 Polystyrene . . . . . . . . . .4,780 PVC.. . . . . . . . . . . . . . . 7,971 Thermoplastic . . . . . . . . 1.394 Polyester
Total Selected . . . . . . . 40,194
Total Selected Plastics . 46,457
All Other Plastics. . . . . . 9,294
Grand Total.. . . . . . .55,751
Thermoplastics
;&a 419
2,871 1,362 1,368
198
__
6,218
1,208 127
8.155 9,611
NA NA 499
6,720 4,860 8,081 1,410
0,671
6.889
8,929
5,818 ~
1988
P 486
3,066 1,404 1,425
207
~
6,588
1,277 148
8,400 0,397
NA NA 566
7,274 5,187 8,350 1,652
.3,251
,9339
9,923
9,762 ~
i&CL 468
3,073 1,393 1,350
203
~
6,487
1,279 146
8,084 0,177
NA NA 574
7,088 5,027 8,287 1,643
2,305
8.792
9.762
3.554
1989
P 510
2,879 1,319 1.477
222
~
6,407
1.260 113
8,102 9,695 6,575 3,120
569 7,238 5,104 8,478 1.630
.2,189
8,596
9,933
8.529
i&CL 482
2,863 1,302 1,465
213
~
6.325
1,217 108
8,173 0,803 6,916 3.887
580 7,303 5,131 8,493 1,707
3,515
1,840
1,836
2.676
1990
P 49 9
2,946 1.221 1,496
202
~
6,364
1,162 135
8,337 1,148 7,255 3,893
558 8,310 5,021 9,096 1,879
5,646
2,010
9,950
1,960 ~
i&CU 484
2,938 1,211 1,498
176
~
6,307
1,161 134
8,838 1,963 7,202 4,761
581 8,239 5,049 8,996 1.905
5,866
3,173
1,866
3.039
1991
P 497
2,658 1,075 1.483 2.196
~
5,909
1.103 109
9,213 1,148 7,236 4,346
576 8,330 4,954 9,164 2.115
7,146
3,055
9,731
2,786 ~
i&CU 491
2,663 1,078 1,485
172
5,889
__
1.125 114
3,345 1,963 7,397 4,935
627 3,327 4,896 3,086 2,113
7,963
3,852
3,517
1.369
P = Production
Notes: - 1987.1996 data include SPI estimates. All Other Plastics include Polyurethane
5 & CU = Sales &Captive Use NA = Not Available
-Imports are included in S&CU beginning in ( )year for rhe followingresins Epoxy (1995); ABS (1994), SAN (1994); HDPE (1991). LDPE (1989); LLDPE (1989); Polypropylene (1991). Polystyrene (1992); Nylon (1989): Thermoplasac Pniyesler (1989).
and Melamine began m 1996. Beginning m 1994, Production data include U S and Canadian rotals for ABS, SAN and PVC. Polypropylene began in 1995, Phenolic, Urea
~~~~ ~
Source: SPI Committee on Resin Statistics, Monthly Staustical Report, as compiled by Associauon Scrmces Group LLC.

Production and Sales & Captive Use cont. (millionsofpounds)
1992 RESIN ~ P
Epoxy . . . . . . . . . . . . . . ,457 Phenolic. . . . . . . . . . . . .2,923 Polyester (Unsaturated) . . 1,175 Urea. . . . . . . . . . . . . . . 1.548 Melamine . . . . . . . . . . . . ,232
Total SelecLed . . . . . . . . 6,335 Thermosets
ABS . . . . . . . . . . . . . . . 1.326 SAN . . . . . . . . . . . . . . . . . 1 13 HDPE. . . . . . . . . . . . . . .9,808 LDPE . . . . . . . . . . . . . 11,9 17 LDPE, . . . . . . . . . . . . .7,273 LLDPE . . . . . . . . . . . .4,644
Nylon . . . . . . . . . . . . . . ,668 Polypropylene . . . . . . . .8,42 1 Polystyrene . . . . . . . . . . 5.096 PVC.. . . . . . . . . . . . . . .9,989 Thermoplastic . . . . . . 2,413
Polyester
Total Selected . . . . . . . 49,751
Total Selected Plastics . 56,086 Thermoplastics
All Other Plastics 10,285
Grand Total. . . . . . . .66,371
512 2,926 1,185 1,548
148
6,319
1,277 u n
10,110 12,919 7,499 5,420
725 8,468 5,213
10,003 2,441
51,266
57,585
10,090
57,675
~
P 1993
512 3,078 1,264 1.744
270
6,868
1.462 105
9,941 2,067 7,226 4,841
768 8,628 5,382 0,257 2,549
1,159
8,027
3.777
3,854
535 3,081 1.280 1,743
261
6,900
1,373 118
10.604 13,140 7,424 5,716
794 8,938 5,494
10,549 2,546
53.556
50,456
10,650
71,094
1994
P 601
3,229 1,468 1.915
300
7,513
1.701 138
1,117 2,600 7,578 5,022
943 9,539 5,848 1.712 3,196
5,794
4,307
1,664
j,971
~
S&CU 606
3,230 1.493 1,910
283
~
7,522
1,583 162
11,910 14,239 7,904 6,335
942 9,946 6.000
11,761 3,154
59,697
57,219
11,525
78,744
Compound Growth Rates 1987-1996 ( O h ) I
P sdrcu P S&CU
1995
P 632
3,204 1,577 1.816
290
7,519
__
1,458 130
1,211 2,886 7,643 5,243 1,020 0,890 5,656 2,295 3.785
3,331
5,850
1,834
3,684
j&CI 620
3,201 1,569 1,810
286
~
7,486
1,463 150
1,837 3,730 7,524 6,206 1,031 0,710 5,799 2,033 3,425
0.178
7,664
1,576
9,240
1996
P 662
3,476 1,557 2.147
287
~
8,129
1,477 121
2.373 4,145 7,784 5,361 1,103 1,991 5,065 3,220 %,031
+,526
2,655
1,640
1,295
S&CU 643
3,496 1,565 2,139
293
-
8,136&--
1,433
5,bG 7,874 7,799 8
1.105 2,121 v
6071 I 3,299 3 962
6.999
5,135
1,291 c-
P S&CU
2.6 2.0 Total Selected Plastics 5.1 5.3 E P O V 4.9 4.9 ABS Phenolic 2.1 2.2 SAN 0.4 0.2
LDPE N/A N/A All Other Plastics 2.5 2.6 Urea 5.0 5.0 LLDPE NIA N I A 4.4 Nylon 9.0
Melamine 3.4
Total Selected 3.0 3.0 Polvurouvlene 6.8 6.8
Palyester (Unsat.) 1 5 1.6 HDPE 5.0 5.5
Grand Total 4.7 5.0
Thermosets 2.1 2.5 5.8 5.7
Thermoplastic Polyester 12.5 12.2 Total Selected 5.4 5.7 Thermoplastics
Source: SPI Commntee on R e m SlatisLics. Monthly Statistical Repon, 8s compilcd by Association Scrviccs Group LLC.
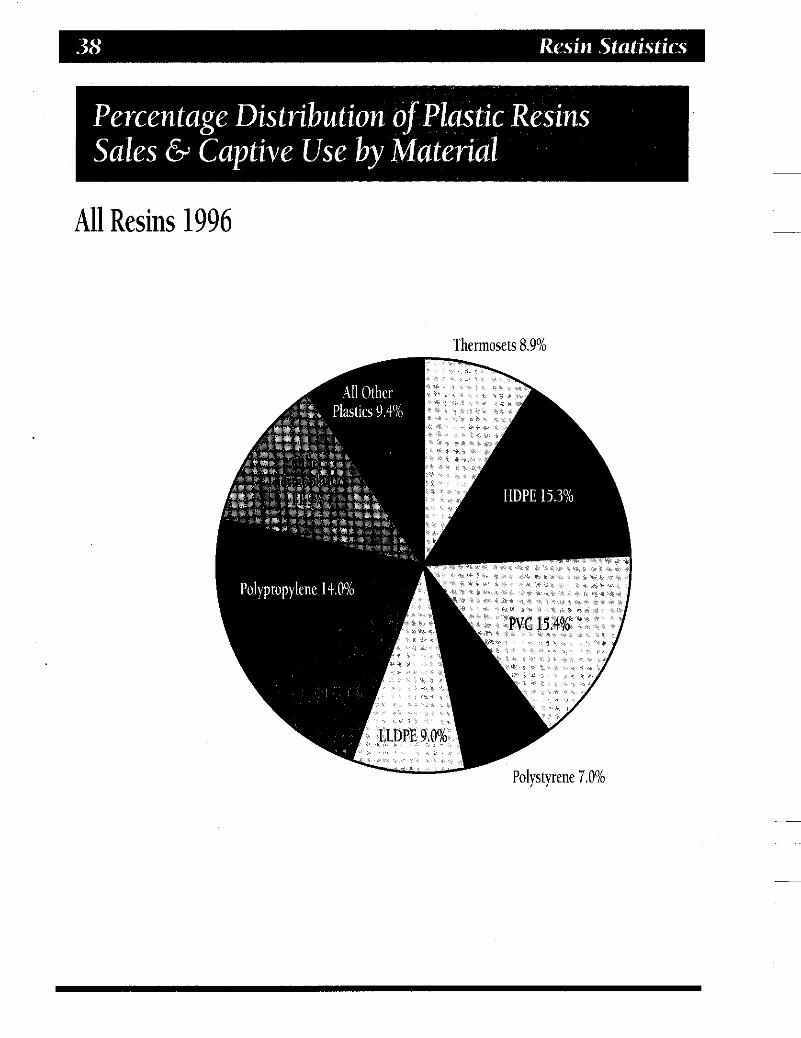
All Resins 1996 __
Thermosets 8.9%
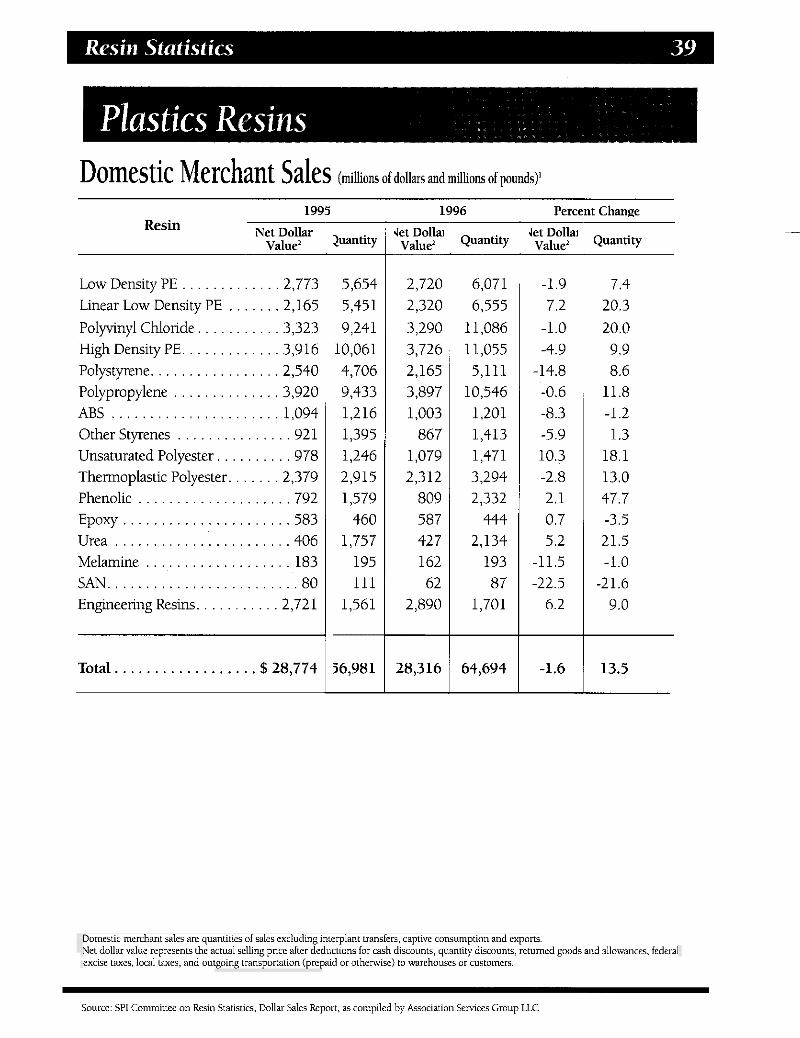
Domestic Merchant Sales (millions of dollars and millions of pounds)'
1995
Net Dollar Value'
Resin
Low Density PE . . . . . . . . . . . . . 2 . 773 Linear Low Density PE . . . . . . . 2. 165 Polyvinyl Chloride . . . . . . . . . . . 3 . 323 High Density PE . . . . . . . . . . . . . 3 . 9 16 Polystyrene . . . . . . . . . . . . . . . . . 2. 540 Polypropylene . . . . . . . . . . . . . . 3. 920 ABS . . . . . . . . . . . . . . . . . . . . . . 1. 094 Other Styrenes . . . . . . . . . . . . . . . 921 Unsaturated Polyester . . . . . . . . . . 978 Thermoplastic Polyester . . . . . . . 2. 379 Phenolic . . . . . . . . . . . . . . . . . . . . 792 Epoxy . . . . . . . . . . . . . . . . . . . . . . 583 Urea . . . . . . . . . . . . . . . . . . . . . . . 406 Melamine . . . . . . . . . . . . . . . . . . . 183 SAN . . . . . . . . . . . . . . . . . . . . . . . . . 80 Engineering Resins . . . . . . . . . . . 2 . 72 1
Total . . . . . . . . . . . . . . . . . . $28, 774
2uantity
5. 654 5. 45 1 9. 241
10. 061 4. 706 9. 433 1. 216 1. 395 1. 246 2. 915 1. 579
460 1. 757
195 111
1. 561
~
56. 981
1996
get Dollai Value'
2. 720 2. 320 3. 290 3. 726 2. 165 3. 897 1. 003
867 1. 079 2. 312
809 587 42 7 162 62
2. 890
28. 316
Quantity
6. 071 6. 555
11. 086 11. 055 5. 111
10. 546 1. 201 1. 413 1. 471 3. 294 2. 332
444 2. 134
193 87
1. 701
64. 694
Percent Change
Jet Dollai Value'
-1.9 7.2
-1.0 -4.9
-14.8 -0.6 -8.3 -5.9 10.3 -2.8 2.1 0.7 5.2
-11.5 -22.5
6.2
-1.6
Quantity
7.4 20.3 20.0 9.9 8.6
11.8 -1.2 1.3
18.1 13.0 47.7 -3.5 21.5 -1.0
-21.6 9.0
13.5
Source: SPI Committee on Resin Statistics. Dollar Sales Report. as compiled by Association Semices Group LLC

pparent consumption is calculated by adding For PUToses O f t h e below the Production .
imports to production, then subtracting xports . It is a measure ofthe quantity of
figures were takenfrom SPl's Monthly Statistical Report, as compiled by Association Services Group
tahenfrom Bureau of the Census reports . material actually consumed in the United States . . Both the and exPortfiWes Were -
A, 1996 (millions of pounds)
c Resin Production
Low Density Polyethylene . . . . . . . 7. 784 Linear Low Density Polyethylene . 6. 361 High Density Polyethylene . . . . . 12. 373
Polypropylene* . . . . . . . . . . . . . . 11. 991 Polystyrene . . . . . . . . . . . . . . . . . . 6. 065 Phenolic* . . . . . . . . . . . . . . . . . . . . 3. 476 ABS* . . . . . . . . . . . . . . . . . . . . . . . 1. 477 Thermoplastic Polyester'l). . . . . . . . 2. 294* * Urea* . . . . . . . . . . . . . . . . . . . . . . . 2 . 147 Unsaturated Polyester . . . . . . . . . . 1. 577 Nylon . . . . . . . . . . . . . . . . . . . . . . . 1. 103 Epoxy* . . . . . . . . . . . . . . . . . . . . . . . 662 Melamine* . . . . . . . . . . . . . . . . . . . . 287
1996 Total . . . . . . . . . . . . . . . . .70. 797
PVC* . . . . . . . . . . . . . . . . . . . . . .13. 220
1995 . . . . . . . . . . . . . . . . . . . . . . 66. 720 1994 . . . . . . . . . . . . . . . . . . . . . . 62. 107 1993 . . . . . . . . . . . . . . . . . . . . . .56. 942 1992 . . . . . . . . . . . . . . . . . . . . . . 54. 995 1991 . . . . . . . . . . . . . . . . . . . . . . 52. 061 1990 . . . . . . . . . . . . . . . . . . . . . . 49. 071
J L
Imports
201 1. 532 1. 192
119 105 232 97
167 95 33 61
155 42 12
4. 043
3. 509 3. 972 3. 236 2. 453 1. 950 2. 112
Exports
m a74
1. 793 1. 102 1. 217
583 125 255 396
52 156 314 154"' 44
8. 688
7. 624 7. 526 7. 496 7. 539 8. 167 6. 260
1 Apparent :onsumption
6. 362 7. 019
11. 772 12. 237 10. 879 5. 714 3. 448 1. 389 1. 993 2. 128 1. 462
944 550 255
66. 152
62. 605 58. 553 52. 682 49. 909 45. 844 46. 923
Import Oh Of Apparent Ionsumption
3.2 21.8 10.1 1.0 1.0 4.1 2.8
12.0 4.8 1.6 4.2
16.4 7.6 4.7
6.1
5.6 6.8 6.1 4.9 4.3 4.5
* Pioduciion. Tiadc &Apparent consumption arc bascd on U.S. and Canadian data m 1996 .
* * Rcpresenls Bottle Grade PET resin sales . no production data available ('I Biiiile Grade only .
comparable .
Data for Lhox and other resins in prior years reflect U S . only
Rcpresenls SPI primary data Epoxide exports as reported m U.S. Census report EM 545 cunlorm to a different specification and arc noi
Sources: Production-SPI Monihly Siaiisucal Repori . as coml?iled hy Associalion Scrvrei Group LLC Imports-Bureau ofrhe Census . IM 146 E n ~ o n c B u r e a u ofthe Census . EM 545


and may be cured by heat, catalysts, or other chemical means. After beingfully cured, thermosets cannot be resoftened by heat.
- hermoset plastics in theirfinal state as mished articles are substantially infusible Ti and insoluble. They are ofen in liquidform at some point in their manufacture or processing,
-
Material
Maior Markets J
AdhesivesllnksKoati
Consumer & Institut
Note: Includes
Pack rtation
aging 0.7% 8.4%
Sources: SPI Commiwee on Resin Statistics. SPI Major Market Report. as compiled by Asrociaoon Services Group LLC.

Manufacturers' Ciba-Geigy Corp The Dow Chemical Co. Reichhold Chemicals, Inc Shell Chemical Co. Union Carbide Corp.
1 Those manufdcturers who participated in the SPI Monthly Swtisncal Report m 1996,
Production and Sales & Captive Use (millions ofpounds)
Year Production Sales & Captive Use'
1986 1987 1988
1990 1991 1992 1993 1994 1995 1996
1989
398 433 486 509 499 497 457 512 60 1 632 662
Compound Growth Rate 1986-1996 5.2%
'Begmnmg m 1995. Imports included m Domestic Sales & Use
Domestic Consumption By End-Use (millions of pounds)
376 419 468 482 484 49 1 512 535 606 620 643
5.5%
End-Use 1992 1993 1994 1995
33 39 44
Protective coatings 245
Tooling, casting, and molding resins, . . , . . 24 17 15 17 All other uses. . . . . . . . . . . . , . . . . . . , . . . . 3 6 29 26
Bonding & adhesives. . . . . . . . . . . . . . . . . . 31 Flooring, paving and exposed aggregates . . 31 34 38 34
Fiber reinforced laminates & composites . . 73 81 90 95 . . . . . , . . . . . . . . . . . 206 218 24 1
31
1996
51 40
263 89 17 29
Total . . . . . . . . . . . . . . . . . . . . . . . . . . . . 401 414 452 461 489
Source: SPI Committee on Resin Staustics. Monthly Statisrical Report. as compiled by Association Services Group LLC

Distribution by Major Market (millionsofpounds)
Major Market 1992 1993 1994 1995 1996
Transportation. . . . . . . . . . . . . . . . . . * 52 58 61 66 Packaging . . . . . . . . . . . . . . . . . . . . . * 25 28 29 31 Building and Construction . . . . . . . 52 61 68 66 75 ElectricaVElectronic. . . . . . . . . . . . . 63 71 79 84 79 Furniture and Furnishings . . . . . . . . * 3 3 3 4 Consumer and Institutional . . . . . . . * 44 49 50 54 Industrial/Machinery. . . . . . . . . . . . . * 81 86 90 95 Adhesives/Inks/ Coatings . . . . . . . 235 - - - - All Other. . . . . . . . . . . . . . . . . . . . . 51 77 80 78 85 Exports'. . . . . . . . . . . . . . . . . . . . . 111 121 155 158 154
Total.. . . . . . . . . . . . . . . . . . . . , 5 1 2 535 606 619 643
* Included in All Other. ' Sales to Canada included in Enporls, Source: SPI Committee an Resin SLatistics, Annual Major Markcis Survey.
Typical Applications Coatings Reinforced composites Adhesives Electrical laminates ElectricaVElectronic casting and molding FloorRaving aggregates Industrial equipment Sealants

Manufac turersl Ashland Chemical, Inc. Borden, Inc. Owens Corning Capital Resins COT. Plaslok Corp. Georgia-Pacific Resin, Inc. Plastics Engineering Co. Lockport Thermosets, Inc. (Valite Div.) Rogers Corp. Monsanto Co. Spurlock Adhesives, Inc. Neste Resins Corp.
Occidental Chemical COT.
' Those manufacturers who participated in the SPI Monthly Statistical Report in 1996.
Production and Sales & Captive Use (millionsofpounds)
Year Production Sales & Captive Use lY86 2 , 1 3 2,111 1987 2,869 2,871 1988 3,066 3,073 1989 2,879 2,863 1990 2.946 2,938 1991 1992 1993 1994 1995 1996
2,658 2,923 3,078 3,229 3,204 3,476
Compound Growth Rate
1986-1996 2.4%
' Beginning in 1996, data includes U.S.A. and Canada.
Typical Applications Wiring devices Connectors Transmission parts Pulleys Electrical switch gear Closures
2,663 2,926 3,081 3,230 3,201 3,496
2.3%
Handles Telephone relay system Rubber tackifiers Laminating plywood Knobs Power brake components
~~~ ~~ ~~~~~~ ~~
Source: SPI Committee an Resin Statistics, Monthly Statistical Report, as compiled by Association Sewices Group LLC.

Domestic Consumption by End-Use (millions ofpounds)
End-Use 1992 1993 1994 1995 1996
Molding compounds. . . . . . . . . . . . . . . 164 160 170 150 144
Laminating.. . . . . . . . . . . . . . . . . . 162 177 195 180 166 Coated &bonded abrasives . . . . . . . . * 25 24 22 18 Friction materials . . . . . . . . . . . . . . .47 49 56 55 55 Insulation materials. . . . . . . . . . . . . 385 375 414 395 401 Foundry & shell molding, , , , . , , . .86 * * * Plywood * . . . . . . . . . . . . . . . . . . . . . . . * 1,540 1,560 1,575 Fibrous & granulated wood . . . . . . . . * 485 515 511 65 1 Resins sold to rubber industry , . , , , . * * * * * All other bonding & adhesive . . . 2,007 189 89 211 1,982
Bonding & adhesive resins for:
110
* * Protective coatings. . . . . . . . . . . . . . . . . . * * 12 13 11 All other uses. . . . . . . . . . . . . . . . . . . . . . 44 39 58 56 63
Total.. ...................... .2,895 3,051 3,204 3,166 3,480
* Included in All Other Bonding and Adhesive. * * Included in All Other Uses. Source: SPI Committee on Resin Statistics, Monthly Statistical Report, as compiled by Association SeMces Group LLC.
Distribution by Major Market (millions ofpounds)
Major Market 1992 1993 1994 1995 1996
Transportation . . . . . . . . . . . . . Packaging . . . . . . . . . . . . . . . . Building & Construction . . . . . ElectricaVElectronic . . . . . . . . . Fumiture & Furnishings, , , . . Consumer & Institutional. . . . Industriahlachiner y . . . . . . . . AdhesivesAnkdCoatings . . . . . All Other. . . . . . . . . . . . . . . . . Exports . . . . . . . . . . . . . . . . . .
* * . . . . .
. . 2,441 . . . . 81
. . . . 49 * . . . . .
* *
. . . . .
. . . . .
. . . 325
. . . . 31
101
2,528 *
- * -
* 85
337 30
N/R
2,665 *
- * -
* 88
45 1 25
- *
2,641 -
* -
* -
524 36
NiR
2,904 N/R
N/R
NiR 576
16
*
*
*
Total.. ....................... 2,926 3,081 3,229 3,201 3,496
* Disclosure. Amount included in All Other. I Beginning in 1996. data includes U.5.A. and Canada N/R Not reported
Source: SPI Committee an Resin Statistics, Annual Major Markets Survey. as compiled by Association Services Group LLC.
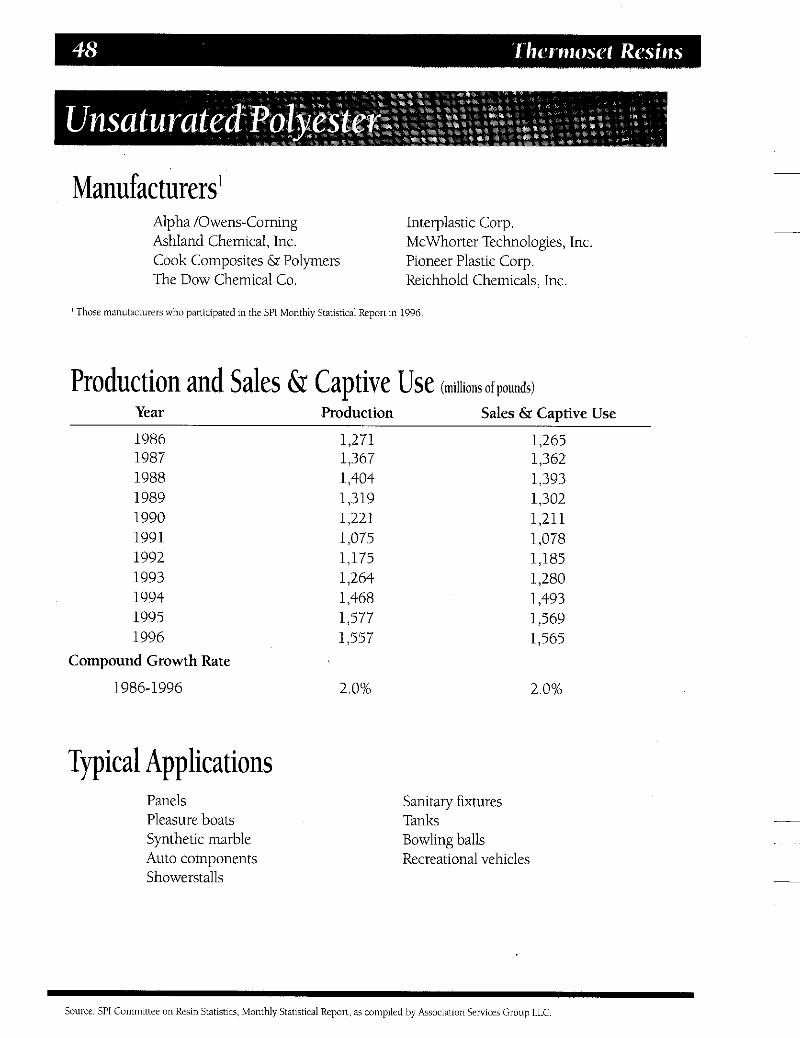
Manufacturers' Alpha /Owens-Corning Interplastic Corp. Ashland Chemical, Inc. Cook Composites & Polymers The Dow Chemical Co.
McWhorter Technologies, Inc Pioneer Plastic Corp. Reichhold Chemicals, Inc.
' Those manufacturers who participated m the SPI Monthly Statmcal Repon ~n 1996
Production and Sales & Captive Use (millionsofpounds)
Year Production Sales & Captive Use
1986 1987 1988 1989 1990 1991 1992 1993 1994 1995 1996
Compound Growth Rate
1986-1996
Typical Applications Panels Pleasure boats Synthetic marble Auto components Showerstalls
1,271 1,367 1,404 1,319 1,221 1,075 1,175 1,264 1,468 1,577 1,557
1,265 1,362 1,393 1,302 1,211 1,078 1,185 1,280 1,493 1,569 1,565
2.0% 2.0%
Sanitary fixtures Tanks Bowling balls Recreational vehicles
Source: SPI Committee on Resin Statistlcs, Monthly Statistical Reporl. as compilcd by Association Services Group L1.C.

Domestic Consumption by End-Use End-Use 1992 1993 1994 1995 1996
Domestic Reinforced Plastics. Total . . . . . . . . . . . . . . . . . . . . 855 Marine and Marine Accessories . . . . . . . . . . . . . . . 246
Auto. trucks. buses. . . . . . . . . . . . . . . . . . . . . 76 Transportation. Total . . . . . . . . . . . . . . . . . . . . 88
Other transportation . . . . . . . . . . . . . . . . . . . . . . . 12 Construction. Total . . . . . . . . . . . . . . . . . . . . . . . . 418
General construction . . . . . . . . . . . . . . . . . . . . . . . . . . . 67 Bathroom components & fixtures . . . . . . 132
. . . . . . . . . . . . . . . . . . 124 . . . . . . . . . . . . . . . . . . . . . . . . . . . . . . . . . . . 95
Total . . . . . . . . . . . . . . . . 34 Consumer Goods. Total . . . . . . . . . . . . . . . . . . . . . . 44
Recreational goods. LO . . . . . . . . . . . . . . . . . . . . . . . . . . . 23 Other consumer goods . . . . . . . . . . . . . . .
Other Reinforced . . . . . . . . . . . . . . . . . . . . . . . 25 Domestic Non-reinforced Plastics. Total . . . . . . . . . . 3293 TransportatiodBody Putty . . . . . . . . . . . . . . Construction. Total . . . . . . . . . . . . . . . . . . . . . . . . 140
Marble/Onyx . . . . . . . . . . . . . . . . . . . . . . . . . . . . . . . . . . . . . 100 Polymer concrete . . . . . . . . . . . . . . . . . . . . . . . . . . . 8
Pipes. tanks and fittings
Other construction . . . . . . . . . . . . . . 32 Consumer Goods. Tota . . . . . . . . . . . . . . . . . . . . . . . . . . . . 36
Fumiture . . . . . . . . . . . . . . . . . . . . . . . . . . . . . . . 6 Other consumer goods . . . . . . . . . . . . . . . . . . . . . . . . . . . . . . . 30
Surface resins and protective coatings . . . . . . . . . . . . . . . . . . . . D
Gel CoatdSurface Resinflrotective Coatings . . . . . . . . . . . Gel coats . . . . . . . . . . . . . . . . . . . . . . . . . . . . . 57
Other Non-reinforced . . . . . . . . . . . . . . . . . . . . . . . 75
911 267 98 87 11
444 71
145 141 88 32 34 18 16 36
326 48
154 120 12 22 35 3
32 D(1)
62 D
89
Distribution by Major Market (~omofpomh) Maior Market 1992 1993 ..... J.. .........
. . . . . . . . . . . . . . . . . . . . . . . . . . . . . . 260 - . . . . . . . . . . . . . . . . . .
FumitureFumishin
* . . . . . . . . . . . . . . . . . . .
1. 021 306 119 105 14
472 74
150 157 91 41 55 24 31 28
410 55
209 162 19 28 36
2 34
D(1) 79 D
110
1994
1. 087 298 143 118 25
513 70
158 165 120 45 65 35 30 23
409 46
232 187 22 23 39 5
34 D(1)
68 D
92
. 1, 045
280 134 110 25
494 75
156 145 118 51 52 28 24 34
430 44
252 205 20 27 38 3
35 80 75 5
16
1995 1996
463 543 540 . . .
623 711 770 32 41 45 . . .
111 127 13 . . . . .
8 9 8 42 62 73
495 .
786 51 .
142 . . .
1 90
Total . . . . . . . . . . . . . . . . . . . . . . . . . . . . . . . . . . . . . . . . . . . 1. 185 1. 279 1, 493 1, 569 1, 565 ' Sales LO Canada included in Enpons
D =Disclosure D(1) =Included in Other Non-reinforced
~
Source: SPI Cammiltee on Resin Statistics. Monthly Staristical Repon. as compiled by Asmaation Selvlccs Group TIC

Manufacturers' Borden, Inc. Monsanto Co. Capital Resins C o p Cytec Industries Pioneer Plastic Corp. Georgia-Pacific Resin, Inc. Harborchem, Inc. Spurlock Adhesives, Inc.
Neste Resins Corp.
Southeastern Adhesives Co
' Those manufacturers who participated in the SPI Monthly Statlstical Report in 1996.
Production and Sales 6: Captive Use (millions ofpounds)
Year Production Sales 6s Captive Use
1986 1,271 1,266 1987 1,382 1,368 1988 1,425 1,350 1989 1,476 1,465 1990 1,496 1,497 1991 1,483 1,485 1992 1,548 1,548
1994 1,915 1,910 1995 1,816 1,810 1996' 2,147 2,139
1993 1,744 1,743
' Beginning In 1996. data includes U 5 A and Canada
Compound Growth Rate
1986-1996 5.4% 5.4%
Source. SPI Committee on Resin Statistics. Monthly Statistical Report, as compiled by Association Services Group LLC.

Manufacturers' Borden, Inc. Harborchem, Inc. BTL Specialty Resins Corp. Capital Resins Corp. Cytec Industries Pioneer Plastic Corp. Georgia-Pacific Resin, Inc.
Monsanto Co. Neste Resins Corp.
Spurlock Adhesives, Inc
l Those manufacturers who participated in the SPI Monthly Statistical Repon in 1996
Production and Sales & Captive Use (mllionsofpounds) Year Production Sales & Captive Use
1986 173 191 1987 212 198 1988 207 202 1989 222 213 1990 202 176 1991 196 172 1992 232 148 1993 270 261 1994 300 283 1995 290 286 1996' 287 293
' Beginning m 1996. data includes U 5 A and Canada
Compound Growth Rate
1986-1996 5.2% 4.3%
Source: SPI Committee on Resin Statistics. Monthly Statistical Report. as compiled by Association SeMces Group LLC.

Domestic Consump tion End-Use (millions of pounds)
End-Use 1992 1993* 1994 1995 1996'
Textile coating & treating resins. . . . . . . 20 D D D D Paper coating &treating resins . . . . . . . 47 52 54 49 57 Bonding 6s adhesive resins for: -
Laminating. . . . . . . . . . . . . . . . . . . . . . 15 30 33 30 29 Plywood . . . . . . . . . . . . . . . . . . . . . . . . 58 72 75 78 71 Fibrous &granulated wood . . . . . . 1,343 1,485 1,612 1,494 1,833
Protective coatines . . . . . . . . . . . . . . . . 11 1 167 D D D All other uses ' . . . . . . . . . . . . . . . . . . . 11 1 207 399 403 424
Total.. ...................... 1,696 2,013 2,173 2,054 2,414 *Data rcvised from previous issue of Facti 0 Figures. ' Beginning in 1996, daia includes U.S.A. and Canada, D =Disclosure: Included in All Other Uses. Source: SPI Commitier on &sin Statisucs. Monthly Statistical Report. as compiled hy Association SeMces Group LLC
Distribution by Major Market (millionsofpounds)
Major Market 1992 1993 1994 1995 1996
Packaging . . . . . . . . . . . . . . . . . . . . . . . . 38 Building and Construction . . . . . . . . 1,298 1,148 1,324 1,293 1,577 ElectricaVElecuonic . . . . . . . . . . . . . . . . . * Fumiture and Fumishings . . . . . . . . . . . . * Consumer and Institutional . . . . . . . . . . . *
AdhesivednkdCoatings . . . . . . . . . . . . . . * 229 All Other. . . . . . . . . . . . . . . . . . . . . . . .360 568 620 761 837 Exports . . . . . . . . . . . . . . . . . . . . . . . . . . . * 18 20 41 18
* Transportation - . . . . . . . . . . . . . . . . . . . . - *
* * * * * * *
* IndustrialNachinery . . . . . . . . . . . . . . . - - - *
Total. ....................... 1,696 2,004 2,193 2,095 2,432
* Included in All Other. Source, SPI Commiiiee on Resin Svatisiics. Annual Major Markets Survey, as compiled hy Assooanon Scmccs Group LLC
Typical Applications Urea Melamine
Wiring devices BuLtons Adhesives &bonding Dinnerware Toilet seats Knobs Buttons Knobs Handles Adhesives &bonding Handles Ashtrays
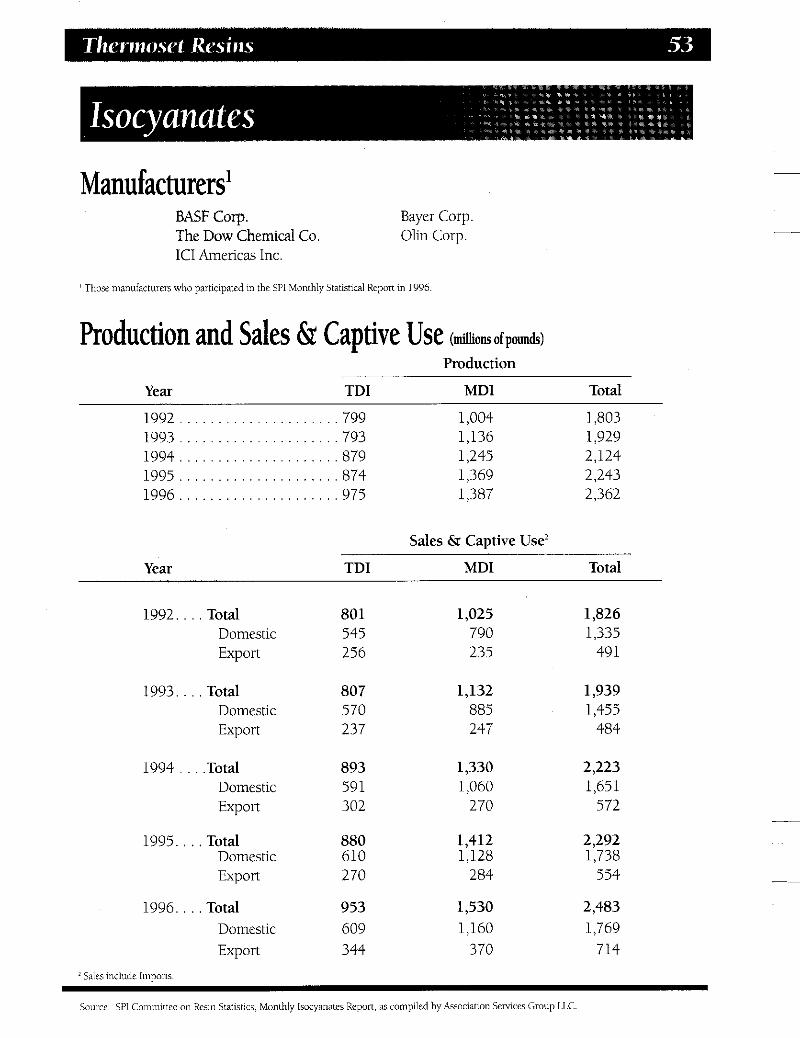
Manufacturers] BASF Corp. Bayer Corp The Dow Chemical Co. Olin Corp. IC1 Americas Inc.
’ Those manufacturers who participated m the 51’1 Monthly Statistical Report m 1996
Production and Sales & Captive Use (millionsofpounds) Production
Year TDI MDI Total
1992 1993 1994 1995 1996
Year
799 1,004 1,803 793 1,136 1,929 879 1,245 2,124 874 1,369 2,243 975 1,387 2,362
Sales & Captive Use’
TDI MDI Total
1992. , , , Total Domestic Export
1993.. . .Total Domestic Export
1994 . . . .Total Domestic Export
1995. , . . Total Domestic Export
1996. , . . Total Domestic Export
1 Sales include lmnons
801 545 256
807 570 237
893 591 302
880 610 270
953 609 344
1,025 790 235
1,132 885 247
1,330 1,060
270
1,412 1,128
284
1,530 1,160
370
1,826 1,335
49 1
1,939 1,455
484
2,223 1,65 1
572
2,292 1,738
554
2,483 1,769
714
Source SP1 Committee an Resin Statistics, Monthly Isocyanates Report, as compiled hy Association Semces Group LLC

Manu fac turersl ARC0 Chemical Co. BASF Corp. IC1 Americas Inc. Bayer COT. Olin Corp. Carpenter Chemical Co. Q.O. Chemicals, Inc. The Dow Chemical Co. Stepan Co. DuPont Witco COT.
Eastman Chemical Co.
' Those manufacturers who participated in the SPI Monthly Statistical Report in 1996.
Production and Sales & CaptiVe Use (millions ofpounds, dry weight basis)
Sales & Captive Use'
Year Production Total Flexible Foam Rigid Foam Non-Foam Export 1986. . . . 1,452 1,453 1,000 127 158 168 1987. . . . 1,626 1,653 1,045 144 188 276 1988. . . . 1,872 1,918 1,134 138 232 414 1989. . . . 1,808 1,786 1,048 132 256 350 1990. . . , 1,788 1,831 1,048 134 269 380 1991.. , . 1,769 1,797 1,016 136 253 392 1992. . . . 1,838 1,888 1,045 152 269 422 1993. . . .2,144 2,100 1,069 163 303 565 1994. . , .2,415 2,338 1,154 184 369 63 1 1995. . . .2,453 2,441 1,166 201 396 678 1996. . . .2,325 2,357 1,104 206 385 662
A Sales include lmporrs
Source: SPI Committee an Resin Statistics. Monthly Polyether Polyols Report, as compiled by Association Sewices Group LLC.

Manufacturers' Bayer Corp. Inolex Chemical Company Cape Industries Pioneer Plastic COT. Chemical Exchange Industries, Inc. The Dow Chemical Co.
Stepan Co. Witco Corp.
' Those manufacturers who participated in the Qua~tmly Polyester Polyols Report in 1996.
Production and Sales & Captive Use (millions of pounds, dry weight basis)
Production Sales & Captive Use
Year Aliphatic' Aromati? Aliphatic2 Aromatic'
1986.. . . . . . . . . .47 1987. . . . . . . . . . .56 1988.. . . . . . . . . . 58 1989.. . . . . . . . . .59 1990.. . . . . . . . . .59 1991.. . . . . . . . . .56 1992.. . . . . . . . . . 43 1993.. . . . . . . . . . 4 3 1994.. . . . . . . . . . 54 1995.. . . . . . . . . , 5 8 1996.. . . . . . . . . . 58
Excludes Polyeslers far foam; includes Caprolactones. Includes Rigid Foam.
"Disclosure
NA 124 145 134 163 150 161 172 210 245 D
46 55 57 59 57 53 42 43 57 61 71
NA 123 143 135 164 153 I62 174 211 242 277
Source: 9 1 Committee on Resin Staustics, Quarterly Polyester Polyol Report. as compiled by Association Services Group LLC.

Raw Materials - 1996 (milliomofpounds)
Major Markets - 1996(dm~pk)

A


hermoplastic resins are plastics capable of being repeatedly softened by heat and hardened by cooling in theirfinalform as Tf mished , articles.
Material
Major Markets
Engineering & Other 14.5%-
AdhesivellnksKoatings 2.1%
IndustriaVMachinery 1.1% / Consumer and Institutional 13Y
Furniture and Furnishings 4.2%
17.2%
Transportation
uilding and Construction 15.4%
4.6%
1 - Note. Includes data from reporting companies only. ElectricaVElectronic 4.1%
_-
Sources: SPI Committee an Resin Statistics. SPI Major Market Repon, as compiled by Association Services Group LLC


utex materials (Tometimes referred LO as emulsion polymers) are dispersions ofthe plastic polymer L articles in watei Developed in the luboratory in
the early 19308, thefirst successjul product was a synthetic rubber latex, commercialized during World War 11 to supplement the short supply ofnatural rubber latex. A great variety and profusion of emulsions are now in commercial production. The most important of the plastic latexes are copolymers of styrene and butadiene, homopolymers and copolymers of vinyl acetate, acrylates, and vinyl chloride, as well as emulsions of polyvinyl chloride and other specialties. Other comonomers used include fumarate, maleate, and ethylene. The non-plastic synthetic rubber latices, excluded from SPI statistics, are elastomers categorized as styrenehutadiene (high butadiene), polybutadiene, acrylonitrilehutadiene, chloroprene, and butyl. There is a significant amount of inter-product competition, particularly among the plastic types, and competition with the synthetic and natural rubber latices that historically have been used. The major end-uses for these plastic latex materials lie in four areas: (1) Adhesives - primarily in the packaging, construction, and wood products areas; (2) Coatings - primarily as a vehicle in water-based paints; (3) Paper - primarily as a clay coatings binder, but also used for saturating; and (4) Textiles - primarily as fabric
finishes, sizes, back coats, and in fabric lamination and non-woven fiber bonding. The emulsions and compounds generally are sold or used in relatively small batches (drums, tank trucks, and tank cars), and in many applications the emulsions are tailor-made to the end-use. There are thousands of end-users, some of whom polymerize for themselves, some of whom buy compounded material. Each product sold has some unique characteristic desired in the end-use. For example, some adhesive resins should impart water resistance. Fabric resins should be hard or soft depending on the type desired. And coatings resins should have good tint-retention properties. As a class, these plastic emulsions have gained wide acceptance in the above-mentioned end-uses for one or more of the following reasons:
Water base (will meet the requirements of air pollution controls and regulations) Ease of clean-up Good adhesion to various substrates High pigment-binding capacity - Abrasion resistance and flexibility Uniform quality as compared with natural
* Good supply picture as compared with many of
Relative low cost versus binding efficiency
binders
the natural binders
Compatibility with existing technology and processes
Styrene Butadiene & Other Styrene Based Latexes Signikant producers are Ameripol Synpol Corp , BASF Corp ,The Dow Chemical Co , GenCorp, Goodyear Chemical Div , Moiton Intl , Inc , and Reichhold Chemicals, Inc
Production and Sales & Captive Use (miltions of pounds, dv weight basis)
Sales & Captive Use Carpet All
Year Production Backing Other Total 1992 . . . . . . . . . . . . . . . . . . . . . 1.141 408 736 ]..I44 1993 . . . . . . . . . . . . . . . . . . . . . 1:335 470 850 1,320 1994 . . . . . . . . . . . . . . . . . . . . . 1,385 499 889 1,388 1995 . . . . . . . . . . . . . . . . . . . .1.330 459 869 1,328 1996 . . . . . . . . . . . . . . . . . . . . . . 1,360 486 890 1,376
Note: 1992 Sales include some Canadian-produced material. 1993-1996 includes total Production and Sales iav lioth US. and Canada.
~~~ ~
Suurcc: SPI Committee on Resin Statistics, Monthly Statistical Rcpon. as compiled by Associalion Scrvices Group LLC

Manufacturers' BASF Gorp. GE Plastics Bayer Gorp. The Geon Co. The Dow Chemical Go. Hampshire Chemical Go
' Those companies that participated m the SPI Monthly Statistical Report in 1996
Production and Sales & Captive Use (millions ofpounds)
Production' Sales &
Captive Use'
Year ABS SAN ABS SAN
1986 1,092 92 1,080 87 1987 1,175 126 1,208 127 1988 1,277 148 1,279 146 1989 1,260 113 1,217 108 1990 1,162 135 1,161 134 1991 1,103 109 1,125 114 1992 1,326 113 1,277 110 1993 1,462 105 1,373 118 1994 1,701 138 1,583 162 1995 1,458 130 1,463 150 1996 1,477 121 1,433 124
Compound Growth Rate 1986-1996 3.1% 2.8% 2.9% 3.6%
'1994 to 1996 data lor Production and Sales &Captive Use include total of U S . and Canada. Sales from Imports are also included in Sales & Captive Use.
Source: SPI Committee an Resin Statistics, Monthly Statistical Report, as compiled by Association Sewices Group LLC

.
Distribution by Major Market (millions of pounds)
MAJOR MARKET 1992 1993 1994 1995 1996
Transportation Packaging Building and Construction ElectricaVElectronic Furniture and Furnishings Consumer and Institutional Industriahfachinery AdhesivednWCoatings All Other Exports
437 484 NA - 161
NA 114 118 NA - NA 62 1 818 212 229
* * *
-
-
560
239 -
* -
109 -
-
772 234
49 7 435
179 210 - -
* * - - 98 78
- - 710 720 271 256
Total 1,545 1,649 1,914 1,755 1,699 * Included in All Other.
Note: Data include Other Styrene Bared Polymers. NA = Not available. Source: SPI Committee on Resin Statmi-, Annual Major Market Survey as compiled by Association Semces Group LLC
Typical Applications ABS SAN
Automotive trim Automotive trim Bathtubs Boat hulls Business machines Marine instruments Household appliances Solar collectors Refrigerator liners Swimming pool components Sporting goods Tractor components Telephones
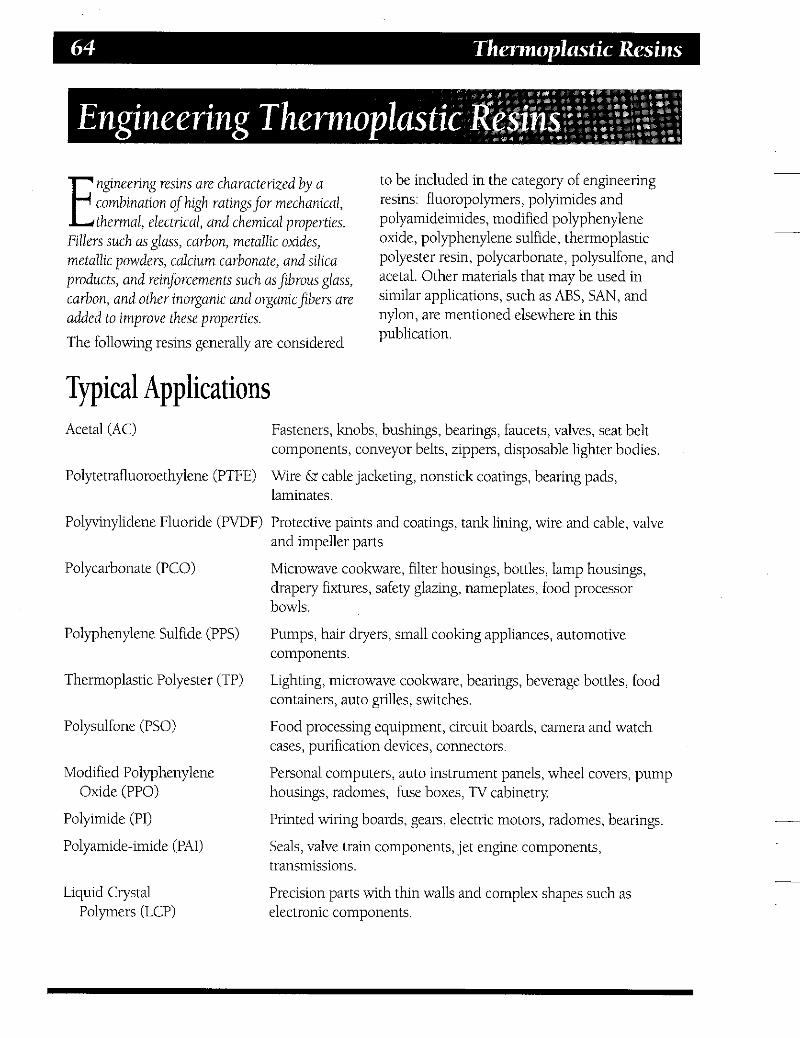
ngineering resins are characterized by a combination of high ratingsfor mechanical, E thermal, electrical, and chemical properties.
Fillers such as glass, carbon, metallic oxides, metallic powders, calcium carbonate, and silica products, and reinforcements such as fibrous glass, carbon, and other inorganic and organicfibers are added to improve these properties. The following resins generally are considered
to be included in the category of engineering resins: fluoropolymers, polyimides and polyamideimides, modified polyphenylene oxide, polyphenylene sulfide, thermoplastic polyester resin, polycarbonate, polysulfone, and acetal. Other materials that may be used in similar applications, such as ABS, SAN, and nylon, are mentioned elsewhere in this publication.
Typical Applications Acetal (AC) Fasteners, knobs, bushings, bearings, faucets, valves, seat belt
components, conveyor belts, zippers, disposable lighter bodies.
Polytetrafluoroethylene (PTFE) Wire & cable jacketing, nonstick coatings, bearing pads, laminates.
Polyvinylidene Fluoride (PVDF) Protective paints and coatings, tank lining, wire and cable, valve
Polycarbonate (PCO)
Polyphenylene Sulfide (PPS)
Thermoplastic Polyester (TP)
Polysulfone (PSO)
Modified Polyphenylene
Polyimide (PI)
Polyamide-imide (PAI)
Oxide (PPO)
Liquid Crystal Polymers (LCP)
and impeller parts
Microwave cookware, filter housings, bottles, lamp housings, drapery fixtures, safety glazing, nameplates, food processor bowls.
Pumps, hair dryers, small cooking appliances, automotive components.
Lighting, microwave cookware, bearings, beverage bottles, food containers, auto grilles, switches.
Food processing equipment, circuit boards, camera and watch cases, purification devices, connectors.
Personal computers, auto instrument panels, wheel covers, pump housings, radomes, fuse boxes, TV cabinetry
Printed wiring boards, gears, electric motors, radomes, bearings.
Seals, valve train components, jet engine components, transmissions.
Precision parts with thin walls and complex shapes such as electronic components.

Manufacturers’ AlliedSignal Inc. TP DuPont AC, TF: PI, PTFE, LCP
Ausimont U.S.A., Inc. PTFE GE Plastics PCO, T? p ro , PI
Bayer Coy. PCO Phillips Chemical Co. rps
_- Amoco Chemical Co. PSO, PI, PA, LCP Eastman Chemical Co. TP
BASF Corp. TP Hoechst Celanese Coy. AC, TP, LCP
The Dow Chemical Co. PCO
’ Those manufacturers who participated in the SPI Monthly Engineering &sin Report in 1996.
Production and Sales & Captive Use’ (~omofpmb) Year Production Sales &I Captive Use
1986 1987 1988 1989 1990 1991 1992 1993 1994 1995 1996
Compound Growth Rate 1986-1996
877 1,036 1,342 1,419 1,382 1,459 1,608 1,830 2,150 2,298 2.409
10.6%
840 957
1,318 1,378 1,298 1,304 1,495 1,703 2,022 2,061 2.094
9.5%
Distribution by Major Market’ (&mofpmb) Major Market . . . . . . . . . . . . . . . ,1992 Transportation . . . . . . . . . . . . . . . . . . . . *
1993 1994 1995 1996 * * * 678
Packaging . . . . . . . . . . . . . . , . . . . . . . . * Building & Construction . , . . . . . . . . 50 ElectricaVElectronic . . . . . , . . . . . . . . . . * Furniture & Fumishings , . . . . . . . . . NR Consumerhstitutional . . . . . . . . . . . 68 1ndustriaVMachinet-y . . , . . . . . . . . . . .75 All Other . . . . . . . . . . . , . . . . . . . . 1,05 1 Exports.. . , . , , , , , , , , , , . . . . . . . ,251
Total . . . . . . . . . . . . . . . . . . . . . . .1,495 1,703 1 Excludes Thermoolastic Polvester r e s m
* 60
* NR 90 80
1,210 263
*Included in All Other. Nore: 1995-1996 data includes U.S.A and Canada.
* * 90 135
38 29 116 190 107 74
1,332 1,284 339 349
* *
* 157
* 29 -
218 102 579 331
2,022 2,061 2,094
Source: SPI Committee on Resin Sutistics, Monthly Statistical Report, as compiled by Association Services Group LLC

Manufacturers' Chevron Chemical Co. Imperial Chemicals Paxon Polymer Co. The Dow Chemical Co. Mobil Chemical Co. Phillips Chemical Co. Eastman Chemical Co. Monte11 North America Quantum Chemical Corp Exxon Chemical, Co. Nova Chemicals, Ltd. Solvay Polymers, Inc. Fina Oil & Chemical Co. Union Carbide Corp. Formosa Plastics Corp. USA
Occidental Chemical Corp.
' Those manufacturers who participated in the SPI Monthly Statistical Report in 1996
Capacity & Utilization (millions ofpounds)
Year Capacity Utilization Rate(%)
1986 1987 1988 1989 1990 1991 1992 1993 1994 1995 1996
Year
7,301 7,997 8,530 9,081 9,552
10,808 11,918 11,611 12,202 12,838 13,552
Production
98.4 99.9 98.5 89.2 87.3 85.2 82.3 85.6 91.1 87.3 91.3
Sales &I Captive Use
1986 1987 1988 1989 1990 1991 1992 1993 1994 1995 1996
Compound Growth Rate 1986-1996
Note 1991-96 data include sales from imports
7,182 7,995 8,400 8,102 8,337 9,213 9,808 9,941
11,117 11,211 12,373
5.6%
7,028 8,155 8,084 8,173 8,838 9,345
10,110 10,604 11,910 11,837 13,211
11.1%
Source SPI Committee on Resin Statistics. Monthly Statistical Report, as compiled by Association Semces Group LLC
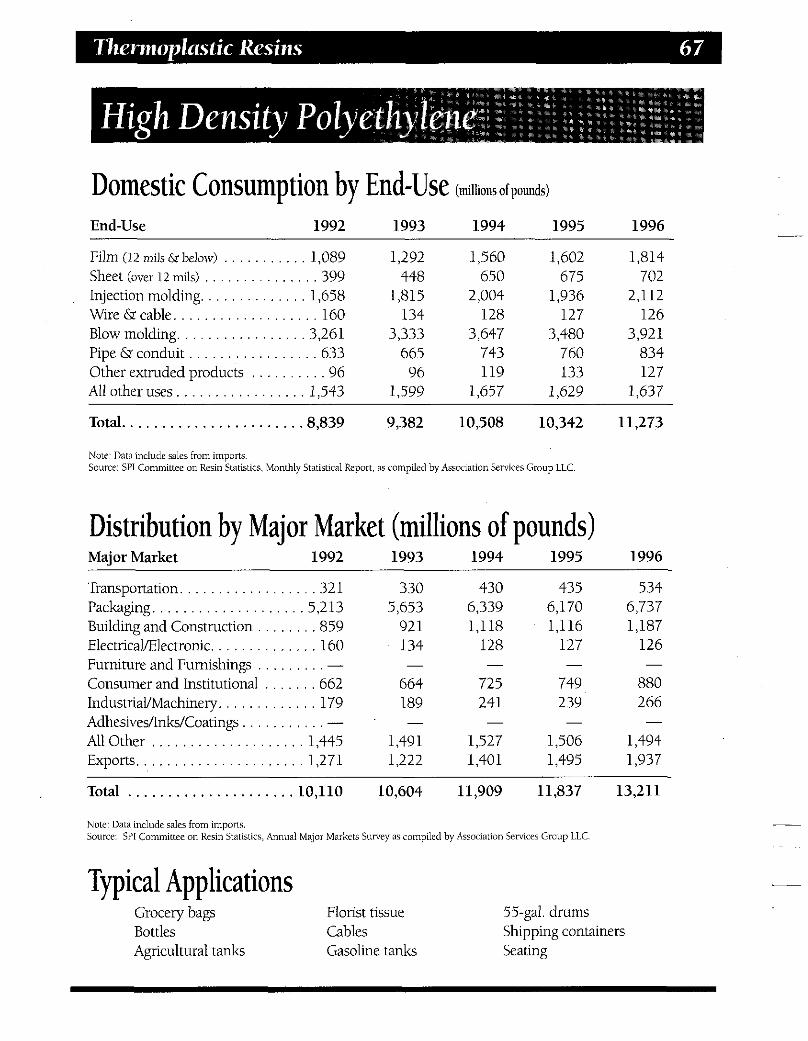
Domestic Consumption by End-Use (millions of pounds)
End-Use 1992 1993 1994 1995 1996
Film (12 mils 6s below) . . . . . . . . . . Sheet (over 12 mils) . . . . . . . . . . . . Injection molding. . . . . . . . . . . . . Wire & cable. . . . . . . . . . . . . . . . Blow molding. . . . . . . . . . . . . . . . Pipe & conduit . . . . . . . . . . . . . . Other extruded products . . . . . . All other uses. . . . . . . . . . . . . . . .
. 1,089 1,292 . . ,399 448 . 1,658 1,815 . . . 160 134 . 3,261 3,333 . . . 633 665 . . . . 96 96
1,543 1,599
1,560 650
2,004 128
3,647 743 119
1,657
1,602 675
1,936 127
3,480 760 133
1.629
1,814 702
2,112 126
3,921 834 127
1,637
Total.. .................... .8,839 9,382 10,508 10,342 11,273
Note: Data include sales from imports. Source: SPI Committee on Resin Statistics. Monthly Statistical Report, as compiled by Association Services Group LLC
Distribution by Major Market (millions of pounds) Major Market 1992 1993 1994 1995 1996
Transportation. . . . . . . . . . . . . . . . . ,321 330 430 435 534 Packaging. . . . . . . . . . . . . . . . . . . .5,213 5,653 6,339 6,170 6,737 Building and Construction . . . . . . . . 859 92 1 1,118 1,116 1,187 ElectricaVElectronic. . . . . . . . . . . . . . 160 134 128 127 126
Consumer and Institutional . . . . . . ,662 664 725 749 880 IndustriaVMachinery. . . . . . . . . . . . . 179 189 241 239 266
All Other . . . . . . . . . . . . . . . . . . . . 1,445 1,49 1 1,527 1,506 1,494 Exports.. . . . . . . . . . . . . . . . . . . . . 1,271 1,222 1,40 1 1,495 1,937
Total ..................... 10,110 10,604 11,909 11,837 13,211
- - - Furniture and Furnishings . . . . . . . . . -
AdhesivesfinkdCoatings . . . . . . . . . . . - . -
-
- - -
Nole: Data include d e s from imporlr. Source: SPI Committee on Resin Stausrics, Annual Major Markels Survey as compiled by Association Services Group LLC.
Typical Applications Grocery bags Florist tissue 55-gal. drums Bottles Cables Shipping containers Agricultural tanks Gasoline tanks Seating


Selected End-Use (millions of pounds)
End-Use 1992 1993 1994 1995 1996 .
1, 814 170
1, 644
Film . . . . . . . . . . . . . . . . . . . . . . . . . . . . . . l . 089 Food packaging . . . . . . . . . . . . . . . . . . . . . . 173 Allother . . . . . . . . . . . . . . . . . . . . . . . . . . . . 916
1. 292 162
1. 130
1. 560 174
1. 386
1. 602 151
1. 451
Injection Molding . . . . . . . . . . . . . . . . . . . 1. 658 Industrial and shipping pails (5 gal . or less) . . 488 Housewares (incl . household pails) . . . . . . . 129 Crates and totes (incl . beverages cases) . . . . 229 Toys, novelties, sporting goods . . . . . . . . . . . 115 Caps and closures . . . . . . . . . . . . . . . . . . . . 142 Food tubdcontainers and drink cups . . . . . . 311 Allother . . . . . . . . . . . . . . . . . . . . . . . . . . . . 244
1. 815 604 112
126 150 305 260
258
2. 004 679
267 71
136 372 392
a7
1. 936 732 141 240 38
123 292 370
2. 112 790 130
86
275 435
288
108
Blow Molding . . . . . . . . . . . . . . . . . . . . . . 3. 261 Liquid food bottles . . . . . . . . . . . . . . . . . . 1. 043 Household chemical bottles . . . . . . . . . . . . 915 Industrial drums . . . . . . . . . . . . . . . . . . . . . 236 Pharmaceuticals. cosmetics &toiletries . . . . 268 Allother . . . . . . . . . . . . . . . . . . . . . . . . . . . . 799
3. 333 1. 113
901 25 1 287 78 1
3. 647 1. 191
955 286 282 933
3. 479 1. 180
92 1 228 284 866
3. 921
995 267 291
1. 282
1. 086
Rotomolding . . . . . . . . . . . . . . . . . . . . . . . . . . 98
Pipe and Conduit . . . . . . . . . . . . . . . . . . . . . 633 Corrugated . . . . . . . . . . . . . . . . . . . . . . . . . 122 Gas distribution . . . . . . . . . . . . . . . . . . . . . . 192 Allother . . . . . . . . . . . . . . . . . . . . . . . . . . . . 319
107 131 124 127
665 103 173 389
743 123 197 423
760 154 182 424
834 112 190 532
All Other HDPE . . . . . . . . . . . . . . . . . . . . . 2. 100 2. 170 2. 423 2. 440 2. 465
Note: Data include sales from immrts
Source: SPI Committee on Resin Statistics . Monthly Statancal Report . as compiled by Association Services Group LLC .

Manufacturers' Chevron Chemical Co. Exxon Chemical Co. Quantum Chemical Corp. The Dow Chemical Co. Lyondell Petrochemical Co. Rexene Corp. DuPont Mobil Chemical Co. Union Carbide Corp. Eastman Chemical Co. Nova Chemicals, Inc. Westlake Polymers Corp. ' Those manufacturers who participated m the SPI Monthly Statistical Report in 1996.
Capacity & Utilization ( ~ m o f p d )
Year Capacity Utilization Rate(%)
1992 7,856 92.6 1993 7,826 92.3 1994 8,090 93.6 1995 8,058 97.2 1996 7,997 97.3
Production and Sales & Captive Use2(domofFb) Year Production Sales & Captive Use
1991 7,236 1992 7,273 1993 7,226 1994 7,578 1995 7,834 1996 7,784
1991-1996 1.1% Compound Growth Rate
7,397 7,499 7,424 7,904 7,524 7,874
1.1%
Domestic Consumption by End-Use' (dons o f p o d )
End-Use 1992 1993 1994 1995 1996
Film (12 mils & below) . . . . . . , , . . . , . . . . . 3,840 Sheet (over 12 mils). . . . . . . . . . . . . . , , . . , . . . .81 Injection molding . . . . . . . . . . . . . . . . . . . . . . ,410 Wire & cable . . . . . . . . . . . . . . . . . . . . . . . . . . . 218 Extrusion coating. . . . . . . . , . . . . . . . . . . . . . . ,805 Blow molding . . . . . , . , , , , , , , , . . . . . . . . . . . . 84 Pipe 6s conduit . , , , , , , , , , , , , . , , , . , . . . . . . . . * Other extruded products. . . . . . . , . . . . , . . . . . .92 All other uses (Incl. Resellers & ComDounders). . . . . . . 770
3,485 3,607 3,224 87 108 131
368 366 301 215 253 167 827 868 907
79 79 72
122 138 123 996 1,117 1.097
* * *
3,358 145 297
874 79
303 1.342
*
*
Total . . . . . . . . . . . . . . . . . . . . . . . . . . . . . .6,300 6,179 6,536 6,022 6,398 a Data include imports 'Included in Other Extruded Products.
Source: SPI Committee on Resin Slarisucs. Monthly Statistical Report. a5 compiled by Association Semces Group LLC.
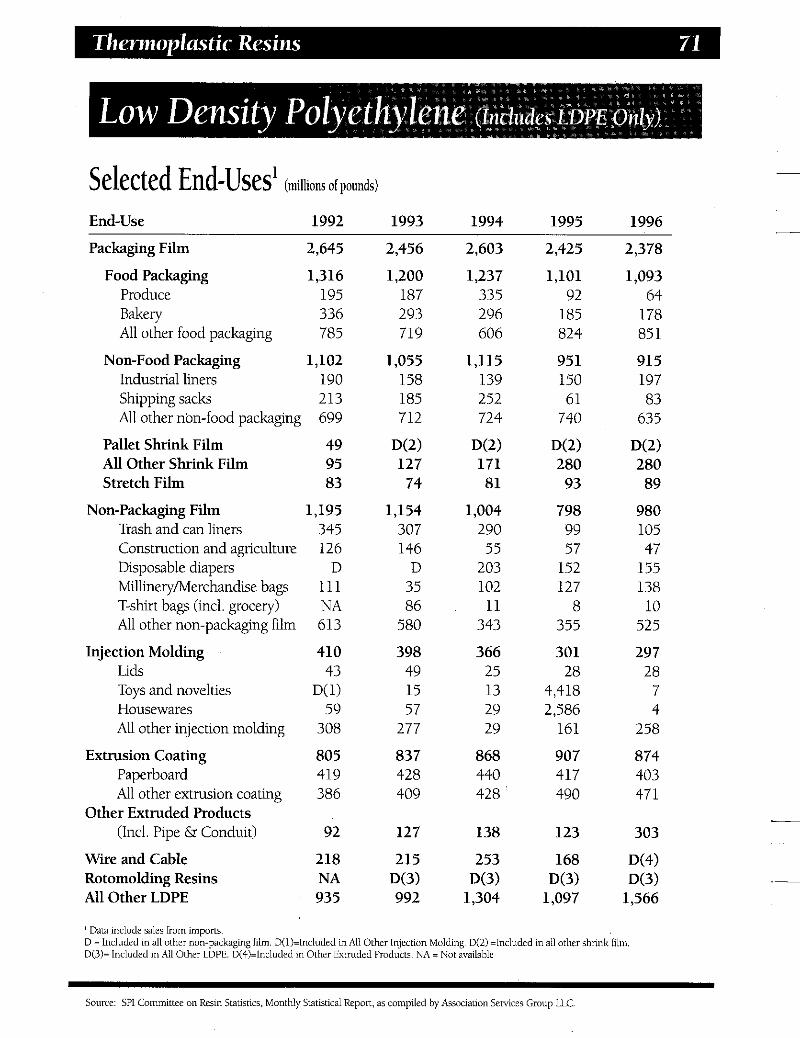
Selected End-Uses1 (millions ofpounds)
End-Use 1992 1993 1994 1995 1996
Packaging Film 2,645
Food Packaging 1,316 Produce 195 Bakery 336 All other food packaging 785
Industrial liners 190 Shipping sacks 213 All other non-food packaging 699
Pallet Shrink Film 49 All Other Shrink Film 95 Stretch Film 83
Non-Packaging Film 1,195
Non-Food Packaging 1,102
Trash and can liners Construction and agriculture Disposable diapers Millineryhlerchandise bags T-shirt bags (incl. grocery) All other non-packaging film
Lids Toys and novelties Housewares All other injection molding
Paperboard All other extrusion coating
Other Extruded Products (Incl. Pipe & Conduit)
Injection Molding
Extrusion Coating
Wire and Cable Rotomolding Resins All Other LDPE
345 126
D 111 NA 613
410 43
D(1) 59
308
805 419 386
92
218 NA 935
2,456
1,200 187 293 719
1,055 158 185 712
DO) 127 74
1,154 307 146
D 35 86
580
398 49 15 57
277
837 428 409
127
215 D(3) 992
2,603
1,237 335 296 606
1,115 139 252 724
D(2) 171 81
1,004 290 55
203 102 11
343
366 25 13 29 29
868 440 428
138
253 D(3)
1,304
2,425
1,101 92
185 824
951 150 61
740
D(2) 280 93
798 99 57
152 127
8 355
301 28
4,418 2,586
161
907 417 490
123
168 D(3)
1,097
' Data include sales from imports D = Included in all other non-packaging film. D(l)=Included in All Other Injection Molding D(2) =Included in all other shrink film D(3)= Included in All Other LDPE. D(ii)=lncluded m Other Extruded Products. NA = Not available
2,378
1,093 64
178 85 1
915 197 83
635
D(2) 280 89
980 105 47
155 138 10
525
297 28
7 4
258
874 403 471
303
D(4) D(3)
1,566
~~~~~~ ~
Source: SPI Committee on Resin Statistics. Monthly Statistical Report, as compiled by Association Senices Group LLC.
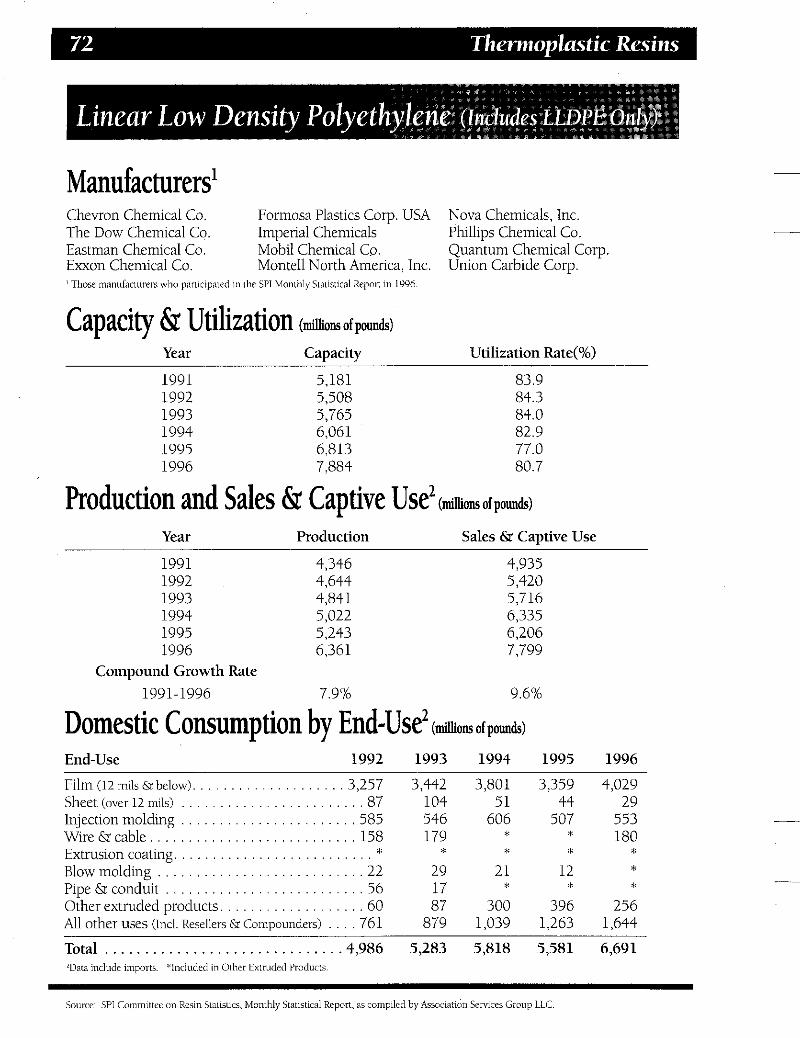
Manufacturers' Chevron Chemical Co. Formosa Plastics Corp. USA Nova Chemicals, Inc. The Dow Chemical Co. Imperial Chemicals Phillips Chemical Co. Eastman Chemical Co. Mobil Chemical Co. Quantum Chemical Corp E x o n Chemical Co. Monte11 North America, Inc. Union Carbide Corp. ' Those manufzaaurers who pariicipatcd in (he SPI Monthly Slaustral Report m 1996.
Capacity & Utilization (millionsofpounh)
Year Capacitv Utilization Rate(%)
1991 5,181 1992 5,508 1993 5,765 1994 6,061 1995 6,813 1996 7,884
83.9 84.3 84.0 82.9 77.0 80.7
Production and Sales & Captive Use2 ( ~ o n s o f p o u u ~ )
Year Production Sales & Captive Use
1991 4,346 1992 4,644 1993 4,841 1994 5,022 1995 5,243 1996 6,361
1991-1996 7.9% Compound Growth Rate
4,935 5,420 5,716 6,335 6,206 7,799
9.6%
Domestic Consumption by End-Use2 o f p o u n ~ )
End - U s e Film (12 mils &below). . . . , , , . . . . . . . . . . . . Sheet (over 12 mils) . . . . . . . . . . . . . . . . . . . . Injection molding . . . . . . . . . . . . . . . . . . . . Wire & cable. . . . . . . . . . . . . . . . . . . . . . . . Extrusion coating. . . . . . . . . . . . . . . . . . . . . Blow molding . . . . . . . . . . . . . . . . . . . . . . . Pipe & conduit . . . . . . . . , . . . . . . . . . . . . . Other extruded products. . . . . . . . . . . . . . . All other uses (Incl. Resellers & Compounders) .
1992 1993 1994 1995 1996
3,257 . . . . 87 . . , 585 . . . 158
. . . . 22
. . . . 56
. . . . 60
. . ,761
* . . . . .
3,442 3,801 104 51 546 606 179 *
* * 29 21 17 87 300
879 1,039
*
3,359 44
507 * *
12
396 1,263
*
4,029 29
553 180
* * *
256 1,644
Total . . . . . . . . . . . . . . . . . . . . . . . . . . . . . .4,986 5,283 5,818 5,581 6,691 'Data include importi. "lncluiled in Other Extruded Produc~s.
Source SPI Commitice on Rcsm Siaiisucs. Monthly Srmstical Report, as compiled by Association Services Group LLC

Selected End-Uses' (inillions of pounds)
End-Use 1992 1993
Packaging Film 1,530
Food Packaging 259 Produce 468 Bakery 24 All other food packaging 167
Non-Food Packaging 682 Industrial liners 271
All other non-food packaging 299
Pallet Shrink Film D(1) All Other Shrink Film D(1) Stretch Film 589
Non-Packaging Film 1,727 Trash and can liners 1,164 Construction and agriculture 75 Disposable diapers D(2) MillineryiMerchandise bags 113 T-shirt bags (Incl. grocery) 144 All other non-packaging film 231
Injection Molding 585 Lids 150 Toys and novelties 42 Housewares 284 All other injection molding 109
Extrusion Coating D(3) Paperboard D All other extrusion coating D
Shipping sacks 112
Other Extruded Products 116 (Incl. Pipe & Conduit)
Wire and Cable 158 Rotomolding Resins 240 All Other LLDPE 639
1,645
272 58 19
195
773 281 130 362
D(1) D(1) 601
1,818 1,212
68 D(2)
81 172 285
571 158
D(4) 251 162
D(3) D D
87
179 276 707
1994 1995 1996
1,935
342 88 13
241
724 314 108 302
D(1) D(1) 869
1,866 1,197
111 D(2) 151
D(2) 407
606 181 34
272 119
DO) D D
300
D(3) 420 691
' Data ~nclude sales from imports D= D,sclosurc D(1) = Included in Stretch Film.
D(2) = Included 111 All Other Non~packaging. D(3) = lncludcd in Other Extruded Products. D(4) = Included in All Other Injection Moklmng
1,726
312 75 40
197
672 167 100 405
D(1) D(1)
742852
1,633 1,015
83 D(2) 150
D(2) 385
508 177 21
223 87
D(3) D D
396
D(3) 400 918
2,118
411 74 41
295
855 220 95
540
DO) DU)
1,911 1,165
25 D(2) 140
D(2) 581
553 189
D(4) 228 137
D(3) D D
256
180 43 1
1,242
Source: SPI Commiitrc on Resin Stausncs, Monthly Siausrical kpor t , as compiled by Association Semces Group LLC

Manu fac turersl AlliedSignal Inc. EMS-American Grilon, Inc. Anthony Industries, Inc.
(Shakespeare Division) Monsanto Co. BASF Corp. Bayer Corp. Wellman, Inc. DuPont
Hoechst Celanese Corp.
Nyltech No. Am., Inc.
’ Those manufacturers who participated in the SPI Monthly Statistical Report in 1996
Capacity & Utilization (~mofpouh) Year Capacity Utilization Rate(%)
1986 1987 1988 1989 1990 1991 1992 1993 1994 1995 1996
509 548 614 679 762 72 1 82 1 846 972
1,082 1.187
91.4 92.5 92.2 83.8 73.2 79.9 81.4 90.8 97.0 94.3 92.9
Production and Sales & Captive Use2 (~omofpowh)
Year Production Sales & Captive Use
1986 1987 1988 1989 1990 1991 1992 1993 1994 1995 1996
Compound Growth Rate 1986-1996
‘1991 - 1996 include sales to Canada 1995 and 1996 include sales to Mexico NOW 1989 - 1995 data include sales from ~mpons
465 507 566 569 558 576 668 768 943
1,020 1,103
9.0%
443 499 5 74 581 581 627 725 794 942
1,031 1,105
9.5%
Source: SPI Committee on Resin Statistics. Monthly Suuisacal Report. as compiled by Association Semces Group LLC.

Domestic Consumption by End-Use (millions ofpounds)
End-Use 1992 1993 1994 1995
Automotive and truck. . . . . . . . . . . ,211 Electrical and electronic' . . . . . . . . . . . 57 Appliances. . . . . . . . . . . . . . . . . . . . . . 19 Film and coating. . . . . . . . . . . . . . . . .85 Wire and cable . . . . . . . . . . . . . . . . . . 4 0 Monofilament . . . . . . . . . . . . . . . . . . . 2 8 Consume? . . . . . . . . . . . . . . . . . . . . .41 IndustriaVMachinery . . . . . . . . . . . . . . 49 All Other. . . . . . . . . . . . . . . . . . . . . . . 73
243 67 20 86 45 29 44 50 79
284 321 94 105 23 22 93 100 49 50 28 27 39 38 56 61
112 123
~ _- 1996
350 86 25
103 53 41 55 78
130
Total ........................ 603 663 779 a47 92 1 ' Includes electncal and electronic applications not assignable to automotive and truck or appliance markets. 2 Includes such i tem as housewares, blushes. combs. sporting goods. cameras and toys. Note: Data include sales from imparts Data include sales to Canada. 1995 and 1996 include sales to Mexico. Source: SPI Committee on Resin Statistics. Monthly Statistical Repart.as compiled by Association Services Group LLC
Distribution by Major Market (millions of pounds)
Major Market 1992 1993 1994 1995 1996
Transportation. . . . . . . . . . . . . . . . . . 21 1 Packaging . . . . . . . . . . . . . . . . . . . . . . 8 5 Building and Construction. . . . . . . . . NA Electrical/Electronic. . . . . . . . . . . . . . . 97 Furniture and Furnishings . . . . . . . . . 30 Consumer and Institutional . . . . . . . . 8 8 Industriathfachinery . . . . . . . . . . . . . . 49 AdhesivesfinkdCoatings . . . . . . . . . . . . 5 All Other. . . . . . . . . . . . . . . . . . . . . . .38 Exports.. . . . . . . . . . . . . . . . . . . . . . 122
Total . . . . . . . . . . . . . . . . . . . . . . . . 725
243 86
NA 133 31 73 50
NA 47
131
794
284 32 1 93 99
NA NA 165 178 45 49 68 65 56 61
NA NA 67 74
163 184
942 1,031
NA=Not Available. Amount included in Transportation. Note Data include sales from imports. Source: SPI Committee on Resin Statistics. Annual Major Markets Survey, as compiled by Association Services Group LLC.
Typical Applications
350 103 NA 164 52 96 78
NA 78
183
1,104
Electrical connectors Auto components Power tool housings Pulleys Sutures Fender extensions Gears, Gearing Fishing line Emission canisters LadGarden Brush bristles Wire jackets Food packaging Cooking bags equipment
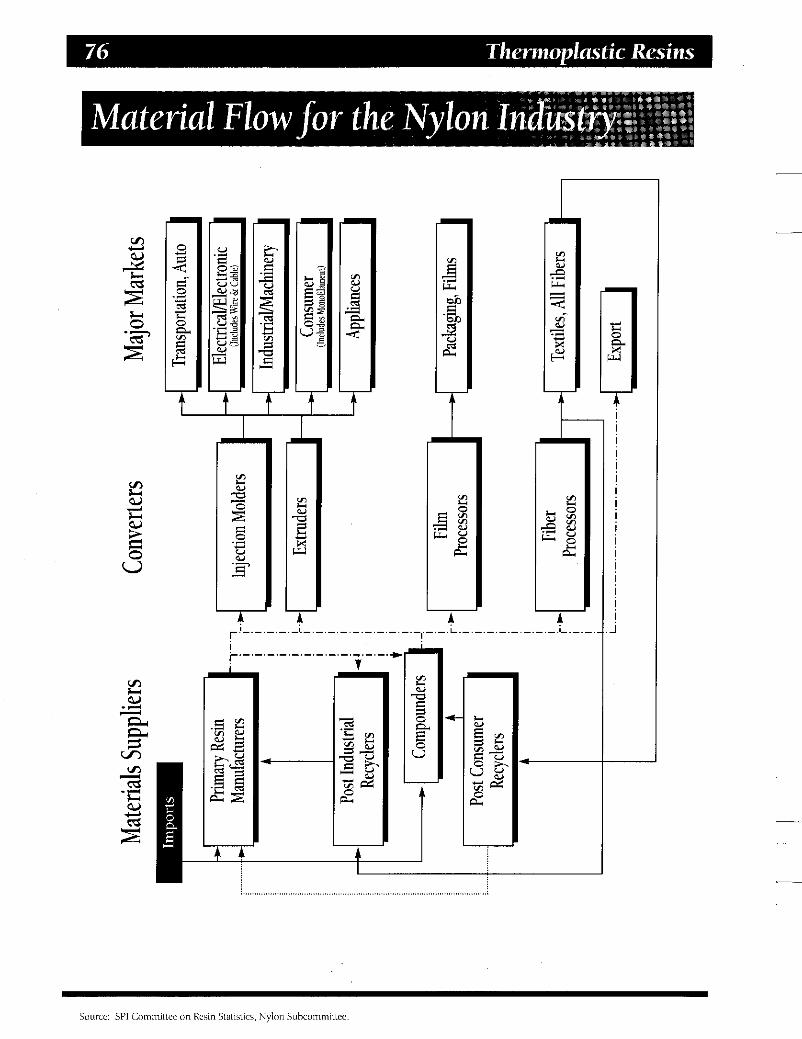
4 4
A A
I -I A
I -b $ a 0
U
g w
r ! ! ! ! ! ! ! ! ! ! ! ! ! ! ! ! ! 1
~

Polymer Producer (Non-Captive Portion) . . . . . . . . .
. . . . .) ImpodExport Markets
-* Domestic Resin Sales
- . + Finished Products
I I I 1
i I

Manufacturers' Amoco Chemical Co. Dart Container Corp. Nova Chemicals Ltd. ARC0 Chemical Co. The Dow Chemical Co. Styrochem International, Inc. BASF Corp. Chevron Chemical Co.
Fina Oil & Chemical Co. Huntsman Chemical Corp.
' Those manufacturers who participated in the SP1 Monthly Statistical Report in 1996.
Capacity & Utilization ( ~ m o f p m h ) Year Capacity Utilization Rate(%)
1986 5,182 86.3 1987 5,221 91.6 1988 5,703 91.0 1989 6,040 84.5 1990 5,609 89.5 1991 5,889 84.1 1992 5,625 90.6 1993 5,521 97.5 1994 6,306 92.7 1995 6,530 86.6 1996 6,869 88.3
Production and Sales & Captive Use(millionsofpmh) Year Production Sales & Captive Use
1986 4,470 4,463 1987 4,780 4,860 1988 5,187 5,027 1989 5,104 5,131 1990 5,021 5,049 1991 4,954 4,896 1992 5,096 5,213 1993 5,382 5,494 1994 5,848 6,000 1995 5,656 5,799 1996 6,065 6,071
Compound Growth Rate 1986-1996 3.1%
Note: 1992 - 1996 data include sales from imports.
3.1%
Source: SP1 Committee on Resin Statistics, Monthly Statistical Report. a5 compiled by Association Serdces Group LLC.

Domestic Consumption by End-Use (millions ofpounds) End-Use 1992 1993 1994
Crystal (Solid) Polystyrene (Incl. EPS). . . . . 2,740 2,884 3,140 Rubber-Modified Polystyrene . . . . . . . . . . 2,473 2,610 2,860
Total' .......................... .5,213 5,494 6,000
Molding.. . . . . . . . . . . . . . . . . . . . . . . . . . 1,709 1,892 1,851 Extrusion. . . . . . . . . . . . . . . . . . . . . . . . . .2,284 2,408 2,562 Expandable Polystyrene Beads. . . . . . . . . . . 681 695 750 All Other . . . . . . . . . . . . . . . . . . . . . . . . . . ,222 160 499
1995 1996
3,095 3,234 2,704 2,838
5,799 6,072
_-
1,867 2,063 2,470 2,622
735 811 439 166
Total Domestic.. . . . . . . . . . . . . . . . . . .4,896 5,154 5,662 5,511 5,662 I Includes Exports. Note: 1993 - 1996 data include sales from imports Source: SPI Committee on Resin Statistics. Monthly Statistical Report, as compiled by Assooaation Services Group LLC
Distribution by Major Market (millionsofpounds) Maior Market 1992 1993 1994 1995 1996
Transportation . . . . . . . . . . . . . . . . Packaging . . . . . . . . . . . . . . . . . . . Building and Construction. . . . . . . ElectricaElectronic . . . . . . . . . . . . Furniture and Furnishings, . . . . . . Consumer and Institutional. . . . . .
AdhesivednkdCoatings . . . . . . . . All Other. . . . . . . . . . . . . . . . . . . . Exports. . . . . . . . . . . . . . . . . . . . . .
IndustriaVMachinery . . . . . . . . . . .
* . . . . . . . . . . , , , , . 1,960 . . . . . . ,363 . . . . . . . ,735
. . . . . . ,757 * . . . . . . . . .
- . . . . . . . . . . . . . . 1,081 . . . . . . ,317
* 2,357
474 745 119 618
_.
84 1 340
Total.. ......................... .5,213 5,494
- 1,137
515 655 94
2,303
-
958 338
6,000
- 1,394
46 1 770 84
1,900
- 902 288
5,799 *Included in All Other. Note: Data include sales from imports. Source: SPI Committee on R a n Statistics. Annual Major Markets Survey. as compiled by Association Services Group LLC
Typical Applications
-
1,428 49 1 782 85
1,913
- 963 410
6,072
Disposable serviceware Videocassettes Business machines Pallets Appliance parts Syringes Trays Roofing insulation Egg cartons

Manufacturers' Amoco Chemical Co. Formosa Plastics Corp. U.S.A. Quantum Chemical Corp Aristech Chemical Corp. Huntsman Polypropylene Corp. Rexene Corp. Epsilon Products Co. Lyondell Petrochemical Co. Solvay Polymers, Inc. Exxon Chemical Co. Monte11 North America, Inc. Union Carbide Corp. Fina Oil & Chemical Co. Phillips Chemical Co. ' Those manufacturers who parricipatcd in the 5P1 Monthly Statisucai Report in 1996.
Capacity 61 Utilization ( ~ o w o f p ~ ~ )
Year Capacitv Utilization Rate(%)
1986 1987 1988 1989 1990 1991 1992 1993 1994 19952 1996'
Production and Year
1986 1987 1988 1989 1990 1991 1992 1993 1994 19952 19962
6,162 6,865 7,985 8,865 9,078 9,510 9,970 9,863 10,239 11,979 13,034
94.3 96.9 91.1 81.6 91.5 87.6 84.5 87.5 93.2 90.9 92.0
Sales & Captive Use (miuioo~
Production
5,812 6,674 7,274 7,238 8,310 8,330 8,421 8,629 9,539 10,890 11,991
Compound Growth Rate 1986-1996 7.5%
'1995 and 1996 data include to ld for U.S. and Canada. Note: 199 1 ~ 1996 data include Sales from Imports.
Sales & Captive Use
5,824 6,720 7,088 7,303 8,239 8,327 8,468 8,938 9,946 ~
10,710 12,121
7.6%
Source: SPI Committee on Resin Statistics, Monthly Sraiisrical Report. as compiled by Assmation SeMces Group LLC,

Domestic Consumption by End-Use ' o f p o u n ~ ) -
End-Use 1992 1993 1994 1995' 1996' -
Injection Molding. . . . . . . . . . . . . . . . . .2,699 2,821 3,304 3,671 3,891 Appliances. . . . . . . . . . . . . . . . . . . . . . . . ,207 247 264 284 314 Consumer products. . . . . . . . . . . . . . . . . . 840 95 1 1,318 . 1,189 1,347 Medical., . . . . . . . . . . . . . . . . . . . . . . . . . 151 154 178 157 DO) Rigid packaging. . . . . . . . . . . . . . . . . . . . ,671 743 860 965 1,067 Transportation. . . . . . . . . . . . . . . . . . . . . . 501 447 505 619 577 All other injection molding . . . . . . . . . . . . 329 279 179 457 586
Blow Molding. ...................... 144 159 165 177 173 Extrusion.. ...................... .3,347 3,549 4,044 4,515 4,816
Film (10 mils 6s below) . . . . . . . . . . . . . . . . . . 734 802 927 1,077 1,133 Sheet (Over 10 Mils) . . . . . . . . . . . . . . . . . . . 138 142 159 238 230 Fiber 6s filaments. . . . . . . . . . . . . . . . . .2,363 2,485 2,811 3,067 3,313 All other extrusion (Incl. wire, pipe 61 cmtind . . 112 121 147 133 140
All other uses . . . . . . . . . . . . . . . . . . . . . 1,222 1,617 1,778 1,615 2,219
Total . . . . . . . . . . . . . . . . . . . . . . . . . . . . 7,412 8,146 9,291 9,978 11,099 'Data includc sales from imports D(1) = Disclosure Included in All Other injection ridding. Source' SPI Commntre on Resin Statistics. Annual Polpropylene End-Use Survey. as compiled by Asociaaon Serviccs Group LLC.
Distribution by Major Market ' ( ~ m o f p o m ~ ) Maior Market 1992 1993 1994 1995' 1996'
Transportation. . . . . . . . . . . . . . . . . . . . . . . .59 1 Packaging. . . . . . . . . . . . . . . . . . . . . . . . . . 1,596 Building and Construction . . . . . . . . . . . . . . 143 ElectricaElectronic . . . . . . . . . . . . . . . . . . . . 255 Furniture and Fumishings . . . . . . . . . . . . . 1,493 Consumer and Institutional . . . . . . . . . . . . 1,901 Industriahlachinery . . . . . . . . . . . . . . . . . . . . - AdhesivesiInksKoatings . . . . . . . . . . . . . . . . . - All Other . . . . . . . . . . . . . . . . . . . . . . . . . . 1,433 Exports . . . . . . . . . . . . . . . . . . . . . . . . . . . . 1,056
540 1,791
178 296
1,626 1,896 - -
1,819 792
620 2,034
253 324
1,688 2,406 - -
1,966 655
755 2,284
358 1,909 2,678
*
- -
1,993 732
725 2,435
* 397
2,066 2,829 - -
2,647 1,022
Total . . . . . . . . . . . . . . . . . . . . . . . . . . . .8,468 8,938 9,946 10,709 12,121 ' Data include sales from imports. ' Data include total for U.S. sild Canada. * Disclosure. included in All Other. Source: SPI Commmee on Resin Siausiics, Annual Malor Markets Survey. as compiled by Association Services Group LLC
-
Typical Applications ~~ .~
Retort pouches FibersFilaments Battery cases Filter plates Straws Tobacco wrap Diaper coverstock Carpet backinqface Automotive trim Housewares Bottles Industrial fabrics Threaded caps Microwave cont. Syringes Appliance parts Pipes and profiles WirdCable coating Outdoor furniture ToysRam

Manufacturers' Borden Chemicals and Plastics The Geon Co. Occidental Chemical Corp.
Geor ia Gulf Corp Colorite Polymers Goo c! year Chemical Div Westlake Polymers Corp. CertainTeed Corp.
Condea Vista Co. Imperial Chemicals
Shintech Inc.
Formosa Plastics Corp. U.S.A. Ke?sor-Century Corp. ' Those manufacturers who participated in the SPI Monthly Statistical Report m 1996
Capacity & Utilization ( ~ o ~ o f p m ~ ) Year Capacity' Utilization Rate(%)
1986 8,036 90.3 1987 8,335 95.6 1988 8,906 93.8 1989 9,288 91.3 1990 9,384 96.9 1991 9,679 94.7 1992 10,282 97.2 1993 11,055 92.8 1994 12,118 96.6 1995 13,001 94.6 1996 14,314 92.4
' Capacity data for 1994. 1995 and 1996 include total for U.S. and Canada.
Production and Sales & Captive Use ( ~ o m o f p o ~ ) Year Production Sales & Caotive Use
1
1986 7,256 7,412 1987 1988 1989 1990 1991 1992 1993 1994 1995 1996
7,971 8,350 8,478 9,096 9,164 9,989
10,257 11.712 121295 13,220
8,081 8,287 8,493 8,996 9,086
10,003 10,549 11.761 121033 13,299
Compound Growth Rate 1986-1996 6.1% 6.0%
' Production and Sales 61 Captive Use data m 1994. 1995 and 1996 include total far U S A and Canada
Typical Applications . - _ _
Food wrap Wall covering Shower curtains Doors Appliance housing Flooring Coatings WirdCable insulation Window frames Bottles Siding Upholstery Automotive seats Molding Apparel Pipe Garden hose Medical tubing Credit cards Toys
Source' SPI Committee on Resin Statistics. Monthly Statistical Report, as compiled by Association Services Group LLC

Domestic Consumption by End-Use ~
End-Use 1992 1993 1994’ 1995’ 1996l
Calendering . . . . . . . . . . . . . . . . . . . . . . . . . . . 1. 05 1 Flooring . . . . . . . . . . . . . . . . . . . . . . . . . . . . . . . 214 Textile . . . . . . . . . . . . . . . . . . . . . . . . . . . . . . . . . . 79 All other calendering . . . . . . . . . . . . . . . . . . . . . 758
Coating . . . . . . . . . . . . . . . . . . . . . . . . . . . . . . . . 337 Flooring . . . . . . . . . . . . . . . . . . . . . . . . . . . . . . . 167 Textile &paper coating . . . . . . . . . . . . . . . . . . . . 93 Protective coatings . . . . . . . . . . . . . . . . . . . . . . . . 51 Adhesives &all other coatings . . . . . . . . . . . . . . . 26
Extrusion . . . . . . . . . . . . . . . . . . . . . . . . . . . . .6, 049 Wire &cable . . . . . . . . . . . . . . . . . . . . . . . . . . . 412 Film & sheet (Incl . packaging & non-packaging) . . . . 336
Siding (Incl . accessories and mobile home skirting) . . 7971 All other extrusions (Incl . windows &doors) . . . . . 616
Molding . . . . . . . . . . . . . . . . . . . . . . . . . . . . . . . 513 Bottles . . . . . . . . . . . . . . . . . . . . . . . . . . . . . . . . 191 Fittings (rigid pipe & tubing) . . . . . . . . . . . . . . . . . 229 All other molding . . . . . . . . . . . . . . . . . . . . . . . . . 93
Paste Processes (except coating) . . . . . . . . . . . . . . 197 Plastisol formulation . . . . . . . . . . . . . . . . . . . . . 115 All other paste process uses . . . . . . . . . . . . . . . . . 82
Resellers 6r Compounders . . . . . . . . . . . . . . . . 392 All Other Uses . . . . . . . . . . . . . . . . . . . . . . . . . . . 92
Rigid pipe & tubing (except Eittings) . . . . . . . . . 3, 714
1. 097 227 82
789 370 195 97 52 26
6. 423 393 339
3. 904 1. 180
607 525 178 239 108 209 119 90
447 102
1. 166 231 88
847 411 209 119 56 27
7. 661 428 387
4. 595 1. 471
779 573 190 280 103 228 133 95
457 120
1. 123 217 65
84 1 395 207 225 109 109 53 61
7. 641 9. 104T 415 447
26 a 424 347
4. 545 4.473
253 282 105 112 217 209 129 123 88 86
514 577 134 162
Total . . . . . . . . . . . . . . . . . . . . . . . . . . . . . . . . .8. 631 9. 172 10. 616 10. 552 12. 215 Source: SPI Committee on Resin Statistics . Monthly Statistical Report. as compiled by Assouaaon Semces Group LLC
Distribution by Major Market (fiomofph) Major Market 1992 1993 1994’ 199S 1996’ Transoortation . . . . . . . . . . . . . . . . . . . . . . . . . . . . 186 194 255 253 293 Packaging . . . . . . . . . . . . . . . . . . . . . . . . . . . . . . . . 620 Building and Construction . . . . . . . . . . . . . . . . . 5 , 727 ElectricaVElectronic . . . . . . . . . . . . . . . . . . . . . . . . 507 Furniture and Furnishings. . . . . . . . . . . . . . . . . . . 262 Consumer and Institutional . . . . . . . . . . . . . . . . . . 740 Industrialhlachinery . . . . . . . . . . . . . . . . . . . . . . . . . * AdhesivesAnkdCoatings . . . . . . . . . . . . . . . . . . . . 111 AllOther . . . . . . . . . . . . . . . . . . . . . . . . . . . . . . . . 478 Exports . . . . . . . . . . . . . . . . . . . . . . . . . . . . . . . . 1. 372
Total . . . . . . . . . . . . . . . . . . . . . . . . . . . . . . . . 19, 003
63 1 747 6. 274 7. 433
516 538
743 860 7. 388 8. 552
535 619 258 184 183 212 728 916 910 1. 054
74 * 113 88 457 381
I. 377 I. 145 10. 549 11. 761
*Included in All Other . I Production and Sales 6. Capwe Use data m 1994. 1995 and 1996 include to ld far U.S. and Cailada .
74 85 88 101
379 439 1.480 1.084
12. 033 13. 299
.
Source. SPI Committee an Resin Statistics . Annual Major Markrts Survey

Manufacturers' AlliedSignal Inc. GE Plastics Shell Chemical Co. BASF Gorp. Hoechst Celanese Gorp. Wellman, Inc. DuPont IC1 Americas Inc. Eastman Chemical Co. NAN YA Plastics
' Those manufacturers who paniapated in the SPI Monthly Statistical Report in 1990
Capacity & Utilization ( ~ o w o f p o u n ~ ) Year
1986 1987 1988 1989 1990 1991 1992 1993 1994 1995 1996
Capacity
1,253 1,887 2,270 2,695 2,942 2,956 2,61SR 2,625 2,833(a1
4,341(a1 3,373'"
Utilization Rate(%)
93.8 73.9 72.8 60.5 63.9 71.5 92.3R 97.1 NC NC NC
" = Rcwion Note: Capacity data for years 1987-1991 issuspect I,') = Solid state capacity only. N C = Not calculated.
Production and Sales & Captive Use ( ~ o ~ o f p o u n ~ ) Year Production Sales 6s Caotive Use
1986 1987 1988 1989 1990 1991 1992 1993 1994 1995 1996
Compound Growth Rate 1986-1996
1,175 1,394 1,652 1,630 1,879 2,115 2,413 2,549 3,196 3,785 4,031
13.1%
Note: Dara include sales liom imports. 199 I - 1996 'lava include sales to Canada.
1,160 1,411 1,643 1,707 1,905 2,113 2,44 1 2,546 3,154 3,425 3,962
13.0%
Source SPI Commillce on Resin Statistics, Monthly Svatistical Report. as campded by Association Scrviccs Group I.LC
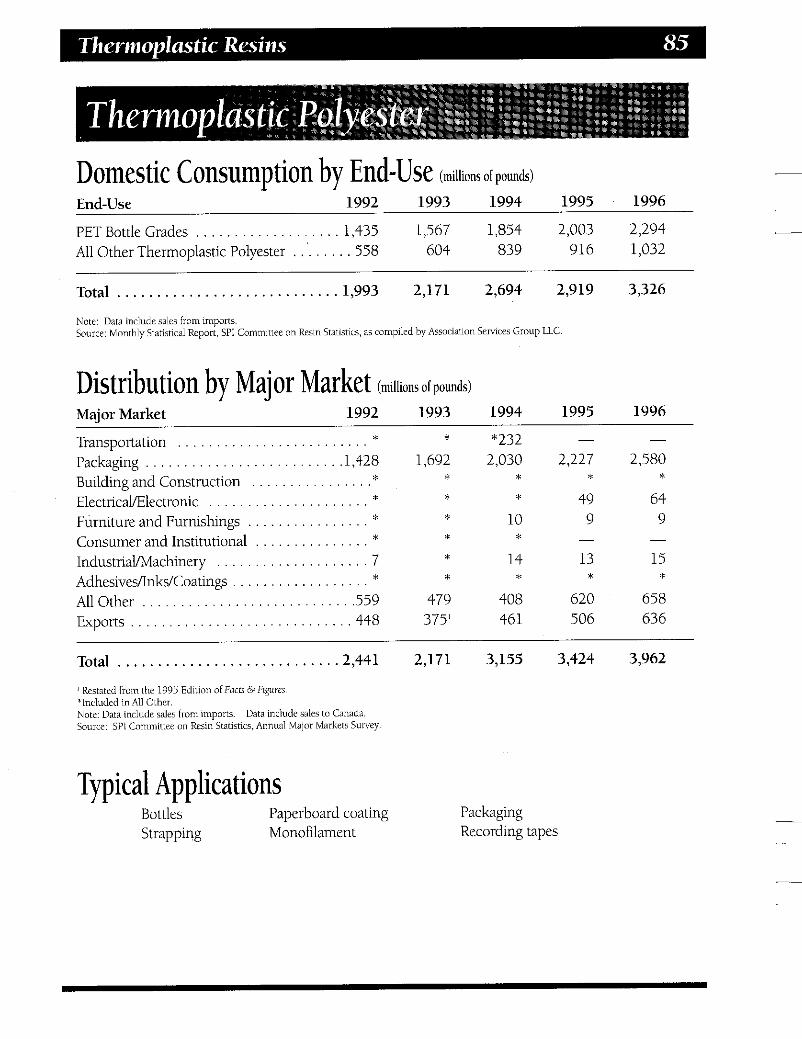
Domestic Consumption by End-Use (millions of pounds) -
End-Use 1992 1993 1994 1995 1996
PET Bottle Grades . . . . . . . . . . . . . . . . . . . 1,435 1,567 1,854 2,003 2,294 - All Other Thermoplastic Polyester . . . . . . . . 558 604 839 916 1,032
Total . . . . . . . . . . . . . . . . . . . . . . . . . . . . 1,993 2,171 2,694 2,919 3,326
Note: Daw include salcs from imports. Source: Monthly Statistical &port, SPI Commirree on R e m Statistics. as compiled by Associatmn Semces Group LLC
Distribution by Major Market (millions ofpounds) Maior Market 1992 1993 1994 1995 1996
Transportation . . . . . . . . . . . . . . . . . . . . . . . . . *
Building and Construction . . . . . . . . . . . . . . . .* Packaging . . . . . . . . . . . . . . . . . . . . . . . . . .1,428
ElectricaVElectronic . . . . . . . . . . . . . . . . . . . . . * Furniture and Furnishings . . . . . . . . . . . . . . . . * Consumer and Institutional . . . . . . . . . . . . . . . * Industriablachinery . . . . . . . . . . . . . . . . . . . . 7 AdhesiveshkdCoatings . . . . . . . . . . . . . . . . . . *
Exports . . . . . . . . . . . . . . . . . . . . . . . . . . . . . 448 AllOther . . . . . . . . . . . . . . . . . . . . . . . . . . . . 559
* 1,692
* * * * * *
479 3751
- *232 2,030 2,227
* 49 10 9
14 13
408 620 46 1 506
* *
- *
* *
- 2,580
64 9
15
658 636
*
-
*
Total . . . . . . . . . . . . . . . . . . . . . . . . . . . .2,441 2,171 3,155 3,424 3,962
’ Restated froin the 1995 Edition ofiaiti DFtgures, ‘Incluilcd in All Other. Note: Data include sales from imports. Source: SPI Committee on Resin Statistics, Annual Major Markets Survey
Data include sales to Canada.
Typical Applications Bottles Paperboard coating Packaging Strapping Monofilament Recording tapes

Selected Thermoplastics by Process Grade (millions of pounds)
Injection Blow Materianear Total Molding Extrusion Molding Other Grand Total
1991 38,303 6,849 20,739 3,453 7,262 1992 41,667 7,738 22,906 3,702 7,321 1993 43,975 8,253 23,944 3,769 8,009 1994 49,220 8,573 26,692 4,093 9,863 1995 48,868 8,463 26,428 3,902 10,075 1996 54,267 9,330 29,513 4,322 11,102
-
Growth Rate 1991-1996 7.3% 6.4% 7.3% 4.6% 8.9%
Low Density Polyethylene 1991 6,115 305 4,840 68 902 1992 6,300 410 5,036 84 770 1993 6,178 398* 4,877 79 825 1994 6,536 366 4,974 79 1,117 1995 6,022 301 4,552 72 1,097 1996 6,398 297 4,680 79 1,342
1991-1996 1.0% 0.6% 0.6% 3.1% 8.3% Growth Rate
Linear Low Density Polyethylene 1991 4,460 526 3,162 17 755 1992 4,986 585 3,618 22 761 1993 5,282 571 3,857 20 834 1994 5,818 606 4,152 21 1,039 1995 5,581 507 3,799 12 1,263 1996 6,691 553 4,494 - 1,644
1991-1996 4.6% 0.8% 3.8% 6.7% 10.8% Growth Rate
High Density Polyethylene 1991 8,295 1,688 2,119 3,012 1,476 1992 8,839 1,658 2,377 3,261 1,543 1993 9,382 1,815 2,636 3,333 1,598 1994 10,508 2,004 3,200 3,647 1,657 1995 10,342 1,936 3,297 3,480 1,629 1996 11,273 2,112 3,620 3,921 1,620
1991-1996 6.4% 4.6% 11.3% 5.4% 2.0% Growth Rate
*Remsed from 1994 Facts &Figures
Source: SPI Committee on Resin Statistics, Monthly Statistical Report. as compiled hy Association Sewices Group LLC

Selected Thermoplastics by Process Grade (millions of pounds)
Injection Blow _- Materiawear Total Molding Extrusion Molding Other
Polypropylene 1991 6,721 2,232 3,076 154 1,259
1993 8,145 2,821 3,549 159 1,616 1994 9,302 2,893 3,934 156 2,319 1995 10,014 2,975 4,451 167 2,421 1996 11,108 3,350 4,769 171 2,818
1991-1996 10.6% 8.5% 9.2% 2.1% 17.5%
1992 7,412 2,699 3,347 144 1,222
Growth Rate
Polystyrene 1991 4,602 1,5 14 2,235 - 853 1992 4,896 1,709 2,284 - 903 1993 5,154 1,892 2,407 - 855 1994 5,661 1,851 2,562 - 1,249 1995 5,510 1,866 2,470 - 1,174 1996 5,661 2,063 2,622 - 976
1991-1996 4.3% 6.4% 3.2% - 2.7% Growth Rate
Nylon',3 52 1991 517 296 169 53 1992 603 355 195 58 1993 663 409 196
1994 779 470 209 - 100 1995 847 520 218 - 109 1996 922 561 224 - 137
1991-1996 12.2% 13.7% 5.9% - 21.0%
- - -
Growth Rate
P V C 2 1991 7,593 288 5,138 202 1,965 1992 8,631 322 6,049 191 2,069 1993 9,172 347 6,423 178 2,224 1994 10,616 383 7,661 190 2,382 1995 10,552 358 7,641 171 2,382 1996 12,214 394 9,104 151 2,565
1991-1996 10.0% 6.5% 12.1% 5.5% 5.6% Growth Rate
' Data include sales to Canada. ' 1994, 1995 and 1996 include total for U.S.A. and Canada. ' 1995 includes sales to Mexico.
Source: SPI Cammmoee on Resin Statistics. Monthly Statlsncal Report. as compiled by Assocutlo" Semces Group LLC.
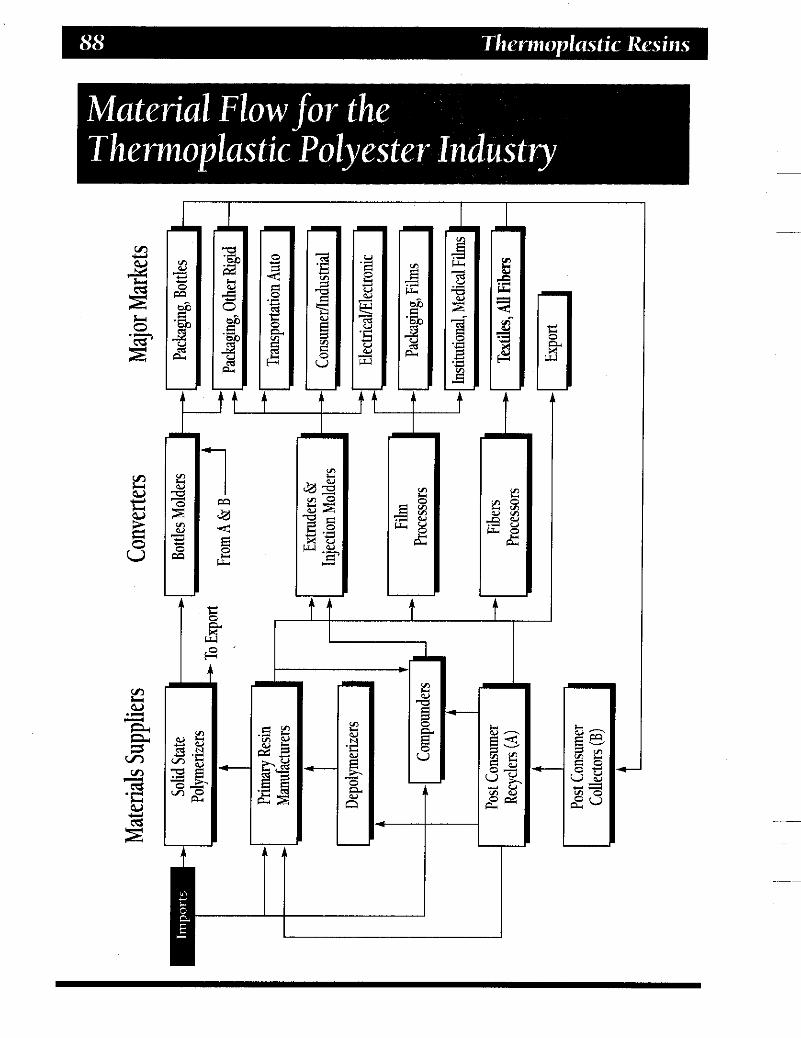
- 1 F@
a .4: E e
CL
'$
t t
I


A Joint Initiative with The Society of the Plastics Industry, Inc. he American Plastics Council @PC) works to ensure actively demonstrating they are a
responsible choice in a more environmentally conscious world. APC works on behalf of the overall plastics industry to enhance the integrity
of plastics with industvy customers, the public and others by focusing on resource Conservation issues and product benefits. The activities are conducted in concert with, and supplement the programs of The Society of the Plastics Industry, lnc. (.PI), and other organizations within the broader plastics “jamily ”.
are a preferred material by T Resource Management - Useful Facts Plastic Packaging Does More With Less
Without plastics, packaging weight would increase fourfold, and the volume would more than double.
material because they have a higher product-to-package ratio compared to other materials. One ounce of plastic typically delivers 38.8 ounces of food and beverage. Compare this with the following materials.
Ounces of Product Delivered Per Ounce of Packapg Material
Plastics are the most efficient packaging
Material Aluminum 21.7 Paper 6.9 Steel 5.6 Glass 1.8 Plastics 34.0
Waste preventon Reduces Municipal Solid Waste Since 1977, the weight of a 2-liter PET soda bottle has been reduced from 68 grams to 51 grams. This represents a 25 percent reduction per bottle. When you consider that more than seven billion 2-liter bottles are sold each year, plastics can now deliver the same volume of product while using 250 million pounds less packaging.
Because plastics resist corrosive environments found in some modern appliances, they prolong product life. Without plastics, product durability and life span would decrease by as much as 40 percent.
Plastics Help Conserve Natural Resources Five trucks are required to carry the same number of paper bags as contained in one truckload of plastic bags.
Energy, buildings and homes constructed each year with polyurethane insulation will save 58 million barrels of oil for heat and air conditioning over the course of their lives compared to alternative forms of insulation. That is the equivalent to more than 40 oil tanker shipments.
According to the U.S. Department of
The Economics of Waste Prevention The average homeowner can save between $150 and $450 per year for heating and cooling costs by using vinyl windows, versus aluminum windows.’
Without plastics, appliances would use 30 percent more energy and cost 25 percent more. Refrigerators alone would use 50

percent more energy and lose 20 percent of their storage space if they did not contain plastics8
material components of the solid waste stream, assuring that the methods best suited to specific waste stream materials are used. This integrated approach allows a community to design a waste management program that reflects the community's population and waste stream characteristics and the best possible mix of waste management solutions tailored to the
- Recycling Studies conducted by R ,W Beck and Association Services Group LLC showed that post-consumer plastics recycling continued to progress in 1996.
1.3 billion pounds of post-consumer
local economy
Municipal Waste Stream Composition9 1995 (Total weight 208.0 million tons) recycled plastic bottles were produced
by plastics recyclers in 1996. 38 percent of all PET soft drink bottles were recycled in 1996. 655 million pounds of HDPE bottles, such as milk, juice, water and household chemical bottles, were recycled in 1996 at a rate of 24.4 percent..
According to an extensive survey in 1996, APC estimates that more than half of all U.S. communities - approximately 14,645 - collected plastics for recycling. Plastics, primarily PET & HDPE, were collected through either curbside, drop- off or buy-back programs. Approximately 54 percent of the communities collected plastics through curbside program. Many communities throughout the United States are struggling with the question of how to safely and effectively manage municipal solid waste. Most are
Yard Trimmings 14.3%
discovering that there are no quick solutions to the waste management problem, and that the only real solution is an integrated waste management approach that utilizes four basic methods:
I GVM. Wiesbaden (Germany), Packaging Without Plastic: Ecological and Economic Consequences ofa Puckaging Matetial Market Wlthour Plii.tiCS. (1992) z Dr. William Rathje, The Archaeolog~ ofPlartic Packayng 6 Source Reduction, University of Arizona, Uanuary 1997) 'Robert F. Testin, P h D and PeterJ. Vergano, Sc.D., PlastiiPackaging O p p m i i i a and Chalkngei, (January 1992) + Ralph 5. Hagan, Plastics, Key Materialsfor innovation and Productivity
3 Plastic Bag Information Cleanng Houa. Plastic Bag Association
'The Vinyl Institute
- 1. Source Reduction 2. Recycling 3, Waste-to-Energy Incineration 4. Landfilling
in Major Appliances. (December 1993)
Facts Abour Polyurethane lnsulauon
Ralph 5. Hagan, Plaaiiics, Key Materialr/or innovation md Productivily in Mqor Applianca. (December 1993) Landfill, Volume of Discards in MSW, 1995. Source: EPA. Characterization of Municipal Solid Waste in the United States ~
1996 Update.
-
An integrated system matches these four waste management methods to the


Monomers +
Synthetic SIC 2821 Resins ;-- Additives
- ~ Compounding
~ I I
Laminated PlaStiCS PlaStiCS Bottles
S I F t k 4 SIC 3085 PlaStiCSha es PlaStiCS SIC 3081
Film 6r Sheet SIC 3081
~
I
Products NEC SIC 3086 SIC 3088 SIC 3689
Major Markts c Transportation Aemspace, Automotive, Aircraft, Marine, Military, Railroad, Recreational
1 Closures, Coatings, Containers, Flexible packaging
1 1
Building materials, Pipe &fittings, Plumbing fixtures
Appliance, Batteries, Business machines, Communications, Records
1 Fu~ture/Fumishings
Consumerhnstitutional
Bedding, Carpets (incl. backing), House furnishings, Rigid & flexible furniture
Cutlery, Lawn & garden, Luggage, Medical & healthcare, Toys &sporting goods
Engine parts, Farm &I constr. equip., Mach. tools, Marine supplies, Signs &displays
Adhesives, Inks, Coatings
I Exports c Source: SPI Committee on Resin Statmics. Major Markets Manual.

omposites are a specialfamily ofmaterials in which the polymer matrix is reinforced by fibers or C otherforms of reinforcement. The most common
reinforcementfibers are glass, carbon, aramid, boron, as well as thermoplasticfibers. The most popular composite resins are thermosets (unsaturated polyestec vinyl estec epoxy and phenolic). Reinforced thermoplastics (nylon, polyolefns, ABS, PVC, etc.) are a rapidly growing segment of the industv.
The primary benefits of composites include high strength, oriented strength, light weight, high strength-to-weight ratio, high dielectric strength corrosion resistance, and long term durability These benefits allow manufacturers and designers to select just the right combination of materials to fit the needs of specific applications in a wide range of end-use products. The U.S. composites industry is very advanced in technical activities due largely to the engineered types of products which are manufactured from composites and the relatively high value-added nature of the ultimate applications.
Since 1990, the Composites Institute has been involved in industry market and application development activities, coordinated through its Market Development Alliance. For example, the
Marinflaterfront Task Group (MWTG) is developing new forms of composite bearing piles, fender piles and sheets piles (bulkheading) for port and harbor installations. MWTG is also investigating techniques for repair and upgrading of pier facilities. The Composites Infrastructure Task Group (CITG) has programs to develop a new generation of products for reinforcing concrete (dowel rods, reinforcing bars, tendons, cablestays, etc.) as well as primary and secondary structural applications. It is expected that structural applications far composites in civil engineering and the nation's infrastnicture will continue to be the focus of this exciting industry development initiative.
Needs for lightweight structural materials also continue to suppop increased demands for composites in the aircraftlaerospacddefense, appliancehusiness equipment, construction, consumedrecreational products, electricaV electronics, marine and surface transportation markets. Typical composite applications in these industries include tubs/showers, pipes and tanks, grating, railings and ladders, window lineals, paneling, housings for appliances, utility poles and lighting standards, and nearly 500 composite automotive and truck applications.
Composites Shipments by Market (thermoset & thermoplastic renns) (millions of pounds)'
Markets 1986 1987 1988 1989 1990 1991 1992 1993 1994 1995 1996
Aircraft/Aerospac&ilitary 37 36 39 41 39 39 32 25 24 24 24 Appliances/Business Equipment 137 141 150 151 153 135 143 148 161 166 177 Construction 456 506 495 470 468 420 483 530 597 627 655 Consumer Products 149 167 169 158 165 149 162 166 175 184 194 Corrosion-Resistant Equipment 291 329 349 335 350 355 332 352 376 394 381 ElectricaElectronic 201 214 230 229 241 231 260 275 299 315 319 Marine 340 413 452 405 375 275 304 319 363 375 368
Miscellaneous 83 75 80 76 79 74 83 89 102 107 107
Total 2,279 2,537 2,659 2,542 2,575 2,360 2,549 2,726 3,043 3,176 3,224 ' Includes reinforced thermoset and thermoplastic resin composiies. reinforcements, and Iillers.
- .~
Land Transportation 585 656 695 677 705 682 750 822 946 984 999 -
Source: SPI composites 1"stit"te.

inyl siding is used in the construction of exterior building walls, bothfor new building V and remodeling. Rigid polyvinyl chloride
BVCI homopolymer is compounded (blended) with a variety ofauxiliary materials such as plasticizers, stabilizers, lubricants and pigments prior to being exttuded into a wall siding product. The soffit, or underside of any structural component such as the eaves, is usually made of similar PVC material.
Participating Producers - 1996 ~ Alcoa Building Products/HC Products Alsco/Amerimark' Alside, Inc. Armor Bond Building Products Bird Vinyl Products, Inc. ABT Building Products Certainreed Corp. Crane Plastics Inc. Daymond Building Products Elixir Industries Fabwell
'Rcpoitcd 1994 - 1996 only All other producers reported 1993 - 1996.
The Vinyl Siding Institute, a division of SPI, sponsors a statistical program with its member companies as participants. Data are collected covering U.S. shipments of vinyl siding and soffit reported in "number of squares," which are units of measure common in the building and construction industry One square equals 100 square feet of siding, or enough to cover a 10 ft. by 10 ft. area.
Gentek Building Products' Heartland Building Products Master Shield, Inc. NAPCO, Inc.' Norandex Rollex Corp. Royalguard Vinyl Ltd.' Variform, Inc. Vinylcraft Vytec Corp. Wolverine Technologies, Inc.
U.S. Shipments of Vinyl Siding & Soffit Number of Percent
Year Squares Change 1988 16,511,279 5.7 1989 17,600,093 6.6 1990 18,592,548 5.6 1991 19,597,707 5.4 1992 19,890,760 NC 1993 2 1,829,445 NC 1994 29,151,305 NC 1995 30,480,494 4.6 1996 34,435,367 13.0
NC = Not comparable Note, 1991 data include industry estimates for non-participants. 1992 ~ 1996 data include no industry estimates for non-partxipants.
Source: SPI Vinyl Siding lnstmte as compiled by the SPI Statislical Department.


Injection Molding njection molding is the principal method of orming thermoplastic materials. Modijcations If of the injection process are sometimes usedfor
thermosetting plastics. ,
In injection molding, plastic material is put into a hopper which feeds into a heating chamber. A plunger pushes the plastic through this long heating chamber, where the material is softened to a fluid state. At the end of this chamber there is a nozzle which abuts firmly against an opening into a cool, closed mold. The fluid plastic is forced at high pressure through this nozzle into the cold mold. As soon as the plastic cools to a solid state, the mold opens and the finished plastic is ejected from the press.
The problem with injection molding of thermosetting materials is that, under heat, these plastics will first soften, then harden to an infusible state. Thus it is essential that no softened thermosetting material in the heating chamber be allowed to remain there long enough to set. Jet molding, offset molding and molding using a screw-type machine overcome this problem by liquefying the thermosetting plastic material just as it goes through the injection nozzle into the mold, but not before.
Blow Molding low molding is a method offorming hollow articles out of thermoplastic materials. B
Blow molding is a process of forming a molten tube of thermoplastic material, then with the use of compressed air, blowing up the tube to conform to the interior of a chilled blow mold. The most common methods are extrusion, injection, and injection-stretch blow molding.
The continuous-extrusion method uses a continuously running extruder with a tuned die head that forms the molten plastic tube. The tube is then pinched between two mold halves. A blow pin or needle is inserted into the tube and compressed air is used to blow up the part to conform to the chilled mold interior. Accumulator-extrusion is similar, however, the molten plastic material is accumulated in a chamber prior to being forced through a die to form the tube.
Injection blow molding is a process of injection molding a preform (similar to a test tube), then taking the tempered preform to a blow mold to be filled with compressed air to conform to the interior of the blow mold. Injection-stretch blow molding can be a single- stage process similar to standard injection blow molding, by adding the element of stretch prior to blow forming. Also, a two-step process is possible, where a preform is made in an injection molding machine, then taken to a reheat-stretch blow molding machine for preform reheating and final blow forming in a blow mold.

Thermo forming hermoforming of plastic sheet has developed rapidly in recent years. This T process consists of heating thermoplastic
sheet to aformabfe pfastic state and then applying air andlor mechanical assists to shape it to the contours of a mold.
Air pressure may range from almost zero to several hundred psi. Up to approximately 14 psi (atmospheric pressure), the pressure is obtained by evacuating the space between the sheet and the mold in order to utilize this atmospheric pressure. This range, known as vacuumforming, will give satisfactory reproduction of the mold configuration in the majonty of forming applications.
Transfer Molding ranger molding is most generally used for thermosetting plastics. T
This method is like compression molding in that the plastic is cured into an infusible state in a mold under heat and pressure. It differs from compression molding in that the plastic is heated to a point of plasticity before it reaches the mold and is forced into a closed mold by means of a hydraulically operated plunger.
Transfer molding was developed to facilitate the molding of intricate products with small deep holes or numerous metal inserts. The dry mold compound used in compression molding sometimes disturbs the position of the metal inserts and the pins which form the holes. The liquefied plastic material in transfer molding flows around these metal parts without causing them to shift position.
Reaction Injection Molding eaction injection molding (RIM] is a relatively new processing technique that has rapidly R aken its place alongside more traditional
methods. Unlike liquid casting, the two liquid components, polyols and isocyanates, are mixed in a chamber at relatively low temperatures (75" - 140" F) before being injected into a closed mold. An exothermic reaction occurs, and consequently RIM requiresfar less energy usage than any other injection molding system.
The three major types of polyurethane RIM systems are rigid structural foam, low-modulus elastomers, and high-modulus elastomers.
Reinforced RIM (R-RIM) consists of the addition of such materials as chopped or milled glass fiber to the polyurethane to enhance stiffness and to increase modulus, thus expanding the range of applications.

Compression Molding ompression molding is the most common method offorming thermosetting materials. C I t is not generally usedfor thermoplastics.
Compression molding is simply the squeezing of a material into a desired shape by application of heat and pressure to the material in a mold.
Plastic molding powder, mixed with such materials or fillers as woodflour and cellulose to strengthen or give other added qualities to the finished product, is put directly into the open mold cavity The mold is then closed, pressing down on the plastic and causing it to flow throughout the mold. It is while the heated mold is closed that the thermosetting material undergoes a chemical change which permanently hardens it into the shape of the mold. The three compression molding factors - pressure, temperature and time the mold is closed -vary with the design of the finished article and the material being molded.
Extrusion xtrusion molding is the method employed to o m thermoplastic materials into continuous Ef sheeting, film, tubes, rods, profile shapes, and
filaments, and to coat wire, cable and cord.
In extrusion, dry plastic material is first loaded into a hopper, then fed into a long heating chamber through which it is moved by the action of a continuously revolving screw At the end of the heating chamber the molten plastic is forced out through a small opening or die with the shape desired in the finished product. As the plastic extrusion comes from the die, it is fed onto a conveyor belt where it is cooled, most frequently by blowers or by immersion in water.
In the case of wire and cable coating, the thermoplastic is extruded around a continuing length of wire or cable which, like the plastic, passes through the extruder die. The coated wire is wound on drums after cooling.
In the production of wide film or sheeting, the plastic is extruded in the form of a tube. This tube may be split as it comes from the die and then stretched and thinned to the dimensions desired in the finished film.
In a different process, the extruded tubing is inflated as it comes from the die, the degree of inflation of the tubing regulating the thickness of the final film.

Injection Molding Machinery (numberofunits)
Clamp Force (Tons) 1991‘ 1992 1993’ 1994 1995 -
0-99 . . . . . . . . . . . . . . . . . . . . . . . . . . . . 390 526 590 746 740 100-199 . . . . . . . . . . . . . . . . . . . . . . . . . 286 344 426 495 487 200-299 . . . . . . . . . . . . . . . . . . . . . . . . . 195 175 242 320 369 300-399 . . . . . . . . . . . . . . . . . . . . . . . . . 193 237 237 289 315 400-499 . . . . . . . . . . . . . . . . . . . . . . . . . 185 159 178 23 7 245 500-599 . . . . . . . . . . . . . . . . . . . . . . . . . 144 145 197 217 238 600-749 . . . . . . . . . . . . . . . . . . . . . . . . . . 98 99 121 191 193 750-1,199 . . . . . . . . . . . . . . . . . . . . . . . . 70 101 136 165 181 1,200 and over . . . . . . . . . . . . . . . . . . . . 4 7 45 71 97 107
Total. . . . . . . . . . . . . . . . . . . . . . . . . . . . 1,611 1,831 2,198 2,757 2,875
’ Total includes three machines not differentiated by clamp force; therefore sum of clamp force categories will not equal total. ?Revised from 1994 edition of Facts & Figurer. Note: Includes domeslic shipments and exports.
Single Screw Extrusion Machinery (number of units)
Screw Diameter
Up to But Not Including. . . . . . . . . 2 ” . . 2” Up to But Not Including. . . . 2 1/2” . . 2 1/2” Up to But Not Including. . . . 3” . . 3” Up to But Not Including. . . . . . . 4” . . 4 Up to But Not Including. . . . 5 1/2” . . 5 1/2” Up to But Not Including. 7 1/2” . . Includes 7 1/2” & Larger . . . . . . . . . . . . .
19911 1992 1993 1994 1995
. . 115 137 D(1)
. . . 99 158 338
. .280** 223** 260
. ,204 219 279
. . 161 139 152
. . . 59 D D
. . . 27 76 84
D(1) 295 252 332 188
D 107
D(1) 345 294 315 214
D 152
Total . . . . . . . . . . . . . . . . . . . . . . . . . . . . . . 952 952 1,113 1,174 1,320
’ Total includes seven machmes not differentiated by screw diameter; therefore sum of screw diameter categories will not equal total * Includes exports from all diameters 2’ up to V * * Includes exports from screw diameters 2’ up to but not including 2 l i 2 , D = Disclosure. Amount included in larger D(1) = Disclosure. Amount included in screw diameters 2’ up to but not including 2 I n ” . Note: Includes domestic shipments and exports.
Source: SPI Machinery Division


Additive Lubricants These materials are added to plastics to assist flow in calendering, molding and extrusion by lubricating the metal surfaces in contact with the plastic. They also assist in knitting and wetting of the resin in mixing and milling operations. To be effective, lubricants must be compatible with the resins in which they are used, must not adversely affect the properties of end-products, and must be easily combined.
Examples: stearic acid, waxes, fatty acid esters, fatty acid amines.
Antioxidants They inhibit the oxidation of materials exposed to air or oxygen at normal or elevated tempeiatures. They are used in plastics that are subject to oxidative degradation, such as polyolefins, ABS, polystyrene, acetal and polyphenylene oxide.
Examples: alkylated phenols, amines, organic phosphites and phosphates, esters.
Ant is ta ts Chemicals which impart a slight to moderate degree of electrical conductivity to plastics compounds, thus preventing the accumu- lation of electrostatic charges on finished articles. They may be incorporated in the material before molding, or applied to their surfaces after molding. They function either by being inherently conductive or by absorbing moisture from the air.
Blowing Agents (Foaming Agents) Substances which alone or in combination with other substances are capable of producing a cellular strncture in a plastic or rubber mass. Thus, the term includes compressed gases which expand when pressure is released, soluble solids that leave pores when leached out, liquids that develop cells when they change to gases, and chemical agents that decompose or react under the influence of heat to form a gas.
Examples: azodicarbonamide, modified azos, OBSH, HTBA.
Colorants Dyes or pigments which impart color to plastics. The dyes are synthetic or natural compounds of submicroscopic or molecular size, soluble in most common solvents, yielding perfectly transparent colors. The pigments are organic and inorganic substances with larger particle sizes and usually insoluble in the common solvents. Colorants are added to plastics by dry coloring (tumbling the colorant with the base or compounded resin); by extrusion coloring (extruding a dry colored mixture and chopping it into pellets to be reprocessed); by masterbatching; or by stirring colorants or dispersions thereof into liquid plastisols or resin systems.
Examples: titanium dioxide, iron oxides, anthraquinones, carbon black.
Examples: quaternary ammonium compounds, anionics, amines.

Flame Retardants Materials that reduce the tendency of plastic articles to burn. They are usually incorporated as additives during compounding, but sometimes are applied to surfaces of finished articles.
Examples: antimony trioxide, chlorinated paraffins, bromophenols.
Heat Stabilizers Agents used in compounding some plastics to assist in maintaining the physical and chemical properties of the compounded materials at suitable values throughout the processing and service life of the material and/or the parts made therefrom. They protect plastics from effects caused by heat, such as changes in color, decrease in mechanical and electrical properties, and undesirable surface properties.
Examples: lead, barium-cadmium, tin, calcium-zinc.
Organic Peroxides Thermally decomposable compounds that can initiate polymerization reactions and effect cross-linking upon decomposition. The rate of decomposition can be controlled by means of promoters or accelerators added to the system to increase the decomposition rate, or by inhibitors when it is desired to retard the decomposition.
Plasticizers Materials incorporated in a plastic or elastomer to increase its flexibility, workability or distensibility Most plasticizers are nonvolatile organic liquids or low-melting point solids, which function by reducing the normal intermolecular forces in a resin, thus permitting the macromolecules to slide over one another more freely
Examples: adipates, azelates, trimellitates, DOP/DIOP/DIDP
Ultraviolet Stabilizers (UV Light Absorbers) Chemical agents that absorb or screen out radiation beyond the violet end of the spectrum of visible radiations. Such radiation has sufficient energy to initiate reactions leading to the degradation of many plastics, These agents are often combined with other additives, e.g., heat stabilizers and antioxidants, with which they act in synergistic fashion.
Examples: benzophenones, benzotriazole, salicylates.
Examples: MEK peroxide, benzoyl peroxide, alkyl peroxide, peresters.

Acetal An engineering thermoplastic produced by the polymerization of purified formaldehyde [CHzO] into both homopolymer and copolymer types. Typical applications are found in consumer products, automotive parts, and industrial machinery parts.
Acrvlics I
A family of thermoplastic resins of acrylic esters [CH2CHCOOR] or methacrylic esters [CH~C(CHI)COOR]. The acrylates may be methyl, ethyl, butyl, or 2-ethylhexyl. Usual methacrylates are the methyl, ethyl, butyl, laural and stearyl. Typical applications are found in lighting fixtures, glazing and automotive parts.
Acrylonitrile Butadiene Stvrene
I A class of thermoplastic terpolymers including a range of resins, all prepared with usually more than 50% styrene [CeHsCHCHZI and valylng amounts of acrylonitrile [CHLHCN] and butadiene [CHLHCHCHl] . The three components are combined by a variety of methods involving polymerization, graft copolymerization, physical mixtures and combinations thereof. Typical applications are found in appliances, automotive parts, pipe, business machine and telephone components.
Alkyds 1
Thermosetting unsaturated polyester resins produced by reacting an organic alcohol with an organic acid, dissolved in and reacted with unsaturated monomers such as styrene
[C~H~CHCHZ], diallyl phthalate [C6H4(COOCH2CHCHd21, diacetone acrylamide [CHLOCHL(CHI)LHCHCONH~] or vinyl toluene [CHLHC6H+CH2]. Typical applications are found in electrical uses, automotive parts, and as coatings.
Cellulosics A family of thermoplastic resins manufactured by chemical modification of cellulose [(GHIoO,)~]. Included are: cellophane- regenerated cellulose made by mixing cellulose xanthate [ROCSSH] with a dilute sodium hydroxide [NaOH] solution to form a viscose, then extruding the viscose into an acid bath for regeneration; cellulose acetate- an acetic acid ester [CHCOOC2H5] of cellulose; cellulose acetate butyrate-a mixed ester produced by treating fibrous cellulose with butync acid [CHCHzCHLOOH], butync anhydride [ (CHLH~CHICO)~~] , acetic acid [CHLOOH] and acetic anhydride [(CH3CO)20] in the presence of sulfuric acid [H&04] ; cellulose propionate- formed by treating fibrous cellulose with propionic acid [CH~CH~COIH] and acetic acid and anhydrides in the presence of sulfuric acid cellulose nitrate-made by treating fibrous cellulosic materials with a mixture of nitric [HNOI] and sulfuric acids. Typical applications are found in packaging, consumer products, and automotive parts.
Coumarone-Indene Thermoplastic resin obtained by heating mixtures of coumarone [CBH~O] and indene [C~HLHICHCH] with sulfuric acid [H~SOI] to promote polymerization. These resins have no commercial applications when used alone.

They are used primarily as processing aids, extenders and plasticizers with other resins in asphalt floor tile.
Diallyl Phthalate (DAP) The term DAP is used both for the monomeric and polymeric forms. The monomer [CsH+(COOCHCHCH2)2] is used as a cross-linking agent in unsaturated polyester resins. As a polymer, it is used in the production of thermosetting molding powders, casting resins and laminates.
Thermosetting resins that, in the uncured form, contain one or more reactive epoxide or oxirane groups.
1
These epoxide groups serve as cross-linking points in the subsequent curing step, in which the uncured epoxy is reacted with a curing agent or hardener. Cross-linking is accomplished through the epoxide groups as well as through hydroxyl groups that may be present. Most conventional unmodified epoxy resins are produced from epichlorohydrin (chloropropylene oxide) [CHzOCHCHLlI and bisphenol A [(CH~)L(C~HIOH)~]. The other types of epoxy resins are phenoxy resins, novolac resins, and cycloaliphatic resins. Epoxy resins are used as protective coatings, bonding adhesives, in building and construction, and for electrical , and many other uses.
Fluoropolymer A family of thermoplastic resins analogous to polyethylene in which some of the hydrogen atoms attached to the carbon chain are replaced by fluorine or fluorinated alkyl groups. In some cases, other halogens such as chlorine are also part of the molecule. The most common commercial fluoropolymers are: FEP (fluorinated ethylene-propylene) from tetrafluoroethylene [C2F+] and hexa- fluoropropylene [C~FS] ; PTFE (polytetra fluoroethylene) from the polymerization of tetrafluoroethylene and ethylene [GH4] ; PFA (perfluoroalkoxy) from tetrafluoroethylene and perfluoropropyl vinyl ether [C~HIC~OF~]; PCTFE (polychlorotrifluoro-ethylene) from chlorotrifluoro-ethylene monomer [C2hCI] ; CTFE-VDF (polychlorotrifluoroethylene- vinylidene fluoride) from chlorotnfluoro- ethylene and vinylidene fluoride [C~H~FZ]; E-CTFE (polyethylenechlorotrifluoroethylene) from chlorotrifluoroethylene and ethylene; PVDF (polyvmylidene fluoride) from vinylidene fluoride monomer; and PVF (polyvinyl fluoride) from vinyl fluoride monomer [CZH~F]. Typical applications for fluoropolymers are found in electrical/ electronic uses and pipe and chemical processing equipment.
Melamine-Formalde hy de Thermosetting resins formed by the condensation reaction of formaldehyde [HCHO] and melamine [C,N,(NHh], The chemistry is analogous to that of ureafonnaldehyde except that the three amino groups of melamine provide more possibilities for cross-linking, are more highly reactive, and all six hydrogen atoms of melamine will react, forming the hexamethyl compound. Typical applications are found in bonding and adhesives, coatings, and consumer products.

Nitrile Resins Thermoplastic resins composed of acrylonitrile [CHLHCN] along with comonomer such as acvlates, methacvlates, butadiene [CHzCHCHCHl] and styrene [C6H5CHCH2]. Both straight copolymers and copolymers grafted onto elastomeric backbones are available. The unique property of these materials is outstanding resistance to passage of gases and water vapor, making them useful in packaging applications.
Nylon A generic name for a family of long-chain polyamide engineering thermoplastics which have recurring amide groups [-CO-NH-I as an integral part of the main polymer chain. Nylons are synthesized from intermediates such as dicarboxylic acids, diamines, amino acids and lactams, and are identified by numbers denoting the number of carbon atoms in the polymer chain derived from specific constituents, those from the diamine being given first. The second number, if used, denotes the number of carbon atoms derived from a diacid. Commercial nylons are as follows: nylon 4 (po1ypyrrolidone)-a polymer of 2-pyrrolidone [CHLHICH~C(O)NH]; nylon 6 (po1ycaprolactam)-made by the polycondensation of caprolactam [CHI(CH&NHCO] ; nylon 6/6-made by condensing hexamethylenediamine [HzN(CH~)SNH~] with adipic acid [COOH(CHi)~COOHl; nylon 6/10-made by condensing hexamethylenediamine with sebacic acid[COOH(CH2)8COOH] ; nylon 6/12-made from hexamethylenediamine and a 12-carbon dibasic acid; nylon 11-produced by polycondensation of the monomer I 1-amino-undecanoic acid [NHzCH~(CH&COOH]; nylon 12-made by the polymerization of laurolactam [CHI(CH~]~OCO)~~ cyclododecalactam, with
11 methylene units between the linking -NH- CO- groups in the polymer chain. Typical applications for nylons are found in automotive parts, electrical/electronic uses, and packaging.
Petroleum Resins Thermoplastic resins obtained from a variable mixture unsaturated monomers recovered as byproduct from cracked and distilled petroleum streams. They also contain indene [C6H+CH2CHCH], which is copolymerized with a variety of other monomers including styrene [CeHLHCH2], vinyl toluene [CHLHC6HLH,], and methyl indene [C~WCHLHICHCH], Typical applications are found in adhesives, printing inks, rubber compounding, and surface coatings.
Phenolic These thermosetting resins are credited with being the first commercialized wholly synthetic polymer or plastic. The basic raw materials are formaldehyde [HCHO] and phenol [C6HsOH], although almost any reactive phenol or aldehyde can be used. The phenols used commercially are phenol, cresols [CH3CaH40H], xylenols [ (CH~)2C6H,OHII p-t-butylphenol [C+H&H+OHl, p-phenylphenol [CsH&H+OHI, bisphenols [(CaH4OH)2], and resorcinol [C6H4(0H)>], The aldehydes used are formaldehyde and furfural [C4H,OCHO]. In the uncured and semi- cured condition, phenolic resins are used as adhesives, casting resins, potting compounds, and laminating resins. As molding powders, phenolic resins can found in electrical uses.
Polvamide-Imide I
Engineering thermoplastic resins produced by the condensation reaction of trimellitic anhydride [occ6H~c,O,] and various
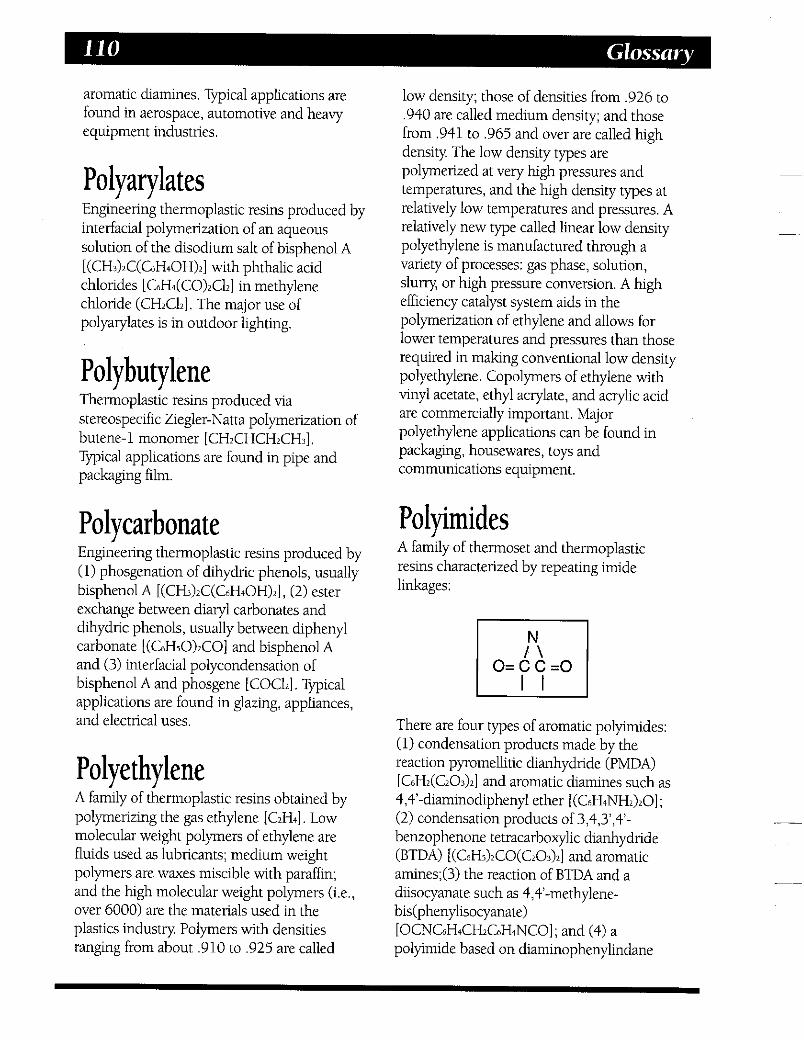
aromatic diamines. Typical applications are found in aerospace, automotive and heavy equipment industries.
Polyar ylates Engineering thermoplastic resins produced by interfacial polymerization of an aqueous solution of the disodium salt of bisphenol A [(CHI)L(C~HIOH)~I with phthalic acid chlorides [C~H~(CO)*CLI in methylene chloride (CHICL]. The major use of polyarylates is in outdoor lighting.
Polvbu tvlene I I
Thermoplastic resins produced via stereospecific Ziegler-Natta polymerization of butene-1 monomer [CH~CHCHICH~]. Typical applications are found in pipe and packaging film.
Polycarbonate Engineering thermoplastic resins produced by (1) phosgenation of dihydric phenols, usually bisphenol A [(CH?)IC(C~H~OH)II, (2) ester exchange between diary1 carbonates and dihydric phenols, usually between diphenyl carbonate [(C,H,O)LOl and bisphenol A and (3) interfacial polycondensation of bisphenol A and phosgene [COCLI. Typical applications are found in glazing, appliances, and electrical uses.
Polyethylene A family of thermoplastic resins obtained by polymerizing the gas ethylene IC2H4]. Low molecular weight polymers of ethylene are fluids used as lubricants; medium weight polymers are waxes miscible with paraffin; and the high molecular weight polymers ( i t . , over 6000) are the materials used in the plastics industry. Polymers with densities ranging from about ,910 to ,925 are called
low density; those of densities from ,926 to ,940 are called medium density; and those from ,941 to ,965 and over are called high density The low density types are polymerized at very high pressures and temperatures, and the high density types at relatively low temperatures and pressures. A relatively new type called linear low density polyethylene is manufactured through a variety of processes: gas phase, solution, slurry or high pressure conversion. A high efficiency catalyst system aids in the polymerization of ethylene and allows for lower temperatures and pressures than those required in making conventional low density polyethylene. Copolymers of ethylene with vinyl acetate, ethyl acrylate, and acrylic acid are commercially important. Major polyethylene applications can be found in packaging, housewares, toys and communications equipment.
Polyimides A family of thermoset and thermoplastic resins characterized by repeating imide linkages:
There are four types of aromatic polyimides: (1) condensation products made by the reaction pyromellitic dianhydride (PMDA) [CtiH*(CzO32] and aromatic diamines such as 4,4'-diaminodiphenyl ether [(CnH4NH&O] ; (2) condensation products of 3,4,3',4'- benzophenone tetracarboxylic dianhydride (BTDA) [(CtiH,)LO(CzO3)2] and aromatic amines;(3) the reaction of BTDA and a diisocyanate such as 4,4'-methylene- bis(pheny1isocyanate) [OCNCaHCH*CaH+NCOl; and (4) a polyimide based on diaminophenylindane

and a dicarboxylic anhydride such as carbonyldiphthalic anhydride [OC,H,(CO)2COC,HiC0)21. Thermoset polyimides are produced in condensation polymers that possess reactive terminal groups capable of subsequent cross-linking through an addition reaction. Typical applications for thermoplastic and thermosetting polyimides are transportation and electronics.
Polyphenylene Oxide, Modified Engineering thermoplastic resins produced by the oxidative coupling of 2, 6-dimethylphenol [(CH,)zC6H,OH] (xylenol), then blended with impact polystyrene. T%ical applications are found in electricaVelectronic uses, business machine parts, appliances, and automotive parts.
Polyphenylene Sulfide Engineering thermoplastic resins produced by the reaction of p-dichlorobenzene [C~H~CIZ] with sodium sulfide [NazS]. The major use for polyphenylene sulfide is in electrical/ electronic parts and automotive parts.
Polypropylene Thermoplastic resins made by polymerizing propylene [CHLHCHz] and in the case of copolymers with monomers, with suitable catalysts, generally aluminum alkyl and titanium tetrachloride mixed with solvents. The monomer unit in polypropylene is asymmetric and can assume two regular geometric arrangements isotactic, with all methyl groups aligned on the same side of the chain, or syndiotactic, with the methyl groups alternating. All other forms, where this positioning is random, are called atactic. Commercial polypropylene contains 90-97% crystalline or isotactic PP with the remainder
being atactic. Most processes remove excess atactic PP This by-product is used in adhesives, caulks, and cablefilling compounds. Major applications of commercial PP are found in packaging, automotive, appliance and carpeting markets.
Polystyrene -
High molecular weight thermoplastic resins produced generally by the free-radical polymerization of styrene monomer [CaH5CHCH2] which can be initiated by heating alone but more effectively by heating in the presence of free-radical initiator (such as benzoyl peroxide [(C~HLO)ZOZ]. Typical processing techniques are modified mass polymerization or solution polymerization, suspension polymerization, and expandable beads. Major markets for polystyrene are in consumer and institutional products, electricaVelectronic uses, and building/ construction.
Polvure thanes I
A large family of polymers based on the reaction product of an organic isocyanate with compounds containing a hydroxyl group. The commonly used isocyanates are toluene diisocyanate (TDI) [CHJC~H~(NCO)II, methylene diphenyl isocyanate (MDI) [OCNCaH,CH2C6H+NCO], and polymeric isocyanates (PMDI), obtained by the phosgenation of polyamines derived from the condensation of aniline [GH>NH2] with formaldehyde (HCHO]. Polyols (with hydroxyl groups) are macroglycols which are either polyester or polyether based. Polyurethane elastomers and resins take the form of liquid castings systems thermoplastic elastomers and resins, microcellular products, and millible gums. Typical applications are found in the automotive industry. Polyure- thane foams are widely used in transpor- tation, furniture, and construction markets.
-
__

Polyvinyl Acetate (PVAc) & Other Vinyls Polyvmyl acetate is a thermoplastic resin produced by the polymerization of vinyl acetate monomer [CHiCOOCHCHl] in water producing an emulsion with a solids content of 50-55%. Most polyvlnyl acetate emulsions contain co-monomers such as n-butyl acrylate, 2-ethyl hexyl acrylate, ethylene, dibutyl maleate and dibutyl fumarate. Polymerization of vinyl acetate with ethylene also can be used to produce solid vinyl acetatelethylene copolymers with more than 50% vinyl acetate content. Polyvinyl alcohol (PVOH) is produced by methanolysis or hydrolysis of polyvlnyl acetates. The reaction can be controlled to produce any degree of replacement of acetate groups. Co-polymers of replaced acetate groupings and other monomers such as ethylene and acrylate esters are commercially important. Polyvinyl, butyral (PK3) is made by reacting PVOH with butyraldehyde [CH~(CHz)LHO]. Polyvmyl formal is made by condensing formaldehyde [HCHO] in presence of PVOH or by the simultaneous hydrolysis and acetylization of PVAc. Polyvinylidene chloride is made by the polymerization of 1,l-dichloroethylene [CHLCL]. Typical applications for the above resins are found in adhesives, paints, coatings and finishes, and packaging.
Polvvinvl Chloride I J
Thermoplastic resins produced by the polymerization of the gas vinyl chloride [CHLHCl] . Under pressure, vinyl chloride becomes liquefied and is polymerized by one of four basic processes: suspension, emulsion, bulk, or solution polymerization. The pure polymer is hard, brittle and difficult to process, but it becomes flexible when plasticizers are added. A special class of PVC resin of fine particle size, often called dispersion grade resin, can be dispersed in
liquid plasticizers to form plastisols. The addition of a volatile diluent or a solvent to the plastisol produces an organosol. Copolymers with vinyl acetate, vinylidene chloride, and maleate and fumarate esters find commercial application. Major markets for PVC are in building/construction, packaging, consumer and institutional products, and electricaVelectronic uses.
Styrene Acrylonitrile Thermoplastic copolymers of styrene [C~HSCHCH~] and acrylonitrile [CHLHCN] . SAN resins are random, amorphous copoly- mers produced by emulsion, suspension, or continuous mass polymerization. Typical uses include automobile instrument lenses and housewares.
Styrene Butadiene Latexes & Other Styrene Copolymers Styrene butadiene latexes usually have a resin content of about 50%. The styrenehutadiene ratio vanes from 54:46 to 80:20. Most are carboxylated by the use of such acids as maleic [HOOCCHCHCOO], fumaric .~ [HOOCCHCHCOOH], acrylic [CHLHCOOH] , or methacrylic [CHZC(CH3)COOH]. Two types of styrene- maleic anhydride (SMA) [(COCH)20] are available: SMA copolymers, with and without rubber impact modifier (e.g., DYLARKB) and SMA terpolymer alloys (e.g., CADONB). K- Resina is a solid styrenebutadiene copolymer resin. Acrylic monomers are also used in conjunction with styrene (or styrene plus other monomers) to produce specialty resins. For example, there are transparent terpolymers of methyl methacrylate, butadiene, and styrene (MBS), and others of acrylonitrile, an acrylic monomer, and styrene (AAS). Ion-exchange resins or

divinylbenzene-modified polystyrene are another variation. SB latexes are used in carpet backing and paper coatings. The other styrenics are used in paints, coatings, and floor polishes, plus many other uses.
Sulfone Polymers A family of engineering thermoplastic resins characterized by the sulfone [SO21 group. Polysulfone is made by the reaction of the disodium salt of bisphenol
dichlorodiphenyl sulfone 4,4'-DCDPS [(CbHiC1)2SO2]. Polyethersulfone is made by the reaction of 4,4'-DCDPS with potassium hydroxide [KOH] . Polyphenylsulfone is similar to the other sulfone polymers. Typical applications for sulfone polymers are found in electricaVelectronic uses and automotive parts.
A[(CH~)~C(C~HIOH)I] with 4,4'-
Thermoplastic Polyester (Saturated) A family of polyesters in which the polyester backbones are saturated and hence unreactive. The most common commercial types are: PET (polyethylene terephthalate) produced by polycondensation of ethylene glycol [CHIOHCH~OH] with either dimethyl terephthalate (DMT) [CsH+(COOCH,)z] or terephthalic acid (TPA) [CeH4(COOH)>]; and PBT (polybutylene terephthalate) produced by the reaction of DMT with 1,4 butanediol [HO(CHI)~OH], Typical applications are found in packaging, automotive, electrical, and consumer markets.
Unsaturated Polyester Thermosetting resins made by the condensation reaction between difunctional acids and glycols. The resulting polymer is then dissolved in styrene [C~HTCHCH~] or other vinyl unsaturated monomer. The structures of the acids and glycols used and their proportions, especially the ratio of the unsaturated versus the saturated acid, and the type and amount of monomer used, are all tailored for each resin to balance economy, processing characteristics, and performance properties. One common formulation is the reaction of maleic anhydride [(COCH)zOl, phthalic anhydride [C,H+(CO)iO], and propylene glycol [CH?CHOHCHzOHl. Both dicyclopentadiene [CIOHU] and isophthalic acid [C6H+(COOH)z] can be substituted for phthalic anhydride. Vinyl ester resins are linear reaction products of bisphenol A [(CH3)L(C6H40H)z] and epichlorohydrin [CHZOCHCHZCI] that are terminated with an unsaturated acid such as methacrylic acid [CHL(CH?)COOH]. Typical applications are found in transportation, appliances, electrical, and construction markets.
Urea-Formaldehy de Formed by the condensation reaction of formaldehyde [HCHO] and urea [CO(NH$*]. These thermoset resins are clear water-white syrups or white powered materials which can be dispersed in water to form colorless syrups. They cure at elevated temperatures with appropriate catalysts. Molding powders are made by adding fillers to the uncured syrups, forming a consistency suitable for compression and transfer molding. The liquid and dried resins find extensive uses in laminates and chemically resistant coatings. The molding compounds are formed into rigid electrical and decorative products.
Sources: Chemical Economics Handbook, SRl Intemalional, Modem Plastics Encyclopedia Whmngton's Dictionary, The Condensed Chemical Dictionary.

Ablation The degradation and decomposition of a material caused by high heat friction.
Abrasion Resistance Ability to resist surface wear.
4% The effect, on materials, of exposure to an environment for an interval of time.
ARC Resistance The total time in seconds that intermittent arc may play across a plastic surface without rendering the surface conductive.
Bleeding The diffusion of color out of a plastic part into the surrounding surface of the part.
Blocking The adhesion between touching layers of plastic, such as that which may develop under pressure during storage or use.
Bloom A visible exudation or efflorescence on the surface of a plastic; bloom can be caused by lubricant, plasticizer, etc.
Brittle Point The highest temperature at which an elastomer fractures in a prescribed impact test procedure.
Brittle Temperature The lowest temperature at which a plastic material withstands given conditions without failure.
Buckling Crimping of the fibers in a composite material, often occurring in glass-reinforced
thermosets due to resin shrinkage during cure.
Bulk Density The density of a molding material in loose form (granular, nodular, etc.) expressed as a ratio of weight to volume.
Bulk Factor The ratio of the volume of a molding compound or powdered plastic to the volume of the solid piece produced from it,
Coefficient of Expansion The fractional change in dimension of a material for a unit change in temperature.
Coefficient of Friction A measure of the resistance to sliding of one surface in contact with another surface.
Coefficient of Linear Expansion A measure of the change in dimension of an object caused by a change in temperature; specifically measured by the increase in length of an object per unit degree in temperature.
Coefficient of Thermal Expansion The change in volume per unit volume produced by a one degree rise in temperature.
Conduction The transference of heat or electricity through a substance.
Conductivity The property of a substance that describes its ability to transfer heat or electricity It is the reverse of resistivity

Compression Strength The ability of a material to resist a force that tends to crush.
Corrosion Resistance The ability of a material to withstand contact with ambient natural factors or those of a particular artificially created atmosphere.
Crack An actual separation of molded material, visible on opposite surfaces of the part, and extending through the thickness; a fracture.
Crazing Fine cracks which may extend in a network on or under the surface of a plastic material.
Creep The change in dimension of a plastic under load over a period of time, not including the initial instantaneous elastic deformation.
Cross-Linking Applied to polymer molecules, the setting- up of chemical links between the molecular chains. When extensive, as in most thermosetting resins, cross-linking makes one infusible supermolecule of all the chains.
Deflection Temperature Under Load The temperature at which a simple beam has deflected a given amount under load (formerly called heat distortion temperature).
Deformation Any change of form or shape in a body; the linear change of dimension of a body in a given direction produced by the action of external forces.
Degradation A deleterious change in the chemical structure of a plastic.
Deterioration A permanent change in the physical properties of a plastic evidenced by impairment of these properties.
Dimensional Stability Ability of a plastic part to retain the precise shape to which it was molded, cast, or otherwise fabricated.
Discoloration Any change from an initial color possessed by a plastic; a lack of uniformity in color where color should be uniform over the whole area of a plastic object.
Elasticity That property of plastics materials by virtue of which they tend to recover their original size and shape after deformation.
Elastomeric The property of a material which at room temperature can be stretihed under low stress to at least twice its original length and, upon immediate release of the stress, will retum with force to its approximate original length.
Electrical Strength [Dielectric Strength] The property of an insulating material that enables it to withstand electric stress; the highest electric stress that an insulating material can withstand for a specified time without the occurrence of electrical breakdown by any path through its bulk.
Elongation Deformation caused by stretch the fractional increase in length of a material stressed in tension.

Environmental Stress Cracking The susceptibility of a thermoplastic resin to crack or craze when in the presence of surface active agents or other environments.
Extensibility The ability of a material to extend or elongate upon application of sufficient force, expressed as a percent of the original length.
Exudation The formation in liquid form of a plasticizer on the surface of a plasticized resin.
Fading Any lightening of an initial color possessed by a plastic; measured by accelerating the process by subjecting the plastic to high intensity ultraviolet rays of approximately the same wave length as those found in sunlight.
Fatigue The failure or decay of mechanical properties after repeated applications of stress.
Flammability Measure of the extent to which a material will support combustion.
Flex Life The time of heat-aging that an insulating material can withstand before failure when bent around a specific radius (used to evaluate thermal endurance).
Flexural Strength The resistance of a material to being broken by bending stresses.
Flow Marks Wavy surface appearance of an object molded from thermoplastic resins, caused by improper flow of the resin into the mold.
Fracture The breaking of a hard substance; crack.
Gel Point The stage at which a liquid begins to exhibit pseudoelastic properties. Also known as “gel-time.”
Glass Transition Temperature The center of the temperature range in which a noncrystalline solid changes from being glass-brittle to being viscous.
Gloss Brightness or luster of a plastic resulting from a smooth surface.
Haze Cloudy appearance within, or on the surface of, a plastic.
Heat Distortion Point The temperature at which a standard test bar deflects under a stated load.
Heat Resistance The property or ability of plastics and elastomers to resist the deteriorating effects of elevated temperatures.
Hydrolysis Chemical decomposition of a substance involving the addition of water.
Hydrophilic
Hydrophobic
Hygroscopic
Capable of absorbing water.
Capable of repelling water.
Capable of adsorbing and retaining atmospheric moisture.
Impact Strength The ability of a material to withstand shock loading.

Lack of Fillout An area, occurring usually at the edge of a laminated plastic, where the reinforce- ment has not been wetted with resin.
Melt Index The amount, in grams, of a thermoplastic resin which can be forced through a 0.0825 inch orifice when subjected to 2160 grams force in 10 minutes.
Melt Strength The strength of a plastic while in the molten state.
Melting Point The temperature at which a resin changes from a solid to a liquid.
Migration The transfer of a material from a plastic body to other contacting solids.
Moisture Absorption The pick-up of water vapor from air by a material. It relates only to vapor withdrawn from the air by a material and must be distinguished from water absorption, which is the gain in weight due to the take-up of water by immersion.
Mottle The desired or accidental mixture of colors or shades of a color giving more or less distinct or complicated patterns or specks, spots, or streaks of color; any irregular imperfections on the surface.
Necking The localized reduction in cross-section which may occur in a material under tensile stress.
Opalescence The limited clarity of vision through a sheet of transparent plastic at any angle, because of diffusion within or on the surface of the plastic.
Optical Distortion Any apparent alteration of the geometric pattern of an object when seen through a plastic or as reflection from a plastic surface.
Oxidation The chemical reaction involving the process of combining with oxygen to form an oxide; the deterioration of an adhesive film due to atmospheric exposure; the breakdown of a hot melt adhesive due to prolonged heating and oxide formation.
Pit Small regular or irregular crater in the surface of a plastic, usually with width approximately of the same order of magnitude as its depth.
Plasticity A property of plastics that allows the material to be deformed continuously and permanently without rupture upon the application of a force that exceeds the yield value of the material. (The opposite of "elasticity.")
Shearing Breaking caused by the action of equal and opposed forces located in the same plane.
Specific Gravity The ratio of the weight of any volume of a substance to the weight of an equal volume of another substance taken as standard at a constant or stated temperature. Solids and liquids are usually compared.
Specific Heat The quantity of heat required to raise the temperature of a unit mass of a substance one (1) degree under specified conditions.
Stress-Crack External or internal cracks in a plastic caused by tensile stresses less than that of its short-time mechanical strength.

Sweating Exudation of small drops of liquid, usually a plasticizer or softener, on the surface of a plastic part.
Swell A dimensional increase caused by exposure to liquids andlor vapors.
Tear Resistance The force required to tear completely across a notched specimen tested according to prescribed procedures, expressed in pounds per inch of specimen thickness.
Tensile Strength or Stress The maximum tensile load per unit area of original cross section, within the gauge boundaries, sustained by the specimen during a tension test.
Thermal Conductivity
Thermoelasticity
The ability of a material to conduct heat.
Rubber-like elasticity exhibited by a rigid plastic and resulting from an increase in temperature.
Thermoplasticity The ability of a material to he deformed without breaking with a relatively fast flow, when (at a suitable temperature) this material is properly stressed.
Tunneling A condition occurring in incompletely bonded laminates, characterized by release of longitudinal portions of the substrate and deformation of these portions to form tunnel-like structures.
Viscosity The property of resistance to flow exhibited within the body of a material, expressed in terms of relationship between applied shearing stress and resulting rate of strain in shear.
Weathering The exposure of plastics outdoors.


L

Business Consulting Groups and Publishers Arthur D. Little, Inc. - 15 Acorn Park,?ambridge, k 4 02140-2301 - 617/498-5000 Battelle Columbus Laboratories - 505 King Ave., Columbus, OH 43201-2696 - 614/424-6533 Bonner 61 Moore Marketing consultants - 2727 Allen Pkwy, Houston, TX 77019-21 15 - 713/522-6800 Business Communications Co., Inc. - 25 Van Zant St., Norwalk, CT 06855-1713 - 203/8534266 CB Consultants - 21 Richard Street, South Portland, ME 04106 - 207/799-2707 CMAI - 11757 Katy F y , Suite 750, Houston, TX 77079 - 281/531-4660 CPI Consulting Associates, Inc. - 244 Westchester Ave., White Plains, NY 10604 - 914/949-4402 Charles Rverhociates -John Hancock Tower, 200 Clarendon St., Boston, MA 021 16-5021 - 617/425-3000 Chem Systems Inc. - 303 S. Broadway, Tarrytown, NY 10591-5410 - 914/631-2828 Chemical Data, Inc. - 2900 N. Loop West, Suite 830, Houston, TX 77092-8841 - 713/683-3900 Chemical Market Resources - 1120 NASA Road, Suite 340, Houston, TX 77058-3320 - 281D33-3313 Composite Services COT. - 59 Delmar Avenue - Suite 404, Cresskill, NJ - 201/871-2108 DRI/McGraw-Hill - 24 Hartwell Ave., Lexington, MA 02173-3103 - 617/863-5100 Dewitt &Company Inc. - #120 N. Atrium, 16800 Greenspoint Park, Houston, TX 77060 - 281/774-7200 Eldib Engineering & Research, Inc. ~ 613 Springfield Ave., Berkeley Heights, NJ 07922-1012 - 908/464-2244 Franklin Associates, Ltd. - 4121 W 83rd Street, Prairie Village, KS 66208 - 913/649-2225 The Freedonia Group, Inc. - 3570 Warrensville Center Road, Suite 201, Cleveland, OH 44122 - 216/921-6800 Frost & Sullivan, Inc. - 90 West St., Suite 1301, NewYork, NY 10006 - 212/964-7000 Hull & Company - 5 Oak Street, PO. Box 4250, Greenwich, CT 06830 - 203/622-9120 lntemational Plastics Consultants Carp - 1492 High kdge Rd., Stamford, CT 06903 - 203/968-1233 Kline & Co., Inc. - 165 Passaic Ave., Fairfield, NJ 07004 - 201/227-6262 R.M. Kossoff &Associates, Inc. - 10 Rockefeller Plaza, New York, NY 10020 - 212/246-4035 Lovell Associates - 34 Woolsey Court, Pennington, NJ 08534 - 609/737-3622 Marilyn Bakker Technology Forecast - 9 Drumlin Road, Westport, CT 06880 - 203/226-9929 Market Search, Inc. - 2727 Holland Sylvania Rd., Suite A, Toledo, OH 43615 - 419/535-7899 Mastio &Company - 802 Francis St., Saint Joseph, MO 64501-1916 - 816/364-6200 Noyes Data COT. - 369 Fairview Ave., Westwood, NJ 07675 - 201/666-2121 The Pace Consultants Inc. - 4828 Loop Central Drive 111, Houston TX 77081 - 713/669-8800 Peter Sherwood Associates, Inc. - 20 Harlem Ave., White Plains, NY 10603 - 914/761-3033 Phillip Townsend Associates - PO. Box 90327, Houston, TX 77290 - 713/873-8733 Infomation Access Co. - 362 Lakeside Dr., Foster City, CA 94404 - 415/378-5000 Probe Economics, Inc. - 358 Saw Mill Rwer Rd., PO Box 6660, Millwood, NY 10546 - 914/923-4505 Skeist Laboratories, Inc. - 375 Route 10, Whippany, NJ 07981 - 201/515-2020 Springbom laboratories, Inc. - 20 Springborn Ctr., Enfield, CT 06082 -860/749-8371 SRI International - 333 Ravenswood Ave., Menlo Park, CA 94025 - 415/326-6200 Strategc Analysis Inc. - 11 Fairlane Road, Reading, PA 19606 - 610/779-9080 Technomic Consultants, Inc. - 300 South Riverside Plaza, Suite 1940 South, Chicago, 1L 60606 - 312/876-0004 Technomic Publishing Co. - 851 New Holland Ave., Box 3535, Iancaster, PA 17604 - 717/291-5609
Government Publications Annual Survey of Manufactures - Bureau of the Census Census of Manufactures - Bureau of the Census Current Industrial Reports -Bureau of the Census Foreign Trade Reports - 1M 146 (imports), EM 545 (exports) - Bureau of the Census Guide to Census Bureau Data Files and Special Tabulations - Bureau of the Census Guide to Foreign Trade Statistics - Bureau of the Census Producer Price Indexes - Bureau of Labor Statistics

Standard Industrial Classification Manual - Office of Management and Budget Statistical Abstract of the U.S. - Department of Commerce Statistical Services of the US. Govemment - Office Management and Budget Synthetic Organic Chemicals - International Trade Commission
Newspapers
Trade Associations & Professional Organizations
Chemical Marketing Reporter - 80 Broad St., New York, NY 10004 - 212/248-4177 Joumal of Commerce - 2 World Trade Center, New York, NY 10048 - 212/837-7000
American Chemical Society - 1155 16th St., N\h! Washington, DC 20036 - 202/872-4600 Canadian Plastics Industry Association - 365 Bloor St.. East #1900, Toronto, Ontario Canada M4W 3L4 - 416/323-1883 Chemical Management & Resource Assn. - 60 Bay St., Suite 702, Staten Island, NY 10301 - 718/876-8800 Chemical Manufacturers Assn. - 1300 Wilson Blvd., Arlington, VA 22209 - 703/741-5000 Chemical Specialties Manufacturers Assn. - 1913 1 Street Nu: Washington, DC 20006 - 202/872-8110 Color Pigments Manufacturers Assn. - P 0. Box 20839, Alexandria, VA 22320-1839 - 703/684-4044 Composite Can & Tube Institute - 1630 Duke Street, Alexandria, VA 22314 - 703/549-2233 Drug, Chemical &Allied Trades Assn. - 2 Roosevelt Avenue, Suite 301, Syosset, NY 11791 - 516/496-3317 Flexible Packaging Assn. - Suite 500, 1090 Vennont Ave., NW, Washington, DC 20005 - 202/842-3880 INDA - 1700 Broadway New York, NY 10019 - 212/582-8401 Institute of Scrap Recycling Industries, Inc. - 1325 G Street, W Washington, DC 20005 - 202/466-4050 Intemational Institute of Synthetic Rubber Producers - 2077 S. Gessner Rd., Ste. 133, Houston, TX 77063 713/783-7511 International Isocyanate Institute - 119 Cherry Hill Rd., Parsipanny NJ 07054 - 201/263-7517 National Paint & Coatings Assn. - 1500 Rhode Island Ave. NW Washington, DC 20005 - 202/462-6272 Polyurethane Manufacturers Assn. - 800 Roosevelt Road, Bldg. C, Suite 20, Glen Ellyn, IL 60137-5833 - 701/858-2670 Society of Plastics Engineers - 14 Fairfield Drive, Brookfield, CT 06805 - 203/775-0471 Synthetic Organic Chemical Manufacturers Assn. - 1100 New York Avenue Nu: Suite 1090, Washington, DC 20005 202/659-0060
Trade Publications Canadian Plastics - 1450 Don Mills Road, Don Mills, Ontario M3B2X7 - 416/445-6641 Chemical Engineering - 1221 Avenue of the Americas, New York, NY 10020 - 212/512-2921 Chemical &Engineering News - 1155 16th St. , N\h! Washington, DC 20036 - 20U8724600 Chemical Week - 888 7th Avenue, 26th Floor, New York, NY 10106-2698- 212/621-4900 Injection Molding Magazine - 59 Madison Street, #770, Denver, CO 80206 - 303/321-2322 Modem Plastics - 1221 Avenue of the Americas, New York, NY 10020 - 212/512-4616 Packaging Digest - 1350 E. Touhy Avenue, Des Plaines, IL 60018 - 773/635-8800 Packaging World - 330 N. Wabash Ave., #3131, Chicago, 1L 60611-3606 - 312/222-1010 Plastics Brief - 2727 Holland Sylvania Road #A, Toledo, OH 43615 - 419/535-7899 Plastics Focus - PO. Box 814, Amherst, MA 01004 - 413/549-5020 Plastics Engineering - 14 Fairfield Drive, Brookfield Center, CT 06804 - 203/775-0471 Plastics News - 1725 Merriman Road, Akron, OH 44313 - 330/836-9180 Plastics Technology - 355 Park Avenue South, New York, NY 10010 - 212/592-6570 Plastics Week - 2727 Holland Sylvania Road #A, Toledo, OH 43615 - 419/535-7899 Plastics World - 445 Broad Hollow Rd., Melville, NY 11747 - 516/845-2700


.̂

Now you can order the most comprehensive and reliable report on the U.S. Plastics Resin Industry. Compiled on a monthly basis by Association Services Group LLC for the Committee on Resins Statistics (CRS), the SPI Monthly Statistical Repovt -Resins is the only detailed resin report on production and sales available. With over ninety-five percent of the industty participating, this report is considered the authoritative source for plastics resin data. A sample of the report follows on the next page.
Take advantage of this timely and informative source of monthly resin data by ordering today. Simply complete the order form below and mail or fax to:
The Society of the Plastics Industry, Inc. Statistical Department 1801 K Street, NW, Suite 600K Washington, DC 20006-1301 FAX (202) 293-0006
The annualfee schedule is subject to change. Please contact SPI's Statistical Department at 202l974-5200for the most current ordering and pricing information.
CATEGORY SPI MEMBER NON-MEMBER SUMMARY DATA ONLY
Internal Use Only External Use
5 50 2,750
FULL MONTHLY REPORT: Internal Use Only
-Participants (Resin companies ea. add1 copy) 400 -Nan-Participant 550
-On-line Data Bank-Reseller and Consultants 2,750 External Use
5 75 4,400
550 825
4,400
PLEASE INCLUDE $110.00 FOR FOREIGN POSTAGE WHEN APPLICABLE
ORDER FORM . . . . . . . . . . . . . . . . . . . . . . . . . . . . . . . . . . . . . . . . . . . . . . . . . . . . . . . . . . . . . . . . . . . . . . . . . . . . . . . . . . . . . . . . . . . . .
Enclosed is my payment in the amount of $ SPZ Monthly Statistical Report-Resins. Please include foreign postage when applicable.
to cover the cost of my annual subscription to the 1998
NAME: TITLE:
COMPANY:
CITY STATE: ~ ZIP: PHONE:
1 wish to pay by: 0 Check Enclosed (Payable to: SPI) 0 American Express 0 Mastercard 0 Visa
Account No.: Expiration Date:
Signature:
All INTERNAL USE orders m u ~ t sign the following acknowledgement. We acknowledge receiving the SPI Monthly Statistical Report - Resins ("the Reports") for INTERNAL USE ONLY, and agree that the Reports will not be reproduced in whole or in part. We further agree that the Reports will not be transferred, republished, resold or otherwise used for any purpose without the prior written consent of the SPI.
-
Signature


StGlIUN I - IIlU%MU>tl IINC, Ht>lN> I nc au~lic I I ur I nc rum I ilra i i v u u a I I-I I
MONTHLY STA TISTGAL REPORT (Thousands of Pounds)
7VE USE
13,598
78,802 64,367
16.192 16.598
70,920 78,299 48,747 40,291
3.2
4.9
2.6 2.6
-\
:~+Q.O
3.1'
-
13.7
592
4 : s A 5
dM~ t 8.5.
'-43.5 ib34
8:' -9.4
12.5.
4
e,
223
22.4 -2.2 -2.4 0.9
-9.4 21.0 8.9 2.6 - .-,---- - - - -
D1 = Disclosure - Captive Use. Total included in Domestic Sales, Total. '* Total industry not represented, cheCk participation listing for companies 0 = Estimate - Data include estimates for one company.
included.
Compiled By Ernst (L Young UP. Washington DC. lor SPl's CCMMllTEE ON RESIN STATISTICS (CRS)
53,33€ -
129.345 -
.~.. ~ ~ . ~ . . . ~ .... .
483,768
1,212,946
448.641 -
PAGE 3
I I

!
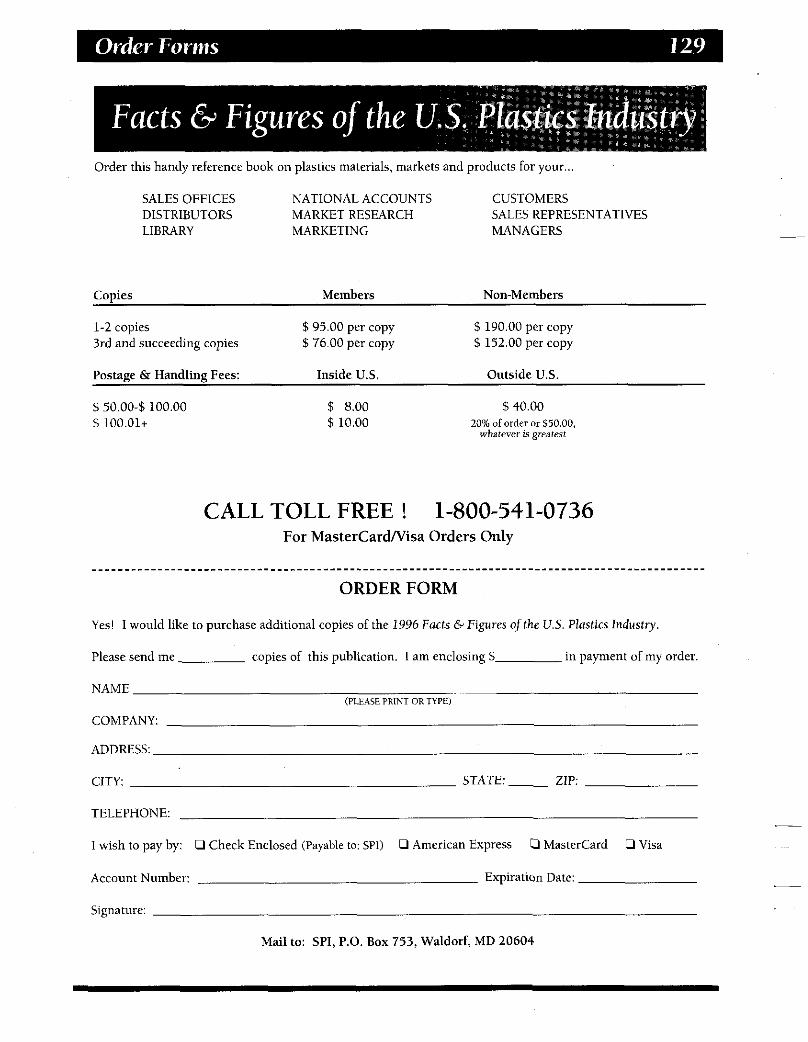
Order this handy reference book on plastics materials, markets and products for your.
SALES OFFICES NATIONAL ACCOUNTS CUSTOMERS DISTRIBUTORS MARKET RESEARCH SALES REPRESENTATIVES LIBRARY MARKETING MANAGERS
Copies Members Non-Members
1-2 copies $95.00 per copy $ 190.00 per copy 3rd and succeeding copies $ 152.00 per copy
Postage 62 Handling Fees: Inside US. Outside U S .
$76.00 per copy
$ 50.00-$ 100.00 $100.01+
5 8.00 $ 10.00
$40.00 20% of order or $50.00.
whatever is greatest
CALL TOLL FREE ! 1-800-541-0736 For MasterCardNisa Orders Only
. . . . . . . . . . . . . . . . . . . . . . . . . . . . . . . . . . . . . . . . . . . . . . . . . . . . . . . . . . . . . . . . . . . . . . . . . . . . . . . . . . . . . . . . . . . . . ORDER FORM
Yes! 1 would like to purchase additional copies of the 1996 Facts G Figures ofthe U.S. Plastics Industry.
Please send me copies of this publication. I am enclosing $
NAME
in payment of my order.
(PLEASE PRINT OR TYPE)^
COMPANY:
ADDRESS:
CITY: STATE:- ZIP:
TELEPHONE:
I wish to pay by: 0 Check Enclosed (Payable IO: SP1) 0 American Express U Mastercard 0 Visa
Account Number: Expiration Date:
Signature:
Mail to: SPI, P.O. Box 753, Waldorf, MD 20604


ABS* . . . . . . . . . . . . . . . . . . . . . .
Additives for Plastics . . . . . . . . . . Apparent Consumption Report . Benzene Resin Derivatives . . . . . Butadiene Resin Derivatives . . . . Composites (Reinforced Plastics) Consultants & Publishers . . . . . Definitions of Resins . . . . . . . . . .
Acetylene Resin Derivatives . . . .
Dollar Sales Report . . . . . . . . . . . Engineering Resins* . . . . . . . . . .
Ethylene Resin Derivatives . . . . . Extrusion Machinery . . . . . . . . .
Epoxy* . . . . . . . . . . . . . . . . . . . .
Fabricated Plastic Products . . . . . Fabrication Processes . . . . . . . . . Financial &
Operating Ratios (Processors) Glossary . . . . . . . . . . . . . . . . . . . Government Publications . . . . . Growth Trend . Resin Total .........
. 60-62 . . . . . 9 105-106 . . . . 40 . . . . 11 . . . . 10 . . . . 95 . . . 121 107-113 . . . . 39 . 64-65 . 44-45 . . . . . 7 . . . 101 . 92-96 . 86-87
. 18-19 105-118 . . . 121 ........ 35
. . . . . ......
Growth Trend . Selected Resins . . . . . 36-37 High Density Polyethylene (HDPE)* . 66-69 History of Plastics . . . . . . . . . . . . . . . . . . 1-4 Industry Flow Chart . 94
Injection Molding Machinery . . . . . . . . . 101
Polyethylene (LLDPE)* . . . . . . . . . . 72-73
Machinery Statistics . . . . . . . . . . . . . . . . 101 Major Markets . . . . . . . . . . . . . . . . . . 23-32 Major Markets Definitions . . . . . . . . . 23-25 Major Markets Resin Report . . . . . . . . 29-32 Major Markets Summary . . . . . . . . . . 25-28 Manufacturing Industry by Rank . . . . . . . 17
Information Sources for Plastics . . . 121-129
Isocyanates for Urethane . . . . . . . . . . . . . 53 Linear Low Density
Low Density Polyethylene (LDPE)* . . 70-71
Melamine* . . . . . . . . . . . . . . . . . . . . . . . . 51 Methane Resin Derivatives . . . . . . . . . . . . . 8 Naphthalene, Toluene &
Xylene Derivatives . . . . . . . . . . . . . . . 13
Nylon* . . . . . . . . . . . . . . . . . Phenolic* . . . . . . . . . . . . . . . Polyester Polyols for Urethane Polyether Polyols for Urethane Polypropylene* . . . . . . . . . . . Polystyrene* . . . . . . . . . . . . . Polyurethane . . . . . . . . . . . . .
Processinghlachinery . . . . . . Processing Methods . . . . . . .
Polyurethane End-Use Survey Polyvinyl Chloride (PVC)* . .
Propylene Resin Derivatives . . Resin Statistics . . . . . . . . . . . Resin Year of Introduction . . . SAN * . . . . . . . . . . . . . . . . . . Solid Waste Management . . . SPI Order Forms . . . . . . . . .
. . . 74-76
. . . 46-47 . . . . . . 55 . . . . . . 54 . . . 80-81 . . . 77-79 . . . 53-56 . . . . . . 56 . . . 82-83 . . 97-101 . . 98-100 . . . . . . 10 . . . 35-88 . . . . . . . 6 . . . 62-63 . . . 90-91
125-129 Standard Industrial Classification (SIC) . 14-15
Thermoplastic Polyester (PET/PBT)* . 84-85 Styrene Butadiene Latexes* . . . . . . . . . . . 61
Thermoplastic Resin Reports . . . . . . . 57-87 Thermoplastic Resin Summary . . . . . . . . 59 Thermoset Resin Reports . . . . . . . . . . 41-56 Thermoset Resin Summary . . . . . . . . . . . 43 Trade Associations . . . . . . . . . . . . . . . . . 122 Trade Press & Newspapers . . . . . . . . . . 122 Unsaturated Polyester* . . . . . . . . . . . . 48-49 Urea* . . . . . . . . . . . . . . . . . . . . . . . . . . . . 50 Urea Melamine* . . . . . . . . . . . . . . . . . . . . 52 U.S. Census of Manufacturers Data . . . . . 16 Vinyl Siding & Soffit . . . . . . . . . . . . . . . . 96
Major Markets . . . . . . . . . . . . . . . . . . 23-32
Apparent Consumption . . . . . . . . . . . . . . 40
* See also:
Growth Trends of Selected Resins . . . . 36-37 Dollar Sales . . . . . . . . . . . . . . . . . . . . . . . 39
Fabrication Processes . . . . . . . . . . . . . 86-87
.
. .