Embed Size (px)
Citation preview

Falling Drop Experiment
A study on liquid-liquid extraction
using a single drop
Team Leader: Thomas Salerno
Group Members: Gregory Rothsching
An Du

Presentation Agenda
Introduction – What is LLE and single drop extraction?
Theory – How do we analyze and model LLE?
Equipment and Procedure – What did we use?
Results and Discussions – What did we find?
Conclusions – How can we use these results?
Questions – What parts did I go too fast on?

Introduction
What is LLE?– One or more solutes are removed from one liquid
phase to another, immiscible phase which has a greater affinity for the solute
Why use LLE over distillation?– LLE requires no vaporization– Less expensive, no condenser nor reboiler

Introduction
Where is LLE used?– Penicillin manufacture– Petroleum Processing
Why is this experiment important?– Many of the predictive equations require
experimental measurements– Using single drop allows quick measurements on
lab scale instead of designing on a pilot plant scale

Theory - Experimental
Initial Measurements– Volume of Drop
– Terminal Velocity
T
Distancev
Time
50
50Drop
Volume of DropsVolume

Theory - Experimental
Mass Transfer Measurements– Mass Transfer Rate
– Overall Mass Transfer Coefficient
– Equilibrium Distribution Coefficient
HAc
moles of HAc extractedN
Time needed for extraction
,
,
HAc Wat
HAc Tol
Cm
C
*,* *HAc HAc WatN K A C C
Theory - Predictive
Terminal Velocity– Force Balance on Falling Drop
– Using the definition of terminal velocity
– Coefficient of Drag Correlation?
FGravity
FDrag FDrag FBouyancy
Velocity
* *2
D drop projectedgravity surrounding fluid gravity
drop
C v v Adv MM M a a
dt
.6
24Re 2
Re18.5
2 Re 500Re.44 Re 500
D
D
D
C for
C for
C for
2
2*
.44* *gravity Wat Tol
Wat Wat drop
a Mv
r
Theory - Predictive
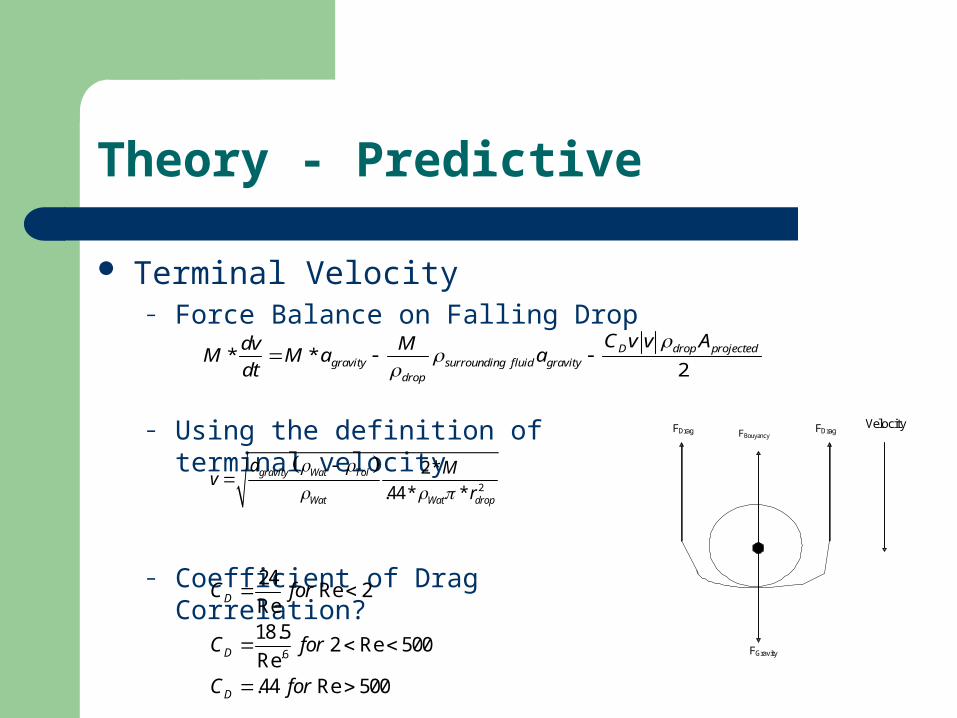
Overall Mass Transfer Coefficient– Three mass transfer mechanisms
– Create one model to account for all?

Theory - Predictive
Outside Mass Transfer Coefficient– Apply regular boundary layer equations
Continuity:
Momentum:
Mass:
– Final Result:
2
2
u u uu
x y y
0u
x y
2
2A A A
x y AB
C C Cv v D
x y y
1/ 2 1/ 2
1/ 21.132
T HAcoutside
drop
v Dk
r
Theory - Predictive
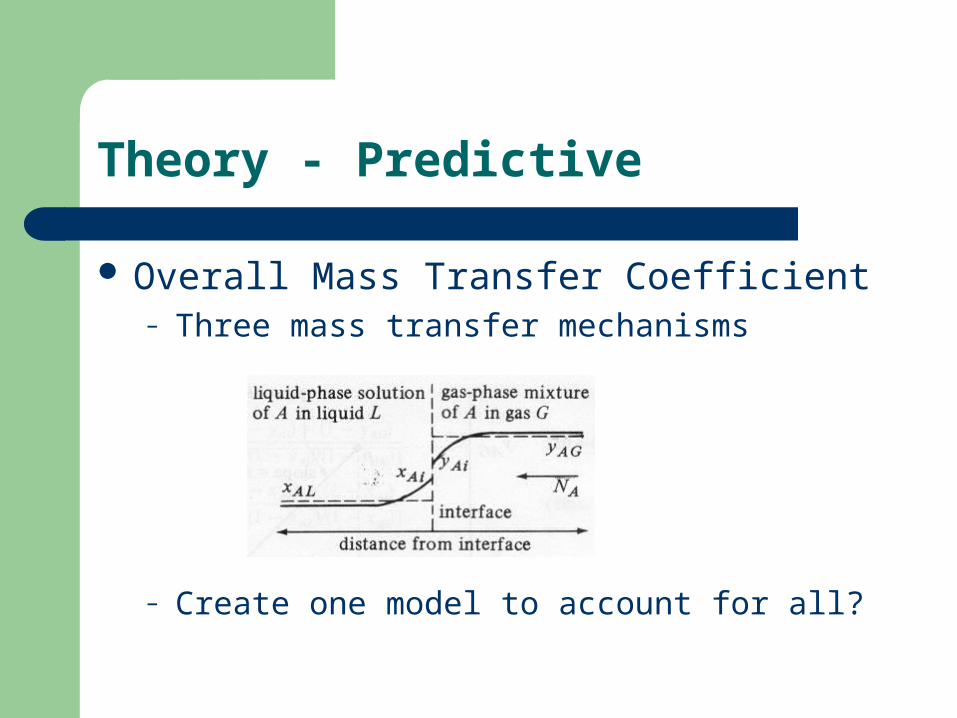
Inside Mass Transfer Coefficient– Oscillating Drop
– Develop probability distribution
– Final Result:.00375
1
Ti
i
o
vk

Theory - Predictive
Overall Mass Transfer Coefficient– Two resistance theory:– Graphically relate driving force
– Result:
, ,A in A Wat Ai out Ai A TolN k y y k x x
"
'
*
*
mxx
yy
mxx
yy
AiA
AiAG
ALAi
AAi
1 1
in out
m
K k k

Equipment and Procedure
Week 1: Experimental Measurements
Volumetric Flow: mL per Minute
Volumetric Flow: mL per Hour
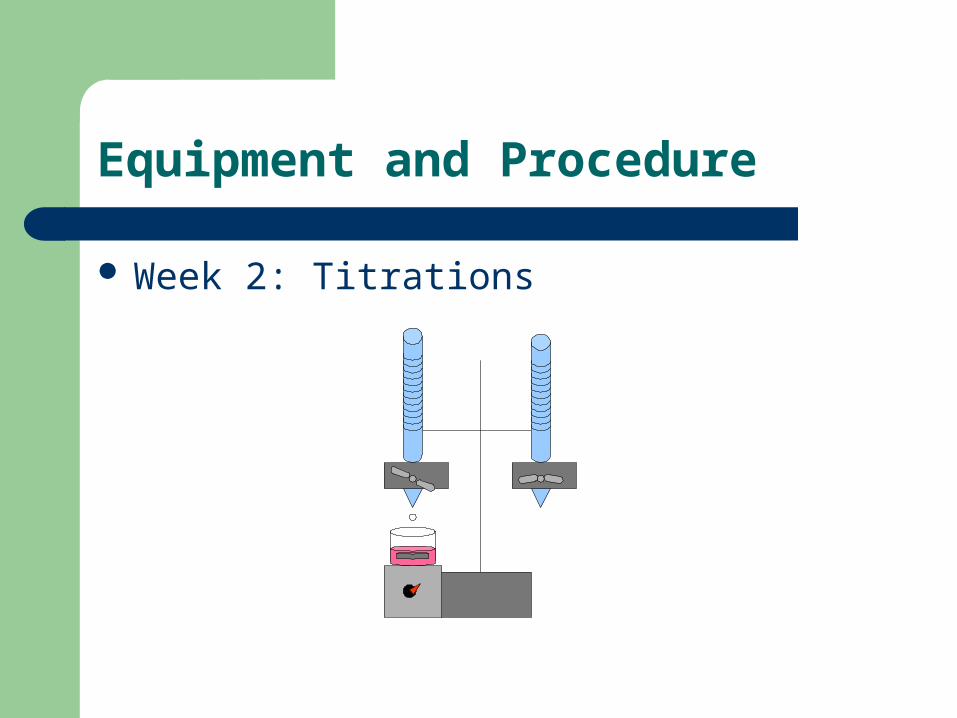
Equipment and Procedure
Week 2: Titrations

Results and Discussions
Terminal VelocityTerminal Velocity of Drop as a Function of Drop Diameter
y = 1.8303x - 0.0327
R2 = 0.9754
0
0.02
0.04
0.06
0.08
0.1
0.12
0.14
0.16
0.18
0.07 0.075 0.08 0.085 0.09 0.095 0.1 0.105 0.11
Square Root of Drop Diameter (m^.5)
Ter
min
al V
elo
city
(m
/s)
Experimental Velocity
Predicted Velocity
Linear (Predicted Velocity)

Results and Discussions
Distribution Coefficient

Results and Discussions
Overall Mass Transfer Coefficient– Experimental vs Theory:
Overall Mass Transfer Coefficient as a Function of Drop Diameter
-5
45
95
145
195
245
295
0.003 0.0035 0.004 0.0045 0.005 0.0055 0.006
Diameter of Drop (m)
Ove
rall
Mas
s T
ran
sfer
Co
effi
cien
t (1
0^-7
m/s
))
K Exp
K Pred
Linear (K Pred)
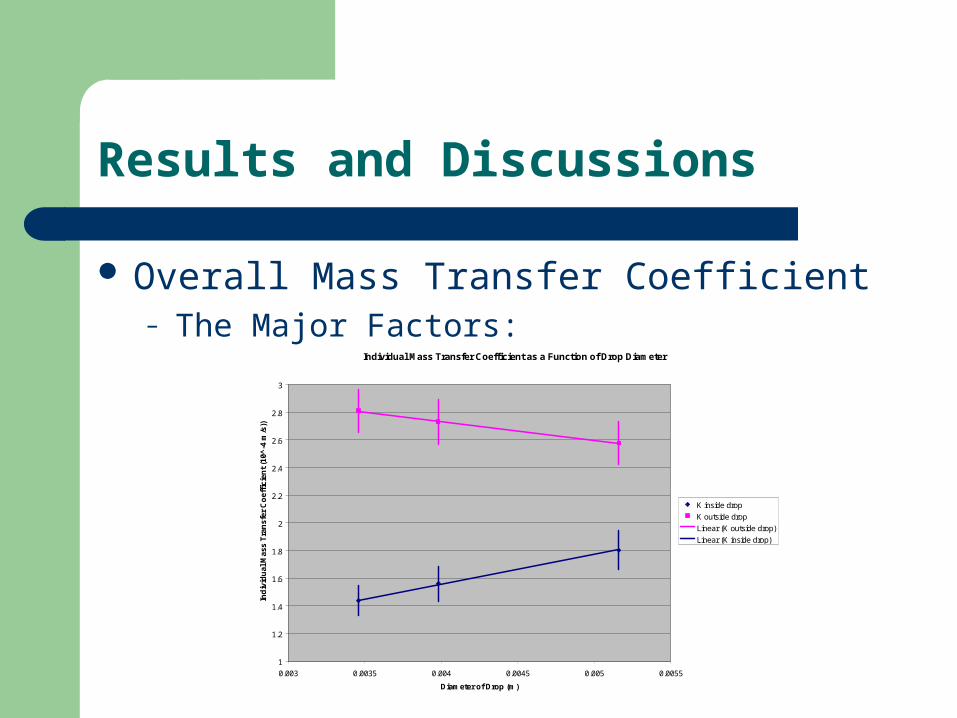
Results and Discussions
Overall Mass Transfer Coefficient– The Major Factors:
Individual Mass Transfer Coefficient as a Function of Drop Diameter
1
1.2
1.4
1.6
1.8
2
2.2
2.4
2.6
2.8
3
0.003 0.0035 0.004 0.0045 0.005 0.0055
Diameter of Drop (m)
Ind
ivid
ual
Mas
s T
ran
sfer
Co
effi
cien
t (1
0^-4
m/s
))
K inside drop
K outside drop
Linear (K outside drop)
Linear (K inside drop)

Results and Discussions
Overall Mass Transfer Coefficient– Instability Factor:
Accounts for non-idealities of the system Constant with diameter and scale-up
.00375
1inside
iIP
o
PeSh
C
1/ 221.13 T drop
outsideIP HAc
v rSh
C D

Results and Discussions
Overall Mass Transfer Coefficient– Experimental vs Predicted with
Overall Mass Transfer Coefficient as a Function of Drop DiameterExperimental versus Predicted with Fudge Factor
1.5
1.6
1.7
1.8
1.9
2
2.1
2.2
2.3
2.4
2.5
0.003 0.0035 0.004 0.0045 0.005 0.0055
Diameter of Drop (m)
Ove
rall
Mas
s T
ran
sfer
Co
effi
cien
t (1
0^-7
m/s
))
K Exp
K Pred FF
Linear (K Pred FF)
113.3IPC

Results and Discussions
Mass Transfer Rate– Two Factors: Surface Area and Mass Transfer Coefficient
Molar Transfer Rate as a function of Drop Diameter
y = 4058.2x - 8.0895
R2 = 0.9984
5
6
7
8
9
10
11
12
13
14
15
0.003 0.0035 0.004 0.0045 0.005 0.0055
Diameter of Drop (m)
Mo
lar
Tra
nsf
er R
ate
(m
ol p
er s
eco
nd
*10
^-8
)
Conclusions
Mass transfer coefficient decreases with increasing diameter
– Toluene Phase is the controlling resistance.
Mass transfer rate increases with increasing diameter
– The surface area is the controlling factor.
Trends were predicted by theory, however, experimental data is needed to get exact numbers
– Non-idealities in system: Surface tension, coalescence– Oscillations in drop.

Questions?