Embed Size (px)
Citation preview
FDI and Wages: Evidence from Vietnam’s FDI Employee Survey
(As of March 2009)
By Hoang Thanh Huong1
1. Introduction
Although in the past years, FDI capital flow into Vietnam has been quite high. There
have been a lot of studies into the attraction and implementation of FDI capital, evaluation of
FDI enterprise operations; however, there have not been studies about the effect of FDI firms
towards the labor market. The reason for the lack of those studies is the limitation of data. In
2007, the Center of Analysis and Forecast under Academy of Social Sciences carried out
survey on FDI firms in 11 provinces and cities. For each FDI enterprise, there are two types of
questionnaires: for the firms and for the laborers. Beside the questionnaire, the laborers were
surveyed in non-FDI firms situated on the location to serve the comparative study on labor
impacts of FDI. This paper is written based on the set of data above in order to compare work
and wages of FDI and non FDI laborers, through which to find out the effect of FDI firms on
the labor market in the view angle of laborers.
In this paper, the author is trying to exploit at best the data collected from the
employee survey and applies quantitative method to analyze wages determinants and find out
the reasons of wage differentials between FDI and non-FDI sector. The extended Mincerian
wage regressions are run and decomposed with firm characteristics after controlling for firm
fixed effects. The comparisons in work and job satisfaction between FDI and non-FDI firms
are also implemented and the difference (if have) are statistically test.
2. Literature Review
There exists a large theoretical and empirical literature about effects of FDI. Although
whether FDI benefits developing countries is controversial for a long time, the role of FDI has
been increasingly recognized as a contributor to economic development of developing
countries. In recent years a number of empirical studies from different countries show
evidence that FDI have positive impacts on the host countries from labor market perspective. 1 I would like to thank Dr Nguyen Thang, Director of Forecast and Analysis for his helpful comments. All errors remained are mine.
First, on the job training is argued by far the most important avenue. Lucas (1993)
shows that on the job training are related with rapid growth when labor force moves quickly
into more and more productive activities. This is the "quality ladder" model argued in
Grossman and Helpman (1991a, 1991b). This is supported by micro level evidence by looking
at the linkages between human capital formation, on the job training and productivity growth
due to entry by foreign multinationals. It is presumable that the presence of foreign
multinationals provides an opportunity of technology and knowledge transfer to the host
country. Thus, the domestic stock of human capital increases due to "learning by doing" of
domestic workers. The effects of foreign ownership are enhanced by spread of their
knowledge to domestically owned firms by training of suppliers or by imitation and labor
mobility
In addition, FDI facilitates the idea flows across national borders. The potential role of
multinational corporations in spreading knowledge and consequently fostering economic
growth is well documented in Romer (1993). He emphasizes that in addition to the lack of
traditional inputs such as capital, developing countries may also suffer from a so-called “ideas
gap” which describes the utilization of productive knowledge across countries. With cross
country data and other evidence supports, he claims that a country's growth performance is
more associated with its utilization of ideas embodied in foreign direct investment than the
accumulation of capital or the extent of secondary school enrolment.
Moreover, foreign owned firms are observed to have impacts on domestic wages.
Foreign investors presumably bring technology and knowledge to the host country, the
marginal productivity of workers in their businesses increases putting upward pressure on
wages. If such an increase is significant, equilibrium wages will rise in responses to FDI
increase.
Further looking at FDI and wage gap in developing countries, numerous studies based
on firm-level data have reported higher average wages in foreign-owned firms than in
domestically-owned firms. Among them, a comparative study on FDI and wages in Mexico,
Venezuela and the United States by Aitken et al (1997) also finds higher levels of foreign
investment are associated with higher wages despite very different economic condition and
levels of development. It is shown that foreign investment raises wage differentials more in
the developing economies of Mexico and Venezuela than in the developed economy of the
United States. For developing countries, Lipsey, R. & Sjoholm, F (2001) examine FDI firms’
labor market behaviors and its impacts by using cross section data on 1996 Indonesian
manufacturing sector. First, they find the difference is about one quarter for blue-collar and
more exacerbated for white collar with margin of over a half. Taking size, inputs per worker or
even industry and location into account, wages offered by foreign owned firms are about 12
per cent higher than that of local ones for blue collar workers and over 20 per cent for white
collar workers. However, it should be noted that the difference in labor price here is wage
differential rather than total labor compensation. Thus, the differential in reality may be higher
as foreign owned firms seem to pay much higher other types of compensation than the local
ones. Second, they examine labor market impacts by asking whether a larger presence of
foreign owned firms affects wages of local firms. It is evident that foreign ownership in an
industry, or an industry within a region, affects wages in local firms, or in all plants taken
together even if there were no wage differential in wage levels between foreign firms and local
ones. Higher presence of foreign owned firms in an industry, or in a province or in an industry
in a province, is likely to raise the wage levels of domestically owned firms for labors of a
given education level. This effect is found after taking firm size and impacts of energy and
other inputs into account.
Besides, there is a concern about FDI and wage inequality between skilled and
unskilled labors. Traditional trade theory argues that FDI in low-skilled abundant countries
locates in low-skilled intensive sectors thereby raising the relative demand for low-skilled
workers. As a result, wage inequality between skilled and low-skilled workers is reduced.
However, some empirical studies from different countries show the contradictory. As an
example, with ILO data for wages and employment by occupation over the period 1985-1998,
te Velde D.W and Morrisey O. (2002) don’t find strong evidence that FDI reduced wage
inequality in three 'traditional' Asian tigers (Korea, Singapore and Hong Kong) and two new
Asian tigers (Philippines and Thailand). Controlling for domestic influences (wage setting,
supply of skills) it is found that FDI has raised wage inequality in Thailand. This is robust to
using different specifications and to statistical testing. Owen A.L and Yu B.Y (2003) find that
in addition of provincial characteristics, type of FDI affects relative wages between skilled and
unskilled labors. Type of FDI (export vs. import-oriented) varies substantially across the
provinces. Export-oriented FDI raises the wages of unskilled workers, lowers the wages of
skilled workers, and lowers the skill premium.
3. Data description
Dataset is taken from 2007 FDI survey done by CAF. The survey includes 220 FDI
firms from 11 provinces and 130 non FDI firms from 9 provinces. For each interviewed FDI
firms, two types of questionnaire were taken. The firm questionnaire to ask about the firm’s
various characteristics and performance. The labor questionnaire is to collect information on
wages, work and job satisfaction of workers. At each firm, 6 workers were selected. Among
them, one is manager who is in charge of director or deputy director of the firm or department.
Another is technician specialist for example officers at functional department. It should be
noted that employees who have college degree or above are selected into this category. Two
people who are next interviewed is the employees directly taking in
production/distribution/skilled services of equal to or over 4-level (in labor categories there are
6 to 7 level is the highest) or level 3 or over (in labor categories, level 4 or 5 is the highest):
Finally is interviewing 2 employees who directly take part in production/distribution/semi-
skilled services or without skills equal to level 3 or lower (in labor categories there are 6 to 7
level is the highest) or level 2 or lower (in labor categories, level 4 or 5 is the highest). In total
generally considering, there are 2058 observations as in fact there are many firms, the data is
just 5 observations. The sample structure according to regions and the kinds of firms are
presented in the following table
Table 1: Sample structure by province and firm type
Province FDI Non FDI Total
Binhduong 168 48 216
Danang 30 24 54
Dongnai 174 18 192
HCMC 359 264 623
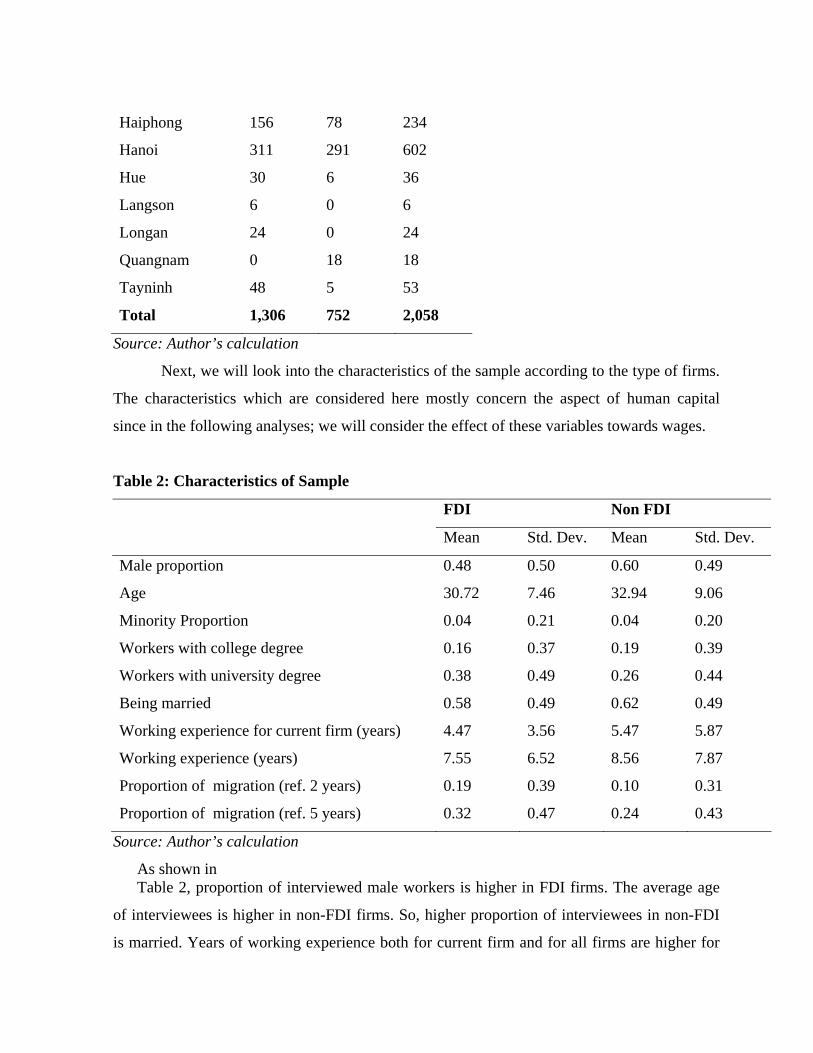
Haiphong 156 78 234
Hanoi 311 291 602
Hue 30 6 36
Langson 6 0 6
Longan 24 0 24
Quangnam 0 18 18
Tayninh 48 5 53
Total 1,306 752 2,058
Source: Author’s calculation
Next, we will look into the characteristics of the sample according to the type of firms.
The characteristics which are considered here mostly concern the aspect of human capital
since in the following analyses; we will consider the effect of these variables towards wages.
Table 2: Characteristics of Sample
FDI Non FDI
Mean Std. Dev. Mean Std. Dev.
Male proportion 0.48 0.50 0.60 0.49
Age 30.72 7.46 32.94 9.06
Minority Proportion 0.04 0.21 0.04 0.20
Workers with college degree 0.16 0.37 0.19 0.39
Workers with university degree 0.38 0.49 0.26 0.44
Being married 0.58 0.49 0.62 0.49
Working experience for current firm (years) 4.47 3.56 5.47 5.87
Working experience (years) 7.55 6.52 8.56 7.87
Proportion of migration (ref. 2 years) 0.19 0.39 0.10 0.31
Proportion of migration (ref. 5 years) 0.32 0.47 0.24 0.43
Source: Author’s calculation
As shown in Table 2, proportion of interviewed male workers is higher in FDI firms. The average age
of interviewees is higher in non-FDI firms. So, higher proportion of interviewees in non-FDI
is married. Years of working experience both for current firm and for all firms are higher for
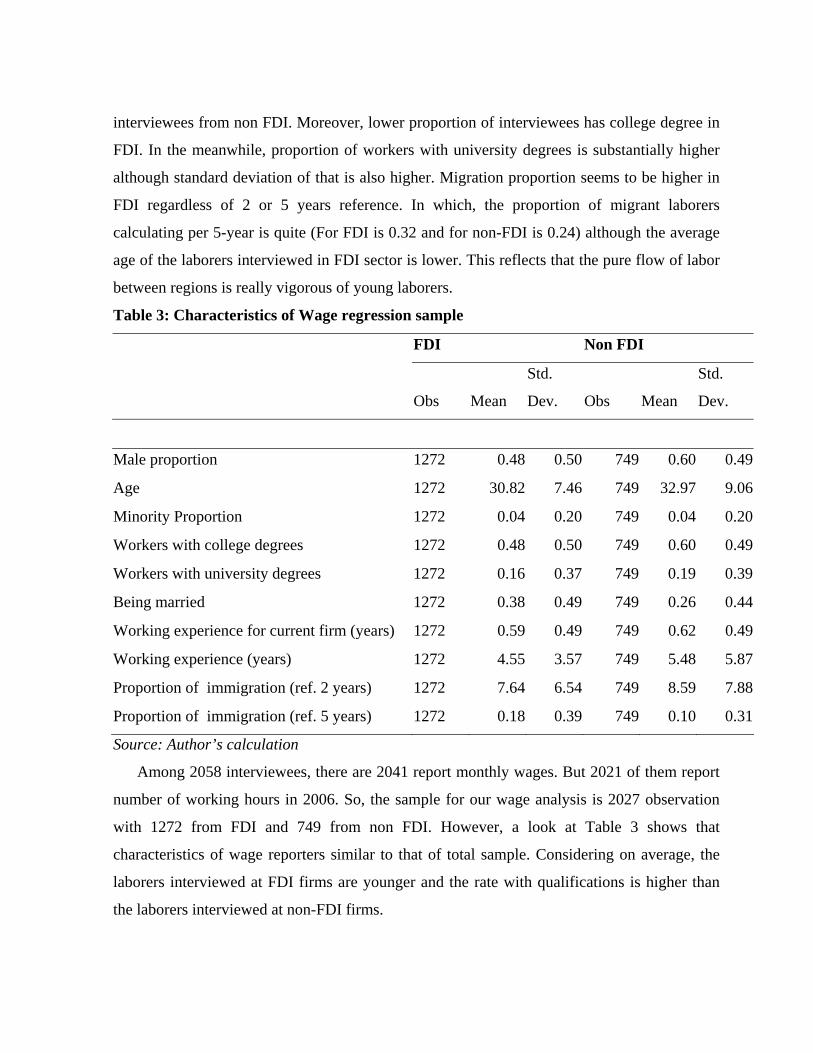
interviewees from non FDI. Moreover, lower proportion of interviewees has college degree in
FDI. In the meanwhile, proportion of workers with university degrees is substantially higher
although standard deviation of that is also higher. Migration proportion seems to be higher in
FDI regardless of 2 or 5 years reference. In which, the proportion of migrant laborers
calculating per 5-year is quite (For FDI is 0.32 and for non-FDI is 0.24) although the average
age of the laborers interviewed in FDI sector is lower. This reflects that the pure flow of labor
between regions is really vigorous of young laborers.
Table 3: Characteristics of Wage regression sample
FDI Non FDI
Obs Mean
Std.
Dev. Obs Mean
Std.
Dev.
Male proportion 1272 0.48 0.50 749 0.60 0.49
Age 1272 30.82 7.46 749 32.97 9.06
Minority Proportion 1272 0.04 0.20 749 0.04 0.20
Workers with college degrees 1272 0.48 0.50 749 0.60 0.49
Workers with university degrees 1272 0.16 0.37 749 0.19 0.39
Being married 1272 0.38 0.49 749 0.26 0.44
Working experience for current firm (years) 1272 0.59 0.49 749 0.62 0.49
Working experience (years) 1272 4.55 3.57 749 5.48 5.87
Proportion of immigration (ref. 2 years) 1272 7.64 6.54 749 8.59 7.88
Proportion of immigration (ref. 5 years) 1272 0.18 0.39 749 0.10 0.31
Source: Author’s calculation
Among 2058 interviewees, there are 2041 report monthly wages. But 2021 of them report
number of working hours in 2006. So, the sample for our wage analysis is 2027 observation
with 1272 from FDI and 749 from non FDI. However, a look at Table 3 shows that
characteristics of wage reporters similar to that of total sample. Considering on average, the
laborers interviewed at FDI firms are younger and the rate with qualifications is higher than
the laborers interviewed at non-FDI firms.
4. Evidence from Survey
Wage comparison and determinants
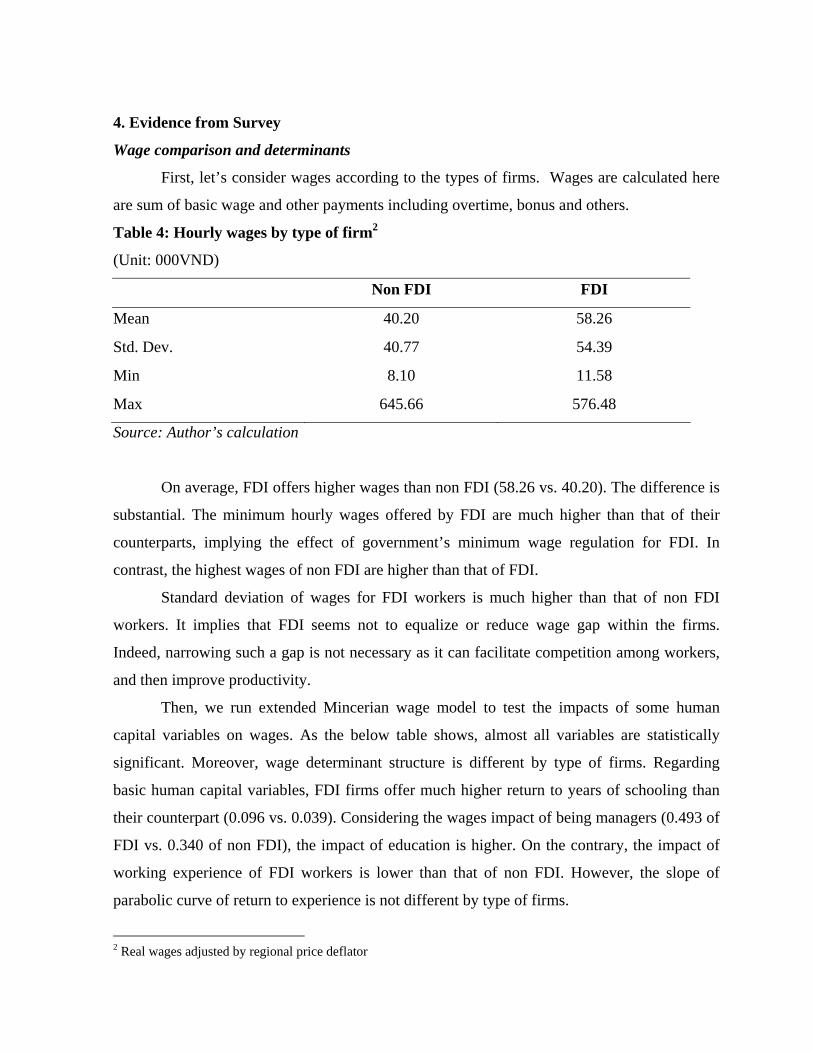
First, let’s consider wages according to the types of firms. Wages are calculated here
are sum of basic wage and other payments including overtime, bonus and others.
Table 4: Hourly wages by type of firm2
(Unit: 000VND)
Non FDI FDI
Mean 40.20 58.26
Std. Dev. 40.77 54.39
Min 8.10 11.58
Max 645.66 576.48
Source: Author’s calculation
On average, FDI offers higher wages than non FDI (58.26 vs. 40.20). The difference is
substantial. The minimum hourly wages offered by FDI are much higher than that of their
counterparts, implying the effect of government’s minimum wage regulation for FDI. In
contrast, the highest wages of non FDI are higher than that of FDI.
Standard deviation of wages for FDI workers is much higher than that of non FDI
workers. It implies that FDI seems not to equalize or reduce wage gap within the firms.
Indeed, narrowing such a gap is not necessary as it can facilitate competition among workers,
and then improve productivity.
Then, we run extended Mincerian wage model to test the impacts of some human
capital variables on wages. As the below table shows, almost all variables are statistically
significant. Moreover, wage determinant structure is different by type of firms. Regarding
basic human capital variables, FDI firms offer much higher return to years of schooling than
their counterpart (0.096 vs. 0.039). Considering the wages impact of being managers (0.493 of
FDI vs. 0.340 of non FDI), the impact of education is higher. On the contrary, the impact of
working experience of FDI workers is lower than that of non FDI. However, the slope of
parabolic curve of return to experience is not different by type of firms.
2 Real wages adjusted by regional price deflator
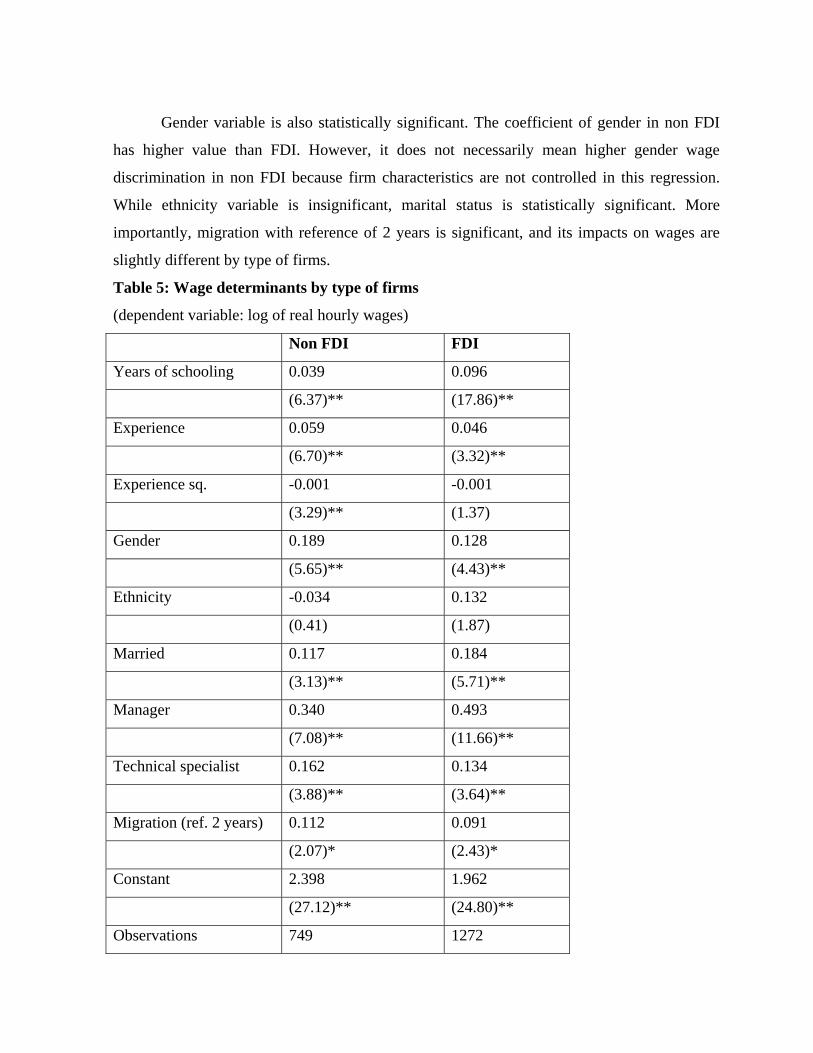
Gender variable is also statistically significant. The coefficient of gender in non FDI
has higher value than FDI. However, it does not necessarily mean higher gender wage
discrimination in non FDI because firm characteristics are not controlled in this regression.
While ethnicity variable is insignificant, marital status is statistically significant. More
importantly, migration with reference of 2 years is significant, and its impacts on wages are
slightly different by type of firms.
Table 5: Wage determinants by type of firms
(dependent variable: log of real hourly wages)
Non FDI FDI
Years of schooling 0.039 0.096
(6.37)** (17.86)**
Experience 0.059 0.046
(6.70)** (3.32)**
Experience sq. -0.001 -0.001
(3.29)** (1.37)
Gender 0.189 0.128
(5.65)** (4.43)**
Ethnicity -0.034 0.132
(0.41) (1.87)
Married 0.117 0.184
(3.13)** (5.71)**
Manager 0.340 0.493
(7.08)** (11.66)**
Technical specialist 0.162 0.134
(3.88)** (3.64)**
Migration (ref. 2 years) 0.112 0.091
(2.07)* (2.43)*
Constant 2.398 1.962
(27.12)** (24.80)**
Observations 749 1272
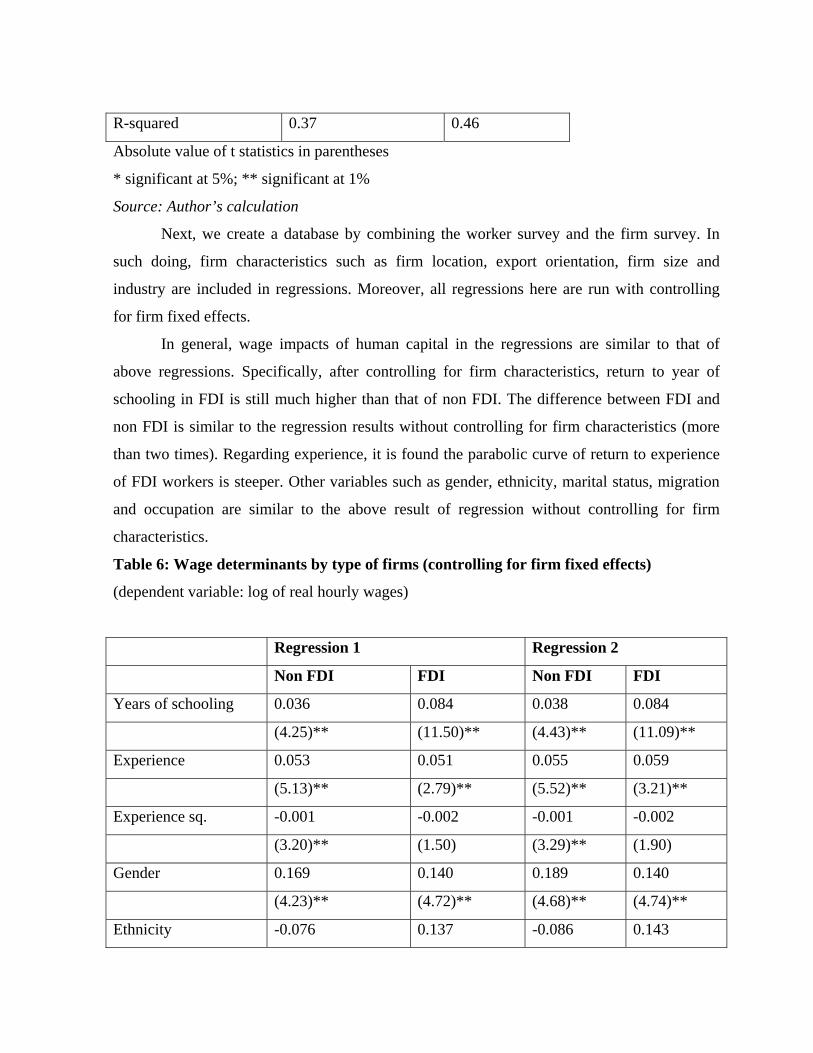
R-squared 0.37 0.46
Absolute value of t statistics in parentheses
* significant at 5%; ** significant at 1%
Source: Author’s calculation
Next, we create a database by combining the worker survey and the firm survey. In
such doing, firm characteristics such as firm location, export orientation, firm size and
industry are included in regressions. Moreover, all regressions here are run with controlling
for firm fixed effects.
In general, wage impacts of human capital in the regressions are similar to that of
above regressions. Specifically, after controlling for firm characteristics, return to year of
schooling in FDI is still much higher than that of non FDI. The difference between FDI and
non FDI is similar to the regression results without controlling for firm characteristics (more
than two times). Regarding experience, it is found the parabolic curve of return to experience
of FDI workers is steeper. Other variables such as gender, ethnicity, marital status, migration
and occupation are similar to the above result of regression without controlling for firm
characteristics.
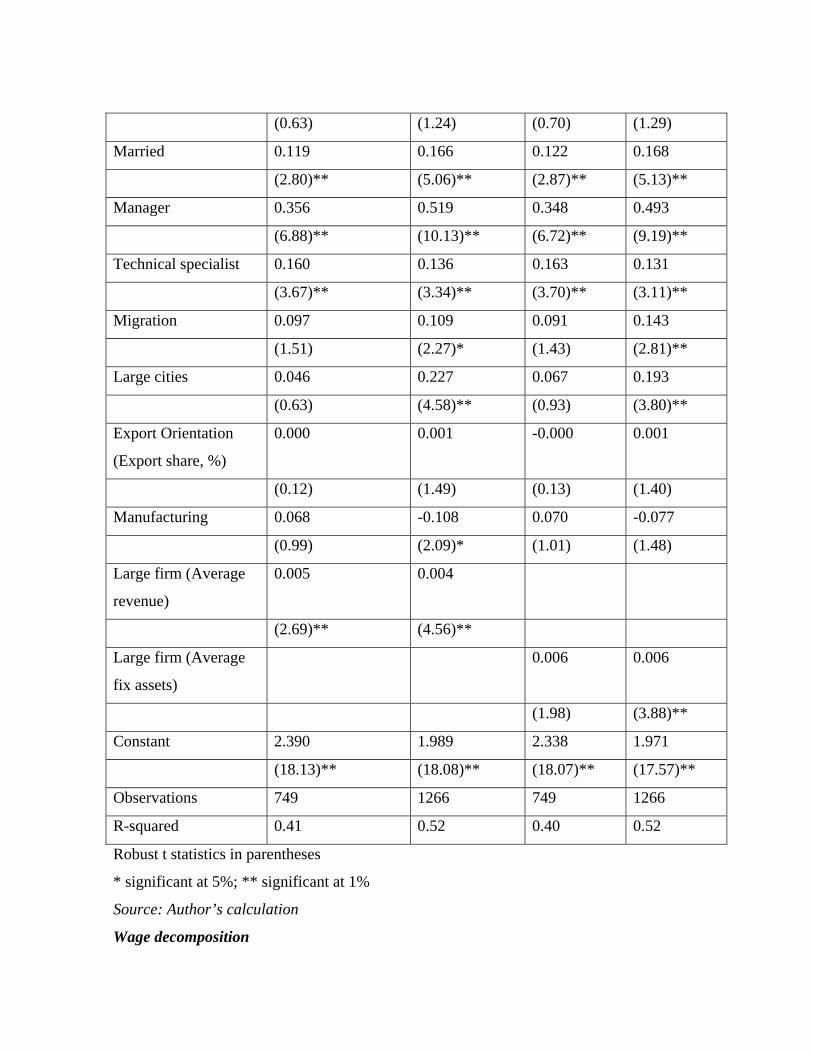
Table 6: Wage determinants by type of firms (controlling for firm fixed effects)
(dependent variable: log of real hourly wages)
Regression 1 Regression 2
Non FDI FDI Non FDI FDI
Years of schooling 0.036 0.084 0.038 0.084
(4.25)** (11.50)** (4.43)** (11.09)**
Experience 0.053 0.051 0.055 0.059
(5.13)** (2.79)** (5.52)** (3.21)**
Experience sq. -0.001 -0.002 -0.001 -0.002
(3.20)** (1.50) (3.29)** (1.90)
Gender 0.169 0.140 0.189 0.140
(4.23)** (4.72)** (4.68)** (4.74)**
Ethnicity -0.076 0.137 -0.086 0.143
(0.63) (1.24) (0.70) (1.29)
Married 0.119 0.166 0.122 0.168
(2.80)** (5.06)** (2.87)** (5.13)**
Manager 0.356 0.519 0.348 0.493
(6.88)** (10.13)** (6.72)** (9.19)**
Technical specialist 0.160 0.136 0.163 0.131
(3.67)** (3.34)** (3.70)** (3.11)**
Migration 0.097 0.109 0.091 0.143
(1.51) (2.27)* (1.43) (2.81)**
Large cities 0.046 0.227 0.067 0.193
(0.63) (4.58)** (0.93) (3.80)**
Export Orientation
(Export share, %)
0.000 0.001 -0.000 0.001
(0.12) (1.49) (0.13) (1.40)
Manufacturing 0.068 -0.108 0.070 -0.077
(0.99) (2.09)* (1.01) (1.48)
Large firm (Average
revenue)
0.005 0.004
(2.69)** (4.56)**
Large firm (Average
fix assets)
0.006 0.006
(1.98) (3.88)**
Constant 2.390 1.989 2.338 1.971
(18.13)** (18.08)** (18.07)** (17.57)**
Observations 749 1266 749 1266
R-squared 0.41 0.52 0.40 0.52
Robust t statistics in parentheses
* significant at 5%; ** significant at 1%
Source: Author’s calculation
Wage decomposition
Further, to find what behind the wage differential between FDI and non FDI, we use
Oaxaca-Blinder decomposition method. First, we run the following Mincerian wage models
are given:
Log hwage1 = X1b1 + e1
Log hwage2 = X2b2 + e2
Of which hwage1 is hourly wages for FDI workers, hwage2 for non FDI workers. X1, X2
is human capital variables for FDI and non FDI workers, respectively. As long as
E(e1)=E(e2)=0, the mean outcome difference between the two groups can be decomposed as
R = x1'b1 - x2'b2 = (x1-x2)'b2 + x2'(b1-b2) + (x1-x2)'(b1-b2)
= E + C + CE
In which x1 and x2 are the vectors of means of the regressors (including the constants) for
the two groups. In other words, R is decomposed into one part that is due to differences in
endowments (E), one part that is due to differences in coefficients (including the intercept)
(C), and a third part that is due to interaction between coefficients and endowments (CE).
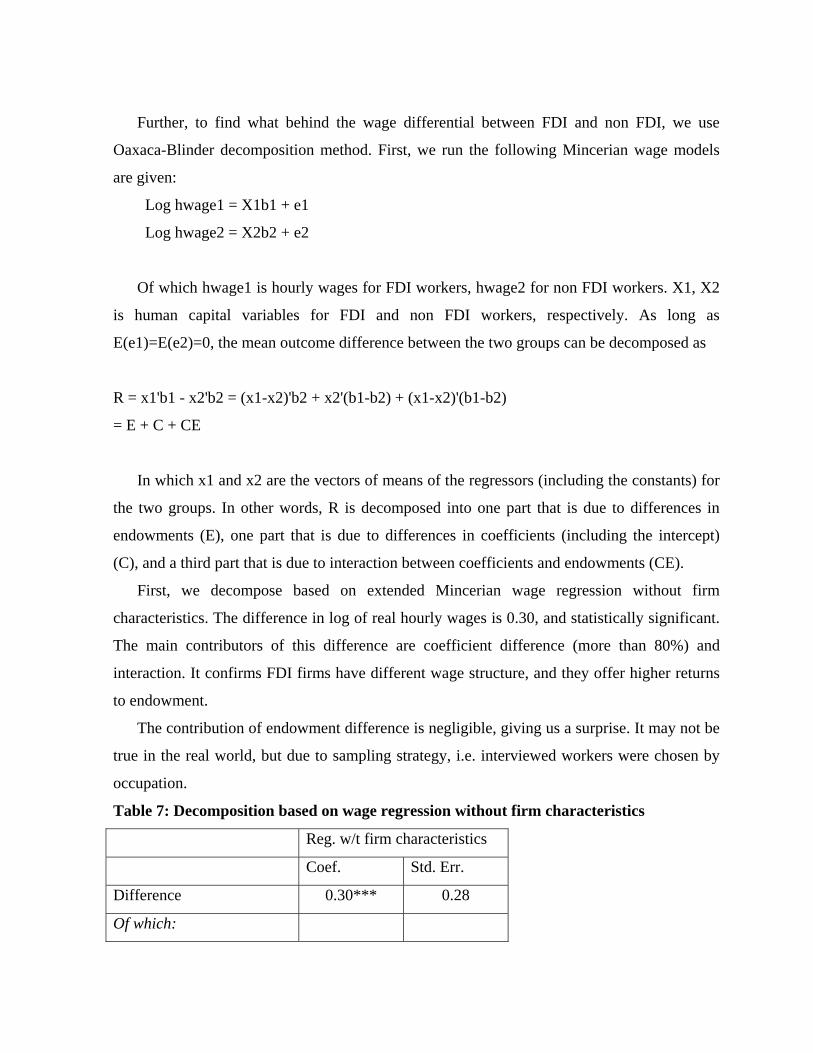
First, we decompose based on extended Mincerian wage regression without firm
characteristics. The difference in log of real hourly wages is 0.30, and statistically significant.
The main contributors of this difference are coefficient difference (more than 80%) and
interaction. It confirms FDI firms have different wage structure, and they offer higher returns
to endowment.
The contribution of endowment difference is negligible, giving us a surprise. It may not be
true in the real world, but due to sampling strategy, i.e. interviewed workers were chosen by
occupation.
Table 7: Decomposition based on wage regression without firm characteristics
Reg. w/t firm characteristics
Coef. Std. Err.
Difference 0.30*** 0.28
Of which:
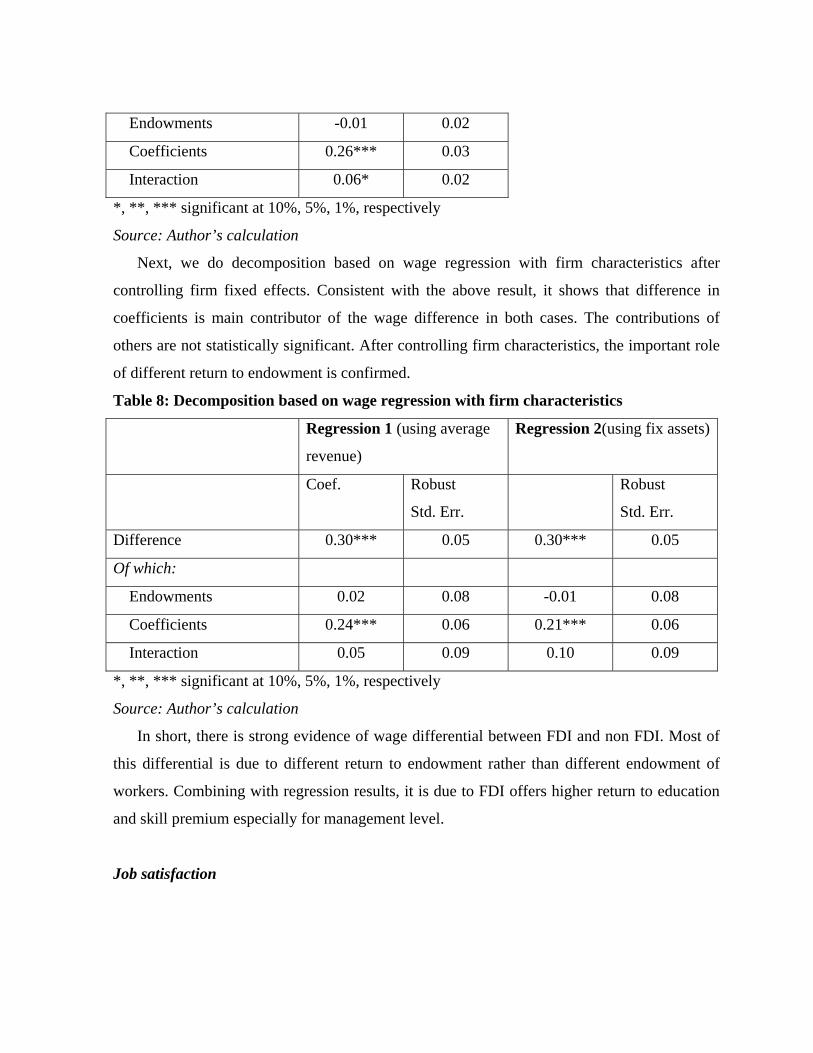
Endowments -0.01 0.02
Coefficients 0.26*** 0.03
Interaction 0.06* 0.02
*, **, *** significant at 10%, 5%, 1%, respectively
Source: Author’s calculation
Next, we do decomposition based on wage regression with firm characteristics after
controlling firm fixed effects. Consistent with the above result, it shows that difference in
coefficients is main contributor of the wage difference in both cases. The contributions of
others are not statistically significant. After controlling firm characteristics, the important role
of different return to endowment is confirmed.
Table 8: Decomposition based on wage regression with firm characteristics
Regression 1 (using average
revenue)
Regression 2(using fix assets)
Coef. Robust
Std. Err.
Robust
Std. Err.
Difference 0.30*** 0.05 0.30*** 0.05
Of which:
Endowments 0.02 0.08 -0.01 0.08
Coefficients 0.24*** 0.06 0.21*** 0.06
Interaction 0.05 0.09 0.10 0.09
*, **, *** significant at 10%, 5%, 1%, respectively
Source: Author’s calculation
In short, there is strong evidence of wage differential between FDI and non FDI. Most of
this differential is due to different return to endowment rather than different endowment of
workers. Combining with regression results, it is due to FDI offers higher return to education
and skill premium especially for management level.
Job satisfaction
Next, we look at non monetary dimension of work by contrast interviewed FDI and
non FDI. This sector will further clarify the difference in the working environment and the job
satisfaction according to the viewpoint of the laborer.
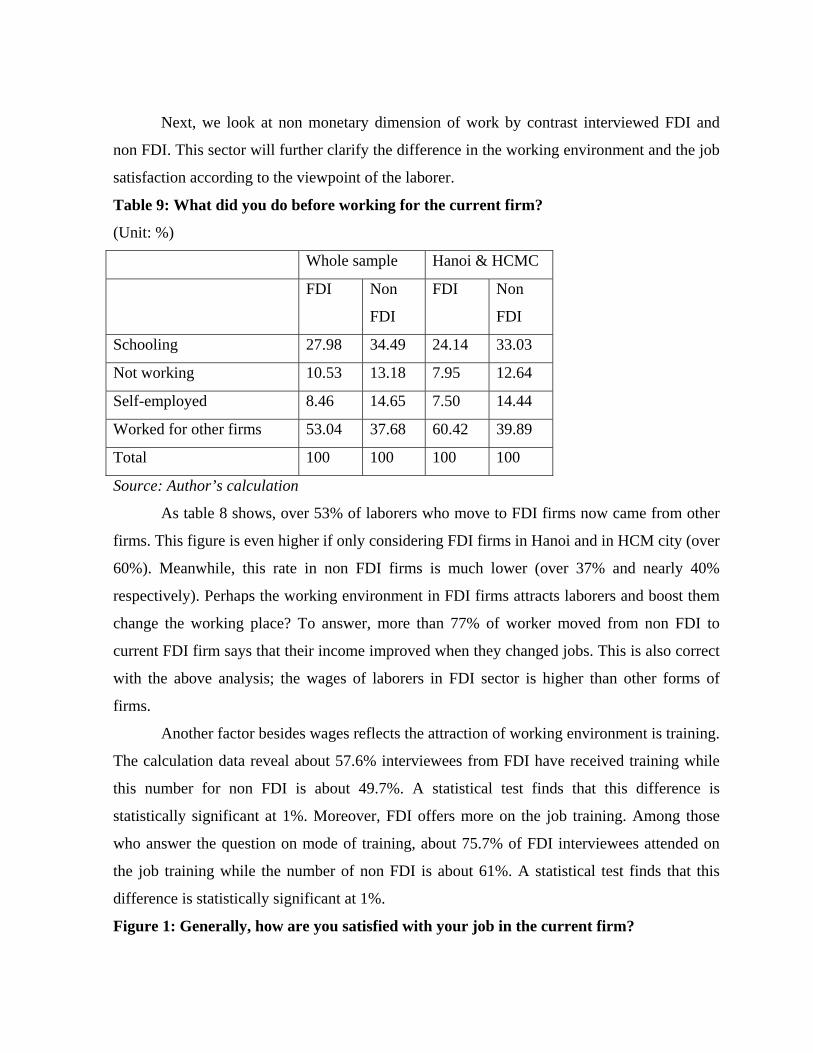
Table 9: What did you do before working for the current firm?
(Unit: %)
Whole sample Hanoi & HCMC
FDI Non
FDI
FDI Non
FDI
Schooling 27.98 34.49 24.14 33.03
Not working 10.53 13.18 7.95 12.64
Self-employed 8.46 14.65 7.50 14.44
Worked for other firms 53.04 37.68 60.42 39.89
Total 100 100 100 100
Source: Author’s calculation
As table 8 shows, over 53% of laborers who move to FDI firms now came from other
firms. This figure is even higher if only considering FDI firms in Hanoi and in HCM city (over
60%). Meanwhile, this rate in non FDI firms is much lower (over 37% and nearly 40%
respectively). Perhaps the working environment in FDI firms attracts laborers and boost them
change the working place? To answer, more than 77% of worker moved from non FDI to
current FDI firm says that their income improved when they changed jobs. This is also correct
with the above analysis; the wages of laborers in FDI sector is higher than other forms of
firms.
Another factor besides wages reflects the attraction of working environment is training.
The calculation data reveal about 57.6% interviewees from FDI have received training while
this number for non FDI is about 49.7%. A statistical test finds that this difference is
statistically significant at 1%. Moreover, FDI offers more on the job training. Among those
who answer the question on mode of training, about 75.7% of FDI interviewees attended on
the job training while the number of non FDI is about 61%. A statistical test finds that this
difference is statistically significant at 1%.
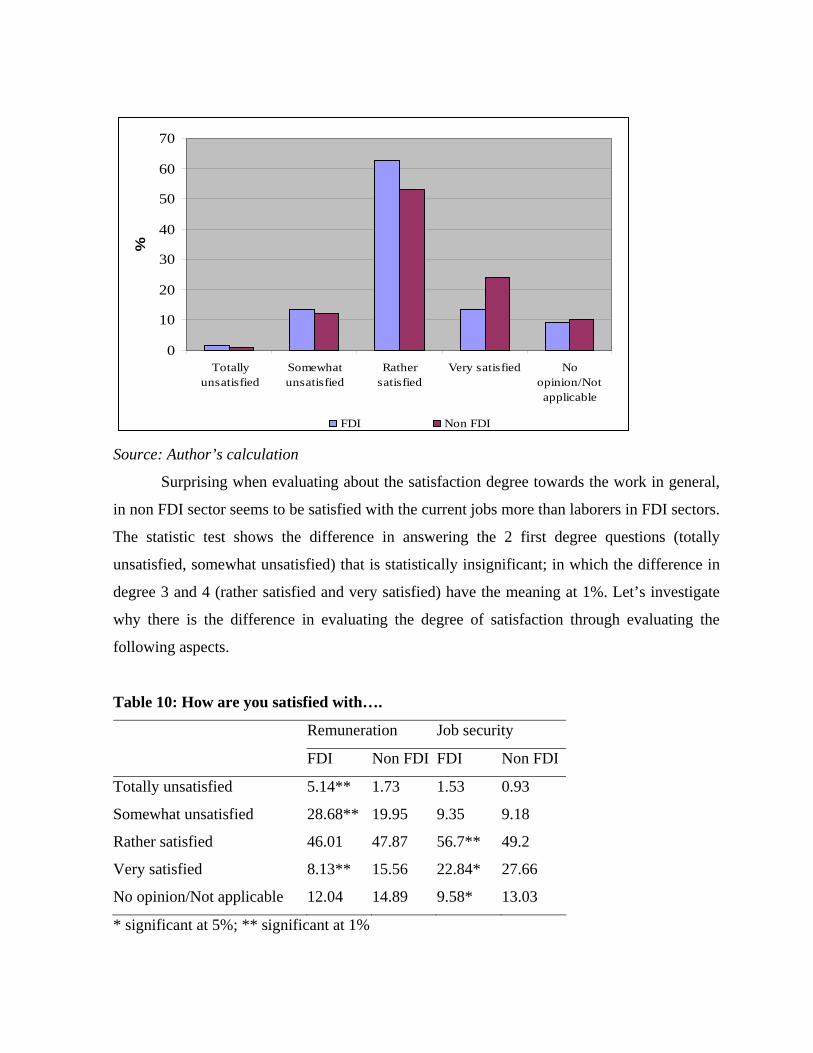
Figure 1: Generally, how are you satisfied with your job in the current firm?
0
10
20
30
40
50
60
70
Totallyunsatisfied
Somewhatunsatisfied
Rathersatisfied
Very satisfied Noopinion/Notapplicable
%
FDI Non FDI Source: Author’s calculation
Surprising when evaluating about the satisfaction degree towards the work in general,
in non FDI sector seems to be satisfied with the current jobs more than laborers in FDI sectors.
The statistic test shows the difference in answering the 2 first degree questions (totally
unsatisfied, somewhat unsatisfied) that is statistically insignificant; in which the difference in
degree 3 and 4 (rather satisfied and very satisfied) have the meaning at 1%. Let’s investigate
why there is the difference in evaluating the degree of satisfaction through evaluating the
following aspects.
Table 10: How are you satisfied with….
Remuneration Job security
FDI Non FDI FDI Non FDI
Totally unsatisfied 5.14** 1.73 1.53 0.93
Somewhat unsatisfied 28.68** 19.95 9.35 9.18
Rather satisfied 46.01 47.87 56.7** 49.2
Very satisfied 8.13** 15.56 22.84* 27.66
No opinion/Not applicable 12.04 14.89 9.58* 13.03
* significant at 5%; ** significant at 1%
Source: Author’s calculation
Considering remuneration and job security, the laborers in non FDI feel more very
satisfied then those in FDI. When evaluating about remuneration, there are 15.56% laborers in
non FDI feel satisfied compared with 8.13% in FDI sector, on the contrary 5.14% and 28.68%
in FDI sector feel totally dissatisfied and a bit dissatisfied with remuneration compared with
1.73% and 19.95 in non FDI sector. The remarkable thing is this difference is meaningful
statistically. For the evaluation about job security, the rate of laborers in non FDI who feel
quite satisfied is much higher than the ones in non FDI on the rate of very satisfied in non FDI
is still higher.
Table 11: How are you satisfied with….
Promotion Training Fringe benefit
FDI Non FDI FDI Non FDI FDI Non FDI
Totally unsatisfied 3.54 2.27 5.89** 3.08 7.97** 2.26
Somewhat unsatisfied 16.09** 11.47 13.72** 9.25 18.85** 12.77
Rather satisfied 37.72** 31.6 32.25 29.62 39.77* 34.71
Very satisfied 8.47** 13.33 11.01 13.14 11.65 13.96
No opinion/Not applicable 34.18** 41.33 37.13** 44.91 21.76** 36.3
* significant at 5%; ** significant at 1%
Source: Author’s calculation
The results of evaluations on satisfaction of other aspects of jobs are presented in table
10. Once more, we can see that the rate of laborers in FDI sector evaluate the very satisfied
with promotion, training and fringe benefit is higher than laborers in non FDI. However, the
rate of laborers in non FDI sector who are very satisfied with promotion, training and fringe
benefit is higher than laborers in FDI sector although there is only the differences in
evaluation of satisfaction with promotion has statistic meaning.
To facilitate the analysis, we rescale into 3 categories: dissatisfaction, satisfaction and
no answer like in the following figure. In general, except remuneration, other evaluation items
show the labor rate in FDI who feel satisfied with present job is higher. Here, the satisfaction
of laborer of non FDI sector with remuneration may be contradictory with the above
quantitative analysis (showing return to human capital of FDI sector higher than non FDI, and
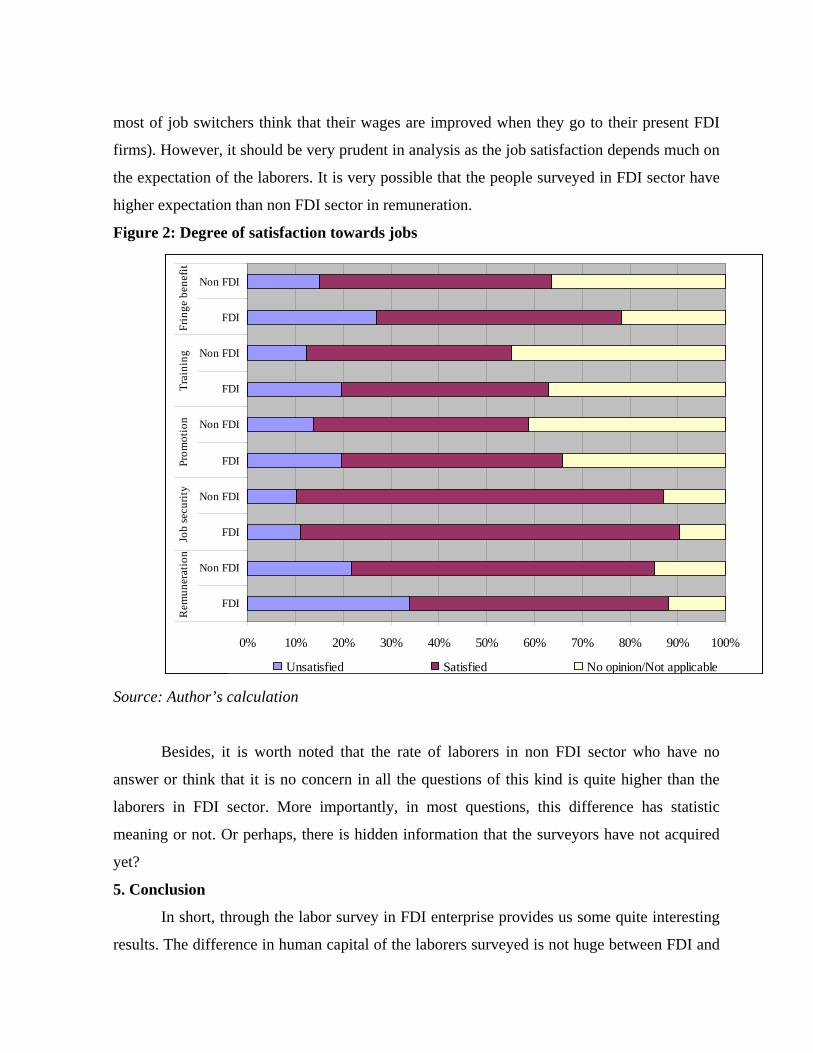
most of job switchers think that their wages are improved when they go to their present FDI
firms). However, it should be very prudent in analysis as the job satisfaction depends much on
the expectation of the laborers. It is very possible that the people surveyed in FDI sector have
higher expectation than non FDI sector in remuneration.
Figure 2: Degree of satisfaction towards jobs
0% 10% 20% 30% 40% 50% 60% 70% 80% 90% 100%
FDI
Non FDI
FDI
Non FDI
FDI
Non FDI
FDI
Non FDI
FDI
Non FDI
Rem
uner
atio
nJo
b se
curit
yPr
omot
ion
Trai
ning
Frin
ge b
enef
it
Unsatisfied Satisfied No opinion/Not applicable Source: Author’s calculation
Besides, it is worth noted that the rate of laborers in non FDI sector who have no
answer or think that it is no concern in all the questions of this kind is quite higher than the
laborers in FDI sector. More importantly, in most questions, this difference has statistic
meaning or not. Or perhaps, there is hidden information that the surveyors have not acquired
yet?
5. Conclusion
In short, through the labor survey in FDI enterprise provides us some quite interesting
results. The difference in human capital of the laborers surveyed is not huge between FDI and
non FDI. The reason is mostly due to the sampling strategy: selecting according to jobs and
the jobs itself has certain relationship with human capital such as qualification, experience.
Despite that, the result of data analysis shows that there is difference in wages between the
laborers in FDI and non FDI sectors. This difference is mostly due to return to workers’
endowment especially return to education and high job position (i.e. management job). This
result is also correct when we do analysis with regressions with firm characteristics after
controlling firm fixed effects. The higher wage rate is also a boosting element for laborers
immigrating between regions and job shifting. Most of laborers who shift to the present job
who are working in FDI are those who have worked in other firms. Besides it is worth noting
that when the laborers are surveyed in FDI firms have lower average age but the rate of
migration is higher than those in non FDI. Therefore, efforts should be made to avoid labor
market segmentation when FDI may dominate whole segments of the market for skills.
Considering from the non-monetary aspect, FDI laborers tend to be higher trained,
especially trained on the job. This distinction is meaningful statistically. However, when
answering quantitative questions about job satisfaction about eh degree of job satisfaction, the
rate of laborers surveyed in non FDI evaluate very satisfied are higher than laborers in FDI
sector, although considering in general, the rate of laborers in FDI who are satisfied with jobs
are still higher (except the item of remuneration). The rate of laborers surveyed in non FDI
who give no answer about job satisfaction is quite high and is different meaningfully in
statistics show that there is “hidden” information that the survey have not covered. Moreover,
the job satisfaction depends much on the expectation of the laborers rather than the actual
working conditions.
This paper is based in the data acquired from the survey and tries to maximum the
exploitation of data to consider the effect of FDI firms towards the labor market in Viet Nam
through the analysis of the relationship between the existence of FDI enterprise, wages and
jobs of the laborers. In short, through the view angle of the laborers from this survey, the
working condition (e.g. training) and wages in FDI is much highlighted than in non FDI
sectors. More importantly is the appearance of FDI firms that have relationship with the
migration between regions and the job shifting of the laborers. The appearance of more and
more FDI firms will make the labor market in Vietnam more exciting and seem to have
positive effect on the human capital accumulation of Vietnamese laborers. Therefore, to make

FDI work for all, government policies have been made to improve quality of human resources.
This is the most effective and efficient way to absorb the effects of rising FDI inflows.
Reference
Aitken, Brian, Harrison, Ann E. and Lipsey, Robert E., "Wages and Foreign Ownership: A
Comparative Study of Mexico, Venezuela and the United States" (1995-05-01). NBER
Working Paper No. W5102. Available at SSRN: http://ssrn.com/abstract=225167
Fosfuri, A., M. Motta, and T. Rønde (2001): “Foreign Direct Investment and Spillovers
through Workers Mobility,” Journal of International Economics, 53(1), 205–222
Glass, Amy Jocelyn & Saggi, Kamal, 1999. "Multinational firms and technology transfer,"
Policy Research Working Paper Series 2067, The World Bank.
Glass, Amy Jocelyn & Saggi, Kamal, 2002. “Multinational Firms and Technology Transfer,"
Scandinavian Journal of Economics, Blackwell Publishing, vol. 104(4), pages 495-513,
December.
Grossman, Gene and Elhanan Helpman (1991) " Quality Ladders and Product Cycles",
Quarterly Journal of Economies. 106, 557-586
Grossman, Gene and Elhanan Helpman ()1991 " Innovation and Growth in the Global
Economy", Cambridge, MIT Press.
Lucas, Robert (1993) "Making a Miracle" Econometric Vol 61 NO 2 March P 251-272
Owen A.L and Yu B.Y (2003) Wage Inequality between Skilled and Unskilled Workers in
China, Working Papers, Hamilton College
te Velde D.W and Morrisey O. (2002) Foreign Direct Investment, Skills and Wage Inequality
in East Asia’, Journal of. the Asia-Pacific Economy, 9:3, 348-369
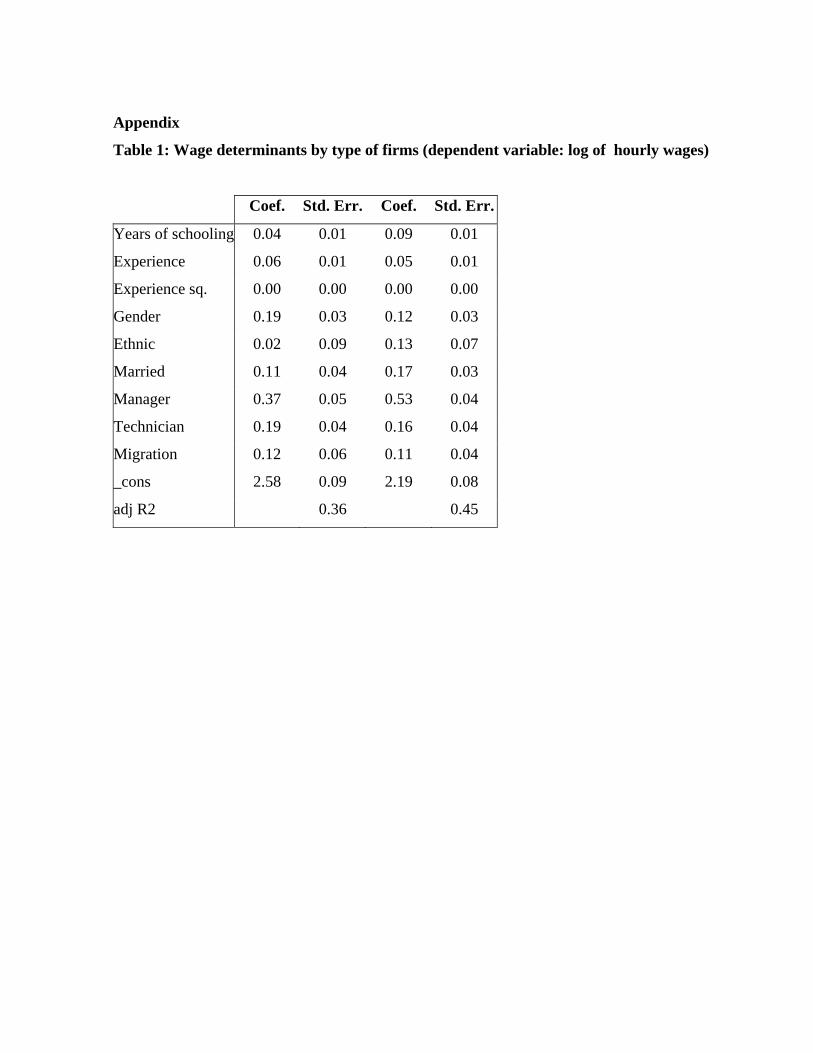
Appendix
Table 1: Wage determinants by type of firms (dependent variable: log of hourly wages)
Coef. Std. Err. Coef. Std. Err.
Years of schooling 0.04 0.01 0.09 0.01
Experience 0.06 0.01 0.05 0.01
Experience sq. 0.00 0.00 0.00 0.00
Gender 0.19 0.03 0.12 0.03
Ethnic 0.02 0.09 0.13 0.07
Married 0.11 0.04 0.17 0.03
Manager 0.37 0.05 0.53 0.04
Technician 0.19 0.04 0.16 0.04
Migration 0.12 0.06 0.11 0.04
_cons 2.58 0.09 2.19 0.08
adj R2 0.36 0.45
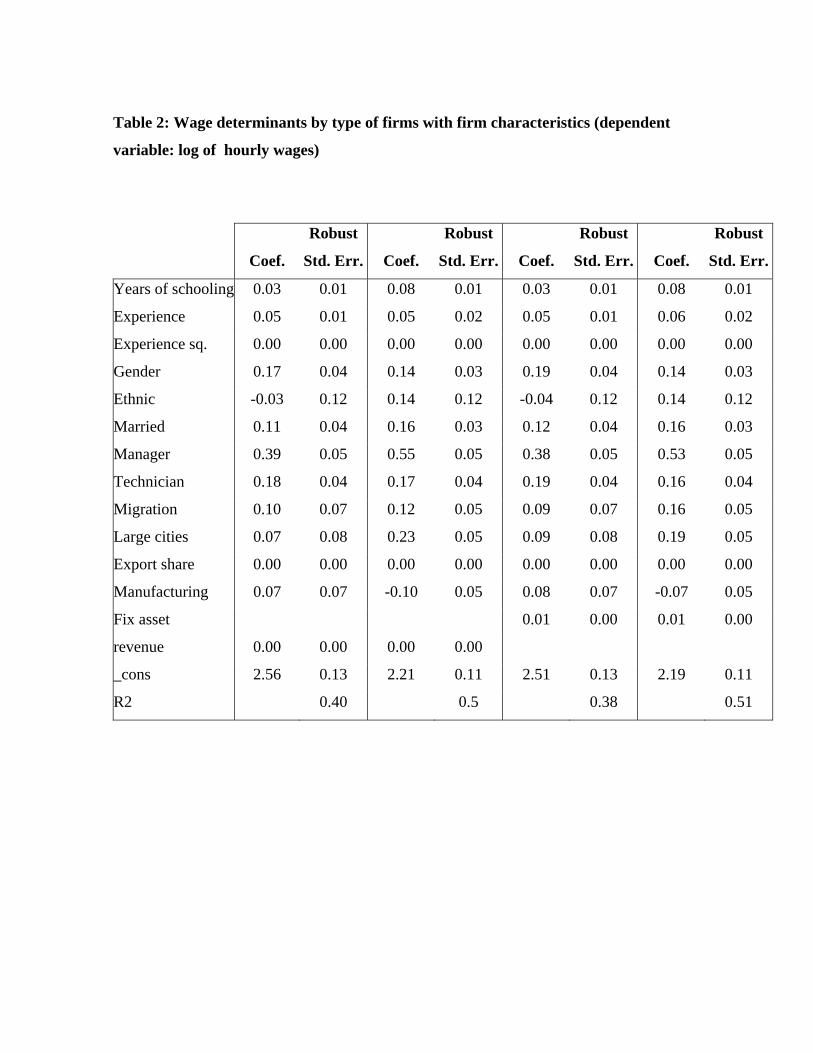
Table 2: Wage determinants by type of firms with firm characteristics (dependent
variable: log of hourly wages)
Robust Robust Robust Robust
Coef. Std. Err. Coef. Std. Err. Coef. Std. Err. Coef. Std. Err.
Years of schooling 0.03 0.01 0.08 0.01 0.03 0.01 0.08 0.01
Experience 0.05 0.01 0.05 0.02 0.05 0.01 0.06 0.02
Experience sq. 0.00 0.00 0.00 0.00 0.00 0.00 0.00 0.00
Gender 0.17 0.04 0.14 0.03 0.19 0.04 0.14 0.03
Ethnic -0.03 0.12 0.14 0.12 -0.04 0.12 0.14 0.12
Married 0.11 0.04 0.16 0.03 0.12 0.04 0.16 0.03
Manager 0.39 0.05 0.55 0.05 0.38 0.05 0.53 0.05
Technician 0.18 0.04 0.17 0.04 0.19 0.04 0.16 0.04
Migration 0.10 0.07 0.12 0.05 0.09 0.07 0.16 0.05
Large cities 0.07 0.08 0.23 0.05 0.09 0.08 0.19 0.05
Export share 0.00 0.00 0.00 0.00 0.00 0.00 0.00 0.00
Manufacturing 0.07 0.07 -0.10 0.05 0.08 0.07 -0.07 0.05
Fix asset 0.01 0.00 0.01 0.00
revenue 0.00 0.00 0.00 0.00
_cons 2.56 0.13 2.21 0.11 2.51 0.13 2.19 0.11
R2 0.40 0.5 0.38 0.51