Embed Size (px)
Citation preview

THE INDUSTRIAL INSTITUTE FOR ECONOMIC AND SOCIAL RESEARCH
WORKING PAPER No. 468, 1996
FOREIGN DIRECT INVESTMENT, CAPITAL FORMATION AND LABOUR COSTS: THEORY AND EVIDENCE FOR GERMANY BY JAN HATZIUS

Foreign Direct Investment, Capita} Formation and Labour Costs: Theory and Evidence for Germany
Jan Hatzius* Centre for Economic Performance
London School of Economics September 1996
Abstract: This paper shows that the liberalisation of foreign direct investment (FDI) tends to make the effect of labour costs on domestic investment and labour demand more negative. Using data from Germany, it then provides evidence that is consistent with this view. First, high unit labour costs increase FDI outflows and lower FDI inflows. Second, the effect of unit labour costs on domestic manufacturing investment was more negative in the high-FDI 1980s than in the low-FDI 1970s, and this change was concentrated in high-FDI industries. The implied effect on long-run labour demand is substantial.
* Centre for Economic Performance, London School of Economics, Houghton Street, London WC2A 2AE, Tel. 0171-9556718, Fax 0171-9557595, e-mail [email protected]


1
1. Introduction
Open any German newspaper, and you are likely to fmd an artic1e on the demise of
Standort Deutschland (location Germany). Two facts, perhaps above all, worry the nation's
business writers: high labour costs, and large net outflows of foreign direct investment (FDI).
Together, these are taken as evidence that finns are leaving Germany in response to excessive
cost leveis. Since an exodus of frrms reduces domestic labour demand, it is often argued that
"globalisation" has made wage moderation more important for preserving employment.
The underlying argument is perfectly consistent with standard labour demand theory.
Hicks notes in The Theory of Wages that "[t]he demand for anything is likely to be more
e1astic, the more elastic is the supply of co-operant agents of production" (Hicks, 1932, p.
242). Hence, if the domestic capital stock becomes more elastic with respect to labour costs as
barriers to FDI fall, the long-run demand for labour will also become more elastic. In this
sense, the popular wisdom that globalisation makes wage restraint more important for
employment is right on the mark. Of course, whether this effect is quantitatively important is a
purely empirical question.
Using a very simple mode1 of the multinational corporation (MNC) , this paper frrst
shows that falling barriers to foreign direct investment make the effect of higher labour costs
on investment, the capital stock, and the demand for labour more negative. It then provides
evidence that such a shift has indeed taken place in Germany, and that its pattem is consistent
with a causal role of greater openness to FDI. In quantitative terms, the paper fmds that the
implications of growing FDI are substantial.

2
2. Motivation
The share of gross domestic fixed capital formation in Gennan GDP was 20.9 percent
in 1992, which is elose to the OECD average (OECD, 1995a). The investment rate has
decreased somewhat since the early 1970s, when it was around 25 percent, but has shown
little trend since the recession of 1973174 (OECD, various years). FDI flows have shown a
very interesting pattern in recent years, with outflows of around DM 30 billion per year, or
one percent of GDP, and almost negligible inflows (OECD, 1995b). This irnbalance has
aroused concern about Germany' s future as a production location, but it is irnportant to note
that countries such as Britain, the Netherlands, or Switzerland typically have much higher net
FDI outflows relative to their GDP (OECD, 1995b). Nevertheless, net annual FDI outflows
equal to about flve percent of domestic investment can make a noticeable irnpact on the long
run capital stock.
Globally, FDI has grown drarnatically since the early 1980s. The combined annual
outflows from OECD countries (ineluding flows within the OECD) have increased from less
than $30 billion before 1983 to over $160 billion in every year since 1988. It seems elear that
deregulation has played its part in this process. The United Nations Transnational
Corporations Division (UNTCD, 1993) finds that with the abolition of exchange controls in
Europe during the 1980s, outward FDI is essentially only subject to market forces. Some
controls on inward FDI remain in various countries, but the liberalisation trend that ''began in
the mid-1970s has continued through the 1980s and early 1990s" (UNTCD, 1993, p. 17). In
addition, trade restrictions have fallen, through both GATT and regional institutions such as
the European Community. The irnpact on FDI is theoretically ambiguous. Falling trade costs

3
increase ''vertical'' FDI, which is driven by production cost considerations, but reduce
"horizontal" FOI, which is motivated by market access considerations (Markusen et al., 1996).
The analysis of the causes and effects of foreign direct investment is notorious for
identification problems. One study may regress FDI on wages, while the next may explain
wages by FDI intensity. Since suitable instruments are typically hard to fmd, this is a serious
econometric problem To see what is at issue, it is useful to distinguish between two
hypothetical cases. In the frrst case, falling FOI barriers prompt frrms to exploit opportunities,
such as tax and labour cost differentials, that were formerly closed to them. In such a situation,
it may be appropriate to view FDI as essentially exogenous and focus on its effects. For
instance, Feenstra and Hanson (1995) exarnine the effects of American FOI flows to Mexico,
noting that Mexico's progressive liberalisation made it possible for American frrms to exploit
the huge labour cost differential between the two countries. I
In the second case, changes in economie variables such as demand, labour costs, or
taxes, bring about changes in the geographic structure of production, while the level of FOI
barriers remains unchanged. In this situation, FDI must be explained endogenously by the
economie variables and attention naturally focuses on the determinants of FDI. However, a
I In other cases, the assumption of exogenous foreign activity is harder to justify. For instance, Lipsey (1995) regresses the domestic employment of American MNCs on affiliate sales. As Brainard (1995) points out, such a regression may weIl suffer from simultaneity bias. For instance, an unobserved positive shock to the demand for an MNC's products would be expected to increase both foreign and domestic activity.

4
regression of FDI on wages or taxes will only yield the desired result if FDI restrictions are in
fact constant across the sample, or at least uncorrelated with the economic variables.2
This paper aims to inte grate the se two modes of analysis by exarnining whether lower
FDI barriers have made the effect of labour costs on investment, and by implication labour
demand, more negative. This hypothesis seems to underlie the popular notion that
"globalisation" has made wage moderation more important for keeping fInns from mo ving
abroad. The approach to identillcation is as follows: The paper assumes FDI barriers to be
prohibitive in the 1970s, but much lower and relatively constant in the 1980s.3 It then
estimates the effects of unit labour costs on FDI tlows during the 1980s, and calculates the
implied change in the effect of labour costs on domestic investment under the assumption that
net FDI intlows increase domestic investment one-for-one.4 To get more independent evidence
on whether the investment elasticity has changed, however, the fifth section estimates the
effect of unit labour costs on industry gross capital formation in the 1970s and the 1980s.
2 The large literature on the effects of labour costs on FDI flows falls into this category. Recent examples include Cushman (1987), Culem (1988), Lucas (1993), Moore (1993), Pain (1993), Klein and Rosengren (1994), Bajo-Rubio and Sosvilla-Rivero (1994), Barrell and Pain (1996), and Wang and Swain (1996). While the effects are not always significant, most of these studies fmd that higher labour costs increase outward or reduce inward FDI.
3 These assumptions are considerable simplifications; in reality, the fall in FDI barriers was more gradual. Nevertheless, the survey in UNTCD (1993) notes that many important changes took place in the earIy 1980s, such as the abolition of exchange controis in Europe.
4 Is this assumption tenable? It is easy to think: of counterexampIes. In fact, Graham (1995) argues that in general FDI should be viewed as a source of funds and not a use of funds. Re fmds that in the case of US-owned foreign subsidiaries, the short-ron effect of FDI tlows on the subsidiary' s fixed investment is significantly positive, but less than unity. Using aggregate FDI flows for all OECD countries, by contrast, Feldstein (1995) fmds that net FDI outflows translate straight inta lower domestic investment in the long-ron, and he cannot reject a one-for-one relationship. I assume that Feldstein' s resuIt holds for my sample.

5
If FDI liberalisation has made the effect of labour costs on domestic investment more
negative, this has irnportant irnplications for the slope of the long-run labour demand curve.
For illustration, assurne that FDI liberalisation changes the elasticity of domestic investment
with respect to labour costs from zero to minus unity. Since gross investrnent is proportional
to the capital stock in the long-run, which in tum is proportional to labour dernand under
constant retums, the labour demand elasticity will rise by one in absolute terrns.5
3. Theory
In an open economy, rising labour costs tend to reduce labour demand for three
reasons. First, the typical domestic frrrn produces less output in response to higher unit costs
(the output or scale effect). Second, capital is substituted for labour (the substitution effect).
And third, some frrrns may move abroad (the location effect). This section provides a model
showing that the location effect tends to become larger as the barriers to FDI fall. The output
and substitution effects, which are less likely to be affected by "globalisation", are neglected
for simplicity .
The idea underlying the model is as follows. With high FDI barriers, only very few
frrrns will consider relocating in response to a small change in production costs. As FDI
barriers fall, however, the number of frrrns that are roughly indifferent between two locations
increases, and the same cost change will induce more frrrns to move. In the lirniting case of
5 Note that Kl = I t + 8/(t-l' where K, I, and 8 denote the capital stock, gross investment,
and the depreciation rate. In a steady state, where K and I are constant, K = (l / 8) .

6
zero relocation costs, a change in production costs may lead all finns to relocate. Hence, the
e1asticity of the capital stock and labour demand with respect to production costs rises as
relocation costs fall.
The model contains two countries, h and f. Each has a large number of fInns that
produce under constant returns to scale and sell their products in both countries. Sales in each
market are given, production is Leontief, technology is identical across countries, and capital
is bought at a constant price and then deployed wherever production is to take place.
However, both wages and worker effectiveness differ between countries. Under these
conditions, unit labour costs, Ch and Cj, are sufficient to describe the relative costs of
production in different countries.
In addition, whenever a fum produces in a country different from that of fmal sale, it
incurs a trade cost of t per unit of output which may reflect either transport costs or barriers to
trade. Finally, a frrm that produces outside its home country incurs a frrm-specifIc "FOI cost"
of (/J. This cost captures both administrative barriers to FOI and the difficulty of producing
abroad instead of at home. Strictly speaking, (/J is a cost of foreign production rather than
investment. In the remainder, however, it will be called the leve1 of "FOI barriers" , as the costs
of relocation and foreign production are essentially the same in a static mode1.6
6 In reality, it is likely that the costs of foreign production are less than proportional to output, and it may actually be more appropriate to assume them to be flxed. However, the present formulation is much simpl~r because it keeps total unit costs constant, and shares the prediction that a given flrm' s production for a given market will take place in only one country.

7
FOI barri~rs vary with a number of factors specific to the home and destination
countries, the industry, and the flnn itself. These inc1ude the similarity of labour force skills
between countries, industry-specific barriers to foreign activity such as national ownership
requirements, the capability of managers to oversee foreign operations, and no doubt many
others. To capture the wide variation in frrms' costs of producing abroad, I assurne that </> is
distributed normally with expectation Il and variance el. Note that this allows for negative
values of </> which indicate that a flrm flnds production conditions (after controlling for unit
labour costs) more favourable abroad than at horne. As an example, a British manager in
charge of an American flrm may be more familiar with the British regulatory environment and,
all else equal, might prefer to invest in Britain.
The four conditions that indicate whether an h or J flnn, respectively, that sells in
market h or J, respectively, will produce in country h, are obtained by adding the three cost
components described above. Assurne for convenience that flnns will produce in h if total
costs are less than or equal to costs in J. An h fmn selling in h will produce in h as long as
Ch - C f :S t + t/J , while an h fInn selling inJ will produce in h if Ch - C f :S -t + t/J • Equivalent
conditions hold for country J flrms. Together with the distributional assumptions about </>, this
implies that the proportion of country h frrms that carry out their production for market h in
country h is given by
where FSN [.] refers to the standard Donnal cumulative distribution function. Similar
relationships hold for the other three cases. A fall in average FDI barriers raises the proportion

8
of h frrms that move production to f and vice versa; if Ch exceeds CJ initially, so that more h
finns produce in f than vice versa, such a fall causes a net reduction in country h labour
demand. Likewise, a rise in Ch raises the proportion of h finns that move production to f and
lowers the proportion of f finns that move production to h; this obviously lowers labour
demand in country h.
A more interesting question is how the effect of labour costs on domestic labour
demand changes as the barriers to FDI fall. A sufficient condition for the cross-partial
derivative of ehhh with respect to labour costs and average FDI barriers to be negative is that
ehhh exceeds one-half initially, so that a finn with lP = f.l produces in h. In this case, lower FDI
barriers will always make the effect of higher domestic labour costs on domestic labour
demand more negative.
Similar results hold for the other three cases, namely h finns producing for market j,
andjfrrms producing for markets h andj. The effect offalling FDI barriers on the total labour
demand effect of labour costs is given by the sum of all four second derivatives. A sufficient
condition for this sum to be negative is that f3"fh and 8p,J both exceed one-half or - assuming
constant frrm size - each country exports more than its foreign subsidiaries produce for the
foreign market. This condition is more likely to hold the higher are average FDI barriers
relative to transport costs. Hence, a partial dismantling of high FDI barriers under relatively
free trade will increase the effect of costs on labour demand. In the last thirty years, this has
arguably been the relevant case for most industrial economies.

9
4. Evidence: Foreign Investment
4.1 Approach and Specification
The effect of unit labour costs on FOI is estimated from a standard partial-equilibrium
factor demand equation relating the foreign investment to unit labour costs and other controi
variables Zijt. The basic equation is given by
(1)
where FDI denotes FOI flows as a percentage of foreign GDP; w, pr, and e denote labour
costs, labour productivity, and the exchange rate; the subscripts i, j, and t denote the source
country, the destination country, and time; X denotes other controi variables that may
influence FOI; and e denotes an i. i. d. error term. The construction of the data set is
described in the data appendix.
The dependent variable is based on aggregate bilateral flows between Germany and the
partner country.7 It is defined in two alternative ways, nameiyasthe real FOI flow and the first
difference of the real FOI stock. Both measures are used in order to determine whether the
results are sensitive to the exact definition of FOI. 8 The main explanatory variable is log
7 Aggregate FDI data are not ideal. The location effect on labour demand is unlikely to matter much outside manufacturing since services must usually be produced at the point of sale. However, only aggregate data are available disaggregated by country for a sufficiently long time period.
8 In princip le, flows should correspond to differenced stocks in real terms if exchange rate fluctuations are controlled for and both measures include retained earnings. But the two series differ substantially in practice, as shown in Charts 1 and 2. Stock data are taken from an annual surveyof investors and refer to book values, while flow data are based on the balance of payments and are made

10
relative unit labour cost at rnarket exchange rates, defmed as the log annual labour cost
difference minus the trend productivity difference between source and destination country.
The idea is that high labour costs will only be detrimental to investment if they are not
matched by high labour productivity.9
One other variable which tums out to be important is a dummy denoting European
Community (EC) membership. It is entered both on its own and interacted with the labour cost
variable, to test the hypothesis that EC membership may not only raise FOI flows per se, but
also facilitate cost-induced relocation and thus reinforce the effect of labour costs. For
instance, the absence of trade barriers within the EC should make it easier for frrms to locate
the production of intermediate products on the basis of relative cost leveIs. As further controI
variables, 1 inc1ude the deviation of GDP from trend in the source and destination country to
controi for short-term business cyc1e fluctuations; the relative number of days lost to strikes
and lockouts to controI for the industrial relations climate; and the relative real long-term
interest rate to controi for differences in the return to financial assets across countries.
In addition, I include two full sets of dummy variables in all equations presented below.
The first set consists of either country or bilateral dummies. In the basic specification, country
dummies controi for fixed characteristics that affect both inflows and outflows in the same
up of equity flows, inter-company loans, and retained eamings attributable to the parent company (see UNTCD, 1993).
9 Unit labour costs are assumed to be exogenous to foreign investment decisions. It is certainly possible to think of situations in which this condition is violated. Perhaps most plausibly, net FOI inflows may appreciate the currency, thus raising unit labour costs and biasing the estimated coefficient towards zero. Unfortunately, suitable instruments - variables that affect unit labour costs without affecting FDI directly - are hard to fmd. Note that Cushman (1987) fmds little evidence for simultaneity of labour costs, exchange rates, and American FDI flows.

11
direction, such as distance. Bilateral dummies, which are less restrictive, controi for fixed
characteristics that may affect only one tlow, such as one-way barriers to FDI intlows.
Comparing the estirnates, one can see whether the results of the basic specification remain
. intact when attention is restricted only to time-series information. In addition, time dummies
are inc1uded in all equations to controi for unobserved factors that drive the international
propensity to invest abroad and may be partly responsible for the FDI surge in the late 1980s.
4.2 Results
Charts 1 and 2 show the evolution of total German FDI outtlows and intlows vis-a-vis
all the countries in the data set. Both defmitions of FDI tlows are shown, actual tlows and
differenced FDI stocks. Both outtlows and intlows are substantially higher when measured as
the change in the real FDI stock. The difference is dramatic for intlows: while the tlow data
indicate almost negligible FDI intlows for much of the sample period, the inward FDI stock
grows quite rapidly, at least between 1989 and 1991. There are two possible reasons for this
difference, namely underreporting of retained earnings in the tlow data and valuation
adjustments to the stock data. Both would explain why the discrepancy between the two series
is procyclical. Because of the important differences between the two series, I proceed to
analyse both.
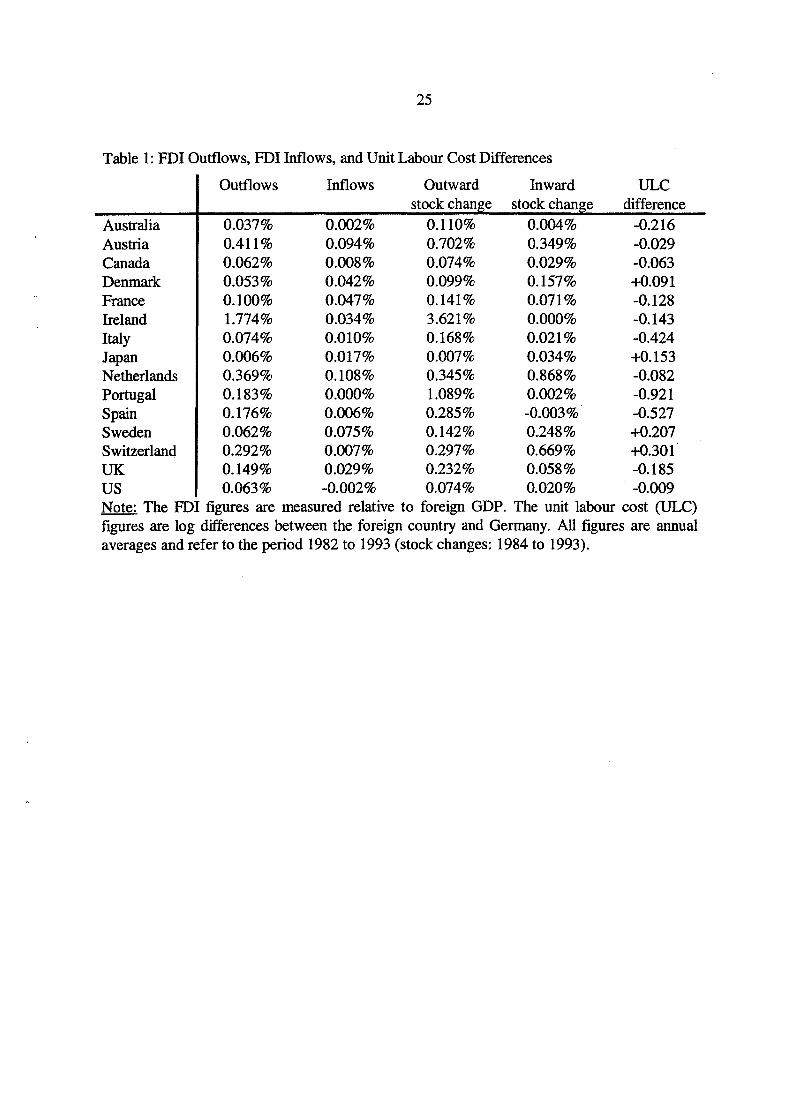
Next, Table 1 gives country averages for FDI outtlows and intlows relative to foreign
GDP, as weIl as unit labour costs relative to Germany. It is c1ear that both outtlows and
intlows, but particularly the latter, are larger on average when measured as a stock change.
This retlects both the usual excess of stock changes over recorded tlows noted above, and the

12
fact that the stock change is measured only from 1984 onwards and thus leaves out two low-
FOI years.
Looking at Table 1, there is an obvious cross-sectional correlation between low unit
labour costs and net FOI inflows. All countries with lower unit labour costs than Germany -
except the Netherlands when looking at stock differences - receive net FOI inflows from
Germany. By contrast, all countries with higher unit labour costs - except Switzerland when
looking at the flow data - provide net FOI outflows to Germany .
Tables 2 and 3 provide more systematic evidence in the form of econometric FOI
equations. In Table 2, the dependent variable is real FOI flows, while in Table 3 it is the
change in real FOI stocks. Bquation (1) in both tables shows the simple regression of FOI on
relative unit labour costs. The coefficient is positive and significant, although only at the ten
percent level for FOI flows. IO Bquation (2) includes a dummy variable indicating BC
membership and interacts it with the labour cost variable. While BC membership seems to
have no effect per se, the unit labour cost effect is much larger and significant only within the
Be. This is intuitively appealing and consistent with the hypothesis that free trade and
geographical proximity facilitate cost-induced relocation. Column (3) adds bilateral dummies
to the equation and thus excludes all cross-sectional information from the analysis. This makes
most of the estimates insignificant, but it does not change the labour cost point esti,mates
dramatically. While time-series variability alone seems to provide too little information for
10 The restrictions that a) produetivity and real labour eost effects are opposite and equal, and b) real exehange rate and domestie unit labour eost effects are equal, eannot be rejected. Henee, the relative unit labour eost specifieation is eonsistent with the data.

13
estimating the determinants of IDI, there is no evidence that using cross-sectional information
biases the estimates.
Columns (4) and (5) add the deviation of output from trend to controI for business
cyc1e effects, a modification which hardly affects the unit labour cost effects. Destination
country output has a positive and borderline significant effect in the stock estimates. This may
be expected if the main difference between the flow and differenced stock data is that the latter
better capture retained earnings. Columns (6) and (7) add the relative number of days lost to
strikes and lockouts and relative real interest rates as additional controi variables. Again, their
inc1usion only has a limited effect on the labour cost variables, but bad labour relations seem to
repel, and higher interest rates to attract, foreign capital. 11 Overall, the effect of unit labour
costs in each table is remarkably stable across specifications.
However, the estimates are much larger in Table 3 than in Table 2. While this is not
surprising in the light of Charts 1 and 2, where IDI stock differences look like a magnified
IDI flow series (at least as far as inflows to Germany are concemed), it would be useful to
know which set of results is preferable. If the two series differ prirnarily because retained
earnings are only imperfectly captured in the flow data, the answer depends on whether the
retained earnings component of IDI contributes to physical investment in the same way as
cross-border capital flows. Feldstein's (1995) evidence supports this view. Based on his
results, the stock estimates seem preferable under the assumption that they differ from flows
11 One may be concemed that the significant effect of unit labour costs is driven by Germany's large FDI outtlows to Ireland shown in Table 1. However, while excluding Ireland lowers the point estimates, it actually increases the marginal significance levels of the labour cost variables. No other single country has a substantial effect on either the point estimates or their standard errors.

14
primarily because of retained earnings. To illustrate the range of possible results, however,
both sets of results are used in the following calculations.
Let us calculate by how much a one-percent increase in labour costs reduces net FDI
inflows, using the estimates in column (2) of Tables 2 and 3 which fmd a significant labour
cost effect only for the EC. In 1993, the combined GDP of the EC countries in the sample was
DM 12,700 billion (in 1985 prices). The estimates therefore imply that FDI outflows rise, and
inflows fall, by between DM 381 million and DM 898 million in response to a one-percent
labour cost increase. Hence, net FDI inflows fall by between DM 762 million and DM 1,796
million, or between 0.3 and 0.7 percent of Germany's aggregate 1993 investment (excluding
dwellings) of DM 259 billion. If net FDI inflows contribute one-for-one to domestic capital
formation, the elasticity of investment with respect to labour costs is therefore between 0.3
and 0.7 higher (in absolute terms) than it would be in the absence of FDI opportunities.
Indeed, the effect may be even stronger in manufacturing. It is likely that capital
relocation is largely confined to that sector because service industries offer little scope for
relocating production away from the point of fmal sale. Manufacturing investment was equal
to DM 70.7 billion in 1993. Under the extreme assumption that the net outflow takes place
exclusively in manufacturing, the elasticity of manufacturing investment with respect to labour
costs is 1.1 to 2.5 higher (in absolute terms) than it would be in the absence of FDI
opportunities.
Summing up, there is fairly strong evidence that labour costs affect FDI flows in the
expected direction. As a consequence, the growing importance of foreign investment should
have increased the effect of labour costs on domestic investment, provided net FDI inflows

15
contribute to domestic capita! formation. In quantitative terms, the estimates imply that the
liberalisation of FDI has increased the whole-economy investment elasticity by between 0.3
and 0.7 (in absolute terms). However, the effect in manufacturing may be substantially larger if
cost-induced relocation is largely confined to this sector.
5. Evidence: Domestic Investment
5.1 Approach and Specification
The previous section has dealt with the question whether aggregate FDI flows are
consistent with the idea that greater FDI openness has made investment more responsive to
labour costs, assuming that net FDI contributes to domestic investment one-for-one. This
section pursues a more direct avenue. On the basis of inward and outward FDI data by
industry, which are taken from Deutsche Bundesbank (1995), I classify 26 manufacturing
industries according to their FDI intensity (low, medium, or high). Using data for the period
1970 to 1991, I then examine whether investment has become more responsive to labour costs
from the low-FDI 1970s to the high-FDI 1980s and, if so, whether the increasing
responsiveness is concentrated in high-FDI industries.12
12 Why not estimate the determinants of foreign and dornestic investment jointly? First, while measured FDI flows may eventually induce physical investment (Feldstein, 1995), the two measures are conceptually quite different. Hence, one should be careful in pooling foreign and dornestic investment data. Second, the FDI data are c1assified according to the Bundesbank's industry c1assification, while the remaining data are based on ISIC, Rev. 2. As a consequence, the c1assification of industries according to their FDI intensity is only approximate in some cases. Third, consistent FDI data by industry are only available since 1986.

16
Industry FDI intensity was defmed as the 1991 ratio of the inward plus outward FDI
stock, which is a useful summary statistic for past average FDI flow intensity and was taken
from Deutsche Bundesbank (1995), to gross domestic capital formation, taken from the
STAN database. Low-FDI industries (ISIC 311, 312, 313, 331, 332, 341, 342, 381) are
concentrated in the food, beverages, wood, and paper sectors, medium-FDI industries (ISIC
321, 322, 356, 361, 362, 369, 371, 372, 385) in basic textile, mineral and metal sectors, and
high-FDI industries (ISIC 314, 323, 324, 351, 352, 353, 355, 382, 383, 384) in c10thing and
leather, chemical products, and engineering sectors. In some cases, such as basic metal
industries (ISIC 37), FDI information was only available at the two-digit level as the
Bundesbank uses an industri al c1assification that differs from ISIC.
The investment equations can be thought of as skeleton versions of those estimated in
Denny and Nickell (1992). They are obtained from regressing log investment on normalised
log unit labour costs, an industry-specific demand index, an industry-specific ftxed effect and,
in some cases, a lagged dependent variable and! or an aggregate time effect. An industry ftxed
effect is c1early necessary given the great variation in total industry investment. (Table 4 shows
manufacturing investment and unit labour costs by three-digit industry in the 1970s and the
1980s.) In the calculation of normalised unit labour costs, labour productivity is defined as the
predicted value from a regression of industry value-added per worker on a cubic trend (the
main results are robust to altering this defmition). Besides unit labour costs, all equations
contain an industry demand index that controls for the cyclical behaviour of investment. It is
defmed as the deviation of log industry value-added from a cubic trend. This variable is
preferable to total value-added because the trend component of output is c1early endogenous
to investment; however, replacing the demand variable by log value-added does not have a

17
major effect on the unit labour cost results. Time dummies controi for all aggregate variables
that may influence industry investment, such as aggregate demand, interest rates, the exchange
rate, and possibly "animal spirits". A lagged dependent variable allows for sluggish adjustment
in investment rates. All equations are estimated by the least-squares dummy-variable (LSDV)
estimator.13
5.2 Results
The regression results are contained in Tables 5 to 8. Table 5 shows the results for the
whole sample of all 26 industries. The effect of unit labour costs on investment seems to have
become more negative in German manufacturing. While the effect is insignificant for the
1970s, it is negative and significant for the 1980s, regardless of whether a lagged dependent
variable or time dummies are included in the equation.
While this result is consistent with the hypothesis that greater openness to FDI has
increased the responsiveness of investment to labour costs, a more interesting question is
whether the change over time was concentrated in FDI-intensive industries. The results from
splitting the sample into low-FDI, medium-FDI, and high-FDI industries are shown in Tables 6
13 In a static model, the LSDV estimator is minimum variance linear unbiased under classical assumptions. In a dynamic model, the estimate on the lagged dependent variable is biased downwards (see Nickell, 1981). However, recent simulation studies by Harris and Matyas (1996) and Judson and Owen (1996) fmd that the estimates on the X variables, in which I am most interested, are very good in terms of small-sample bias and efficiency. Under a sample design similar to mine, moreover, Harris and Matyas (1996) find that the small-sample performance of the lagged dependent variable estimates is no worse than that of the most popular instrumental-variable alternatives, which typically perform poorly with a small cross-sectional dimension.

18
to 8.14 There is some evidence in Table 6 that low-FDI industries have become more
responsive to labour costs, but this result is not robust to the inclusion of time durnmies.
Hence, the negative (and very large) effect of labour costs in the 1980s seems to be driven by
an aggregate correlation between labour costs and investment activity.15 It is quite conceivable
that this correlation represents a causal relationship, but one would have more confidence in
the estimated negative effect of labour costs if it held up at the level of the individual industry
when controlling for aggregate factors.
Table 7 shows no significant effect of labour costs in medium-FDI industries in the
1970s and weak evidence for a negative effect in the 1980s, which is again not robust to the
inclusion of time dummies. However, Table 8 shows a clear change in the effect of unit labour
costs in high-FDI industries. While the effect is approximately zero for the 1970s, it is negative
and highly significant in the 1980s in the dynamic specification, regardless of whether time
dummies are included. In quantitative terms, the short-run effect of unit labour costs that are
one percent higher is to reduce investment by about one percent. The long-mn effect is
substantially larger given the sizeable coefficient on the lagged dependent variable (which in
fact is biased downwards).
The most important results in this section are that the effect of unit labour costs on
investment has become more negative in German manufacturing, and that this change is
14 An alternative procedure is to let only the unit labour eost eoefficients vary by FDI intensity while keeping all other eoeffieients the same These results are similar to those diseussed in the text and are available on request.
15 The investment rate and unit labour eost levels of the seven low-FDI industries show little trend during 1981-1985, but investment rose and unit labour costs fell substantially thereafter.

19
particularly clearly visible in high-FDI industries. It is possible that a similar change has also
taken place in low-FDI industries, but this result is less robust to reasonable changes in the
specification. Hence, the hypothesis that greater openness to FDI has increased the elasticity
of investment and labour demand to labour costs, particularly in the most affected industries,
seems to be consistent with the evidence.
The FDI results in the last section implied that, through the contribution of more open
FDI, the elasticity of investment with respect to labour costs may have increased by between
0.3 and 0.7, and up to three times more in manufacturing if cost-induced relocation is mainly
confmed to that sector. A change of this magnitude is quite plausible on the basis of my
domestic investment results, which imply that the long-mn elasticity in (total) manufacturing
seems to have increased by substantially more than unity.
6. Summary and Conclusion
This paper analyses the hypothesis that the liberalisation of foreign direct investment
has made the effect of labour costs on domestic investment, and hence long-mn labour
demand, more negative. This hypothesis seems to underlie the popular notion that
"globalisation" has made wage restraint more important for preserving employment. First, the
paper demonstrates by way of a simple model that falling FDI barriers will tend to make the
effect of production costs on domestic production more negative. Second, it shows that unit
labour costs have a substantial positive effect on FDI flows between Germany and other Ee
countries. If net FDI contributes directly to domestic investment, the results imply that the
opportunity to relocate has raised the elasticity of investment with respect to unit labour costs

20
by 0.3 to 0.7 (in absolute terms). Moreover, if relocation is mostly confmed to manufacturing
- an assumption which cannot be checked because of the aggregate nature of the data - the
effect in manufacturing may be substantially larger. Third, the paper tests directly whether the
effect of unit labour costs on domestic investment has changed between the 1970s and 1980s,
a time when FDI grew substantially. And indeed, the long-run elasticity of manufacturing
investment with respect to unit labour costs seems to have risen substantially. Moreover, this
change is particularly clear in those industries where FDI plays a large role. Hence, the
evidence seems to be consistent with the idea that FDI has increased the investment elasticity
in an important way.
Under constant returns, investment, the capital stock, and labour demand are all
proportional in the long-run. Hence, my results in Section 3 imply that the growing importance
ofFDI may have increased the long-run labour demand elasticity by between 0.3 and 0.7, and
potentially more in manufacturing. My domestic investment results in Section 4 are consistent
with such an estimate.
What is the significance of this paper in the context of the growing "globalisation"
literature? Most authors argue that globalisation has lowered the demand for unskilled
workers, or in other words shifted the demand curve for unskilled labour leftwards. The
present paper shows that globalisation may also have altered the structure of the labour market
by making the total labour demand curve flatter.
What are the general equilibrium implications of a flatter labour demand curve?
Clearly, the bargaining power of workers falls, which is interesting in the context of the
problems experienced by trade unions in many Western countries movement during the last 20

21
years. Moreover, Wes (1996) shows that an increase in the labour demand elasticity, brought
about by trade liberalisation, lowers aggregate unemployment as the markup of bargained
wages over prices falls. To be sure, this is an equilibrium effect which assumes that wage
setters have fully adjusted to the new labour demand environment. If wage-setting behaviour
takes time to adjust to the new realities, a transition phase of higher unemployment is entirely
possible. Germany's upward trend in unemployment during the past flve years may partly
reflect such a transition phase.

22
References:
Bajo-Rubio, Oscar, and Simon Sosvilla-Rivero (1994), "An econometric analysis of foreign direct investment in Spain, 1964-89", Southern Economic Journal, 61, pp. 104-120.
Barrell, Ray, and Nigel Pain (1996), "An econometric analysis of U. S. foreign direct investment", Review of Economics and Statistics, pp. 200-207.
Bell, Brian, and Neil Dryden (1996), ''The CEP-OECD data set (1950-1992)", mimeo., Centre for Economic Performance.
Brainard (1995), "Comment on Lipsey", in : Martin Feldstein, James R. Hines, Jr., and R. Glenn Hubbard (eds.), The Effects of Taxation on Multinational Corporations, University of Chicago Press, pp. 33-41.
Culem, Claudy (1988), "The locational determinants of direct investments among industrialised countries", European Economic Review, 32, pp. 885-904.
Cushman, David (1987), ''The effects of real wages and labor productivity on foreign direct investment", Southern Economic Journal, 54, pp. 174-185.
Denny, Kevin, and Stephen Nickell (1992), "Unions and Investment in British Industry", Economic Journal, 102, pp. 874-887.
Deutsche Bundesbank (1995), Kapitalveiflechtung mit dem Ausland, Statistische Sonderveröffentlichung 10, Frankfurt am Main.
Feenstra, Robert C., and Gordon H. Hanson (1995), "Foreign direct investment and relative wages: evidence from Mexico's maquiladoras", NBER Working Paper No. 5122.
Feldstein, Martin (1995), ''The effects of outbound foreign direct investment on the domestic capital stock" in: Martin Feldstein, James R. Hines, Jr., and R. Glenn Hubbard (eds.), The Effects of Taxation on Multinational Corporations, University of Chicago Press, pp.43-66.
Froot, Kenneth, and Jerome Stein (1991), ''Exchange rates and foreign direct investment: an imperfect capital markets approach", Quarterly Journal of Economics, 106, pp. 1191-1217.
Graham, Edward (1995), "Foreign direct investment in the world economy", IMF Working Paper, 95159.
Harris, Mark, and Laszlo Matyas (1996), "A comparative analysis of different estirnators for dynamic panel data models", mimeo., Monash University.
Hicks, John (1932), The Theory ofWages, Macmillan (London).
Judson, Ruth, and Ann Owen (1996), ''Estirnating dynamic panel data modeIs: a practical guide for macroeconomists", mimeo., Federal Reserve Board of Governors.

23
Klein, Michael, and Eric Rosengren (1994), ''The real exchange rate and foreign direct investment in the United States: relative wealth vs. relative wage effects", Journal of International Economics, 36, pp. 373-389.
Lipsey, Robert E. (1995), "Outward direct investment and the U. S. economy", in : Martin Feldstein, James R. Hines, Jr., and R. Glenn Hubbard (eds.), The Effects of Taxation on Multinationai Corporations, University of Chicago Press, pp. 7-33.
Lucas, Robert E. B. (1993), "On the determinants of direct foreign investment: evidence from East and Southeast Asia", World Development, 21, pp. 391-406.
Markusen, James, Anthony Venables, Denise Konan, and Kevin Zhang (1996), "A unified treatment of horizontal direct investment, vertical direct investment, and the pattem of trade in goods and services", mimeo.
Moore, Michael (1993), "Determinants of German manufacturing direct investment: 1980-1988", Weltwirtschaftliches Archiv, 129, pp.120-138.
Nicken, Stephen, and James Symons (1990), ''The real wage-employment relationship in the United States", JournalofLabor Economics, 8, pp. 1-15.
Nicken, Stephen (1981), ''Biases in dynarnic models with med effects", Econometrica, 49, pp. 1417-1426.
OECD (1995a), Country Report: Germany, Paris
OECD (1995b), International Direct Investment Statistics Yearbook, Paris.
OECD (various years), Main Economic Indicators, Paris.
Pain, Nigel (1993), "An econometric analysis of foreign direct investment in the United Kingdom", Scottish Journal of Political Economy, 40, pp. 1-23.
United Nations Transnational Corporations and Management Division (UNTCD, 1993), World Investment Directory 1992, New York.
Wang, Zhen Quan, and Nigel Swain (1996), ''The Determinants of Foreign Direct Investment in Transforming EconoInies: Empirical Evidence from Hungary and China", Weltwirtschaftliches Archiv, 132, pp.359-382.
Wes, Marina (1996), ''Unions and EconoInic Integration", mimeo., Centre for EconoInic Performance.

24
Data Appendix
FDl is defined as real foreign direct investment as a percentage of the partner country's GDP. Two measures are employed for the numerator. First, ''FDl flows" represent two-way flows between Germany (untilI990: West Germany) and other OECD countries for the period 1982 to 1993 as published by the OECD in its International Direct Investment Statistics Yearbooks 1993 to 1995. Second, "FDl stock differences" refer to the frrst difference of German inward and outward FDl stocks vis-a-vis other OECD countries for the period 1984 to 1993. lnward flow and stock figures were deflated by the German capital formation deflator (OECD: National Accounts). Outward flow and stock series were converted into host-country currency using market exchange rates, deflated by the host-country gross capital formation deflator, and reconverted into deutschmarks at purchasing power parit y to obtain FDl volume series. The sample is made up of two-way FDl between Germany and Australia, Austria, Canada, Denmark, France, Ireland, ltaly, Japan, the Netherlands, Portugal, Spain, Sweden, Switzerland, the VK, and the VS. Within the OECD, the se are the most important FDl partner countries for Germany . 16 Inflows and outflows are pooled.
All other variables in the FDl equations are taken from the CEP-OECD data set described in Bell and Dryden (1996). Vnit labour costs are the difference between log annuallabour cost per worker, adjusted by the GDP deflator, and log trend real GDP per worker. The real exchange rate is defmed as the log difference between the nominal exchange rate and the purchasing -power parity level.
All variables in the domestic manufacturing investment equations are taken from the OECD's ST AN data base. The number of industries is 26, while the sample period is from 1970 to 1991. The variable defmitions are generally similar to the FDl equations. lnvestment is defmed as the logarithm of real investment deflated by the capital goods price deflator. Vnit labour costs are defmed as log real annuallabour costs, deflated by the industry value-added deflator, minus log productivity, where log productivity is the predicted value from an industry-specific cubic trend in log value-added per worker. Finally, demand is defmed as the deviation of log real industry output from a cubic trend.
The industries are classified according to their FDl intensity by dividing the 1991 inward plus outward FDl stock (Deutsche Bundesbank, 1995) by 1991 gross domestic capital formation. Whenever this ratio (whose aggregate value is 1.25) exceeds 0.6 (2.0), the industry is classified as medium-FDl (high-FDl). As the industrial classifications differ, the results are only approximate and ISIC groups 311/2/3, 323/4, 351/2, 353/4, and 361/2/9 had to be aggregated.
16 Belgium and Luxembourg, which are consolidated in the OECD statistics, are excluded because flows to Luxembourg are likely to be dominated by subsidiaries of German banks. Many of these were set up in response to the German withholding tax on capital income.
25
Table 1: FDI Outflows, FDI Inflows, and Dnit Labour Cost Differences
Outflows Inflows Outward Inward ULC stock chan e stock chan e difference
Australia 0.037% 0.002% 0.110% 0.004% -0.216 Austria 0.411 % 0.094% 0.702% 0.349% -0.029 Canada 0.062% 0.008% 0.074% 0.029% -0.063 Denmark 0.053% 0.042% 0.099% 0.157% +0.091 France 0.100% 0.047% 0.141% 0.071% -0.128 Ireland 1.774% 0.034% 3.621% 0.000% -0.143 ltaly 0.074% 0.010% 0.168% 0.021% -0.424 Japan 0.006% 0.017% 0.007% 0.034% +0.153 Netherlands 0.369% 0.108% 0.345% 0.868% -0.082 Portugal 0.183% 0.000% 1.089% 0.002% -0.921 Spain 0.176% 0.006% 0.285% -0.003% -0.527 Sweden 0.062% 0.075% 0.142% 0.248% +0.207 Switzerland 0.292% 0.007% 0.297% 0.669% +0.301 UK 0.149% 0.029% 0.232% 0.058% -0.185 VS 0.063% -0.002% 0.074% 0.020% -0.009 Note: The FDI figures are rneasured relative to foreign GDP. The unit labour cost (ULC) figures are log differences between the foreign country and Germany. All figures are annual averages and refer to the period 1982 to 1993 (stock changes: 1984 to 1993).

26
Table 2: Foreign Investment, 1982-93 (dependent variable: FUl flows as a percentage of foreign GDP)
Variable (1) (2) (3) (4) (5) (6) (7 Relative log unit labour 0.157 cost (RULC) (0.091) European Community -0.068 -0.068 -0.067 -0.067 -0.067 -0.067 (BC) (0.194) (0.184) (0.197) (0.186) (0.195) (0.186) RULC*EC 0.295 0.362 0.297 0.376 0.335 0.383
(0.123) (0.359) (0.123) (0.360) (0.140) (0.362) RULC*(1-EC) -0.001 0.160 -0.001 0.169 0.081 0.315
(0.135) (0.277) (0.135) (0.278) (0.140) (0.293) Demand index source -0.668 -0.752 -1.110 -1.103
(2.012) (1.902) (2.006) (1.913) Demand index destin. 0.759 0.842 1.201 1.194
(2.012) (1.902) (2.006) (1.913) Relative days lost in 0.052 0.030 strikes and lockouts (0.042) (0.058) Relative real long-tenn -2.689 -2.423 interest rate (1.124) (1.678) Dummies: Country yes yes yes yes yes yes yes Bilateral no no yes no yes no yes Time yes yes yes yes yes yes yes Adjusted R2 0.088 0.091 0.188 0.087 0.184 0.100 0.186 N 358 358 358 358 358 358 358 Notes: All equations include a constant. Standard errors are given in parentheses.

27
Table 3: Foreign Investment, 1984-93 (dependent variable: change in FDI stocks as a percentage of foreign GDP)
Variable (1) (2) (3) (4) (S) (6) (7)
Relative log unit labour 0.523 cost (RULC) (0.154) European Community 0.012 0.012 0.001 0.001 0.001 0.001 (BC) (0.387) (0.356) (0.387) (0.356) (0.380) (0.354) RULC*EC 0.698 0.517 0.698 0.534 0.816 0.865
(0.196) (0.621) (0.196) (0.623) (0.221) (0.638) RULC*(1-EC) 0.241 0.098 0.243 0.118 0.339 0.544
(0.249) (0.465) (0.250) (0.467) (0.253) (0.509) Demand index source 3.S70 3.035 2.222 1.722
(3.535) (3.267) (3.507) (3.310) Demand index destin. 3.905 4.441 5.254 S.754
(3.535) (3.267) (3.507) (3.310) Relative days lost in 0.201 0.162 strikes and lockouts (0.093) (o. 12S) Relative real long-term -7.063 -S.581 interest rate (2.127) (3.112) Dummies: Country yes yes yes yes yes yes yes Bilateral no no yes no yes no yes Time yes yes yes yes yes yes yes Adjusted R2 0.167 0.167 0.294 0.166 0.294 0.198 0.302 N 298 298 298 298 298 298 298 Notes: All equations inc1ude a constant. Standard errors are given in parentheses.

28
Table 4: Average Industry Investment Rates and Unit Labour Costs, 1970-80 and 1981-91
Industry Investment Investment Unitlabour Unitlabour rate, rate, cost, cost,
1970-80 1981-91 1970-80 1981-91 Food (3110/3120) 17.9 14.9 57.2 60.0 Beverages (3130) 25.0 18.0 40.3 43.9 Tobacco (3140) 2.5 2.3 9.7 9.9 Textiles (3210) 17.0 12.0 66.8 70.8 Wearing apparei (3220) 5.1 4.9 78.6 73.0 Leather and products (3230) 8.1 6.9 60.3 68.2 Footwear (3240) 6.1 6.8 75.2 84.5 Wood products (3310) 16.8 12.1 64.4 71.7 Furniture and fixtures (3320) 7.9 8.7 72.6 79.3 Paper products (3410) 17.1 18.1 61.3 58.1 Printing, publishing (3420) 12.0 14.7 79.5 83.0 Industrial cheITIicals (3510) 32.5 16.9 49.7 62.0 Other cheITIicals (3520) 13.6 11.7 57.2 63.0 Petroleum refineries (3530) 6.2 6.9 10.4 11.8 Rubber products (3550) 15.7 14.1 100.0 82.7 Plastic products (3560) 19.1 17.6 88.9 77.6 Pottery and china (3610) 16.7 10.8 123.3 86.0 Glass and products (3620) 30.9 17.2 69.2 69.3 Non-metallic products (3690) 20.0 15.6 51.8 59.9 Iron and steel (3710) 22.6 13.1 75.2 77.1 Non-ferrous metals (3720) 14.7 10.9 71.2 70.1 Metal products (3810) 11.1 11.6 67.1 72.5 Non-electr. machinery (3820) 9.4 9.5 77.3 84.0 Electrical machinery (3830) 11.9 11.7 75.9 76.7 Transport equiprnent (3840) 12.1 15.8 76.6 73.9 ProfessionaI goods (3850) 18.7 15.1 61.8 74.8 Total 15.0 12.2 66.2 67.1 Notes: All figures are in percent. The investment rate is defmed as gross capital formation over value added. Real unit labour costs are annuallabour costs over value added.

29
Table 5: Log Investment (All Industries)
Variable (1) (2) (3) (4) (5) (6) (7) (8) 1970-1980 1981-1991
Log inv. [t-l] 0.656 0.621 0.757 0.650 (0.043) (0.056) (0.042) (0.049)
ULC -0.047 -0.052 0.138 -0.053 -1.012 -0.443 -0.330 -0.203 (0.140) (0.133) (0.114) (0.135) (0.231) (0.191) (0.195) (0.197)
ULC [t-l] 0.123 0.102 -0.631 -0.614 (0.115) (0.115) (0.213) (0.213)
Demand 0.783 0.700 -0.005 0.410 1.889 1.104 1.268 0.865 (0.320) (0.223) (0.331) (0.282) (0.369) (0.239) (0.329) (0.260)
p-ValueULC 0.740 0.574 0.229 0.694 0.000 0.000 0.091 0.000 Fixed effects: Industry yes yes yes yes yes yes yes yes Time no no yes yes no no yes yes Adjusted R2 0.957 0.981 0.973 0.983 0.971 0.988 0.982 0.990 N 286 260 286 260 286 260 286 260 Notes: ULC denotes unit labour eost. Standard errors are given in parentheses. "P-value ULC" gives the marginal signifieanee level for a zero total effeet of unit labour eosts.
Table 6: Log Investment (Low-FDI Industries)
Variable (1) (2) (3) (4) (5) (6) (7) (8) 1970-1980 1981-1991
Log inv. [t-l] 0.392 0.373 0.723 0.523 (0.115) (0.133) (0.091) (0.118)
ULC -1.112 -0.590 -0.785 -0.793 -4.078 -1.310 -0.552 -0.472 (0.272) (0.380) (0.272) (0.310) (0.637) (0.584) (0.548) (0.543)
ULC [t-l] 0.155 0.126 -1.411 -0.093 (0.344) (0.301) (0.641) (0.612)
Demand 2.395 1.536 0.387 0.660 3.122 1.218 1.094 0.927 (0.449) (0.480) (0.558) (0.526) (0.886) (0.622) (0.727) (0.648)
P-value ULC 0.000 0.198 0.006 0.041 0.000 0.000 0.318 0.349 Fixed effects: Industry yes yes yes yes yes yes yes yes Time no no yes yes no no yes yes AdjustedR2 0.941 0.954 0.968 0.974 0.918 0.964 0.969 0.976 N 77 70 77 70 77 77 77 77 Notes: see above.

30
Table 7: Log Investment (Medium-FDI Industries)
Variable (1) (2) (3) (4) (S) (6) (7) (8) 1970-1980 1981-1991
Log inv. [t-l] 0.752 0.659 0.694 0.527 (0.069) (0.097) (0.073) (0.091)
ULC 0.101 -0.054 0.348 -0.124 -0.428 0.115 0.103 0.310 (0.293) (0.264) (0.230) (0.304) (0.373) (0.363) (0.307) (0.360)
ULC [t-l] 0.165 0.338 -0.7S2 -0.529 (0.242) (0.277) (0.378) (0.368)
Demand 0.454 1.110 0.297 0.941 2.693 1.733 1.357 1.045 (0.654) (0.431) (0.672) (0.591) (0.690) (0.378) (0.671) (0.567)
P-value ULC 0.731 0.620 0.134 0.345 0.254 0.027 0.738 O.44S Fixed effects: Industry yes yes yes yes yes yes yes yes Time no no yes yes no no yes yes Adjusted R2 0.904 0.965 0.945 0.967 0.958 0.978 0.974 0.982 N 99 90 99 90 99 99 99 99 Notes: see above.
Table 8: Log Investment (High-FDI Industries)
Variable (1) (2) (3) (4) (5) (6) (7) (8) 1970-1980 1981-1991
Log inv. [t-l] 0.607 0.602 0.727 0.722 (0.072) (0.092) (0.063) (0.061)
ULC 0.061 -0.034 -0.001 -0.095 -0.671 -0.532 -0.410 -0.325 (0.183) (0.179) (0.152) (0.180) (0.292) (0.221) (0.295) (0.217)
ULC [t-l] 0.113 0.028 -0.476 -0.742 (0.144) (0.141) (0.259) (0.2S0)
Demand 0.436 0.374 0.112 0.450 1.306 0.922 1.136 0.591 (0.472) (0.337) (0.469) (0.392 (0.442) (0.276) (0.473) (0.278)
P-value ULC 0.739 0.661 0.991 0.708 0.024 0.000 0.169 0.000 Fixed effects: Industry yes yes yes yes yes yes yes yes Time no no yes yes no no yes yes AdjustedR2 0.977 0.989 0.985 0.991 0.987 0.995 0.988 0.996 N 110 100 110 100 110 110 110 110 Notes: see above.

31
Chart 1: Real FDI Outflows and Changes in Outward FDI Stocks
Real Outflows snd Changes In Outward FDI Stocks, Gennany, 1982 to 1993
1983 1984 1985 1986 1987 1988 1989 1990 1991 1992 1993 year
Chart 2: Real FDI Inflows and Changes in Inward FDI Stocks
Reallnflows and Changes in Inward FDI Stocks, Germany 1982 to 1993