Embed Size (px)
Citation preview
Alaska Fisheries Technical Report Number 72
Feasibility of Using Video Technology to Estimate Salmon Escapement in the Ongivinuk River, a Clear-Water Tributary of the Togiak River
Nicholas J. Hetrick, Kevin M. Simms, Miranda P. Plumb, and James P. Larson
Key words: video, escapement, salmon, motion detection, Ongivinuk, Togiak, Alaska
U.S. Fish and Wildlife Service
King Salmon Fish and Wildlife Field Office P.O. Box 277
King Salmon, AK 99613-0277 (907) 246-3442
June 2004
Disclaimers
Disclaimer: The mention of trade names or commercial products in this report does not constitute endorsement or recommendation for use by the Federal government. The U.S. Department of Interior prohibits discrimination in Department Federally Conducted Programs based on race, color, national origin, sex, age, or disability. If you believe that you have been discriminated against in any program, activity, or facility operated by the U.S. Fish and Wildlife Service or if you desire further information please write to:
U.S. Department of the Interior
Office of Equal Opportunity 1849 C. Street, N. W.
Washington, D.C. 20240
This is the Final Report for Fisheries Resource Monitoring Program Project FIS-00-10, funded through the U.S. Fish and Wildlife Service, Office of Subsistence Management.
The correct citation for this report is: Hetrick, N. J., K. M. Simms, M. P. Plumb, and J. P. Larson. 2004. Feasibility of using
video technology to estimate salmon escapement in the Ongivinuk River, a clear-water tributary of the Togiak River. U. S. Fish and Wildlife Service, King Salmon Fish and Wildlife Field Office, Alaska Fisheries Technical Report Number 72, King Salmon, Alaska.
ii
Table of Contents page
List of Tables ..................................................................................................................... iv
List of Figures ..................................................................................................................... v
List of Appendices ............................................................................................................ vii
Abstract ............................................................................................................................... 1
Introduction......................................................................................................................... 1
Study Site ............................................................................................................................ 5
Methods............................................................................................................................... 5 Contrasting Substrate Panels ...................................................................................... 5 Video Recording............................................................................................................ 6 Motion Detection ........................................................................................................ 13 Lighting ....................................................................................................................... 14 Visibility ...................................................................................................................... 15 Power .......................................................................................................................... 16
Results............................................................................................................................... 17 Contrasting Substrate Panels ..................................................................................... 17 Video Recording.......................................................................................................... 19 Motion Detection ........................................................................................................ 28 Lighting ....................................................................................................................... 32 Visibility ...................................................................................................................... 34 Power .......................................................................................................................... 35
Discussion......................................................................................................................... 36 Objective 1 .................................................................................................................. 36
Contrasting Substrate Panels ............................................................................... 36 Video Recording.................................................................................................... 36 Motion Detection .................................................................................................. 38 Lighting ................................................................................................................. 40 Visibility ................................................................................................................ 41 Power .................................................................................................................... 41
Objective 2 .................................................................................................................. 42 Objective 3 .................................................................................................................. 43 Objective 4 .................................................................................................................. 43
Acknowledgements........................................................................................................... 44
Literature Cited ................................................................................................................. 44
Appendices........................................................................................................................ 46
iii
List of Tables page
1. Average water depth, length, percent of coho salmon upstream passage, and coho salmon density within zones of a video study transect across the Ongivinuk River during a combined 17.5 h of discontinuous monitoring during daylight and crepuscular hours, 22-24 September 2002. The transect consisted of white plastic panels anchored on the river bottom. Zones 1 and 6 were on opposite riverbanks and zone 4 was a gap between the panels...................18
2. Average water depth, length, percent of coho salmon upstream passage, and coho salmon density within zones of a video study transect across the Ongivinuk River between 17:00 and 23:00 hours on 25 September 2002. The transect consisted of white plastic panels anchored on the river bottom. Zones 1 and 6 were on opposite riverbanks and zone 4 was a gap between the panels. ....................................................................................................................18
3. Effectiveness of the motion detection algorithm used to monitor fish passage on the Ongivinuk River during 17.5 h of discontinuous monitoring between 22-24 September 2002. Effectiveness is expressed as a percentage of the total number of files (shown in parenthesis) that contained salmon images (correct triggers) for each camera (FOV=field of view) and time period....................30
4. Effectiveness of motion detection algorithm used to monitor fish passage on the Ongivinuk River with video equipment between 17:00 and 23:00 hours on 25 September 2002. Effectiveness is expressed as a percentage of total number of files (shown in parenthesis) that contained salmon (correct triggers) for each camera (FOV=field of view) and time period. ................................30
5. Percentages of coho salmon counted on the Ongivinuk River by observers that were also captured on video by a recorder using motion detection software during 17.5 h of discontinuous monitoring between 22-24 September 2002. Percentages were calculated for each camera (FOV=field of view) and time period. Total observer counts are shown in parentheses. ..............31
6. Percentages of coho salmon counted on the Ongivinuk River by observers that were also captured on video by a recorder using motion detection software between 17:00 and 23:00 hours on 25 September 2002. Percentages were calculated for each camera (FOV=field of view) and time period. Total observer counts are shown in parentheses.............................................31
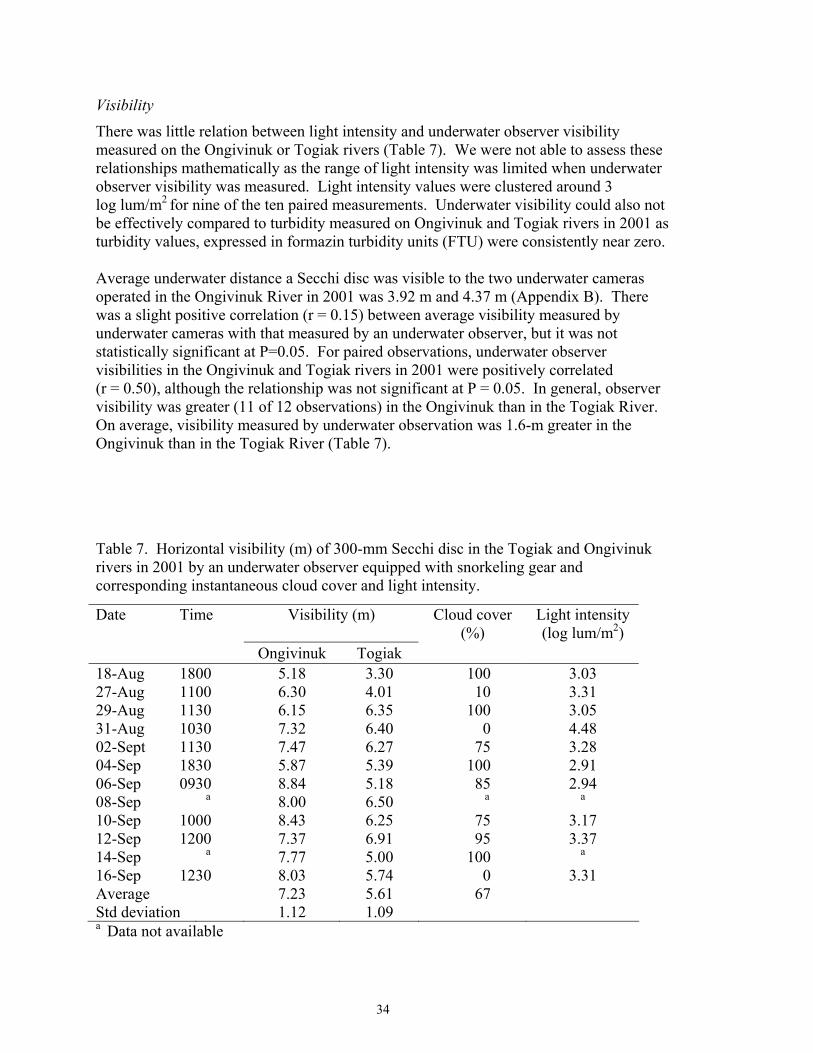
7. Horizontal visibility (m) of 300-mm Secchi disc in the Togiak and Ongivinuk rivers in 2001 by an underwater observer equipped with snorkeling gear and corresponding instantaneous cloud cover and light intensity........................................................................................................................34
iv
List of Figures
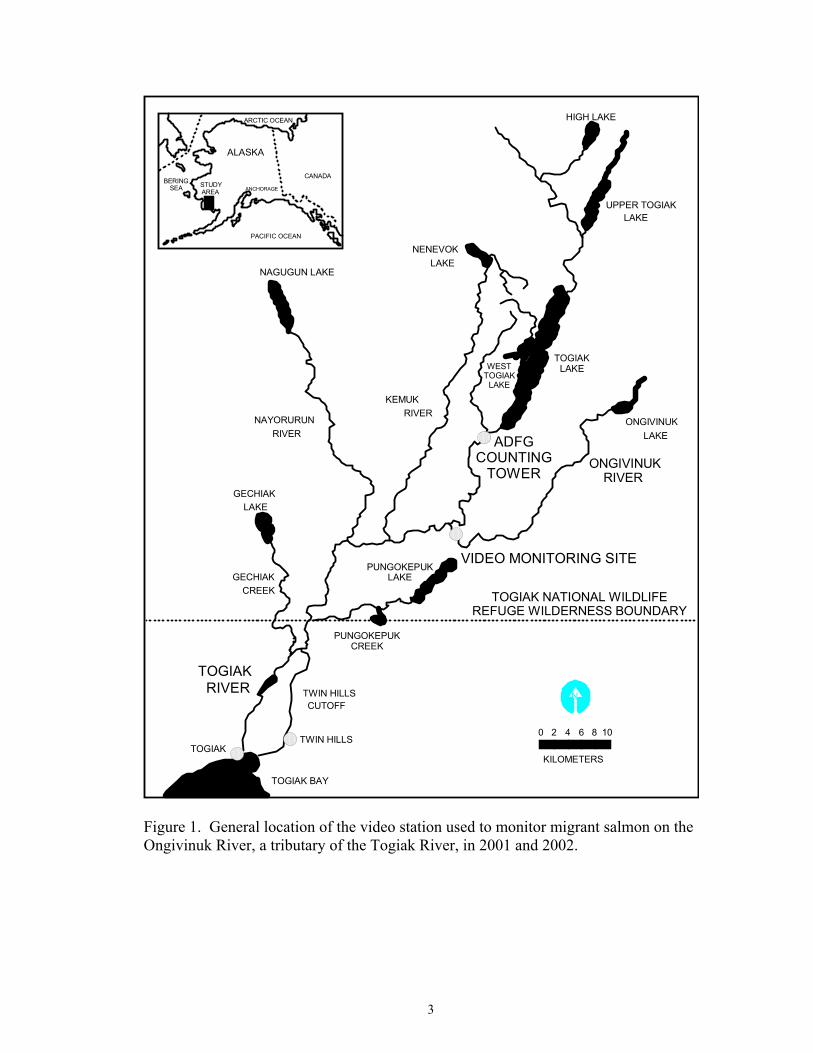
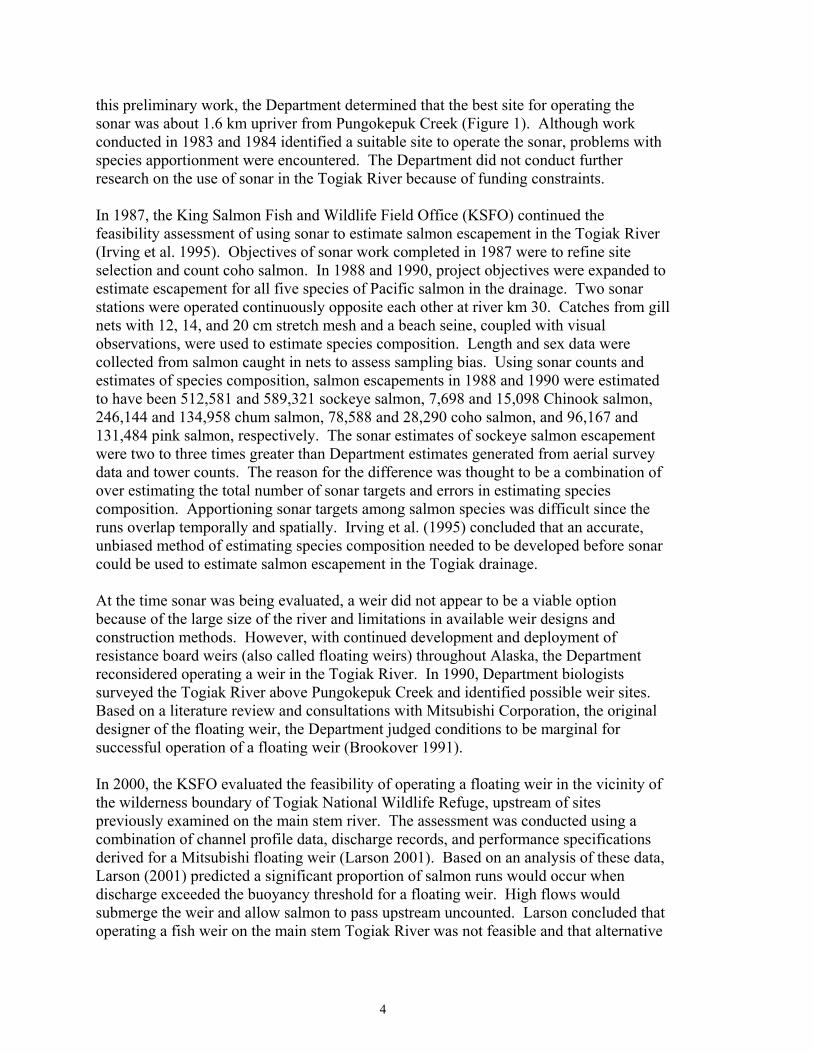
page 1. General location of the video station used to monitor migrant salmon on the
Ongivinuk River, a tributary of the Togiak River, in 2001 and 2002............................3
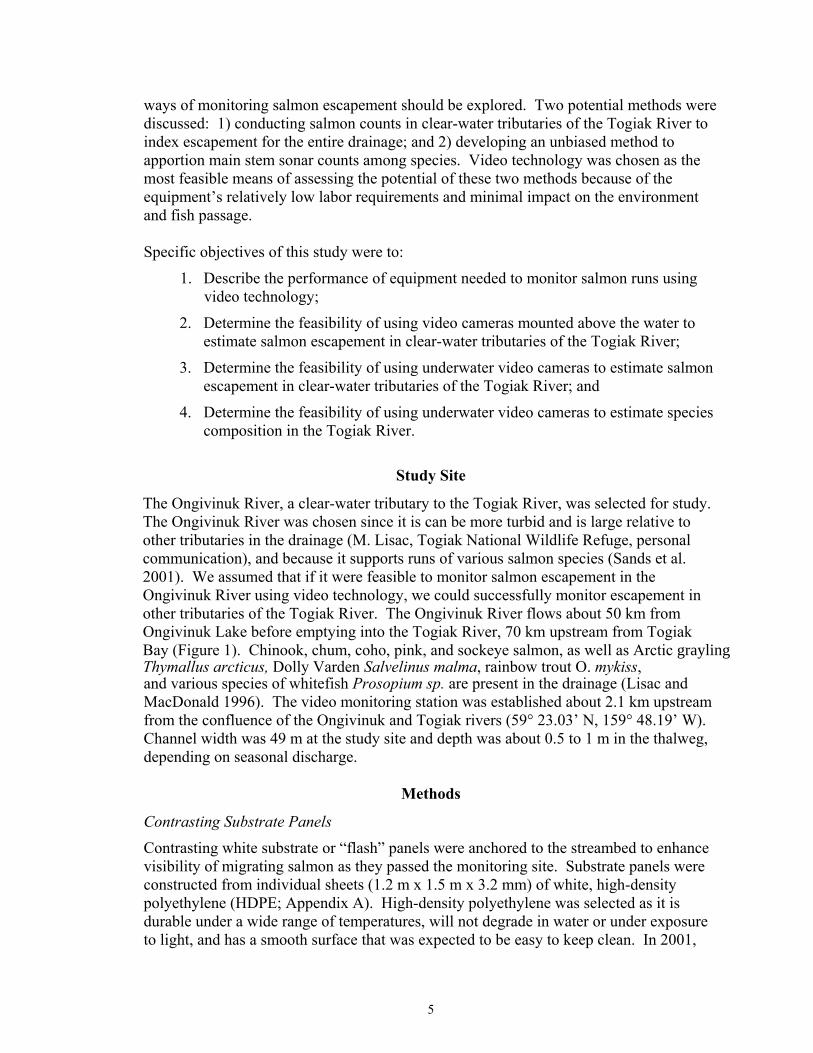
2. White substrate panels used as a contrasting background to aid in viewing upstream migrant salmon on the Ongivinuk River in 2001...........................................7
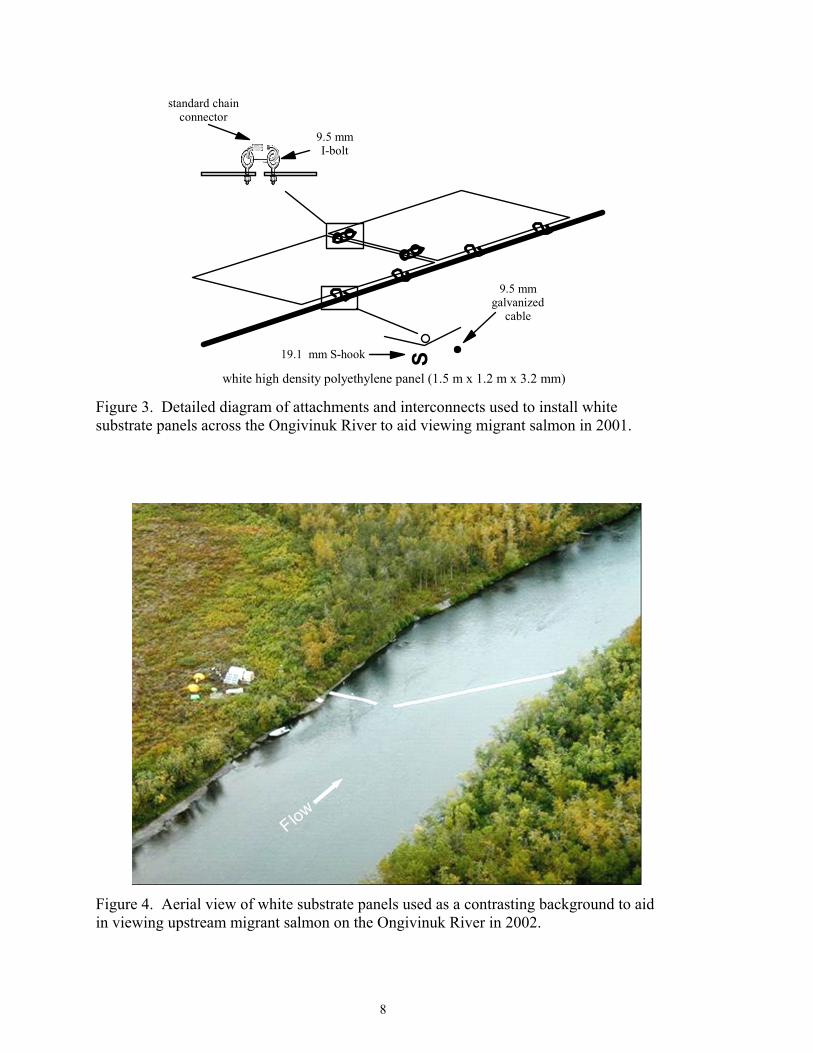
3. Detailed diagram of attachments and interconnects used to install white substrate panels across the Ongivinuk River to aid viewing migrant salmon in 2001. ..........................................................................................................................8
4. Aerial view of white substrate panels used as a contrasting background to aid in viewing upstream migrant salmon on the Ongivinuk River in 2002.........................8
5. Aerial view of zones established to record the location of upstream migrant salmon through the video monitoring station operated on the Ongivinuk River in 2002..................................................................................................................9
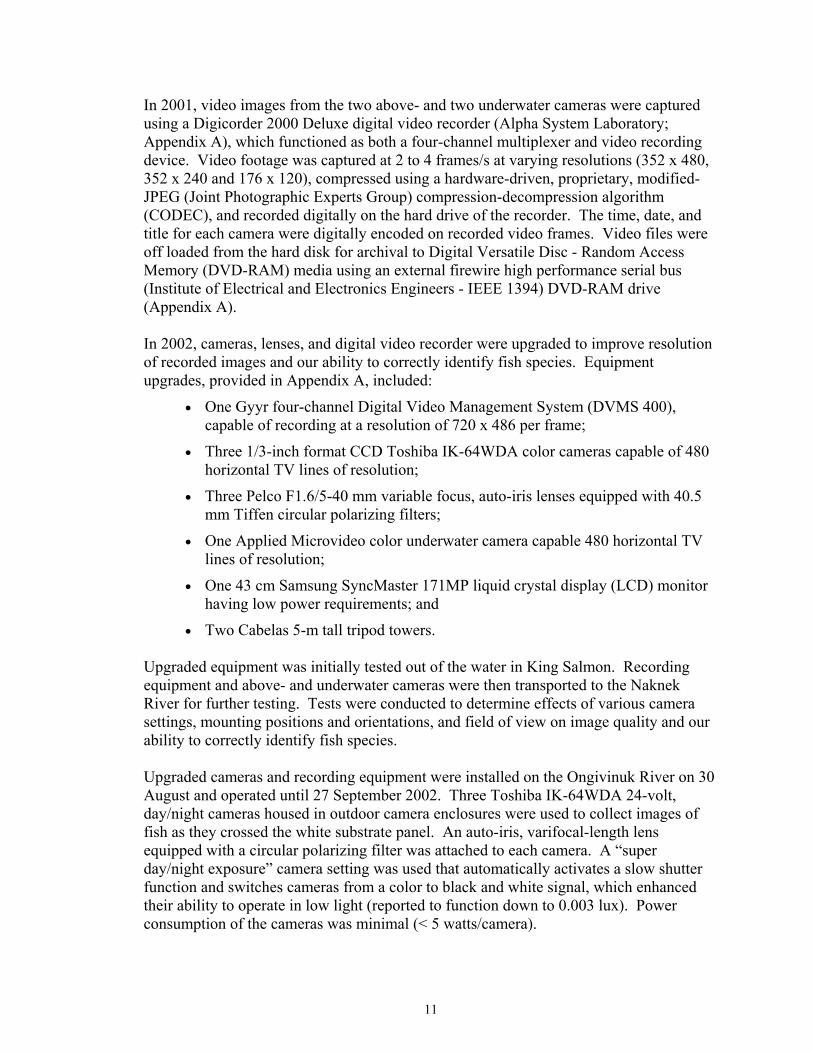
6. Mounting brackets and weatherproof camera cases used to house above-water cameras positioned on the bank of the Ongivinuk River in 2001........................9
7. Position, orientation, and field of view of above-water and underwater cameras used to collect video images of fish migrating over white substrate panels on the Ongivinuk River in 2001. ......................................................................10
8. One of two 5-m tall tripods used to position 1/3-inch format video cameras encased in weatherproof housings above the water on the Ongivinuk River in 2002. ........................................................................................................................13
9. Schematic of passive power generating system used to provide electricity to the video monitoring station operated on the Ongivinuk River in 2001. A gasoline-powered generator was added to the system in 2002 to provide supplemental power to operate auto headlights for monitoring fish passage at night. ............................................................................................................................16
10. Sequential frames (left to right) showing Chinook salmon moving upstream over white substrate panels on the Ongivinuk River, 2001. Pictures were captured with an above-water video camera connected to a digital video recorder and later off-loaded as JPEG files. ................................................................20
11. Above-water camera view of a Chinook salmon moving upstream over white substrate panels on the Ongivinuk River, 2001. Image was captured by an above-water video camera connected to a digital video recorder and later off-loaded as a JPEG file. ............................................................................................21
12. Sequential frames (left to right) of a Chinook salmon moving upstream over white substrate panels on the Ongivinuk River, 2001. Images were captured during the day using an underwater video camera connected to a digital video recorder and later off-loaded as JPEG files. ......................................................22
v
List of Figures, continued page
13. Image of a Chinook salmon migrating upstream over white substrate panels on the Ongivinuk River, 2001. Image was captured during the day using an underwater video camera connected to a digital video recorder and later off-loaded as a JPEG file. ..................................................................................................23
14. Image of a pink salmon migrating upstream over white substrate panels on the Ongivinuk River in 2001. Image was captured during the late evening using an underwater video camera connected to a digital video recorder and later off-loaded as a JPEG file. ....................................................................................23
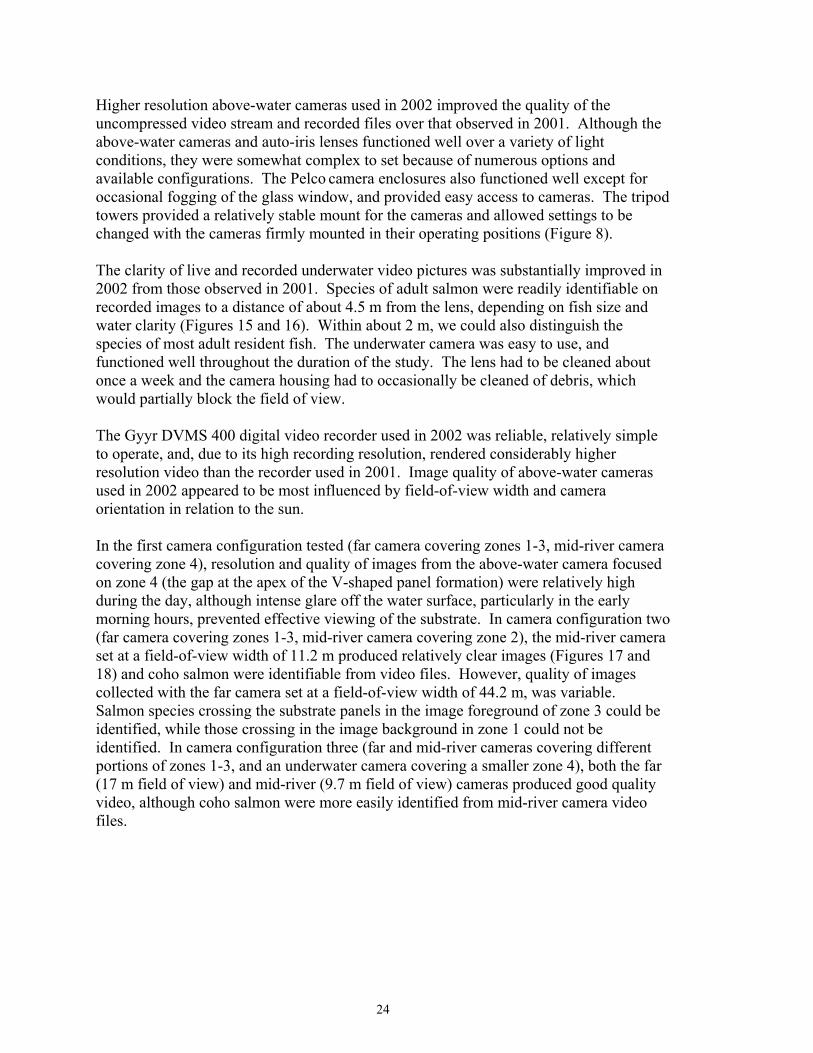
15. Sequential frames (left to right) of underwater images of coho salmon moving upstream through a gap in white substrate panels on the Ongivinuk River, September 2002. Images were collected during the day using an underwater video camera connected to a digital video recorder, and later captured as JPEG files using a video capture card on a personal computer. ...............25
16. Underwater image of coho salmon moving upstream through a gap in white substrate panels on the Ongivinuk River, September 2002. The image was collected during late evening using an underwater video camera connected to a digital video recorder, and later captured as a JPEG file using a video capture card on a personal computer. ..........................................................................26
17. Sequential frames (left to right) of coho salmon moving upstream across white substrate panels on the Ongivinuk River, September 2002. Images were collected during the day using the mid-river above-water video camera connected to a digital video recorder, and later captured as JPEG files using a video capture card on a personal computer...............................................................27
18. Coho salmon moving upstream across white substrate panels on the Ongivinuk River, September 2002. The image was collected during the day using the mid-river above-water video camera connected to a digital video recorder, and later captured as a JPEG file using a video capture card on a personal computer........................................................................................................28
19. Single coho salmon moving upstream across white substrate panels on the Ongivinuk River, September 2002. The image was collected during the night using an above-water video camera connected to a digital video recorder with the aid of artificial illumination from an auto headlight, and later captured as a JPEG file using a video capture card on a personal computer. .....................................................................................................................33
20. Underwater image of coho salmon moving upstream through a gap in white substrate panels on the Ongivinuk River, September 2002. Images were collected during the night using an underwater video camera connected to a digital video recorder with the aid of artificial illumination from an auto headlight, and later captured as JPEG files using a video capture card on a personal computer........................................................................................................33
vi
List of Figures, continued page
21. Scatter plot of turbidity (NTU) and underwater camera visibility (m) collected at four locations in the Naknek River drainage in 2002. ..............................35
List of Appendices
A. Appendix A. Model number, manufacturer, and approximate cost of equipment used in 2001 and 2002. ..............................................................................46
B. Appendix B. Underwater visibility, quantified as the viewable distance of a 300-mm diameter Secchi disc by underwater cameras on the Ongivinuk River and an underwater observer on the Ongivinuk and Togiak rivers 2001. Light intensity was measured at 1-h intervals above the water surface of the Ongivinuk River in 2001, which were averaged over the period that Secchi disc sampling occurred. ...............................................................................................47
vii

viii

Alaska Fisheries Technical Report Number 72
Feasibility of Using Video Technology to Estimate Salmon Escapement in the Ongivinuk River, a Clear-Water Tributary of the Togiak River
Hetrick, N. J., K. M. Simms, M. P. Plumb, and J. P. Larson. 2004
U.S. Fish and Wildlife Service, King Salmon Fish and Wildlife Field Office P.O. Box 277, King Salmon, AK 99613, (907) 246-3442
Abstract - Current monitoring of salmon runs on the Togiak River is primarily focused on sockeye salmon Oncorhynchus nerka. A method for monitoring escapement of other species of salmon in the drainage is needed to improve management. The applicability of sonar and a floating weir have been assessed in previous studies, but were considered unviable. As an alternative, we assessed the use of video technology for monitoring salmon runs in clear-water tributaries of the Togiak River, which could be used to index escapement for the entire drainage. In this two-year feasibility study, digital video recording equipment, above- and underwater cameras, and a remote power system were operated on the Ongivinuk River, a tributary of the Togiak River. Tests were conducted to determine optimal camera placement, field-of-view width, and lighting based on image quality and performance of motion detection processing. We also tested the hypothesis that upstream migrant salmon would avoid swimming over white substrate panels, as a possible method for concentrating fish passage into narrow sections of the channel. Image quality of above-water cameras and performance of the motion detection algorithm increased as the field-of-view width decreased. Motion detection processing was more effective when fish were viewed from the side than from the front. We were able to successfully count salmon at night with the aid of artificial light, but species could only be identified from underwater camera images. A V-shaped panel formation was successful at redirecting a portion of upstream migrant coho salmon O. kisutch through a gap located at its apex, within the view of an underwater camera. Accuracy of estimates could be increased by refining the technology used to count fish at night. Improvements in the motion detection algorithm we used or a substitute method of electronically discriminating fish passage is needed to minimize the amount of video collected when monitoring continuously. In addition, field-of-view width of above-water cameras should be limited to less than 10 m to improve image quality, as needed to correctly identify species of adult salmon. We concluded that with these refinements, estimating salmon escapement in clear-water tributaries of the Togiak River using video technology is feasible.
Introduction Subsistence is a way of life for most residents of communities within and adjacent to the Togiak National Wildlife Refuge. Wolfe et al. (1984) characterized villages in the
Togiak region as having a mixed subsistence-market economy, with subsistence resources playing a prominent role in both the economy and social welfare. Subsistence fishing and hunting provide a “reliable economic base” and a family’s subsistence take is “augmented and supported by cash employment of family members.” Of the many subsistence resources available to local residents, salmon has always been the mainstay of the overall harvest in southwest Alaska. The Togiak River flows primarily through the Togiak National Wildlife Refuge, and supports runs of Chinook Oncorhynchus tshawytscha, chum O. keta, coho O. kisutch, pink O. gorbuscha, and sockeye O. nerka salmon (USFWS 1986). Salmon returning to the Togiak River contribute to subsistence, commercial, and sport fisheries that are important to both the culture and economy of the local area. The Alaska Department of Fish and Game (Department) manages commercial and sport fisheries in the Togiak River to achieve established biological escapement goals set at 10,000 Chinook, 50,000 coho, and 150,000 sockeye salmon, annually (ADFG 2003). The Department has not established escapement goals for chum or pink salmon in the drainage. Estimating salmon escapement in the Togiak River has been challenging due to the physical characteristics of the drainage. The Department currently estimates escapement of sockeye salmon in the drainage based on a combination of visual counts taken from towers and aerial surveys, and commercial catch data (ADFG 1990). Tower counts of sockeye salmon are conducted at the outlet of Togiak Lake, 97 river km upstream from Togiak Bay (Figure 1). Aerial survey data are used to estimate escapement of sockeye salmon that spawn downstream of the tower. It takes an estimated 10 to 14 days for sockeye salmon that escape the commercial fishery in the Bay (Brannian 1982) to reach the tower. With commercial fishing permitted about four days per week (Monday through Thursday), about two, one-week fishing periods can occur before upstream migrant salmon reach the tower. The lag time between the commercial fishery and tower counts makes in-season management difficult. Aerial surveys are used to supplement tower counts, but are often hindered by poor weather and turbid water. The result can be unequal coverage within a season and among years. In addition, aerial surveys provide an index rather than a true estimate of escapement. To provide a timelier estimate of run size, the Department uses a model based on the relationship between commercial fishing catch-per-unit-effort and sockeye salmon escapement estimates. The model is relatively accurate at forecasting escapement for sockeye salmon when commercial fishing is maintained at a fixed number of openings per week (Brannian 1982). However, model accuracy decreases when there are either extensive fishery closures or openings. In 1983 and 1984, the Department studied the practicality of using single beam sonar to estimate escapement of all species of salmon present in the Togiak River drainage (R. Minard, Alaska Department of Fish and Game, personal communication). Sonar was operated from late July through mid August below the Gechiak River in 1983 (Figure 1), and from late June to late July at several locations on the Togiak River in 1984. Based on
2
PUNGOKEPUK CREEK
PUNGOKEPUK LAKE
NAGUGUN LAKE
WESTTOGIAK
LAKE
UPPER TOGIAKLAKE
HIGH LAKE
TWIN HILLSCUTOFF
TOGIAKRIVER
TOGIAK NATIONAL WILDLIFEREFUGE WILDERNESS BOUNDARY
GECHIAKCREEK
ADFGCOUNTING
TOWER
KILOMETERS
2 4 6 8 100
N
ARCTIC OCEAN
BERINGSEA
ALASKA
CANADA
ANCHORAGE
PACIFIC OCEAN
TOGIAK BAY
NAYORURUNRIVER
ONGIVINUKRIVER
ONGIVINUKLAKE
TOGIAKLAKE
KEMUKRIVER
NENEVOKLAKE
GECHIAKLAKE
TOGIAKTWIN HILLS
STUDY AREA
VIDEO MONITORING SITE
Figure 1. General location of the video station used to monitor migrant salmon on the Ongivinuk River, a tributary of the Togiak River, in 2001 and 2002.
3
this preliminary work, the Department determined that the best site for operating the sonar was about 1.6 km upriver from Pungokepuk Creek (Figure 1). Although work conducted in 1983 and 1984 identified a suitable site to operate the sonar, problems with species apportionment were encountered. The Department did not conduct further research on the use of sonar in the Togiak River because of funding constraints. In 1987, the King Salmon Fish and Wildlife Field Office (KSFO) continued the feasibility assessment of using sonar to estimate salmon escapement in the Togiak River (Irving et al. 1995). Objectives of sonar work completed in 1987 were to refine site selection and count coho salmon. In 1988 and 1990, project objectives were expanded to estimate escapement for all five species of Pacific salmon in the drainage. Two sonar stations were operated continuously opposite each other at river km 30. Catches from gill nets with 12, 14, and 20 cm stretch mesh and a beach seine, coupled with visual observations, were used to estimate species composition. Length and sex data were collected from salmon caught in nets to assess sampling bias. Using sonar counts and estimates of species composition, salmon escapements in 1988 and 1990 were estimated to have been 512,581 and 589,321 sockeye salmon, 7,698 and 15,098 Chinook salmon, 246,144 and 134,958 chum salmon, 78,588 and 28,290 coho salmon, and 96,167 and 131,484 pink salmon, respectively. The sonar estimates of sockeye salmon escapement were two to three times greater than Department estimates generated from aerial survey data and tower counts. The reason for the difference was thought to be a combination of over estimating the total number of sonar targets and errors in estimating species composition. Apportioning sonar targets among salmon species was difficult since the runs overlap temporally and spatially. Irving et al. (1995) concluded that an accurate, unbiased method of estimating species composition needed to be developed before sonar could be used to estimate salmon escapement in the Togiak drainage. At the time sonar was being evaluated, a weir did not appear to be a viable option because of the large size of the river and limitations in available weir designs and construction methods. However, with continued development and deployment of resistance board weirs (also called floating weirs) throughout Alaska, the Department reconsidered operating a weir in the Togiak River. In 1990, Department biologists surveyed the Togiak River above Pungokepuk Creek and identified possible weir sites. Based on a literature review and consultations with Mitsubishi Corporation, the original designer of the floating weir, the Department judged conditions to be marginal for successful operation of a floating weir (Brookover 1991). In 2000, the KSFO evaluated the feasibility of operating a floating weir in the vicinity of the wilderness boundary of Togiak National Wildlife Refuge, upstream of sites previously examined on the main stem river. The assessment was conducted using a combination of channel profile data, discharge records, and performance specifications derived for a Mitsubishi floating weir (Larson 2001). Based on an analysis of these data, Larson (2001) predicted a significant proportion of salmon runs would occur when discharge exceeded the buoyancy threshold for a floating weir. High flows would submerge the weir and allow salmon to pass upstream uncounted. Larson concluded that operating a fish weir on the main stem Togiak River was not feasible and that alternative
4
ways of monitoring salmon escapement should be explored. Two potential methods were discussed: 1) conducting salmon counts in clear-water tributaries of the Togiak River to index escapement for the entire drainage; and 2) developing an unbiased method to apportion main stem sonar counts among species. Video technology was chosen as the most feasible means of assessing the potential of these two methods because of the equipment’s relatively low labor requirements and minimal impact on the environment and fish passage.
Specific objectives of this study were to:
1. Describe the performance of equipment needed to monitor salmon runs using video technology;
2. Determine the feasibility of using video cameras mounted above the water to estimate salmon escapement in clear-water tributaries of the Togiak River;
3. Determine the feasibility of using underwater video cameras to estimate salmon escapement in clear-water tributaries of the Togiak River; and
4. Determine the feasibility of using underwater video cameras to estimate species composition in the Togiak River.
Study Site
The Ongivinuk River, a clear-water tributary to the Togiak River, was selected for study. The Ongivinuk River was chosen since it is can be more turbid and is large relative to other tributaries in the drainage (M. Lisac, Togiak National Wildlife Refuge, personal communication), and because it supports runs of various salmon species (Sands et al. 2001). We assumed that if it were feasible to monitor salmon escapement in the Ongivinuk River using video technology, we could successfully monitor escapement in other tributaries of the Togiak River. The Ongivinuk River flows about 50 km from Ongivinuk Lake before emptying into the Togiak River, 70 km upstream from Togiak Bay (Figure 1). Chinook, chum, coho, pink, and sockeye salmon, as well as Arctic graylingThymallus arcticus, Dolly Varden Salvelinus malma, rainbow trout O. mykiss, and various species of whitefish Prosopium sp. are present in the drainage (Lisac and MacDonald 1996). The video monitoring station was established about 2.1 km upstream from the confluence of the Ongivinuk and Togiak rivers (59° 23.03’ N, 159° 48.19’ W). Channel width was 49 m at the study site and depth was about 0.5 to 1 m in the thalweg, depending on seasonal discharge.
Methods
Contrasting Substrate Panels
Contrasting white substrate or “flash” panels were anchored to the streambed to enhance visibility of migrating salmon as they passed the monitoring site. Substrate panels were constructed from individual sheets (1.2 m x 1.5 m x 3.2 mm) of white, high-density polyethylene (HDPE; Appendix A). High-density polyethylene was selected as it is durable under a wide range of temperatures, will not degrade in water or under exposure to light, and has a smooth surface that was expected to be easy to keep clean. In 2001,
5
substrate panels were attached to a 9.5-mm diameter galvanized aircraft cable set perpendicular to the channel (Figure 2). The cable was anchored to the stream bottom using small (size 68), duckbill anchors. Eyebolts were mounted on individual panels, and chain connectors were used to join panels into a continuous sheet that spanned the channel (Figure 3). A single 0.3-m wide gap was created in the panels adjacent to one of two underwater cameras. In 2002, substrate panels were positioned in an off-center, V-formation (apex pointing upstream) with a 4.4-m gap positioned at the apex of the V (Figure 4). The panel configuration was used to determine if upstream migrant salmon could be concentrated through the gap, since we observed some fish avoided crossing the highly contrasting white substrate panels in 2001. On one side of the gap, a 12.2-m section of substrate panel was positioned perpendicular to the shore. On the other side of the gap, a 44.2-m section of panel was installed at a downstream subtending angle of about 50 degrees. Panels forming the angled side of the V were attached to a 9.5-mm diameter galvanized aircraft cable. A lead rope was used to secure the 12.2-m long panel positioned perpendicular to the shore. Both the cable and lead rope were secured to the streambed using small (size 68) duckbill anchors spaced about 4-m apart. Eyebolts and chain connecters used to attach the panels together in 2001 were removed, and panels were connected to the cable, lead line, and one another using plastic cable ties threaded through the vacant holes. Location of fish passage across the study site was categorized into six different zones to determine effectiveness of the V substrate panel formation in concentrating fish passage into the 4.4-m gap (Figure 5). The 44.2-m angled panel was split into zones 1, 2, and 3; the underwater camera covering the gap in the panel was denoted as zone 4; and the 12.2-m panel adjacent to our camp was split into zones 5 and 6. Video Recording
The video monitoring station used in 2001 was designed after a remote analog video escapement recorder system developed by the Department (Otis and Dickson 2001) and guidance from the Fairbanks Fish and Wildlife Field Office, U. S. Fish and Wildlife Service (D. Daum, personal communication). The system was installed on the Ongivinuk River on 7 August 2001 and was operated through 17 September. In 2001, video images of upstream migrant salmon were collected using two Supercircuits PC33C high-resolution, 12-volt color video cameras mounted above the water. Cameras were placed in outdoor enclosures (Appendix A) mounted on 2.5-cm galvanized steel pipes driven into a stream bank (Figure 6). Cameras were both positioned on the same bank about 6 m above the water surface, which provided a clear view of substrate panels. Cameras were pointed as close to directional north as possible to minimize glare. The initial study plan called for each camera to view 15 m of the overall channel width. The actual channel width was 49 m, however, requiring the field of view of one camera to be set at about 30 m (Figure 7). Fish passage was not
6
Figure 2. White substrate panels used as a contrasting background to aid in viewing upstream migrant salmon on the Ongivinuk River in 2001.
7
white high density polyethylene panel (1.5 m x 1.2 m x 3.2 mm)
S
9.5 mm galvanized
cable
9.5 mm I-bolt
standard chain connector
19.1 mm S-hook
Figure 3. Detailed diagram of attachments and interconnects used to install white substrate panels across the Ongivinuk River to aid viewing migrant salmon in 2001.
Flow
Figure 4. Aerial view of white substrate panels used as a contrasting background to aid in viewing upstream migrant salmon on the Ongivinuk River in 2002.
8
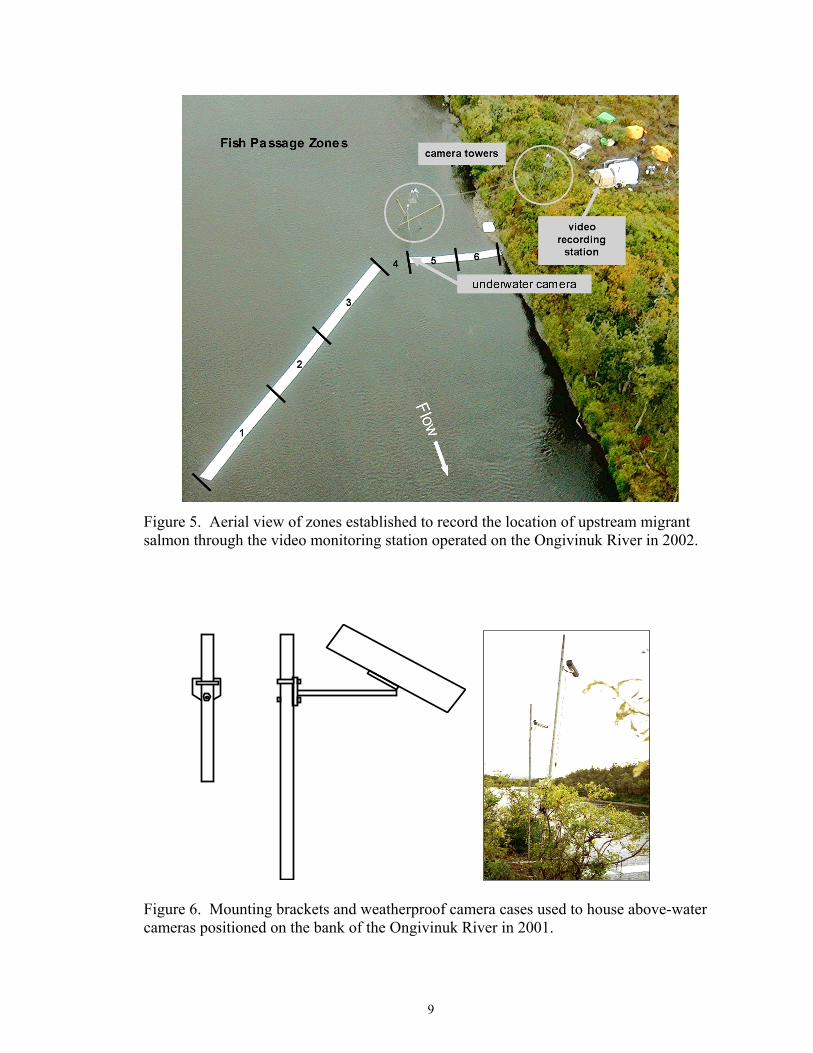
Figure 5. Aerial view of zones established to record the location of upstream migrant salmon through the video monitoring station operated on the Ongivinuk River in 2002.
Figure 6. Mounting brackets and weatherproof camera cases used to house above-water cameras positioned on the bank of the Ongivinuk River in 2001.
9
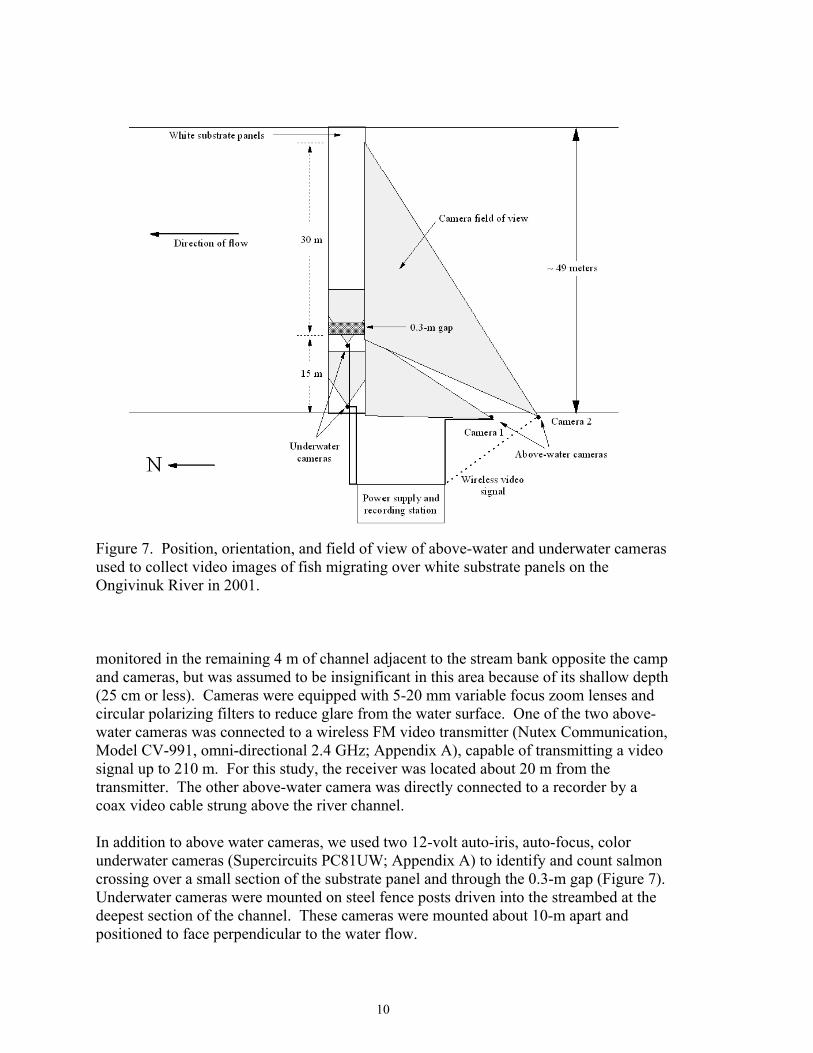
Figure 7. Position, orientation, and field of view of above-water and underwater cameras used to collect video images of fish migrating over white substrate panels on the Ongivinuk River in 2001. monitored in the remaining 4 m of channel adjacent to the stream bank opposite the camp and cameras, but was assumed to be insignificant in this area because of its shallow depth (25 cm or less). Cameras were equipped with 5-20 mm variable focus zoom lenses and circular polarizing filters to reduce glare from the water surface. One of the two above-water cameras was connected to a wireless FM video transmitter (Nutex Communication, Model CV-991, omni-directional 2.4 GHz; Appendix A), capable of transmitting a video signal up to 210 m. For this study, the receiver was located about 20 m from the transmitter. The other above-water camera was directly connected to a recorder by a coax video cable strung above the river channel. In addition to above water cameras, we used two 12-volt auto-iris, auto-focus, color underwater cameras (Supercircuits PC81UW; Appendix A) to identify and count salmon crossing over a small section of the substrate panel and through the 0.3-m gap (Figure 7). Underwater cameras were mounted on steel fence posts driven into the streambed at the deepest section of the channel. These cameras were mounted about 10-m apart and positioned to face perpendicular to the water flow.
10
In 2001, video images from the two above- and two underwater cameras were captured using a Digicorder 2000 Deluxe digital video recorder (Alpha System Laboratory; Appendix A), which functioned as both a four-channel multiplexer and video recording device. Video footage was captured at 2 to 4 frames/s at varying resolutions (352 x 480, 352 x 240 and 176 x 120), compressed using a hardware-driven, proprietary, modified-JPEG (Joint Photographic Experts Group) compression-decompression algorithm (CODEC), and recorded digitally on the hard drive of the recorder. The time, date, and title for each camera were digitally encoded on recorded video frames. Video files were off loaded from the hard disk for archival to Digital Versatile Disc - Random Access Memory (DVD-RAM) media using an external firewire high performance serial bus (Institute of Electrical and Electronics Engineers - IEEE 1394) DVD-RAM drive (Appendix A). In 2002, cameras, lenses, and digital video recorder were upgraded to improve resolution of recorded images and our ability to correctly identify fish species. Equipment upgrades, provided in Appendix A, included:
• One Gyyr four-channel Digital Video Management System (DVMS 400), capable of recording at a resolution of 720 x 486 per frame;
• Three 1/3-inch format CCD Toshiba IK-64WDA color cameras capable of 480 horizontal TV lines of resolution;
• Three Pelco F1.6/5-40 mm variable focus, auto-iris lenses equipped with 40.5 mm Tiffen circular polarizing filters;
• One Applied Microvideo color underwater camera capable 480 horizontal TV lines of resolution;
• One 43 cm Samsung SyncMaster 171MP liquid crystal display (LCD) monitor having low power requirements; and
• Two Cabelas 5-m tall tripod towers. Upgraded equipment was initially tested out of the water in King Salmon. Recording equipment and above- and underwater cameras were then transported to the Naknek River for further testing. Tests were conducted to determine effects of various camera settings, mounting positions and orientations, and field of view on image quality and our ability to correctly identify fish species. Upgraded cameras and recording equipment were installed on the Ongivinuk River on 30 August and operated until 27 September 2002. Three Toshiba IK-64WDA 24-volt, day/night cameras housed in outdoor camera enclosures were used to collect images of fish as they crossed the white substrate panel. An auto-iris, varifocal-length lens equipped with a circular polarizing filter was attached to each camera. A “super day/night exposure” camera setting was used that automatically activates a slow shutter function and switches cameras from a color to black and white signal, which enhanced their ability to operate in low light (reported to function down to 0.003 lux). Power consumption of the cameras was minimal (< 5 watts/camera).
11
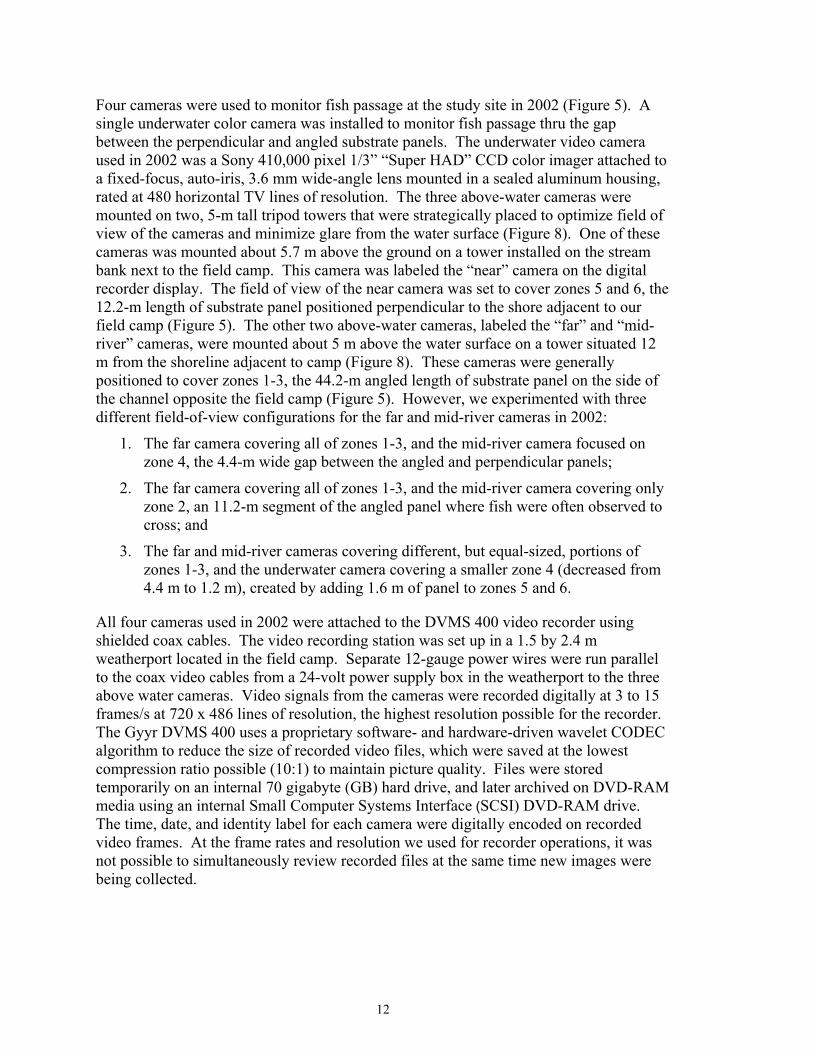
Four cameras were used to monitor fish passage at the study site in 2002 (Figure 5). A single underwater color camera was installed to monitor fish passage thru the gap between the perpendicular and angled substrate panels. The underwater video camera used in 2002 was a Sony 410,000 pixel 1/3” “Super HAD” CCD color imager attached to a fixed-focus, auto-iris, 3.6 mm wide-angle lens mounted in a sealed aluminum housing, rated at 480 horizontal TV lines of resolution. The three above-water cameras were mounted on two, 5-m tall tripod towers that were strategically placed to optimize field of view of the cameras and minimize glare from the water surface (Figure 8). One of these cameras was mounted about 5.7 m above the ground on a tower installed on the stream bank next to the field camp. This camera was labeled the “near” camera on the digital recorder display. The field of view of the near camera was set to cover zones 5 and 6, the 12.2-m length of substrate panel positioned perpendicular to the shore adjacent to our field camp (Figure 5). The other two above-water cameras, labeled the “far” and “mid-river” cameras, were mounted about 5 m above the water surface on a tower situated 12 m from the shoreline adjacent to camp (Figure 8). These cameras were generally positioned to cover zones 1-3, the 44.2-m angled length of substrate panel on the side of the channel opposite the field camp (Figure 5). However, we experimented with three different field-of-view configurations for the far and mid-river cameras in 2002:
1. The far camera covering all of zones 1-3, and the mid-river camera focused on zone 4, the 4.4-m wide gap between the angled and perpendicular panels;
2. The far camera covering all of zones 1-3, and the mid-river camera covering only zone 2, an 11.2-m segment of the angled panel where fish were often observed to cross; and
3. The far and mid-river cameras covering different, but equal-sized, portions of zones 1-3, and the underwater camera covering a smaller zone 4 (decreased from 4.4 m to 1.2 m), created by adding 1.6 m of panel to zones 5 and 6.
All four cameras used in 2002 were attached to the DVMS 400 video recorder using shielded coax cables. The video recording station was set up in a 1.5 by 2.4 m weatherport located in the field camp. Separate 12-gauge power wires were run parallel to the coax video cables from a 24-volt power supply box in the weatherport to the three above water cameras. Video signals from the cameras were recorded digitally at 3 to 15 frames/s at 720 x 486 lines of resolution, the highest resolution possible for the recorder. The Gyyr DVMS 400 uses a proprietary software- and hardware-driven wavelet CODEC algorithm to reduce the size of recorded video files, which were saved at the lowest compression ratio possible (10:1) to maintain picture quality. Files were stored temporarily on an internal 70 gigabyte (GB) hard drive, and later archived on DVD-RAM media using an internal Small Computer Systems Interface (SCSI) DVD-RAM drive. The time, date, and identity label for each camera were digitally encoded on recorded video frames. At the frame rates and resolution we used for recorder operations, it was not possible to simultaneously review recorded files at the same time new images were being collected.
12
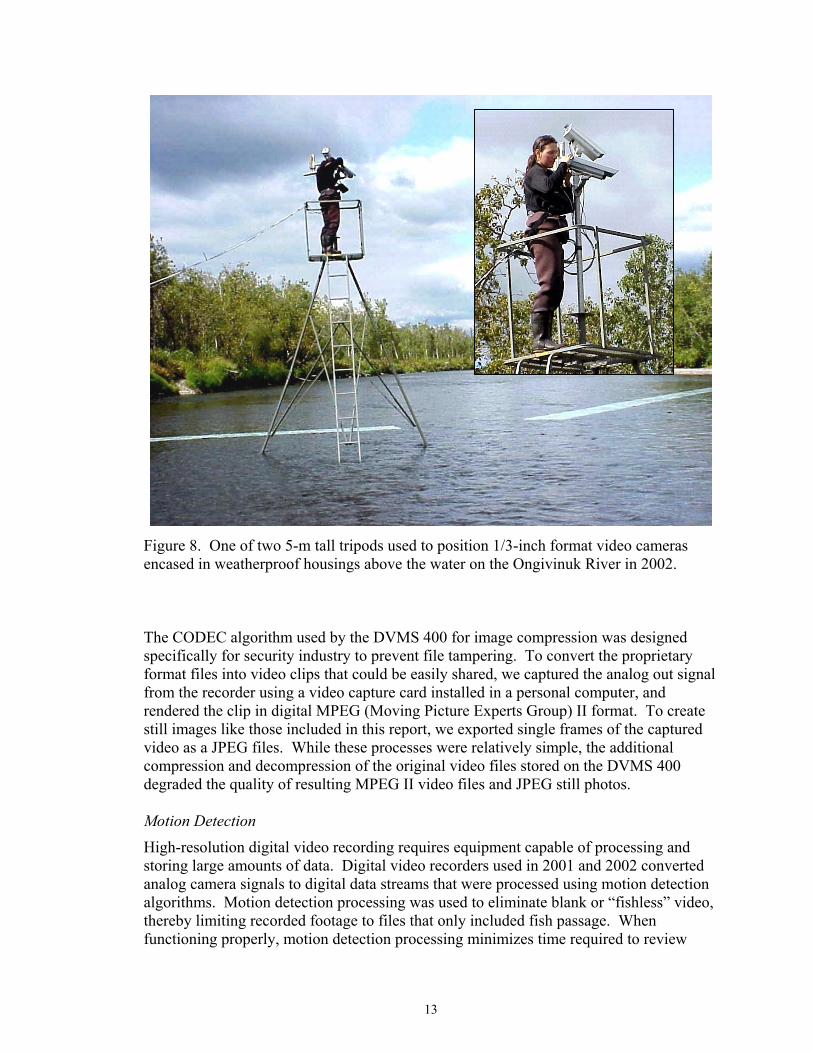
Figure 8. One of two 5-m tall tripods used to position 1/3-inch format video cameras encased in weatherproof housings above the water on the Ongivinuk River in 2002. The CODEC algorithm used by the DVMS 400 for image compression was designed specifically for security industry to prevent file tampering. To convert the proprietary format files into video clips that could be easily shared, we captured the analog out signal from the recorder using a video capture card installed in a personal computer, and rendered the clip in digital MPEG (Moving Picture Experts Group) II format. To create still images like those included in this report, we exported single frames of the captured video as a JPEG files. While these processes were relatively simple, the additional compression and decompression of the original video files stored on the DVMS 400 degraded the quality of resulting MPEG II video files and JPEG still photos. Motion Detection
High-resolution digital video recording requires equipment capable of processing and storing large amounts of data. Digital video recorders used in 2001 and 2002 converted analog camera signals to digital data streams that were processed using motion detection algorithms. Motion detection processing was used to eliminate blank or “fishless” video, thereby limiting recorded footage to files that only included fish passage. When functioning properly, motion detection processing minimizes time required to review
13
stored video files to identify and count passing fish. Recording was activated in response to live image pixel changes from a reference image, created by maintaining a running average of the last four individual reference images we set to update every 3-5 s. The motion detection program was configured to temporarily store a 3 s pre-event in a memory buffer so the recorder could access and record the 3 s of video that preceded each motion detection event. Motion detection programs used in both 2001 and 2002 incorporated user-defined motion detection zones, or masking areas. The sensitivity and size of the object to be detected in motion detection zones were set individually for each camera. The substrate panels, as viewed by above water cameras, were typically set as masking areas. Between 22 and 25 September 2002, two tests were conducted to determine the effectiveness of the video motion detection algorithm. First, motion-triggered video files were reviewed to determine the percentage of correct versus false triggers for each camera. A trigger was defined as an event that activated the motion detection program and subsequent recording of a file to the hard drive. A trigger was considered correct if the recorded file contained fish, and false if it did not. We counted correct and false triggers separately for each camera and stratified counts based on time of day: morning (0700 - 0900 hours), daylight (0900 - 1900 hours), dark (1900–2100 hours), and evening (2100 – 0700 hours). Morning and evening crepuscular periods were distinguished from daylight and dark periods because of rapid changes in light that occur during sunrise and sunset and because of their extreme differences in orientation to the sun in relation to camera placement. Effectiveness of motion detection was also assessed for each camera by comparing fish counts taken from motion-triggered video files to counts tallied manually in “real-time” by observers watching a live display of the monitoring site on a four-panel split screen. Observers recorded numbers of fish passing each camera’s field-of-view; direction of fish movement (upstream, downstream, up-down, or down-up); passage zone; time; and whether the recorder detected motion. Observers monitored the display working independently on 1- to 2-h shifts during selected periods between 22 and 25 September 2002. Observers monitored a total of 17.5 h during 22-24 September with cameras positioned in configuration two (far camera covering zones 1-3; mid-river camera covering only zone 2). Observers monitored fish passage between 17:00 and 23:00 hours on 25 September (total of 6 h) with cameras set in configuration three (far and mid-river cameras covering zones 1-3; underwater camera covering reduced zone 4 panel gap), which was thought to be the optimal arrangement of cameras and panels given the available equipment. Lighting
A variety of equipment was tested in 2001 and 2002 to determine optimal lighting conditions for collecting images of fish at night, including a light-emitting diode (LED) rope light, underwater pond lights, and above-water floodlights (Appendix A). In 2001, two 40-watt pond lights were mounted underwater on fence posts just above each underwater camera. The angle of the lights was set to maximize image quality. We also experimented with different bulbs, ranging from spot (20 degrees) to flood (40 degrees).
14
In 2002, we tested the effectiveness of a 46-m long 12-volt LED rope light we adapted for underwater use. The LED rope light was stretched across the channel at the study site, and positioned intermittently both above and beneath white substrate panels to determine if direct or diffused light provided the best image quality. The LED rope light was secured in the center of the panels using plastic cable ties. Power to the light was modified to minimize power consumption using a pulse wave modulator, which allowed pulse frequency and brightness to be adjusted. We also examined the use of high beam auto headlights to illuminate the substrate panels and gap at night. One headlight was secured to the tower on the stream bank adjacent to camp to illuminate zones 5 and 6. A second headlight was mounted on the tower located in the channel and was positioned to illuminate zones 1-3. A third headlight was mounted on a pole 2 m from the gap to test its effectiveness in improving lighting for the underwater camera. Visibility
In 2001, light intensity, turbidity, and underwater visibility were measured to estimate the effective distance that underwater cameras could clearly view fish under varying conditions. Light intensity was measured at 1-h intervals on the Ongivinuk River with a HOBO-Light Intensity Logger suspended just above the water surface, to assess its influence on underwater visibility in the Ongivinuk and Togiak rivers. Turbidity was measured in both the Ongivinuk and Togiak rivers with a Hach DR/2000 Spectrophotometer. Underwater visibility was assessed in both rivers using a 300-mm diameter Secchi disk viewed by an underwater observer. The disc was moved slowly away from a stationary observer equipped with a mask and snorkel until it faded from the observer’s sight, and maximum viewable distance was measured with a fiberglass tape. Underwater observer visibility in the Ongivinuk and Togiak rivers was compared using a correlation analysis. Secchi disc readings were also collected daily from the two underwater cameras operated in the Ongivinuk River. An observer monitored the LCD video display while a second individual slowly moved the disc away from the camera until it faded from view, with visible distance again measured with a fiberglass tape. Underwater camera visibility was compared to measurements collected by an underwater observer using correlation analysis. In 2002, turbidity measurements were taken at four locations in the Naknek River drainage using a Global Water GL400 turbidity logger. At the same time turbidity was measured, a Secchi disc reading was taken by an observer monitoring an LCD display attached to an underwater camera and the Alpha Systems Laboratory digital video recorder. Location and timing of sampling were selected so visibility would be measured over a wide range of turbidity conditions. The underwater camera was positioned perpendicular to stream flow, with the turbidity sensor placed beside it. We assumed turbidity was uniform between the underwater camera and the Secchi disc. The influence of turbidity on underwater camera visibility was assessed by fitting a second-degree polynomial model to the resulting data set using the trend function of Microsoft Excel (Microsoft 2002). In September, the turbidity logger was installed and operated in the Togiak River, just upstream from its confluence with the Ongivinuk River.
15
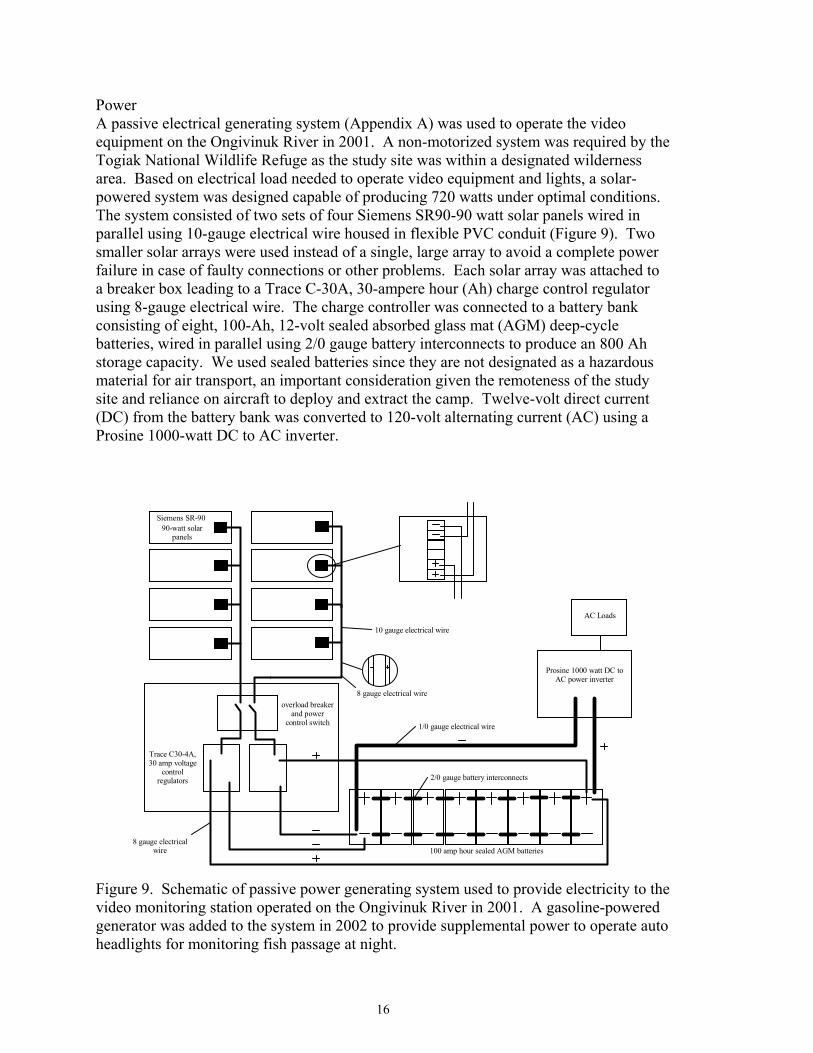
Power A passive electrical generating system (Appendix A) was used to operate the video equipment on the Ongivinuk River in 2001. A non-motorized system was required by the Togiak National Wildlife Refuge as the study site was within a designated wilderness area. Based on electrical load needed to operate video equipment and lights, a solar-powered system was designed capable of producing 720 watts under optimal conditions. The system consisted of two sets of four Siemens SR90-90 watt solar panels wired in parallel using 10-gauge electrical wire housed in flexible PVC conduit (Figure 9). Two smaller solar arrays were used instead of a single, large array to avoid a complete power failure in case of faulty connections or other problems. Each solar array was attached to a breaker box leading to a Trace C-30A, 30-ampere hour (Ah) charge control regulator using 8-gauge electrical wire. The charge controller was connected to a battery bank consisting of eight, 100-Ah, 12-volt sealed absorbed glass mat (AGM) deep-cycle batteries, wired in parallel using 2/0 gauge battery interconnects to produce an 800 Ah storage capacity. We used sealed batteries since they are not designated as a hazardous material for air transport, an important consideration given the remoteness of the study site and reliance on aircraft to deploy and extract the camp. Twelve-volt direct current (DC) from the battery bank was converted to 120-volt alternating current (AC) using a Prosine 1000-watt DC to AC inverter.
8 gauge electrical wire
1/0 gauge electrical wire
2/0 gauge battery interconnects
10 gauge electrical wire
overload breaker and power
control switch
Trace C30-4A, 30 amp voltage
control regulators
Siemens SR-90 90-watt solar
panels
Prosine 1000 watt DC to AC power inverter
AC Loads
8 gauge electrical wire
100 amp hour sealed AGM batteries
Figure 9. Schematic of passive power generating system used to provide electricity to the video monitoring station operated on the Ongivinuk River in 2001. A gasoline-powered generator was added to the system in 2002 to provide supplemental power to operate auto headlights for monitoring fish passage at night.
16
In 2002, A Honda EU3000is gasoline-powered generator (Appendix A) was used to supplement solar power as needed, which was almost exclusively at night to power the headlights. A “Minimum Requirements Analysis” was prepared and submitted to the Togiak National Wildlife Refuge to document the need for the generator and to specify guidelines for its use. The request was approved by the Refuge, permitting the generator to be used in the wilderness area. The remaining components of the power system were the same as used in 2001, except that upgraded above-water cameras were hardwired directly to a 24-volt power supply box connected to the DC to AC power inverter.
Results
Contrasting Substrate Panels
The HDPE white substrate panels functioned well and required little maintenance. Debris had to be removed from the panels about every 4-5 days, and algal growth had to be cleaned off the panels about once a week using a broom. Debris had a tendency to collect on the eyebolts and chain connectors used to hold the panels in place in 2001. This problem was lessened in 2002 by removing this hardware and using plastic cable ties to connect panels to the cable and to one another. Cable ties were easy to install, made a smooth connection that did not catch debris, and were not readily visible in the video display. Pressure on the substrate panels occasionally broke some cable ties, which were replaced. A review of video files collected in 2001 showed that fish tended to pass over the small (0.3 m) break in the continuous panel (Figure 2). Similar observations were made during tests conducted on the Naknek River in 2002, suggesting that upstream migrant salmon were, at times, hesitant to cross the white substrate panels. Over a combined 17.5 h of discontinuous sampling during 22-24 September 2002, coho salmon were observed to pass the monitoring site most often in zone 2 (62%) and to a lesser degree in zones 1, 3, and 4, which ranged from 10-15% (Table 1). When counts were weighted by zone width, passage rates were greatest in zone 2 (6.4 coho salmon/m/test period), followed by the gap in zone 4 (3.0 coho salmon/m/test period). During the combined 6 h of discontinuous sampling done on 25 September after panels were added to zones 5 and 6 to narrow the width of zone 4 (the gap), which was then lit using an auto headlamp, most coho salmon were observed crossing in zone 3 (27%), followed by zones 2, 4, and 6, which ranged from 14-21% (Table 2). However, weighted upstream passage rates were considerably higher in zone 4 (the gap; 28.3 fish/m/test period) than in the other five zones. On several occasions, video footage was recorded from the far and mid-river cameras that showed coho salmon moving upriver along the downstream edge of the angled panel, sometimes following the lip of the panel for over 20 m before reaching the gap. These fish often crossed over the corner of the end panel in zone 3 to reach the gap monitored by the underwater camera. Coho salmon crossing through the edge of zone 3 were included in zone 3 counts, even though they eventually entered the gap in zone 4 and were clearly visible in the underwater camera's field-of-view.
17
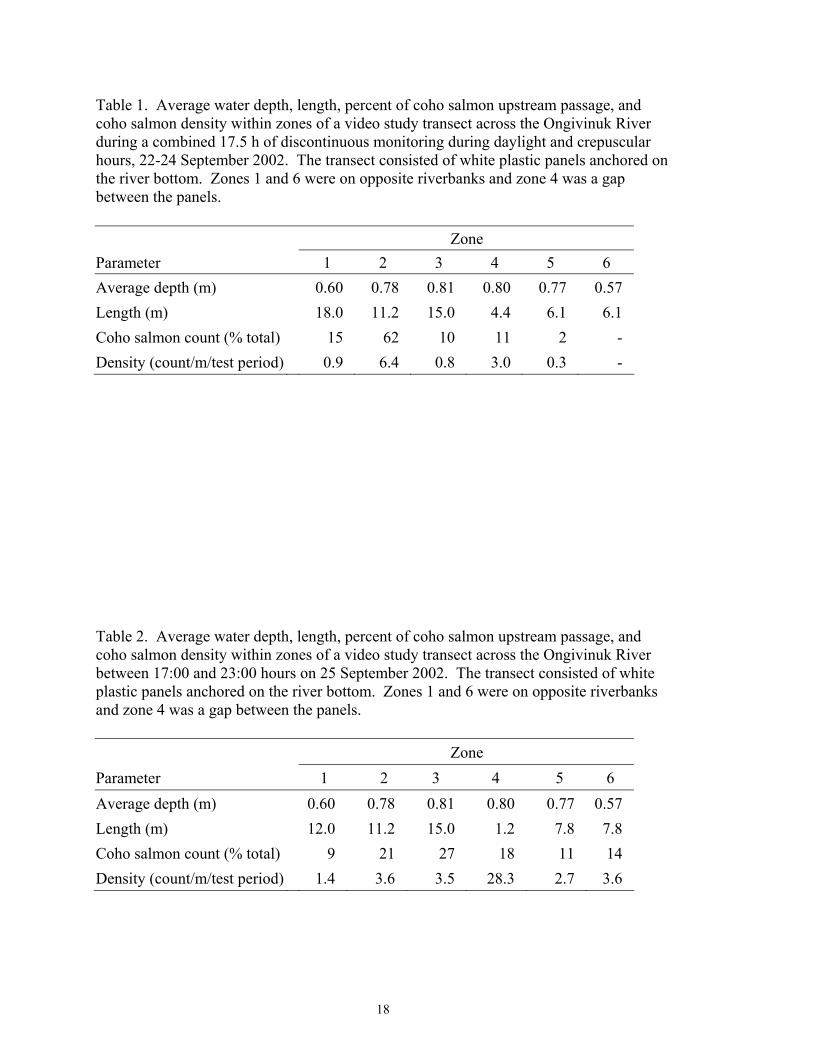
Table 1. Average water depth, length, percent of coho salmon upstream passage, and coho salmon density within zones of a video study transect across the Ongivinuk River during a combined 17.5 h of discontinuous monitoring during daylight and crepuscular hours, 22-24 September 2002. The transect consisted of white plastic panels anchored on the river bottom. Zones 1 and 6 were on opposite riverbanks and zone 4 was a gap between the panels.
Zone Parameter 1 2 3 4 5 6 Average depth (m) 0.60 0.78 0.81 0.80 0.77 0.57 Length (m) 18.0 11.2 15.0 4.4 6.1 6.1 Coho salmon count (% total) 15 62 10 11 2 - Density (count/m/test period) 0.9 6.4 0.8 3.0 0.3 -
Table 2. Average water depth, length, percent of coho salmon upstream passage, and coho salmon density within zones of a video study transect across the Ongivinuk River between 17:00 and 23:00 hours on 25 September 2002. The transect consisted of white plastic panels anchored on the river bottom. Zones 1 and 6 were on opposite riverbanks and zone 4 was a gap between the panels.
Zone Parameter 1 2 3 4 5 6 Average depth (m) 0.60 0.78 0.81 0.80 0.77 0.57 Length (m) 12.0 11.2 15.0 1.2 7.8 7.8 Coho salmon count (% total) 9 21 27 18 11 14 Density (count/m/test period) 1.4 3.6 3.5 28.3 2.7 3.6
18
Video Recording
Above-water cameras used in 2001 functioned well under most conditions, but limitations in resolution often hindered our ability to identify species of adult fish from either uncompressed live or recorded video footage (Figures 10 and 11). The above-water camera focused on the 15-m section of substrate panel performed better than the above-water camera directed at the 30-m section of panel across the channel. This was because the camera monitoring the 30-m section of panel was positioned too far from the substrate panel and often captured low resolution images during hazy, foggy, or rainy weather. Under low light, particularly during crepuscular periods without supplemental lighting, images from both above-water cameras became dark, distorted, and grainy, and fish could not be readily identified. It was also difficult to view fish during early mornings on clear days, as polarizing filters did not adequately block intense glare from the water surface. While substrate panels were visible under these conditions, smaller-sized salmon and resident fish were difficult to see. Heavy rain and fog degraded the quality of images collected from both above-water cameras. Overall, about 5 to 15 h (5 to 15% of total viewing time) of video collected during daylight hours each week were unclear due to fog, rain, or glare. In general, underwater cameras used in 2001 provided images that allowed reviewers to identify fish species as far as 3 m from the lens during daylight hours (Figures 12, 13, and 14). However, one of the two underwater cameras used in 2001 leaked and was returned to the manufacturer, who recommended using grease to seal the connection from the camera to the cable. We experienced a few software problems with the digital recorder used in 2001, but were able to correct most of them. A display problem occurred that was remedied by reducing hardware acceleration from full to none under the display properties of the Windows 98 Operating System. In addition, when stored images were being copied to DVD-RAM media using Alpha Systems Laboratory software, we were not able to simultaneously record live images to the hard drive. This problem was corrected by transferring files to DVD-RAM media in a background window using Windows Explorer instead of the recorder’s software. Another limitation of the Alpha Systems Laboratory digital recorder was that it compressed files using a proprietary, hardware-driven, modified JPEG-format CODEC designed to protect files from tampering, a feature designed specifically for the security industry. We attempted to process recorded video files using motion detection processing and tallying software (Salmonsoft) in use by the Fairbanks Fish and Wildlife Field Office, but could not do so because of the proprietary nature of the file format. At the time this study was conducted, Salmonsoft software required video files be in an Audio Video Interleaved (AVI) format. We were, however, able to create still JPEG images, such as those included in this report, using an image capture feature of the digital recorder’s software. The wireless FM video transmitter connected to one of the above-water cameras functioned well throughout the duration of the study in 2001. Images collected with inexpensive wireless transmitters such as the one we used, are often reported to be degraded when compared to signals transmitted using shielded coaxial video cable. While we did not notice any deterioration in image quality, one or two frames of wireless video were distorted whenever a boat passed the study site.
19
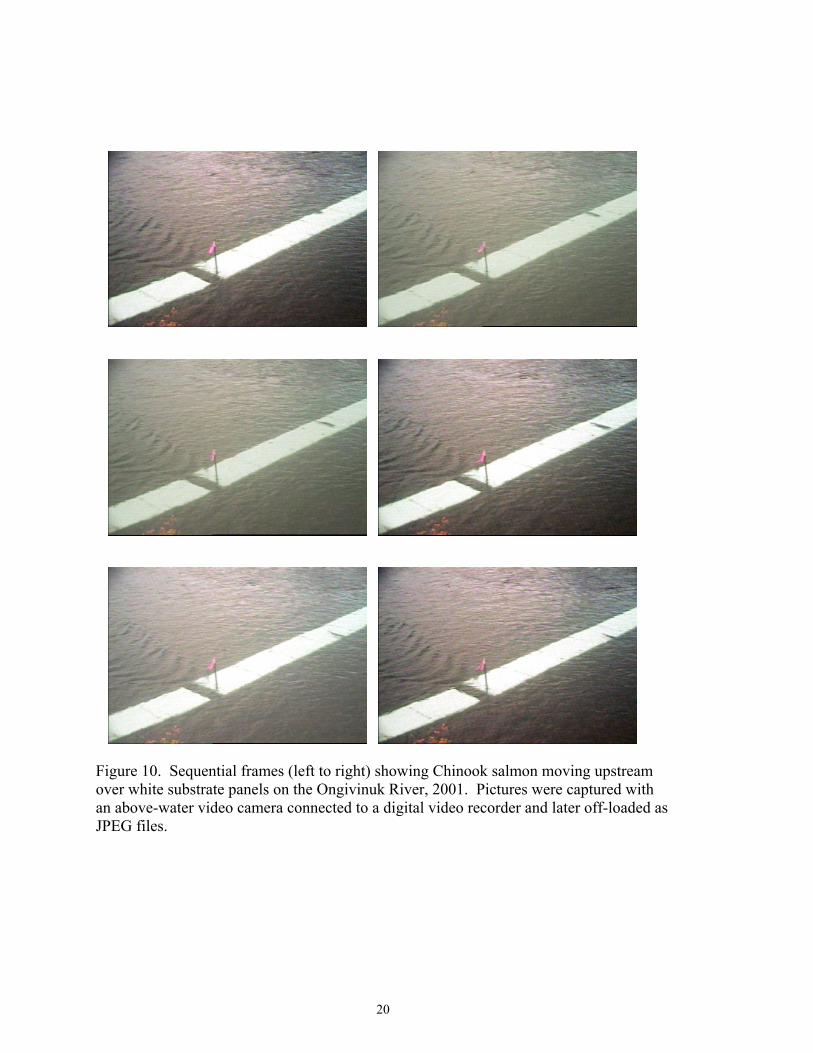
Figure 10. Sequential frames (left to right) showing Chinook salmon moving upstream over white substrate panels on the Ongivinuk River, 2001. Pictures were captured with an above-water video camera connected to a digital video recorder and later off-loaded as JPEG files.
20
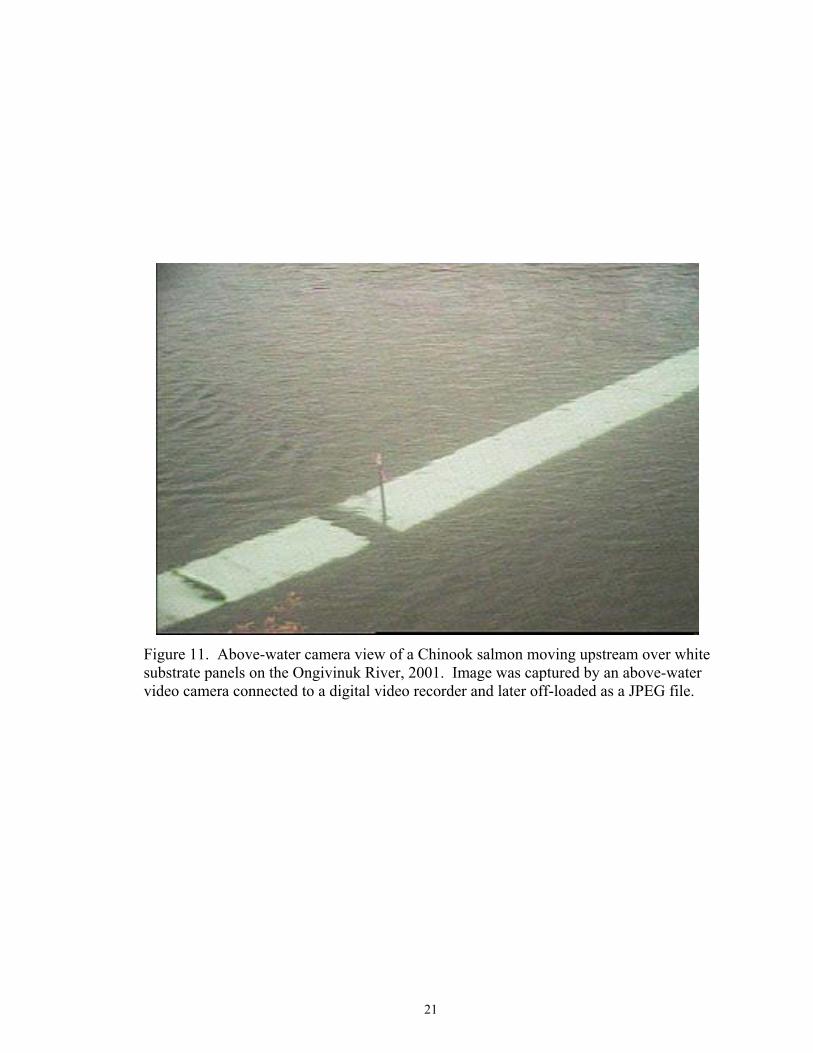
Figure 11. Above-water camera view of a Chinook salmon moving upstream over white substrate panels on the Ongivinuk River, 2001. Image was captured by an above-water
ideo camera connected to a digital video recorder and later off-loaded as a JPEG file. v
21
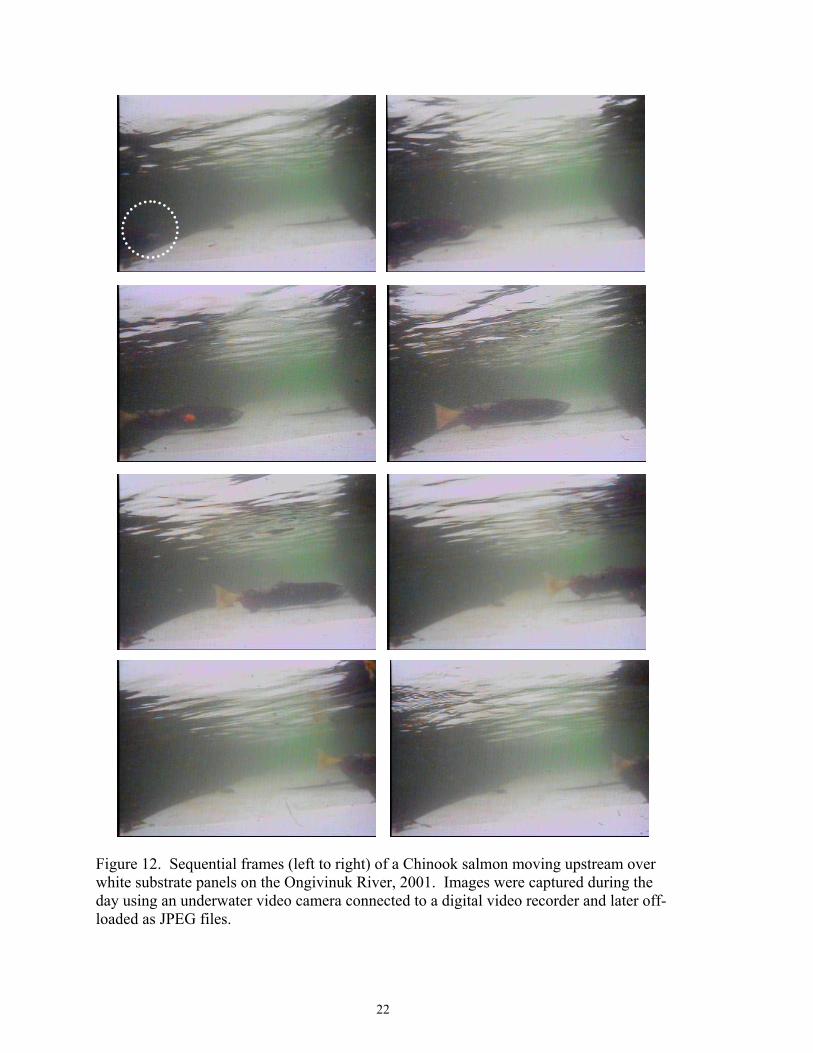
Figure 12. Sequential frames (left to right) of a Chinook salmon moving upstream over white substrate panels on the Ongivinuk River, 2001. Images were captured during the day using an underwater video camera connected to a digital video recorder and later off-loaded as JPEG files.
22
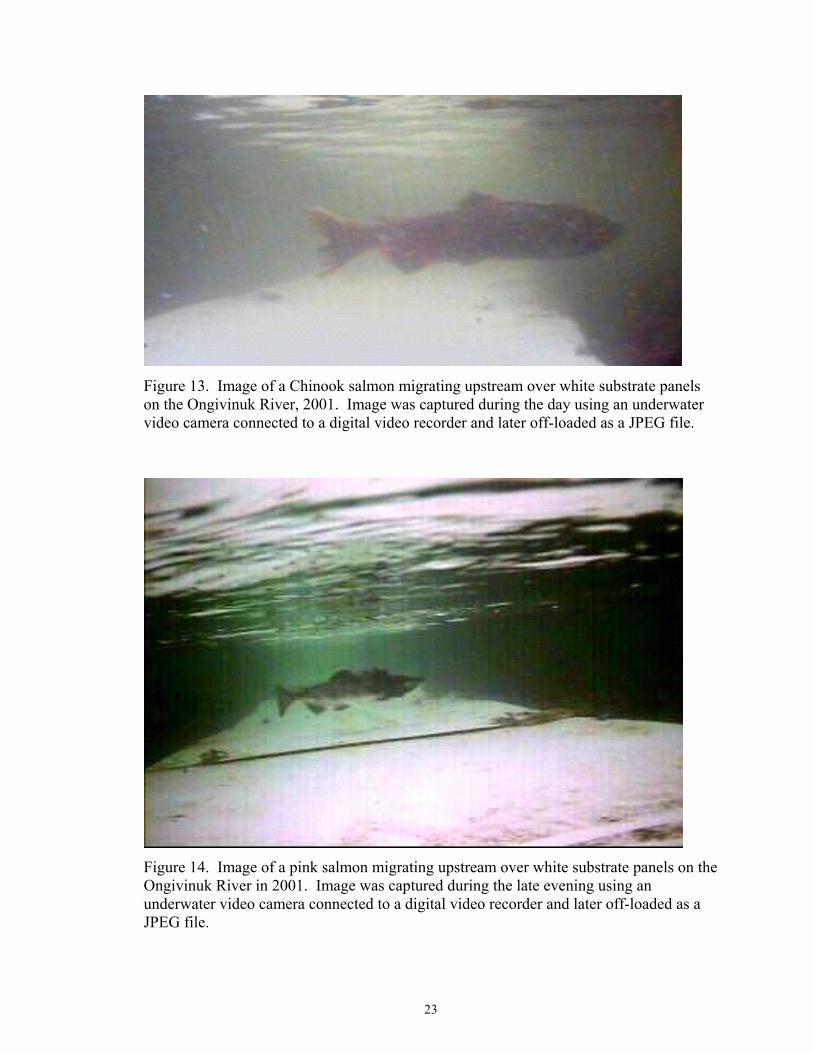
Figure 13. Image of a Chinook salmon migrating upstream over white substrate panels on the Ongivinuk River, 2001. Image was captured during the day using an underwater video camera connected to a digital video recorder and later off-loaded as a JPEG file.
Figure 14. Image of a pink salmon migrating upstream over white substrate panels on the Ongivinuk River in 2001. Image was captured during the late evening using an underwater video camera connected to a digital video recorder and later off-loaded as a JPEG file.
23
Higher resolution above-water cameras used in 2002 improved the quality of the uncompressed video stream and recorded files over that observed in 2001. Although the above-water cameras and auto-iris lenses functioned well over a variety of light conditions, they were somewhat complex to set because of numerous options and available configurations. The Pelco camera enclosures also functioned well except for occasional fogging of the glass window, and provided easy access to cameras. The tripod towers provided a relatively stable mount for the cameras and allowed settings to be changed with the cameras firmly mounted in their operating positions (Figure 8). The clarity of live and recorded underwater video pictures was substantially improved in 2002 from those observed in 2001. Species of adult salmon were readily identifiable on recorded images to a distance of about 4.5 m from the lens, depending on fish size and water clarity (Figures 15 and 16). Within about 2 m, we could also distinguish the species of most adult resident fish. The underwater camera was easy to use, and functioned well throughout the duration of the study. The lens had to be cleaned about once a week and the camera housing had to occasionally be cleaned of debris, which would partially block the field of view. The Gyyr DVMS 400 digital video recorder used in 2002 was reliable, relatively simple to operate, and, due to its high recording resolution, rendered considerably higher resolution video than the recorder used in 2001. Image quality of above-water cameras used in 2002 appeared to be most influenced by field-of-view width and camera orientation in relation to the sun. In the first camera configuration tested (far camera covering zones 1-3, mid-river camera covering zone 4), resolution and quality of images from the above-water camera focused on zone 4 (the gap at the apex of the V-shaped panel formation) were relatively high during the day, although intense glare off the water surface, particularly in the early morning hours, prevented effective viewing of the substrate. In camera configuration two (far camera covering zones 1-3, mid-river camera covering zone 2), the mid-river camera set at a field-of-view width of 11.2 m produced relatively clear images (Figures 17 and 18) and coho salmon were identifiable from video files. However, quality of images collected with the far camera set at a field-of-view width of 44.2 m, was variable. Salmon species crossing the substrate panels in the image foreground of zone 3 could be identified, while those crossing in the image background in zone 1 could not be identified. In camera configuration three (far and mid-river cameras covering different portions of zones 1-3, and an underwater camera covering a smaller zone 4), both the far (17 m field of view) and mid-river (9.7 m field of view) cameras produced good quality video, although coho salmon were more easily identified from mid-river camera video files.
24
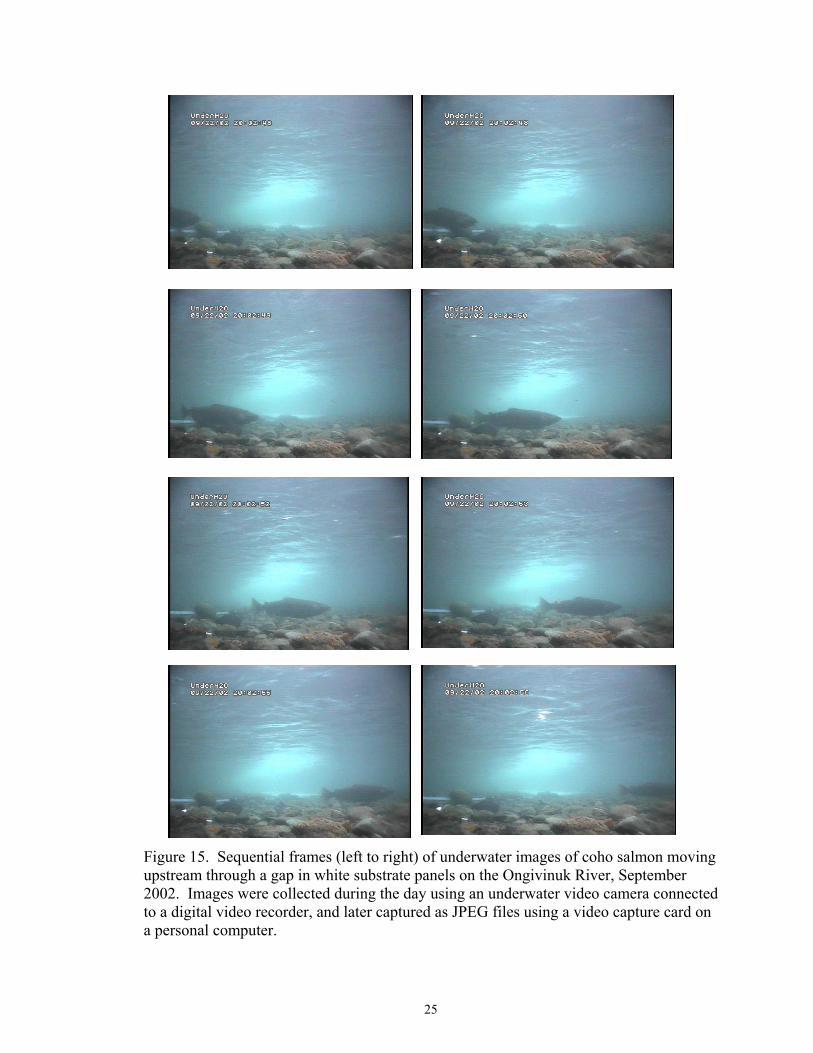
Figure 15. Sequential frames (left to right) of underwater images of coho salmon moving upstream through a gap in white substrate panels on the Ongivinuk River, September 2002. Images were collected during the day using an underwater video camera connected to a digital video recorder, and later captured as JPEG files using a video capture card on a personal computer.
25
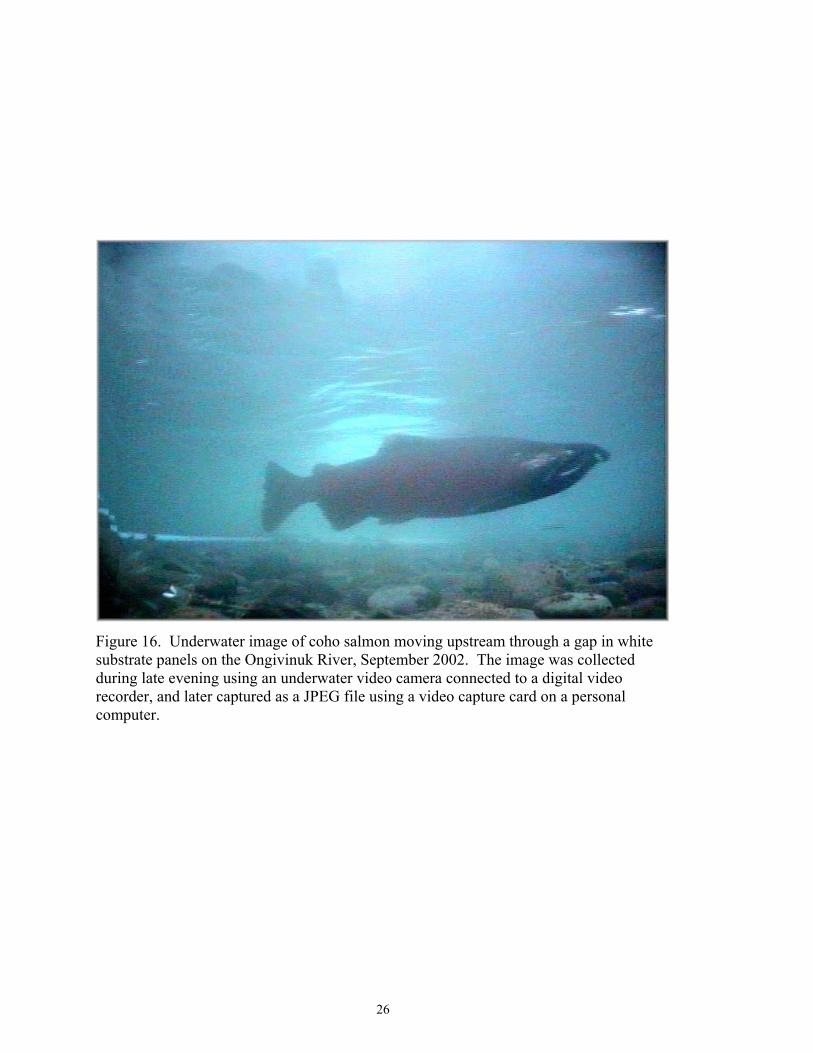
Figure 16. Underwater image of coho salmon moving upstream through a gap in white substrate panels on the Ongivinuk River, September 2002. The image was collected during late evening using an underwater video camera connected to a digital video recorder, and later captured as a JPEG file using a video capture card on a personal computer.
26
Figure 17. Sequential frames (left to right) of coho salmon moving upstream across white substrate panels on the Ongivinuk River, September 2002. Images were collected during the day using the mid-river above-water video camera connected to a digital video recorder, and later captured as JPEG files using a video capture card on a personal computer.
27
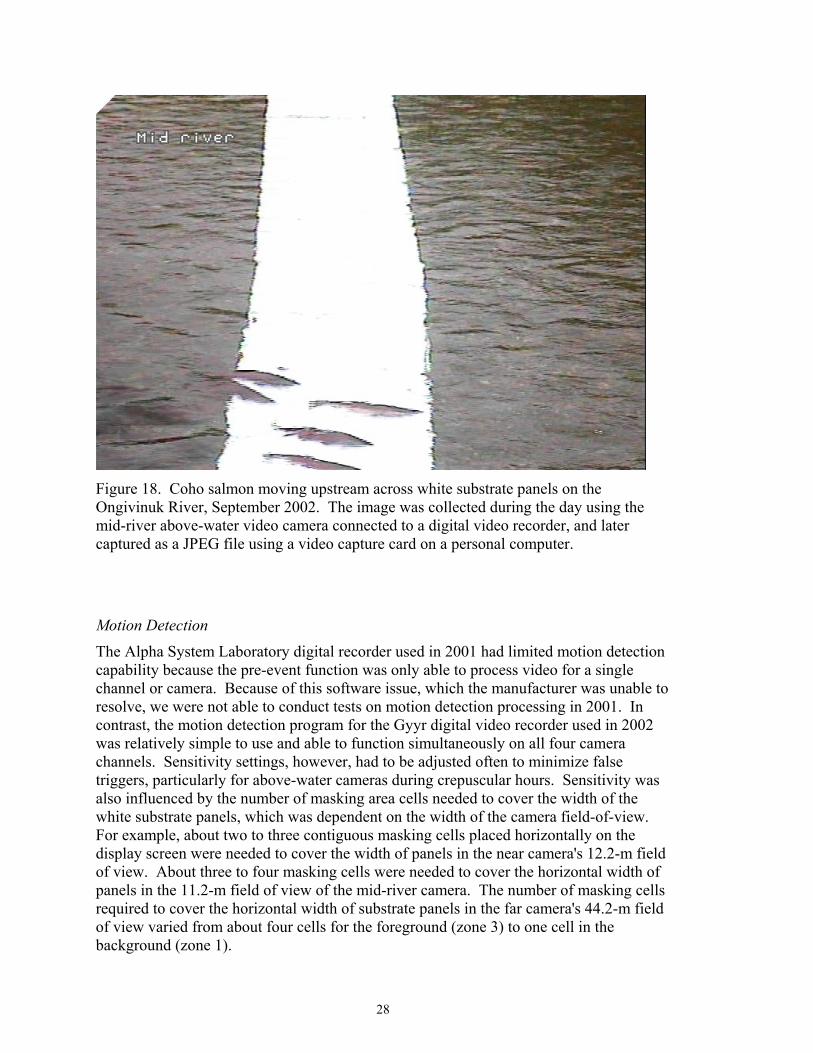
Figure 18. Coho salmon moving upstream across white substrate panels on the Ongivinuk River, September 2002. The image was collected during the day using the mid-river above-water video camera connected to a digital video recorder, and later captured as a JPEG file using a video capture card on a personal computer.
Motion Detection
The Alpha System Laboratory digital recorder used in 2001 had limited motion detection capability because the pre-event function was only able to process video for a single channel or camera. Because of this software issue, which the manufacturer was unable to resolve, we were not able to conduct tests on motion detection processing in 2001. In contrast, the motion detection program for the Gyyr digital video recorder used in 2002 was relatively simple to use and able to function simultaneously on all four camera channels. Sensitivity settings, however, had to be adjusted often to minimize false triggers, particularly for above-water cameras during crepuscular hours. Sensitivity was also influenced by the number of masking area cells needed to cover the width of the white substrate panels, which was dependent on the width of the camera field-of-view. For example, about two to three contiguous masking cells placed horizontally on the display screen were needed to cover the width of panels in the near camera's 12.2-m field of view. About three to four masking cells were needed to cover the horizontal width of panels in the 11.2-m field of view of the mid-river camera. The number of masking cells required to cover the horizontal width of substrate panels in the far camera's 44.2-m field of view varied from about four cells for the foreground (zone 3) to one cell in the background (zone 1).
28
Between 22-24 September 2002, the percentage of correct triggers, when coho salmon were present in recorded images, ranged from a high of 70% for the mid-river camera during the day to a low of about 1% for the near camera during the evening (Table 3). The percentage of correct triggers for all time periods combined ranged from 12% for the underwater and near cameras to 61% for the mid-river camera. After cameras were repositioned and tested on 25 September, the percentage of correct triggers was highest for the mid-river camera, followed by the underwater and near cameras (Table 4). The lowest percentages of correct triggers during the entire test period were obtained with the far camera: 1% during the day and 3% during the evening. Testing was not done during the morning. For the 17.5 h of discontinuous monitoring completed between 22-24 September 2002, observer counts of coho salmon varied by time period and by camera with counts generated from reviewing motion-triggered recorded files. Images captured using the recorder's motion detection system accounted for 50% to 100% of coho salmon counted in real time by observers during the four time periods sampled and in various zones (Table 5). Of the four cameras used, the mid-river camera, which had the narrowest field of view of above-water cameras, captured the highest (86%) and the underwater camera the lowest (67%) percentage of coho salmon counted in real time by observers from the live video display for all periods combined. During the 6 h of continuous monitoring conducted between 17:00 and 23:00 h on 25 September 2002, images captured using the recorder's motion detection system accounted for 0% to 100% of coho salmon counted in real time by observers (Table 6). The mid-river camera again captured the highest percentage (94%) of coho salmon counted by observers for all periods combined. However, the far rather than the underwater camera accounted for the lowest (59%) percentage. The underwater camera detected a greater percentage of coho salmon counted by observers on 25 September (84%) than during 22-24 September (67%), which was probably a result of decreasing the field of view needed to cover zone 4 (Tables 5 and 6). This zone was decreased on 25 September by repositioning the panels to form a 1.2 m rather than a 4.4 m gap. Escapement of coho salmon during 17.5 h of discontinuous testing that was done between 22-24 September 2002 was estimated to be 383 based on counts by observers monitoring the live video display, and 280 based on review of motion detection video files. In comparing real-time observer counts to those obtained from recorded video files, we discovered that observers missed 16 salmon that could clearly be distinguished from captured video. In addition, observers over- and under-counted salmon that crossed the panel in groups or “zigzagged” back and forth across the panels at high speeds. Miscounts by observers counting in real time off the live video display were determined by playing recorded video files in slow motion, freezing individual frames, and replaying complex segments of video multiple times. These features of the DVMS 400 allowed the final direction of individual fish passing the site to be accurately determined and
29
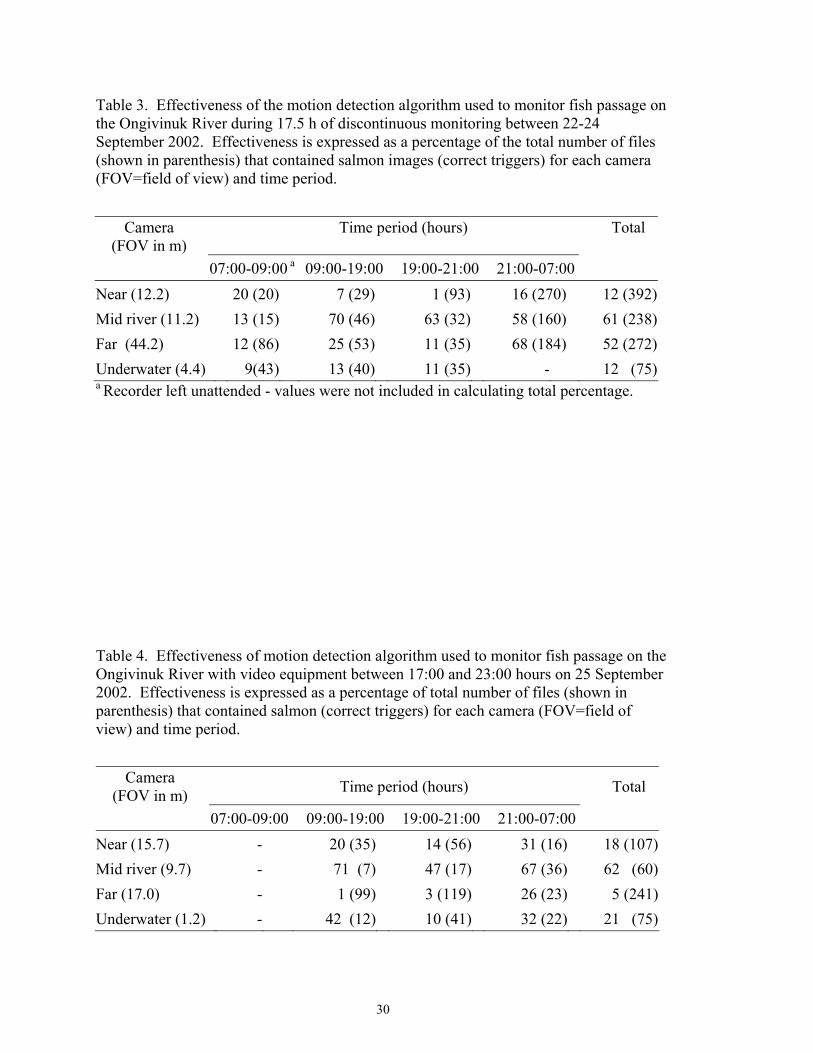
Table 3. Effectiveness of the motion detection algorithm used to monitor fish passage on the Ongivinuk River during 17.5 h of discontinuous monitoring between 22-24 September 2002. Effectiveness is expressed as a percentage of the total number of files (shown in parenthesis) that contained salmon images (correct triggers) for each camera (FOV=field of view) and time period.
a Recorder left unattended - values were not included in calculating total percentage.
Camera (FOV in m)
Time period (hours) Total
07:00-09:00 a 09:00-19:00 19:00-21:00 21:00-07:00 Near (12.2) 20 (20) 7 (29) 1 (93) 16 (270) 12 (392)Mid river (11.2) 13 (15) 70 (46) 63 (32) 58 (160) 61 (238)Far (44.2) 12 (86) 25 (53) 11 (35) 68 (184) 52 (272)Underwater (4.4) 9(43) 13 (40) 11 (35) - 12 (75)
Table 4. Effectiveness of motion detection algorithm used to monitor fish passage on the Ongivinuk River with video equipment between 17:00 and 23:00 hours on 25 September 2002. Effectiveness is expressed as a percentage of total number of files (shown in parenthesis) that contained salmon (correct triggers) for each camera (FOV=field of view) and time period.
Camera (FOV in m) Time period (hours) Total
07:00-09:00 09:00-19:00 19:00-21:00 21:00-07:00 Near (15.7) - 20 (35) 14 (56) 31 (16) 18 (107)Mid river (9.7) - 71 (7) 47 (17) 67 (36) 62 (60)Far (17.0) - 1 (99) 3 (119) 26 (23) 5 (241)Underwater (1.2) - 42 (12) 10 (41) 32 (22) 21 (75)
30
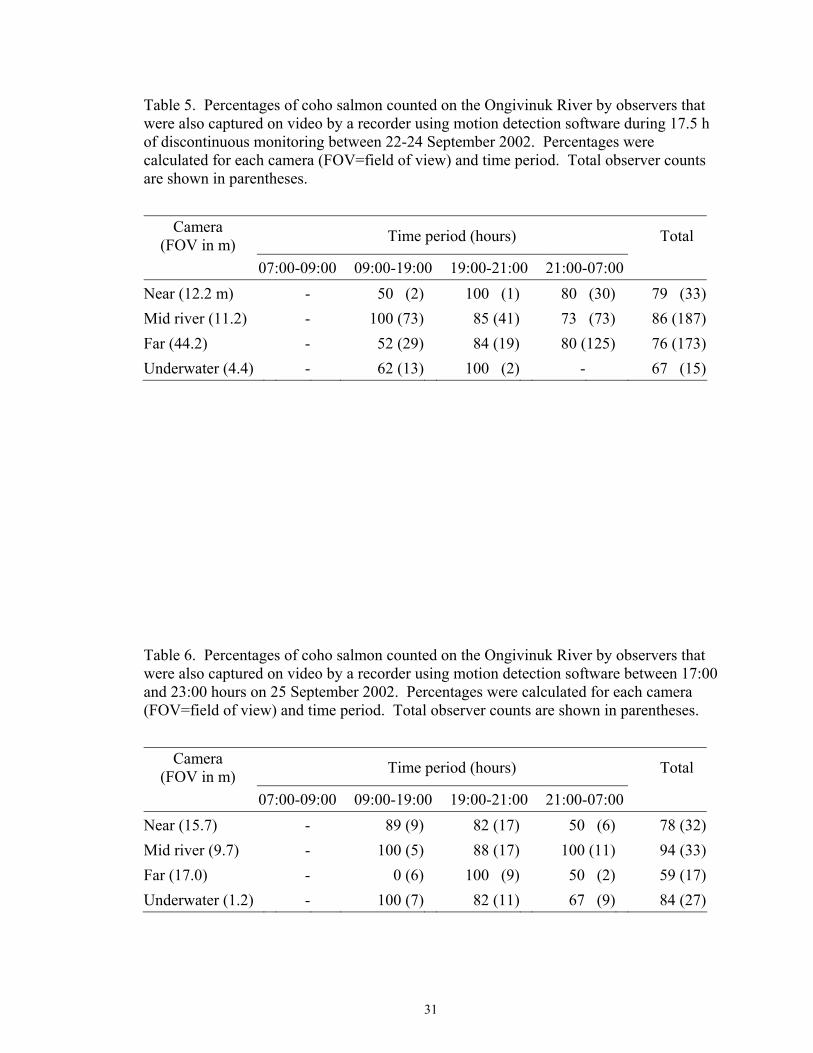
Table 5. Percentages of coho salmon counted on the Ongivinuk River by observers that were also captured on video by a recorder using motion detection software during 17.5 h of discontinuous monitoring between 22-24 September 2002. Percentages were calculated for each camera (FOV=field of view) and time period. Total observer counts are shown in parentheses.
Camera
(FOV in m) Time period (hours) Total
07:00-09:00 09:00-19:00 19:00-21:00 21:00-07:00 Near (12.2 m) - 50 (2) 100 (1) 80 (30) 79 (33)Mid river (11.2) - 100 (73) 85 (41) 73 (73) 86 (187)Far (44.2) - 52 (29) 84 (19) 80 (125) 76 (173)Underwater (4.4) - 62 (13) 100 (2) - 67 (15)
Table 6. Percentages of coho salmon counted on the Ongivinuk River by observers that were also captured on video by a recorder using motion detection software between 17:00 and 23:00 hours on 25 September 2002. Percentages were calculated for each camera (FOV=field of view) and time period. Total observer counts are shown in parentheses.
Camera (FOV in m) Time period (hours) Total
07:00-09:00 09:00-19:00 19:00-21:00 21:00-07:00 Near (15.7) - 89 (9) 82 (17) 50 (6) 78 (32) Mid river (9.7) - 100 (5) 88 (17) 100 (11) 94 (33)Far (17.0) - 0 (6) 100 (9) 50 (2) 59 (17)Underwater (1.2) - 100 (7) 82 (11) 67 (9) 84 (27)
31
individuals within large groups to be differentiated and correctly enumerated. Observers over-counted a total of 31 and under-counted a total of seven coho salmon during this test period. Escapement of coho salmon during the 6-h test period on 25 September, 2002 was estimated to be 98 fish based on observer counts and 73 based on review of motion detection video files. In comparing observer counts to those obtained from video files, we discovered that observers missed six coho salmon that were captured on video, in addition to over-counting eight and under-counting five coho salmon during the test period. Lighting
Underwater pond lights used on the Ongivinuk River in 2001 were eventually mounted above the water surface after considerable testing both above and below water. Each 20-watt light was capable of illuminating about 4 m of substrate panel. We found it important to orient lights in the same direction as the underwater cameras, and to place them well outside the camera’s field-of-view. If lights were within an underwater camera's field-of-view, the camera’s automatic iris would incorrectly adjust and cause video images of fish to be dark. Images collected at night with above-water cameras were consistently dark, and we were unable to effectively count fish from recorded video files. In 2002, we were able to operate the underwater camera at night with two pond lights, although the entire 4.4-m gap was not illuminated sufficiently. The LED rope light worked well on top of and underneath substrate panels since the white surface of the panels reflected the light, but did not adequately illuminate the gap. However, the bright strip of illumination across the panels created by the LED rope light appeared to hinder fish passage. Coho salmon often swam upstream to the substrate panels, paused briefly, and then passed rapidly over the LED light. High beam auto headlights mounted on towers illuminated both sections of substrate panels well and produced more diffuse illumination than the LED rope light. Some fish, however, swam quickly over panels lit by the headlights and often turned around and swim back downstream. When a single headlight was used to illuminate the reduced gap of 1.2 m, all coho salmon observed passing through the gap kept moving upstream. While the super day/night exposure function of above-water cameras coupled with artificial lighting enabled us to continuously monitor fish passage over the panels at night, recorded video was of marginal quality. Fish crossing the substrate panel were easily seen at night, but images were dark and fish species could not to be determined (Figure 19). Video files of fish crossing the panel quickly appeared as a moving dark blur rather than well-defined individual fish silhouettes. Observers could correctly identify coho salmon at night from underwater camera video images taken after a single auto headlight was used to illuminate the field of view (Figure 20).
32

Figure 19. Single coho salmon moving upstream across white substrate panels on the Ongivinuk River, September 2002. The image was collected during the night using an above-water video camera connected to a digital video recorder with the aid of artificial illumination from an auto headlight, and later captured as a JPEG file using a video capture card on a personal computer.
Figure 20. Underwater image of coho salmon moving upstream through a gap in white substrate panels on the Ongivinuk River, September 2002. Images were collected during the night using an underwater video camera connected to a digital video recorder with the aid of artificial illumination from an auto headlight, and later captured as JPEG files using a video capture card on a personal computer.
33
Visibility
There was little relation between light intensity and underwater observer visibility measured on the Ongivinuk or Togiak rivers (Table 7). We were not able to assess these relationships mathematically as the range of light intensity was limited when underwater observer visibility was measured. Light intensity values were clustered around 3 log lum/m2 for nine of the ten paired measurements. Underwater visibility could also not be effectively compared to turbidity measured on Ongivinuk and Togiak rivers in 2001 as turbidity values, expressed in formazin turbidity units (FTU) were consistently near zero. Average underwater distance a Secchi disc was visible to the two underwater cameras operated in the Ongivinuk River in 2001 was 3.92 m and 4.37 m (Appendix B). There was a slight positive correlation (r = 0.15) between average visibility measured by underwater cameras with that measured by an underwater observer, but it was not statistically significant at P=0.05. For paired observations, underwater observer visibilities in the Ongivinuk and Togiak rivers in 2001 were positively correlated (r = 0.50), although the relationship was not significant at P = 0.05. In general, observer visibility was greater (11 of 12 observations) in the Ongivinuk than in the Togiak River. On average, visibility measured by underwater observation was 1.6-m greater in the Ongivinuk than in the Togiak River (Table 7). Table 7. Horizontal visibility (m) of 300-mm Secchi disc in the Togiak and Ongivinuk rivers in 2001 by an underwater observer equipped with snorkeling gear and corresponding instantaneous cloud cover and light intensity.
a Data not available
Date Time Visibility (m) Cloud cover (%)
Light intensity (log lum/m2)
Ongivinuk Togiak 18-Aug 1800 5.18 3.30 100 3.03 27-Aug 1100 6.30 4.01 10 3.31 29-Aug 1130 6.15 6.35 100 3.05 31-Aug 1030 7.32 6.40 0 4.48 02-Sept 1130 7.47 6.27 75 3.28 04-Sep 1830 5.87 5.39 100 2.91 06-Sep 0930 8.84 5.18 85 2.94 08-Sep a 8.00 6.50 a a
10-Sep 1000 8.43 6.25 75 3.17 12-Sep 1200 7.37 6.91 95 3.37 14-Sep a 7.77 5.00 100 a
16-Sep 1230 8.03 5.74 0 3.31 Average 7.23 5.61 67 Std deviation 1.12 1.09
34
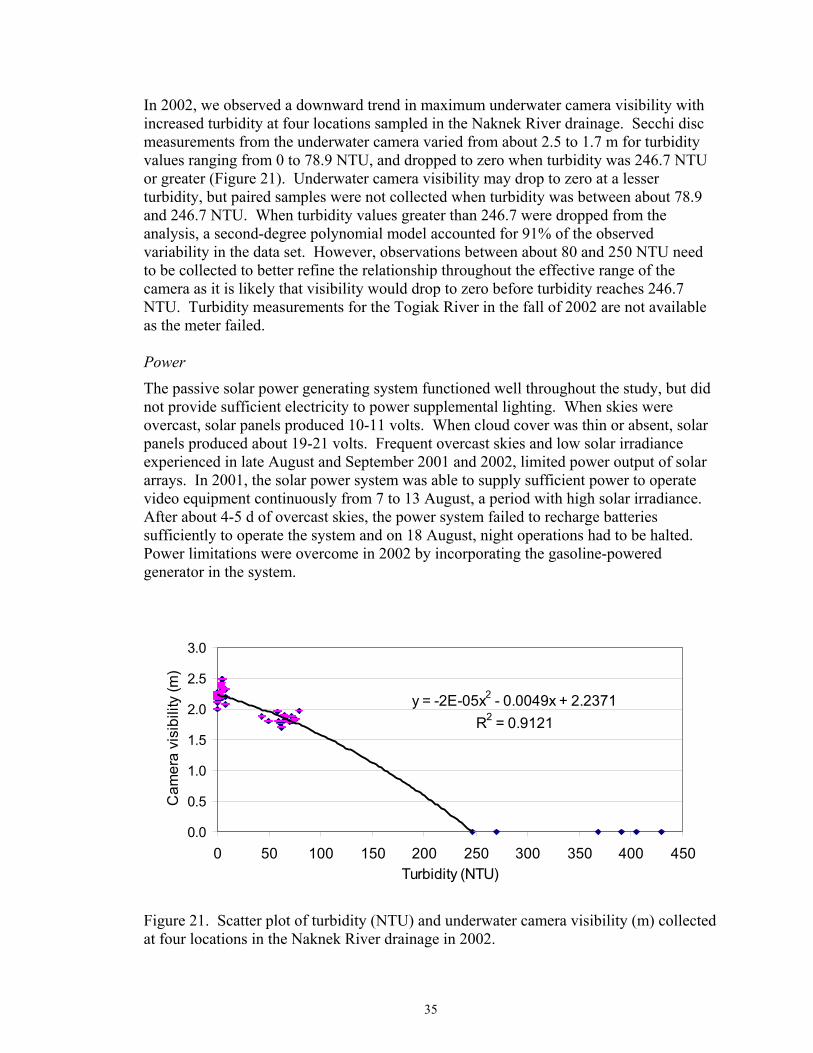
In 2002, we observed a downward trend in maximum underwater camera visibility with increased turbidity at four locations sampled in the Naknek River drainage. Secchi disc measurements from the underwater camera varied from about 2.5 to 1.7 m for turbidity values ranging from 0 to 78.9 NTU, and dropped to zero when turbidity was 246.7 NTU or greater (Figure 21). Underwater camera visibility may drop to zero at a lesser turbidity, but paired samples were not collected when turbidity was between about 78.9 and 246.7 NTU. When turbidity values greater than 246.7 were dropped from the analysis, a second-degree polynomial model accounted for 91% of the observed variability in the data set. However, observations between about 80 and 250 NTU need to be collected to better refine the relationship throughout the effective range of the camera as it is likely that visibility would drop to zero before turbidity reaches 246.7 NTU. Turbidity measurements for the Togiak River in the fall of 2002 are not available as the meter failed. Power
The passive solar power generating system functioned well throughout the study, but did not provide sufficient electricity to power supplemental lighting. When skies were overcast, solar panels produced 10-11 volts. When cloud cover was thin or absent, solar panels produced about 19-21 volts. Frequent overcast skies and low solar irradiance experienced in late August and September 2001 and 2002, limited power output of solar arrays. In 2001, the solar power system was able to supply sufficient power to operate video equipment continuously from 7 to 13 August, a period with high solar irradiance. After about 4-5 d of overcast skies, the power system failed to recharge batteries sufficiently to operate the system and on 18 August, night operations had to be halted. Power limitations were overcome in 2002 by incorporating the gasoline-powered generator in the system.
y = -2E-05x2 - 0.0049x + 2.2371R2 = 0.9121
0.0
0.5
1.0
1.5
2.0
2.5
3.0
0 50 100 150 200 250 300 350 400Turbidity (NTU)
Cam
era
visi
bilit
y (m
)
450
Figure 21. Scatter plot of turbidity (NTU) and underwater camera visibility (m) collected at four locations in the Naknek River drainage in 2002.
35
Discussion
Objective 1
The goal of the first object was to describe the performance of equipment needed to monitor salmon runs using video technology. Overall performance and recommendations for improving the various components tested in this study are listed individually below.
Contrasting Substrate Panels. High-density polyethylene panels provided a high contrast background that was easy to keep clean. To remedy the problem of cable ties breaking, which occurred frequently in 2002, heavy-duty 50- to 80-kg tensile strength, white, cable ties should be used to fasten panels together. In addition, spacing of duckbill anchors should be less than 4 m to ensure the cable is held securely on the stream bottom. The V-shaped panel formation used in 2002 redirected a portion of upstream migrant coho salmon through the gap in the panels into the direct view of the underwater camera. This was helpful in identifying species of fish from recorded video files. Relatively high fish passage densities observed for zone 2 might have been decreased by including a second gap in the panels on that side of the channel, similar to the gap forming zone 4. As mentioned previously, coho salmon were often observed migrating upstream along the downstream edge of the angled panel, sometimes following the edge of the panel for over 20 m before reaching the gap where they would then pass upstream of the monitoring site. Concentrating fish passage into narrow sections of channel using passive means such as white substrate panels is beneficial as it would reduce the number of cameras needed to effectively monitor salmon escapement in larger streams and rivers. Further research should be pursued to refine the effectiveness of this approach and to test its applicability for other species of fish besides coho salmon.
Video Recording. Digital video recording requires a balance between picture quality and available hard drive storage. For this study, image quality was essential, so video was compressed at the lowest ratio possible (10:1 on the Gyyr digital recorder). Frame rates also affect file size. We recorded fish passage at rates ranging from 2 to 15 frames/s, and found that 4 to 5 frames/s provided ample frames to count and identify fish from images captured by above-water and underwater cameras. The storage requirement for each camera used in our study was about 1.2 GB/h recording continuously at 5 frames/s at a compression ratio of 10:1, but would increase to about 4.7 GB/h at a rate of 30 frames/s. File storage requirements increase further as more cameras are used as video data are additive for each camera in the system. For example, the storage rate for a four-camera system simultaneously and continuously recording at 5 frames/s/camera with a compression ratio of 10:1 is about 4.7 GB/h, and would increase to an estimated 27.7 GB/h at a rate of 30 frames/s/camera. Above-water cameras used in 2002 were relatively easy to use, and once adjusted properly, provided quality images. We found that a slight rotational adjustment to the polarizing filter significantly decreased glare from the water surface, increasing the quality of resulting video images. Use of two towers allowed cameras to be positioned closer to substrate panels and reduced negative influences from haze, rain, and fog. Installing platforms on towers permitted personnel to adjust camera settings easily, while
36
cameras remained firmly mounted in their operating positions. The camera enclosures worked well, except for occasional fogging of the front window in early morning. An enclosure with a low-level heat source, or possibly adding a desiccant to the case, could alleviate this problem. The underwater camera used to monitor adult salmon passage in the Ongivinuk River in 2002 functioned well, but its use in the main stem Togiak River may be limited by high turbidity. Underwater visibility in the Togiak River, measured by an observer equipped with snorkeling gear in August and September 2001, would be adequate to count and identify salmon species using underwater cameras. However, visibility in the Togiak River during June and occasionally, early July when the Chinook, chum, sockeye, and pink salmon runs are in progress, may be limited by turbidity from spring run-off. Turbidity may also be high in the fall during the coho salmon run in both the Togiak and Ongivinuk rivers because of frequent rains and associated high flows as experienced in late September 2002. If partial barriers could be used to guide fish close to the cameras, it may still be possible to identify the species composition of upstream migrant salmon in the Togiak River during periods of high turbidity. It was considerably easier to identify salmon species from video collected with underwater cameras than with above-water cameras. As the field of view of above-water cameras increased, our ability to correctly identify salmon species passing over the panels decreased, especially beyond 10 m. However, it might be possible to get a total fish count with above-water cameras set to cover a large field of view, and then apportion the resulting count among salmon species using information derived from underwater cameras positioned at two or more panel gaps, depending on the ability of the panels to guide particular species. Dust, cold, humidity, and temperature conditions experienced during our study provided harsh operating conditions for camera and recorder electronics. Although the Gyyr digital video recorder functioned well in the field, it failed about one month after its return to the office because of corrosion on the motherboard. To overcome this type of problem, future video studies should explore using recent advances in wireless microwave technology to transmit the digital video stream to processing and recording equipment stationed in the controlled environment of an office in either Togiak Village or Dillingham. Although the relatively inexpensive wireless video transmitter we tested in 2001 worked well for close range transmission, it would not be effective over long distances. Advanced microwave transmitters have a line-of-sight range of about 50 to 65 km. Using microwave transmitters would also reduce the amount of power generation and video equipment needed at monitoring stations, and could be cost effective if video stations were installed and monitored on multiple tributaries in the Togiak River drainage. To examine this concept, we developed a study plan for transmitting a live video signal 32 km from a fish weir on Big Creek, Becharof National Wildlife Refuge, to the U. S. Fish and Wildlife Service Headquarters building located in King Salmon (Hetrick 2003). Experience and information gained from this proposed study scheduled for the summer and fall 2004, will be an important step towards designing a large-scale video monitoring project for the Togiak River drainage.
37
We selected an external DVD-RAM drive to archive video data because of the equipment’s high storage capacity and availability. We considered using a DVD-write/rewrite (R/RW) drive for archiving video because of its reported compatibility with other DVD formats and its ability to be read by most types of DVD drives. We decided against using a DVD-R/RW drive, however, because, at the time we began our study, this type of drive still had reported compatibility issues (-R/RW versus +R/RW), a high cost per unit of storage, and slow write speeds. Most compatibility issues have since been resolved with the development of multi format ±R/RW drives, and the price of these drives and media continues to drop. As write speeds increase, DVD-R/RW drives will become a viable alternative to DVD-RAM media for long-term archival of video footage.
Motion Detection. In an ideal motion detection system, only fish movement would trigger the video system to record images. The result would be collection of a limited number of relatively short files containing only images of fish passage, extracted electronically from a long period of surveillance. A functional motion detection system also greatly reduces video storage requirements, as well as staff time required to review recorded video to generate salmon counts. Our study demonstrated that, when configured properly, it is feasible to monitor salmon escapement during daylight hours using video technology. However, the key to making this a practical, cost-effective, and accurate approach for monitoring salmon runs depends upon availability of effective motion detection processing. The overall area monitored for motion detection depended on camera field-of-view. As field of view increased, the area of the screen occupied by substrate panels, which was masked for motion detection processing, decreased. Most of the panel width in zone 1 in the background of the picture of the far camera set to monitor the entire 44.2-m angled panel was covered by a single horizontal masking cell. The small masking area may have allowed some coho salmon to pass through zone 1 without triggering the motion detection system. Installation of additional above-water cameras would allow the field of view for each camera to be decreased, allowing the number of horizontal masking cells to be increased, resulting in a larger area monitored for motion detection. Using wider substrate panels would also allow the masked area to be further increased to improve effectiveness of motion detection processing. It is unknown, however, if this would create a behavioral barrier to fish passage. The motion detection algorithm tested in this study was not as effective for the near camera as for the mid-river camera, even when field of view of the near camera was set at 12.2 m (Table 3). We attribute this difference to the angle of the camera in relation to stream flow and passing fish. The view of fish observed in near camera images was more frontal than that of fish observed in mid-river camera images. This resulted in the surface area of fish in the near camera video images, as depicted by individual pixels on the monitor, to be less than that in mid-river camera video images. Since the motion detection algorithm is based on changes in individual pixels between frames, increasing the number of pixels represented by each fish increases the probability that the motion detection algorithm will trigger operation of the video recorder.
38
The motion detection algorithm we used in 2002 produced a greater percentage of false triggers and missed a greater percentage of coho salmon for the underwater camera than for the above-water mid-river camera. Small objects passing just in front of the underwater camera dominated its field of view and triggered video recording. False triggers increased during fall months when the motion detection algorithm was tested, because leaves were abundant in the drift. False triggers associated with underwater cameras may be less common when monitoring escapement of Chinook, chum, pink, and sockeye salmon since run timing of these species occurs during summer months when there should be fewer leaves and less debris in the water. Image quality provided by the underwater camera was relatively stable since the water served to buffer effects of wind, rain, fog, and changing light conditions. However, it was difficult to properly configure motion detection settings for the underwater camera because of the low number of coho salmon that passed through the gap as compared to the number that passed through the much larger area monitored by above-water cameras. It may be possible to better configure motion detection settings using a coho salmon carcass or other suitable target, tethered to monofilament line that could be pulled upstream through the motion detection zone of the underwater camera. In general, motion detection processing was least effective during crepuscular periods (Tables 3 and 4). Monitoring fish passage during these periods was affected by rapid changes in light, moving shadows, and fog forming on camera housing windows. Use of artificial light and low-level camera heaters during these periods may decrease the number of false triggers. We are also searching for motion detection software that would respond to changing light conditions. Alternatively, the recorder could be programmed to record continuously during crepuscular hours. The motion detection algorithm we used in 2002 was, at times, effective at limiting the amount of video footage recorded. The level of its effectiveness primarily depended on camera type (above- or underwater), field-of-view width, and placement. During testing conducted during 22-24 September 2002, 17.5 h of total monitoring time was parsed into about 5 h of recorded video by the motion detection program. This 70% reduction in review time could be further decreased if the field of view of all above-water cameras was limited to less than 10 m. These findings were influenced by factors such as time of day, weather, and light conditions experienced during testing. In general, weather was overcast with light showers, but at times high winds and heavy rains consistently triggered recording by the motion detection algorithm. Counts of coho salmon determined from review of motion detection video files were similar to counts taken from the live video display by observers, particularly for video collected by the above-water camera set at a field of view less than 10 m. Although counts were similar, it is important to note that both the video file review and real-time observer counts were estimates. Several fish missed by the motion detection processing were counted by the observer monitoring the live video display. However, for time periods when both video files and observer counts were available, video counts were
39
more accurate than observer counts. This was because video files could be replayed repeatedly in slow motion and paused on individual frames, making it possible to definitively determine a fish’s final direction of travel, differentiate individuals within groups, and identify species. Differences between observer counts and motion-triggered video counts occurred more frequently and were greater when passage rates and swimming speeds were high than when passage rates and swimming speeds were low. Detecting and subsequently recording all salmon passing a video monitoring site is critical in assessing the effectiveness of motion detection processing, as is a recorder’s performance in minimizing false triggers. If a digital recorder with four cameras was set to record continuously, it would generate 24 h of four-channel, multiplexed video per day. If each channel was reviewed separately in actual speed, it would take 96 h to review video for each day monitored. If motion detection processing is used but the sensitivity is set too high, fish may be recorded and subsequently missed during the review process because of the tedious nature of reviewing extensive periods of blank or “fishless” video. This problem has been observed repeatedly by researchers in California and Oregon, who have contacted our office for design information on a digital video recording system that was developed for monitoring salmon runs at fish weirs (Hetrick et al., in preparation). If sensitivity settings of the motion detection processing are set too low, fish can pass undetected and won’t be included in escapement estimates. It is difficult, however, to find a static motion detection sensitivity setting that functions properly in a constantly changing environment. The most difficult challenge we addressed with the motion detection algorithm used in 2002 was adjusting the sensitivity level to offset external variables caused by changing weather and light conditions. Sensitivity settings for the above-water cameras had to be adjusted continually, requiring a crew to be on-site throughout the study. An associated problem with adjusting the sensitivity settings is that fish could pass undetected while adjustments were being made. In particular, motion detection processing did not function well when wind gusts caused rapid changes in water surface turbulence, during intermittent heavy rain showers, and when high winds caused the cameras in the towers to sway. In addition to stabilizing camera towers, we are also researching image stabilization software to compensate for camera shake during high winds. Improvements in the performance of the motion detection algorithm we used or a substitute method of electronically discriminating fish passage is critical; however, to ensure that all adult salmon are detected and false triggers are minimized alternative software and hardware should be tested in future studies.
Lighting. We found it difficult to provide adequate lighting needed to effectively identify fish species at night. Specific problems included power consumption of lights and effects of lights on auto-iris lenses and fish behavior. Other light configurations, as well as other camera and lens combinations, should be investigated for night use. We researched infrared black and white cameras since they are reportedly able to collect quality images under low-light conditions. However, we found that infrared light rapidly attenuates in water, so images of fish would probably be of low resolution and dark (Hiebert et al. 2000). We also considered using night vision lenses for our cameras, but availability and
40
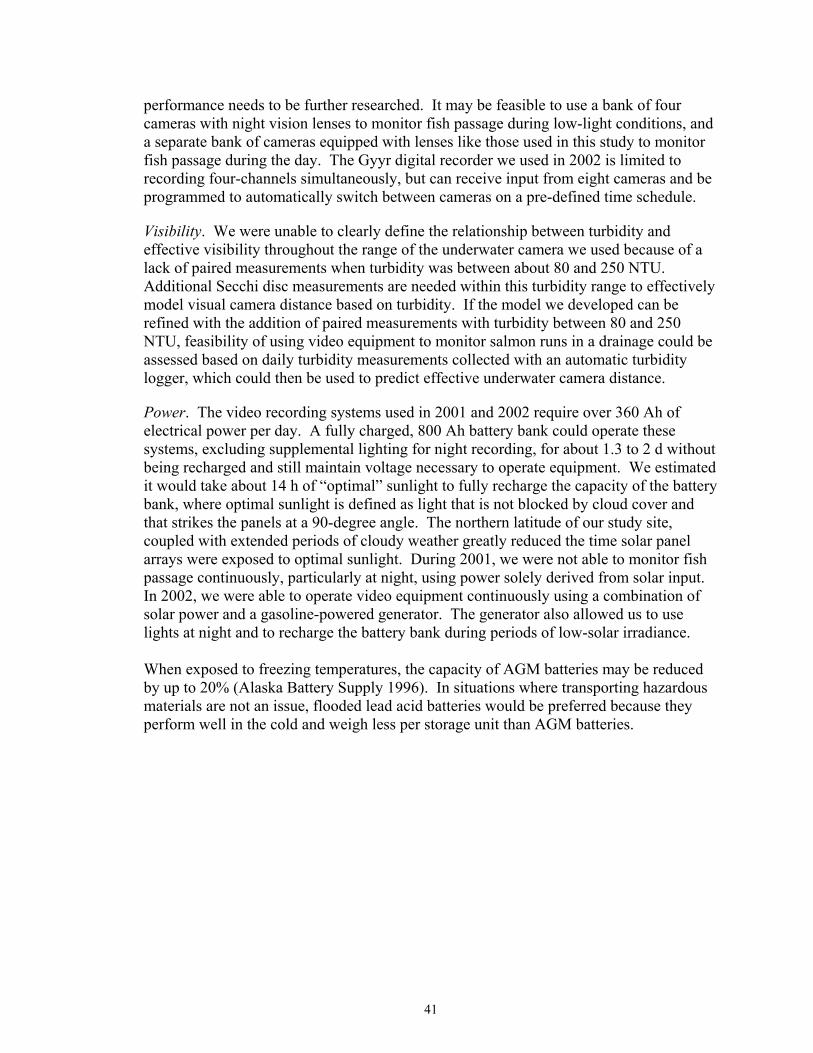
performance needs to be further researched. It may be feasible to use a bank of four cameras with night vision lenses to monitor fish passage during low-light conditions, and a separate bank of cameras equipped with lenses like those used in this study to monitor fish passage during the day. The Gyyr digital recorder we used in 2002 is limited to recording four-channels simultaneously, but can receive input from eight cameras and be programmed to automatically switch between cameras on a pre-defined time schedule.
Visibility. We were unable to clearly define the relationship between turbidity and effective visibility throughout the range of the underwater camera we used because of a lack of paired measurements when turbidity was between about 80 and 250 NTU. Additional Secchi disc measurements are needed within this turbidity range to effectively model visual camera distance based on turbidity. If the model we developed can be refined with the addition of paired measurements with turbidity between 80 and 250 NTU, feasibility of using video equipment to monitor salmon runs in a drainage could be assessed based on daily turbidity measurements collected with an automatic turbidity logger, which could then be used to predict effective underwater camera distance.
Power. The video recording systems used in 2001 and 2002 require over 360 Ah of electrical power per day. A fully charged, 800 Ah battery bank could operate these systems, excluding supplemental lighting for night recording, for about 1.3 to 2 d without being recharged and still maintain voltage necessary to operate equipment. We estimated it would take about 14 h of “optimal” sunlight to fully recharge the capacity of the battery bank, where optimal sunlight is defined as light that is not blocked by cloud cover and that strikes the panels at a 90-degree angle. The northern latitude of our study site, coupled with extended periods of cloudy weather greatly reduced the time solar panel arrays were exposed to optimal sunlight. During 2001, we were not able to monitor fish passage continuously, particularly at night, using power solely derived from solar input. In 2002, we were able to operate video equipment continuously using a combination of solar power and a gasoline-powered generator. The generator also allowed us to use lights at night and to recharge the battery bank during periods of low-solar irradiance. When exposed to freezing temperatures, the capacity of AGM batteries may be reduced by up to 20% (Alaska Battery Supply 1996). In situations where transporting hazardous materials are not an issue, flooded lead acid batteries would be preferred because they perform well in the cold and weigh less per storage unit than AGM batteries.
41

Objective 2
The goal of objective 2 was to determine the feasibility of using video cameras mounted above the water to estimate salmon escapement in clear-water tributaries of the Togiak River. Based on tests conducted during this study, we conclude that above-water cameras can be used in conjunction with digital video recording equipment to estimate salmon spawning escapement on clear-water tributaries of the Togiak River. Deploying video monitoring systems on multiple tributaries to the Togiak River over a period of several years could provide managers with indices of escapement for chum, coho, and pink salmon and Dolly Varden in the Togiak River drainage. These indices, however, would be of limited value for in-season management of sockeye salmon as the majority of the sockeye salmon pass into Togiak Lake rather than enter the tributaries of the mainstem Togiak River. Tributary counts may also be a poor index of abundance for Chinook salmon since over 60% of the Togiak population is thought to spawn in the mainstem Togiak River, based on peak aerial counts from 1980 to 1999 (Sands et al. 2001). Four issues need to be addressed in designing a video monitoring program to estimate salmon escapement in clear-water tributaries of the Togiak River using above-water cameras. First, the field of view for each camera should be limited to a maximum of 10 m, so one camera would be needed to cover every 10 m of the counting transect. To reduce the number of cameras used, fish movement needs to be restricted. This could be done through further testing and refinement of white substrate panel placement or use of a partial weir. At the site we studied on the Ongivinuk River, a 20-m long weir could be installed on the shore opposite the field camp (Figure 4). This would restrict fish movement to the remaining 30 m of open channel, which could be monitored using three or four above-water cameras. We suggest using a floating weir to reduce maintenance, although personnel would still be needed to periodically clean the structure. A partial weir should not impede fish migration or inhibit boat traffic. Second, images recorded by the above-water cameras we used in this study were not adequate for identifying salmon species at night. To correctly identify salmon species crossing the panels at night will require the use of additional supplemental lighting and cameras capable of operating in low-light. An alternate approach would be to use motion-triggered video files taken during the night to count the total number of salmon crossing the panels as was done during tests conducted in 2002, and apportion these counts by species using video information collected during daylight. However, there may be differences in diel passage rates that must be described first. Third, while a motion detection algorithm can greatly reduce video storage requirements and processing time, the motion detection algorithm we used often recorded video triggered by external variables such as rain, fog, glare, and camera shake caused by high winds, when no fishes were present. Improvements to the motion detection algorithm, including image stabilization, along with better supplemental lighting and low-level camera heaters could help reduce false triggering of video recording. With these improvements, sensitivity settings of motion detection processing could be increased without a corresponding increase in false triggers, which would help minimize fish
42
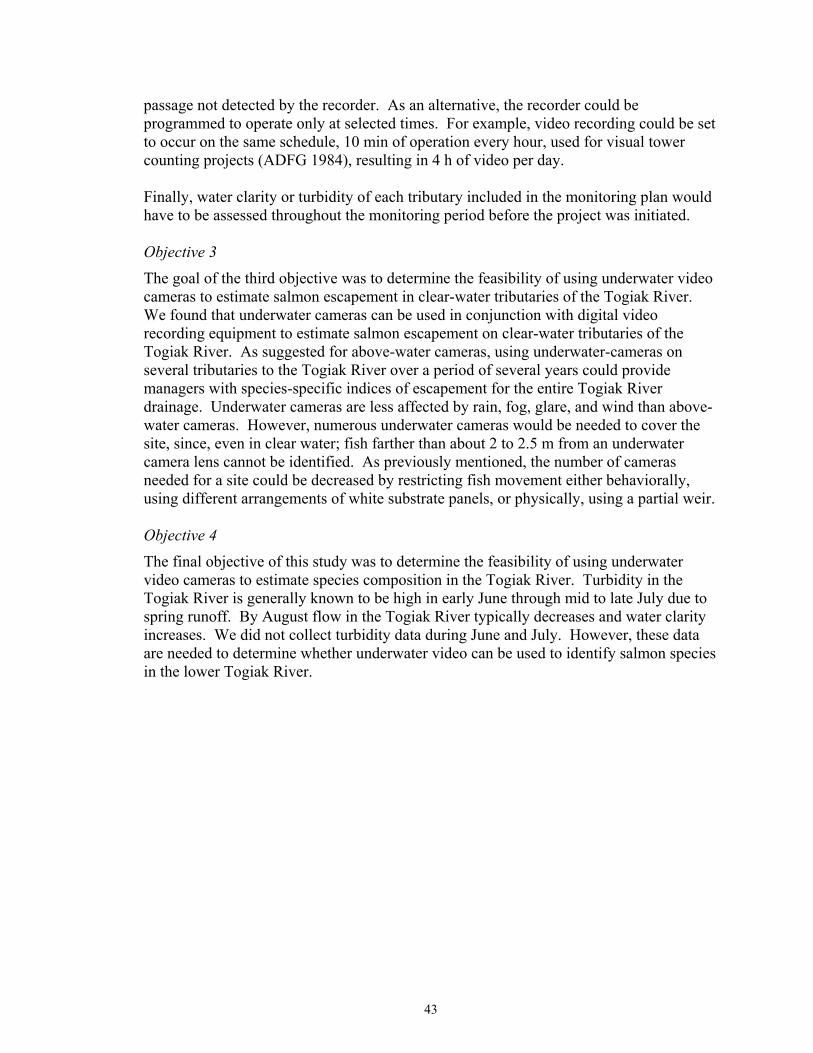
passage not detected by the recorder. As an alternative, the recorder could be programmed to operate only at selected times. For example, video recording could be set to occur on the same schedule, 10 min of operation every hour, used for visual tower counting projects (ADFG 1984), resulting in 4 h of video per day. Finally, water clarity or turbidity of each tributary included in the monitoring plan would have to be assessed throughout the monitoring period before the project was initiated. Objective 3
The goal of the third objective was to determine the feasibility of using underwater video cameras to estimate salmon escapement in clear-water tributaries of the Togiak River. We found that underwater cameras can be used in conjunction with digital video recording equipment to estimate salmon escapement on clear-water tributaries of the Togiak River. As suggested for above-water cameras, using underwater-cameras on several tributaries to the Togiak River over a period of several years could provide managers with species-specific indices of escapement for the entire Togiak River drainage. Underwater cameras are less affected by rain, fog, glare, and wind than above-water cameras. However, numerous underwater cameras would be needed to cover the site, since, even in clear water; fish farther than about 2 to 2.5 m from an underwater camera lens cannot be identified. As previously mentioned, the number of cameras needed for a site could be decreased by restricting fish movement either behaviorally, using different arrangements of white substrate panels, or physically, using a partial weir. Objective 4
The final objective of this study was to determine the feasibility of using underwater video cameras to estimate species composition in the Togiak River. Turbidity in the Togiak River is generally known to be high in early June through mid to late July due to spring runoff. By August flow in the Togiak River typically decreases and water clarity increases. We did not collect turbidity data during June and July. However, these data are needed to determine whether underwater video can be used to identify salmon species in the lower Togiak River.
43
Acknowledgements The U. S. Fish and Wildlife Service, Office of Subsistence Management, provided funding for this project through the Fisheries Resource Monitoring Program under agreement number FIS 00-010. We appreciate support for this project from the Togiak Village Council, the residents of Togiak Village, and the Bristol Bay Native Corporation. We thank Mike Woodley, Mark Lisac, and other staff at the Togiak National Wildlife Refuge for providing logistical support and aerial photographs of the project site. We acknowledge Kristen Wolen and Erin Calder for their efforts in data collection, and Dan Spencer for reviewing hours of video files. We also thank Stephen Fried for assisting in statistical analyses and for his review of the initial draft. Jeff Adams and Dave Daum of the Fairbanks Fish and Wildlife Field Office, U. S. Fish and Wildlife Service provided valuable comments on the final draft. We also acknowledge Dave Daum and Ted Otis (Alaska Department of Fish and Game) for their guidance and leadership in advancing the application of video technology in fisheries science in Alaska.
Literature Cited Alaska Battery Supply. 1996. Remote power systems: part 2 system selection: a
comprehensive guide to selecting & sizing remote power systems for your home, boat or recreational vehicle.
ADFG (Alaska Department of Fish and Game). 1984. Division of Commercial
Fisheries. Escapement enumeration tower operational plan, 1984. Dillingham, Alaska.
ADFG (Alaska Department of Fish and Game). 1990. Annual management report, 1989,
Bristol Bay area. Alaska Department of Fish and Game, Anchorage, Alaska. ADFG (Alaska Department of Fish and Game). 2003. Annual management report, 2002,
Bristol Bay area. Alaska Department of Fish and Game, Anchorage, Alaska. Brannian, L.K. 1982. The estimation of daily escapement and total abundance from
catch-per-unit-effort of the sockeye salmon fishery in Togiak Bay, Alaska. Master's Thesis, University of Washington, Seattle, Washington.
Brookover, T. 1991. Togiak Weir Feasibility. Memorandum. Alaska Department of
Fish and Game, Division of Commercial Fisheries, Dillingham, Alaska Hetrick, N. J. 2003. Monitoring wild runs of Pacific salmon in remote areas of Alaska
using digital video and wireless microwave technology. U. S. Fish and Wildlife Service, King Salmon Fish and Wildlife Field Office, Alaska Fisheries Cost-Share Proposal, King Salmon, Alaska.
44
Hetrick, N. J., D. Spencer, M. Santos, and J. P. Larson. In preparation. Design specifications for a v-shaped resistance board floating weir incorporating a digital video Monitoring Station. U.S. Fish and Wildlife Service, Alaska Fisheries Technical Report Number XX, King Salmon, Alaska.
Hiebert S., L. A. Helfrich, D. L. Weigmann, and C. Liston. 2000. Anadromous salmonid
passage and video quality under infrared and visible light at Prosser Dam, Yakima River, Washington. North American journal of Fish Management 20:827-832.
Irving, D., J. Finn, and J. Larson. 1995. Salmon escapement estimates into the Togiak
River using Sonar, Togiak National Wildlife Refuge, Alaska 1987, 1988, and 1990. U.S. Fish and Wildlife Service, Alaska Fisheries Technical Report Number 31, King Salmon, Alaska.
Larson, J. P. 2001. Togiak River salmon weir phase I – weir feasibility study Togiak
National Wildlife Refuge. U. S. Fish and Wildlife Service, Office of Subsistence Management, Fisheries Monitoring Program, Annual Report No. FIS00-10, Anchorage, Alaska.
Lisac, M.J., and R. MacDonald. 1996. Age, weight and length statistics of Togiak River
drainage resident fish species, Togiak National Wildlife Refuge, Alaska, 1993-1995. U.S. Fish and Wildlife Service, Fishery Data Series Number 96-3, Dillingham, Alaska
Microsoft Corporation. 2001. Microsoft Excel 2002 version 10.4302.4219. Redmond,
Washington. Otis, T. and M. Dickson. 2001 draft. Improved salmon escapement enumeration using
remote video and time-lapse recording technology. Alaska Department of Fish and Game, Division of Commercial Fisheries.
Sands, T., J. Browning, K. A. Weiland, and S. Morstad. 2001. Spawning ground surveys
in the Bristol Bay area, Alaska, 2000. Regional Information Report No. 2A01-08. Alaska Department of Fish and Game, Anchorage, Alaska.
USFWS (U.S. Fish and Wildlife Service). 1986. Togiak National Wildlife Refuge final
comprehensive conservation plan, wilderness review, and environmental impact statement. U.S. Department of Interior, Fish and Wildlife Service, Anchorage, Alaska.
Wolfe, R., J. Gross, S. Langdon, J. Wright, G. Sherrod, L. Ellana, and V. Sumida. 1984.
Subsistence-Based Economics in Coastal Communities of Southwest Alaska. Alaska Department of Fish and Game, Division of Subsistence, Technical Paper No. 89, Juneau, Alaska.
45
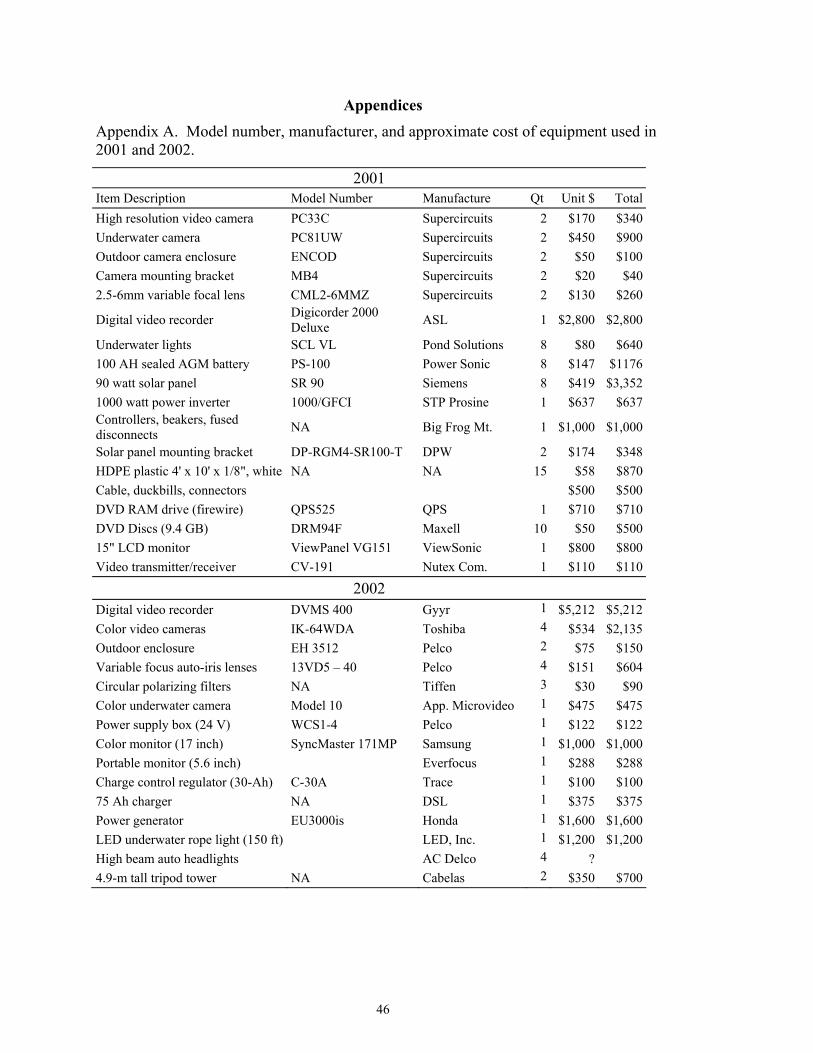
Appendices Appendix A. Model number, manufacturer, and approximate cost of equipment used in 2001 and 2002.
2001 Item Description Model Number Manufacture Qt Unit $ Total High resolution video camera PC33C Supercircuits 2 $170 $340 Underwater camera PC81UW Supercircuits 2 $450 $900 Outdoor camera enclosure ENCOD Supercircuits 2 $50 $100 Camera mounting bracket MB4 Supercircuits 2 $20 $40 2.5-6mm variable focal lens CML2-6MMZ Supercircuits 2 $130 $260
Digital video recorder Digicorder 2000 Deluxe ASL 1 $2,800 $2,800
Underwater lights SCL VL Pond Solutions 8 $80 $640 100 AH sealed AGM battery PS-100 Power Sonic 8 $147 $1176 90 watt solar panel SR 90 Siemens 8 $419 $3,352 1000 watt power inverter 1000/GFCI STP Prosine 1 $637 $637 Controllers, beakers, fused disconnects NA Big Frog Mt. 1 $1,000 $1,000
Solar panel mounting bracket DP-RGM4-SR100-T DPW 2 $174 $348 HDPE plastic 4' x 10' x 1/8", white NA NA 15 $58 $870 Cable, duckbills, connectors $500 $500 DVD RAM drive (firewire) QPS525 QPS 1 $710 $710 DVD Discs (9.4 GB) DRM94F Maxell 10 $50 $500 15" LCD monitor ViewPanel VG151 ViewSonic 1 $800 $800 Video transmitter/receiver CV-191 Nutex Com. 1 $110 $110
2002 Digital video recorder DVMS 400 Gyyr 1 $5,212 $5,212 Color video cameras IK-64WDA Toshiba 4 $534 $2,135 Outdoor enclosure EH 3512 Pelco 2 $75 $150 Variable focus auto-iris lenses 13VD5 – 40 Pelco 4 $151 $604 Circular polarizing filters NA Tiffen 3 $30 $90 Color underwater camera Model 10 App. Microvideo 1 $475 $475 Power supply box (24 V) WCS1-4 Pelco 1 $122 $122 Color monitor (17 inch) SyncMaster 171MP Samsung 1 $1,000 $1,000 Portable monitor (5.6 inch) Everfocus 1 $288 $288 Charge control regulator (30-Ah) C-30A Trace 1 $100 $100 75 Ah charger NA DSL 1 $375 $375 Power generator EU3000is Honda 1 $1,600 $1,600 LED underwater rope light (150 ft) LED, Inc. 1 $1,200 $1,200 High beam auto headlights AC Delco 4 ? 4.9-m tall tripod tower NA Cabelas 2 $350 $700
46
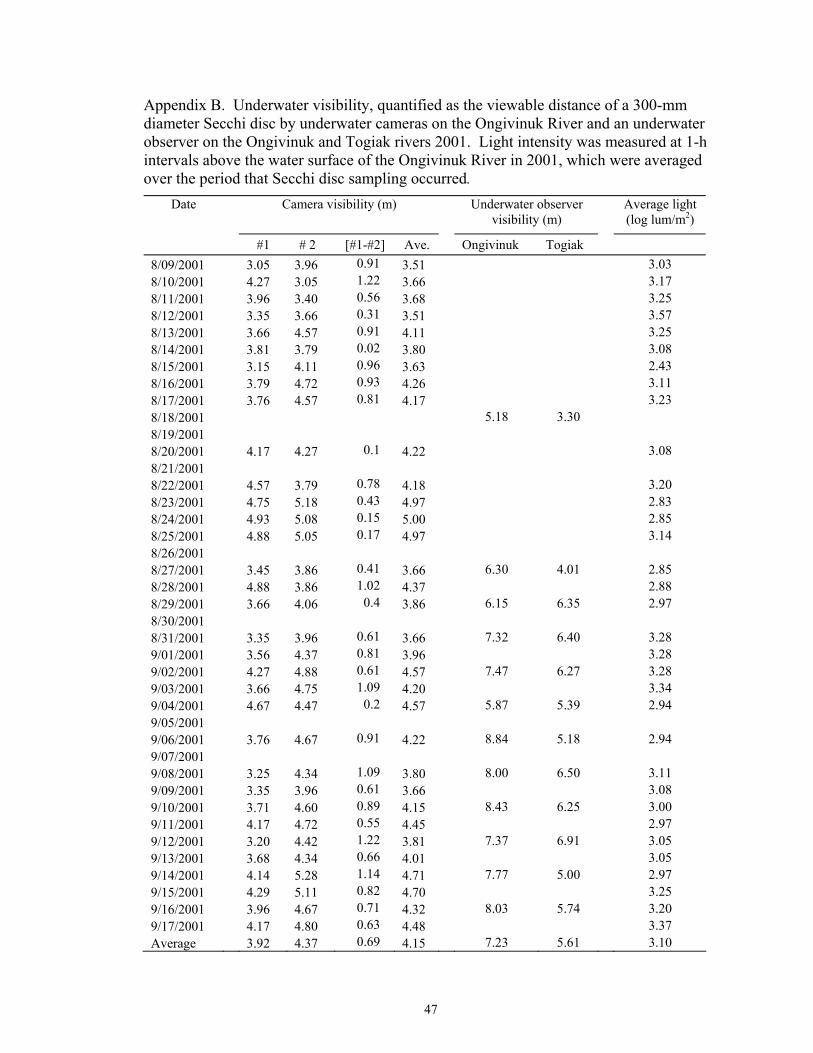
Appendix B. Underwater visibility, quantified as the viewable distance of a 300-mm diameter Secchi disc by underwater cameras on the Ongivinuk River and an underwater observer on the Ongivinuk and Togiak rivers 2001. Light intensity was measured at 1-h intervals above the water surface of the Ongivinuk River in 2001, which were averaged over the period that Secchi disc sampling occurred.
Date Camera visibility (m) Underwater observer visibility (m)
Average light (log lum/m2)
#1 # 2 [#1-#2] Ave. Ongivinuk Togiak 8/09/2001 3.05 3.96 0.91 3.51 3.03 8/10/2001 4.27 3.05 1.22 3.66 3.17 8/11/2001 3.96 3.40 0.56 3.68 3.25 8/12/2001 3.35 3.66 0.31 3.51 3.57 8/13/2001 3.66 4.57 0.91 4.11 3.25 8/14/2001 3.81 3.79 0.02 3.80 3.08 8/15/2001 3.15 4.11 0.96 3.63 2.43 8/16/2001 3.79 4.72 0.93 4.26 3.11 8/17/2001 3.76 4.57 0.81 4.17 3.23 8/18/2001 5.18 3.30 8/19/2001 8/20/2001 4.17 4.27 0.1 4.22 3.08 8/21/2001 8/22/2001 4.57 3.79 0.78 4.18 3.20 8/23/2001 4.75 5.18 0.43 4.97 2.83 8/24/2001 4.93 5.08 0.15 5.00 2.85 8/25/2001 4.88 5.05 0.17 4.97 3.14 8/26/2001 8/27/2001 3.45 3.86 0.41 3.66 6.30 4.01 2.85 8/28/2001 4.88 3.86 1.02 4.37 2.88 8/29/2001 3.66 4.06 0.4 3.86 6.15 6.35 2.97 8/30/2001 8/31/2001 3.35 3.96 0.61 3.66 7.32 6.40 3.28 9/01/2001 3.56 4.37 0.81 3.96 3.28 9/02/2001 4.27 4.88 0.61 4.57 7.47 6.27 3.28 9/03/2001 3.66 4.75 1.09 4.20 3.34 9/04/2001 4.67 4.47 0.2 4.57 5.87 5.39 2.94 9/05/2001 9/06/2001 3.76 4.67 0.91 4.22 8.84 5.18 2.94 9/07/2001 9/08/2001 3.25 4.34 1.09 3.80 8.00 6.50 3.11 9/09/2001 3.35 3.96 0.61 3.66 3.08 9/10/2001 3.71 4.60 0.89 4.15 8.43 6.25 3.00 9/11/2001 4.17 4.72 0.55 4.45 2.97 9/12/2001 3.20 4.42 1.22 3.81 7.37 6.91 3.05 9/13/2001 3.68 4.34 0.66 4.01 3.05 9/14/2001 4.14 5.28 1.14 4.71 7.77 5.00 2.97 9/15/2001 4.29 5.11 0.82 4.70 3.25 9/16/2001 3.96 4.67 0.71 4.32 8.03 5.74 3.20 9/17/2001 4.17 4.80 0.63 4.48 3.37 Average 3.92 4.37 0.69 4.15 7.23 5.61 3.10
47


![Video-Based Object Recognition Using Novel Set-of-Sets ... · Video-based Object Recognition using Novel Set-of-Sets Representations ... provides an estimate of uncertainty. [15]](https://img.pdfslide.net/doc/110x75/5f0a22817e708231d42a2e5c/video-based-object-recognition-using-novel-set-of-sets-video-based-object-recognition.jpg)