Embed Size (px)
Citation preview
1
United States Department of the Interior GEOLOGICAL SURVEY
California Cooperative Fishery Research Unit Humboldt State University
Arcata, California 95521-8299 707-826-3268, FAX 707-826-3269
Validation Monitoring: Testing Protocols in Prairie Creek
July 18, 2008
Final Project Report
Pacific States Marine Fisheries Commission Agreement No. P0410515
Prepared for:
California Department of Fish and Game Fisheries Restoration Grants Program
by
Walter G. Duffy California Cooperative Fish Research Unit
Humboldt State University Arcata, CA 95521
2
INTRODUCTION Work accomplished under a Pacific States Marine Fisheries Commission grant for the Validation Monitoring: Testing Protocols in Prairie Creek project, Agreement No. P0410515 was supported through funding provided by the California Department of Fish and Game (CDFG), Fisheries Restoration Grants Program (FRGP), Salmon and Steelhead Trout Restoration Account. Project goal: Test validation monitoring protocols, following methods developed under California Department of Fish and Game Grant # P0210565 (Duffy et al, 2005), to assess their sensitivity to natural variation and identify their efficiency. Sampling was conducted in Prairie Creek, tributary to Redwood Creek, Humboldt County. Project objectives included: 1. Juvenile Population Size – Measure the population size of juvenile coho salmon, cutthroat
trout and steelhead in upper Prairie Creek during late summer (September) 2005, 2006, and 2007.
2. Juvenile Condition – Determine the condition of coho salmon and steelhead from a sample
of fish capture during juvenile population monitoring each year. After capture, fish were anesthetized and measurements of length to the nearest 1.0 mm and weight to the nearest 0.01 g taken.
3. Smolt Production – Estimate the number of salmon and steelhead migrating from Prairie
Creek toward the ocean from traps operated from March through May 2005, 2006, and 2007. Two fence type smolt traps, separated by 100-200 meters, were installed near the mouth of Prairie Creek. Constant fraction of fish caught each day in the upstream trap was marked to test the efficiency of the downstream trap.
4. Adult Escapement – Estimate the number of adult salmon and steelhead returning to Prairie
Creek to spawn based on surveys conducted from December through March/April 2005/06, 2006/07 and 2007/08. Traditional spawner survey methods consisting of live fish and carcass counts and carcass mark/recapture studies were used to estimate population size.
This final project report presents a data summary for the entire study period plus results and discussion from each calendar quarter of the study period. A supplementary project report will also be submitted which combines data from other monitoring programs taking place in the Redwood Creek basin. This will allow a unified analysis of status and trends of the basin’s anadromous salmonid populations over the last ten years.
3
DATA SUMMARY
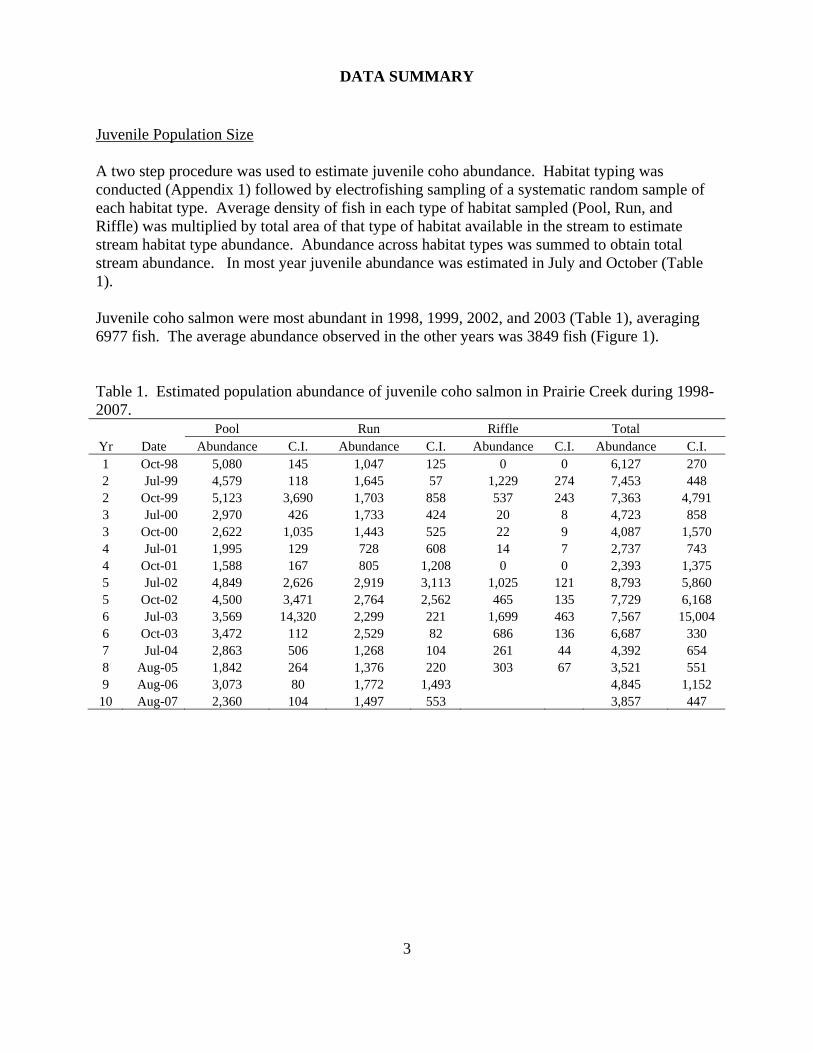
Juvenile Population Size A two step procedure was used to estimate juvenile coho abundance. Habitat typing was conducted (Appendix 1) followed by electrofishing sampling of a systematic random sample of each habitat type. Average density of fish in each type of habitat sampled (Pool, Run, and Riffle) was multiplied by total area of that type of habitat available in the stream to estimate stream habitat type abundance. Abundance across habitat types was summed to obtain total stream abundance. In most year juvenile abundance was estimated in July and October (Table 1). Juvenile coho salmon were most abundant in 1998, 1999, 2002, and 2003 (Table 1), averaging 6977 fish. The average abundance observed in the other years was 3849 fish (Figure 1). Table 1. Estimated population abundance of juvenile coho salmon in Prairie Creek during 1998-2007.
Pool Run Riffle Total Yr Date Abundance C.I. Abundance C.I. Abundance C.I. Abundance C.I. 1 Oct-98 5,080 145 1,047 125 0 0 6,127 270 2 Jul-99 4,579 118 1,645 57 1,229 274 7,453 448 2 Oct-99 5,123 3,690 1,703 858 537 243 7,363 4,791 3 Jul-00 2,970 426 1,733 424 20 8 4,723 858 3 Oct-00 2,622 1,035 1,443 525 22 9 4,087 1,570 4 Jul-01 1,995 129 728 608 14 7 2,737 743 4 Oct-01 1,588 167 805 1,208 0 0 2,393 1,375 5 Jul-02 4,849 2,626 2,919 3,113 1,025 121 8,793 5,860 5 Oct-02 4,500 3,471 2,764 2,562 465 135 7,729 6,168 6 Jul-03 3,569 14,320 2,299 221 1,699 463 7,567 15,004 6 Oct-03 3,472 112 2,529 82 686 136 6,687 330 7 Jul-04 2,863 506 1,268 104 261 44 4,392 654 8 Aug-05 1,842 264 1,376 220 303 67 3,521 551 9 Aug-06 3,073 80 1,772 1,493 4,845 1,152
10 Aug-07 2,360 104 1,497 553 3,857 447

4
Figure 1. Population abundance of juvenile coho salmon in Prairie Creek, Humboldt County, California during summer of 1998-2007.
Year
1998 2000 2002 2004 2006 2008
Popu
latio
n A
bund
ance
0
2000
4000
6000
8000
10000
12000
14000
16000
5
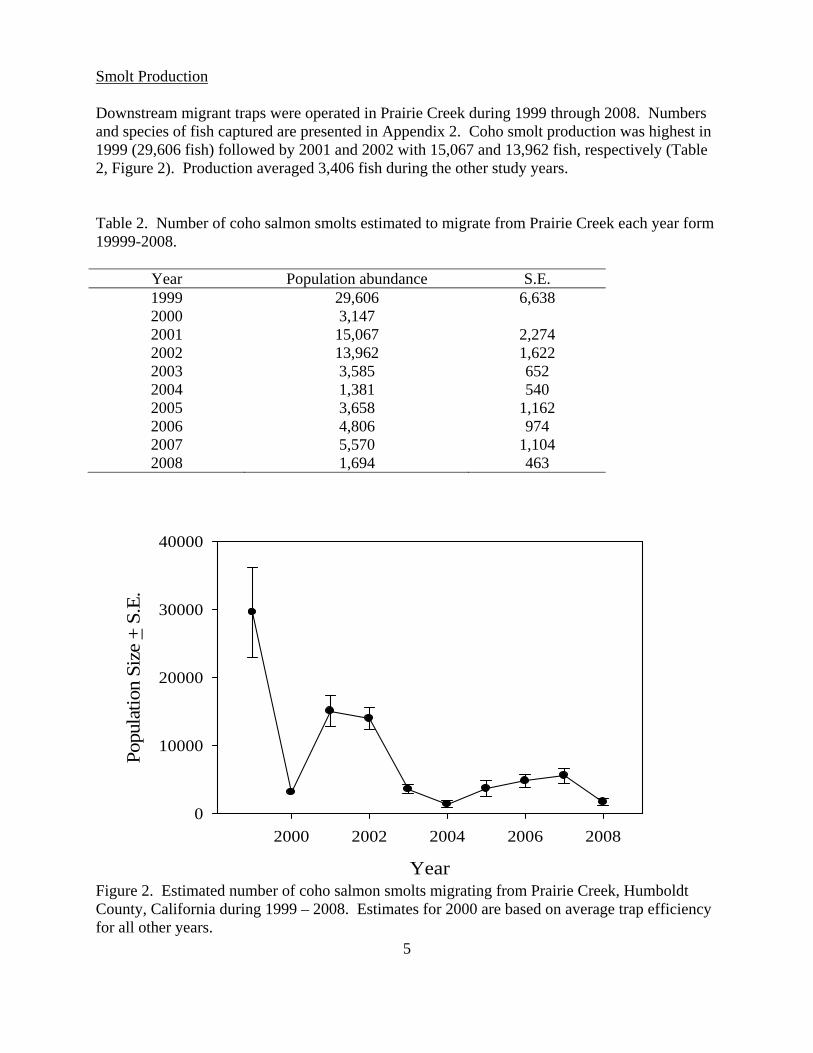
Smolt Production Downstream migrant traps were operated in Prairie Creek during 1999 through 2008. Numbers and species of fish captured are presented in Appendix 2. Coho smolt production was highest in 1999 (29,606 fish) followed by 2001 and 2002 with 15,067 and 13,962 fish, respectively (Table 2, Figure 2). Production averaged 3,406 fish during the other study years. Table 2. Number of coho salmon smolts estimated to migrate from Prairie Creek each year form 19999-2008.
Year Population abundance S.E. 1999 29,606 6,638 2000 3,147 2001 15,067 2,274 2002 13,962 1,622 2003 3,585 652 2004 1,381 540 2005 3,658 1,162 2006 4,806 974 2007 5,570 1,104 2008 1,694 463
Figure 2. Estimated number of coho salmon smolts migrating from Prairie Creek, Humboldt County, California during 1999 – 2008. Estimates for 2000 are based on average trap efficiency for all other years.
Year
2000 2002 2004 2006 2008
Popu
latio
n Si
ze +
S.E
.
0
10000
20000
30000
40000
6
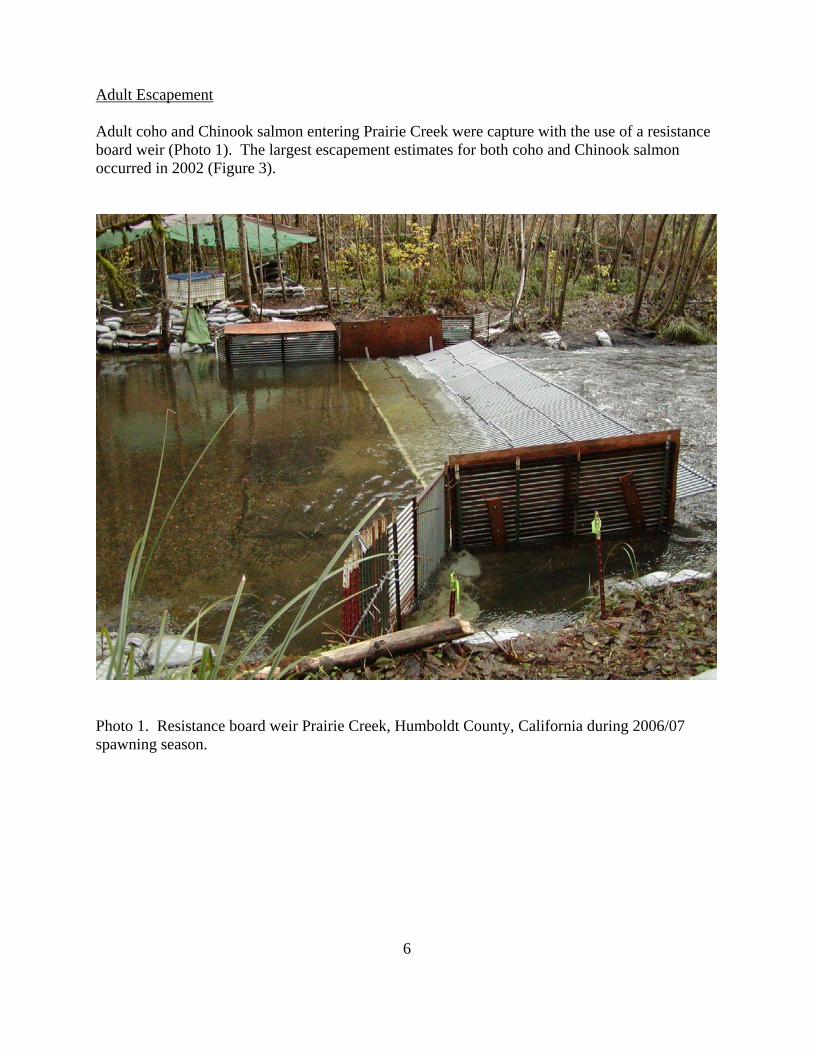
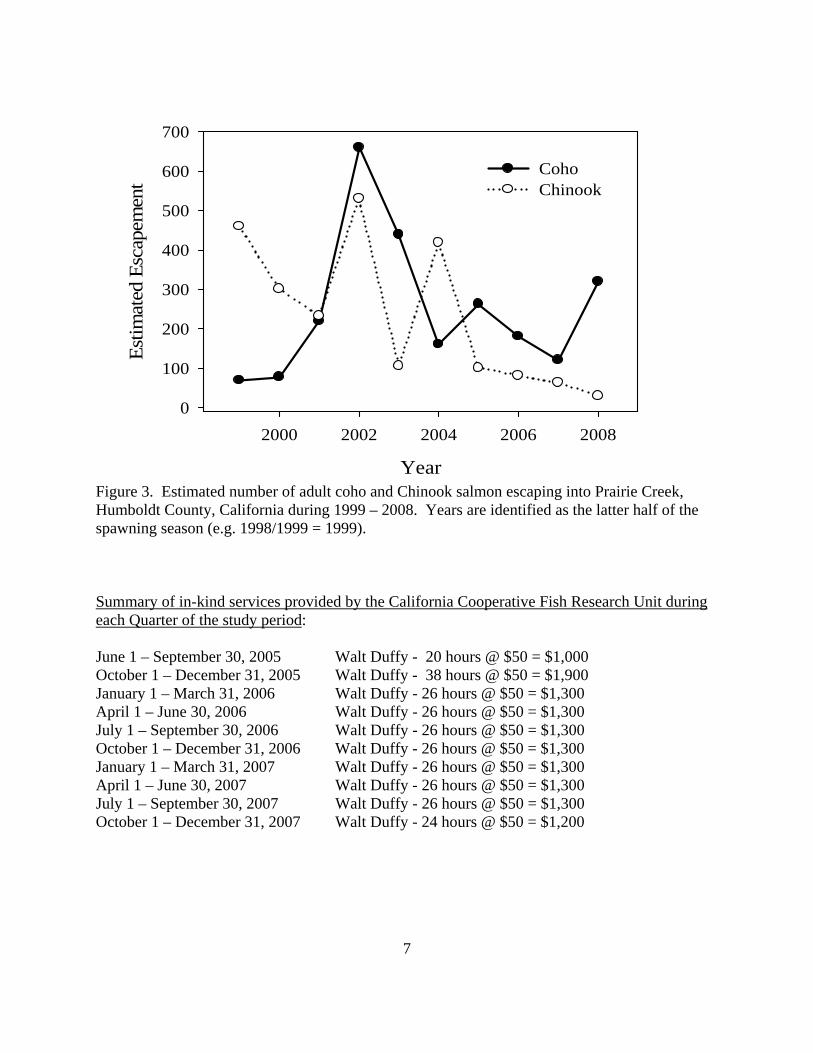
Adult Escapement Adult coho and Chinook salmon entering Prairie Creek were capture with the use of a resistance board weir (Photo 1). The largest escapement estimates for both coho and Chinook salmon occurred in 2002 (Figure 3).
Photo 1. Resistance board weir Prairie Creek, Humboldt County, California during 2006/07 spawning season.
7
Figure 3. Estimated number of adult coho and Chinook salmon escaping into Prairie Creek, Humboldt County, California during 1999 – 2008. Years are identified as the latter half of the spawning season (e.g. 1998/1999 = 1999).
Summary of in-kind services provided by the California Cooperative Fish Research Unit during each Quarter of the study period: June 1 – September 30, 2005 Walt Duffy - 20 hours @ $50 = $1,000 October 1 – December 31, 2005 Walt Duffy - 38 hours @ $50 = $1,900 January 1 – March 31, 2006 Walt Duffy - 26 hours @ $50 = $1,300 April 1 – June 30, 2006 Walt Duffy - 26 hours @ $50 = $1,300 July 1 – September 30, 2006 Walt Duffy - 26 hours @ $50 = $1,300 October 1 – December 31, 2006 Walt Duffy - 26 hours @ $50 = $1,300 January 1 – March 31, 2007 Walt Duffy - 26 hours @ $50 = $1,300 April 1 – June 30, 2007 Walt Duffy - 26 hours @ $50 = $1,300 July 1 – September 30, 2007 Walt Duffy - 26 hours @ $50 = $1,300 October 1 – December 31, 2007 Walt Duffy - 24 hours @ $50 = $1,200
Year
2000 2002 2004 2006 2008
Estim
ated
Esc
apem
ent
0
100
200
300
400
500
600
700
CohoChinook
8
RESULTS and DISCUSSISON by Study Quarter
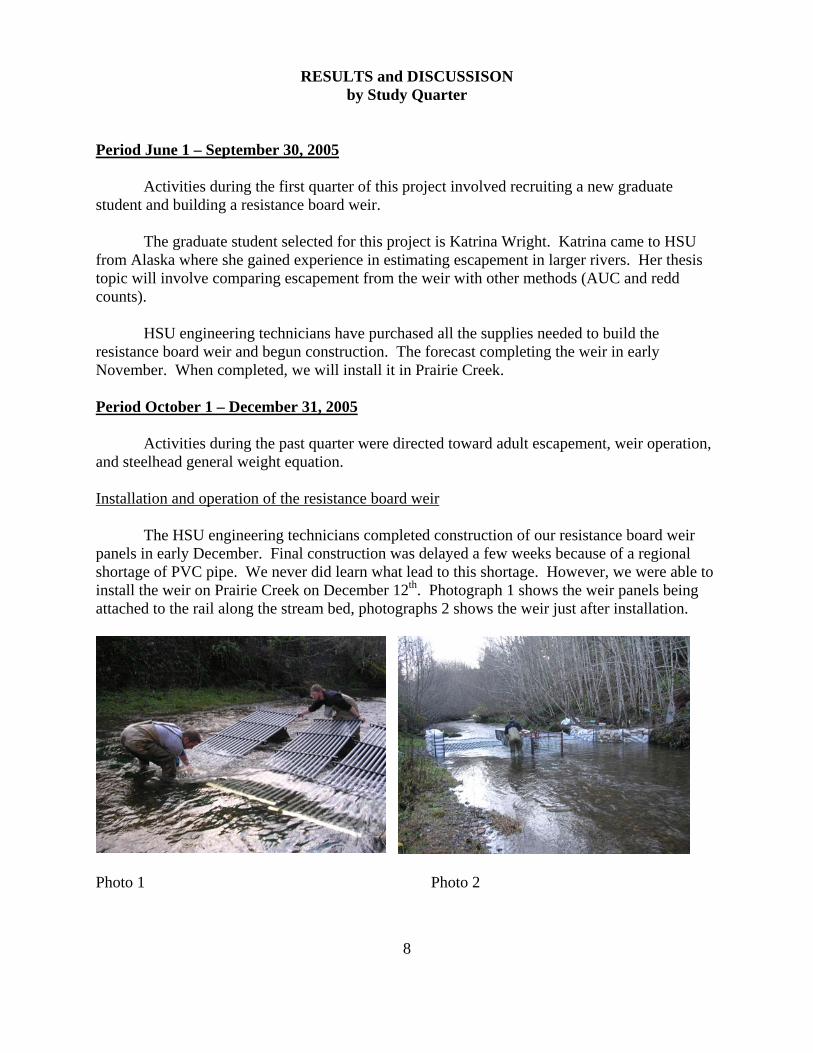
Period June 1 – September 30, 2005 Activities during the first quarter of this project involved recruiting a new graduate student and building a resistance board weir. The graduate student selected for this project is Katrina Wright. Katrina came to HSU from Alaska where she gained experience in estimating escapement in larger rivers. Her thesis topic will involve comparing escapement from the weir with other methods (AUC and redd counts). HSU engineering technicians have purchased all the supplies needed to build the resistance board weir and begun construction. The forecast completing the weir in early November. When completed, we will install it in Prairie Creek. Period October 1 – December 31, 2005 Activities during the past quarter were directed toward adult escapement, weir operation, and steelhead general weight equation. Installation and operation of the resistance board weir The HSU engineering technicians completed construction of our resistance board weir panels in early December. Final construction was delayed a few weeks because of a regional shortage of PVC pipe. We never did learn what lead to this shortage. However, we were able to install the weir on Prairie Creek on December 12th. Photograph 1 shows the weir panels being attached to the rail along the stream bed, photographs 2 shows the weir just after installation.
Photo 1 Photo 2
9
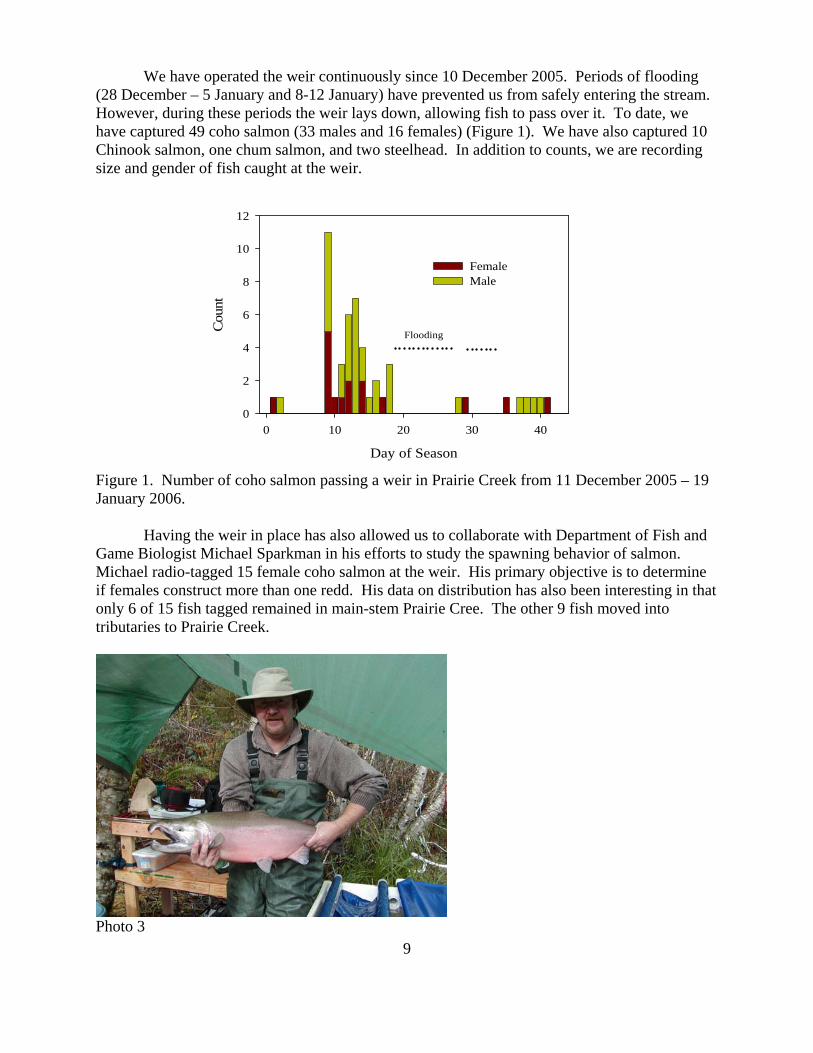
We have operated the weir continuously since 10 December 2005. Periods of flooding (28 December – 5 January and 8-12 January) have prevented us from safely entering the stream. However, during these periods the weir lays down, allowing fish to pass over it. To date, we have captured 49 coho salmon (33 males and 16 females) (Figure 1). We have also captured 10 Chinook salmon, one chum salmon, and two steelhead. In addition to counts, we are recording size and gender of fish caught at the weir.
Figure 1. Number of coho salmon passing a weir in Prairie Creek from 11 December 2005 – 19 January 2006. Having the weir in place has also allowed us to collaborate with Department of Fish and Game Biologist Michael Sparkman in his efforts to study the spawning behavior of salmon. Michael radio-tagged 15 female coho salmon at the weir. His primary objective is to determine if females construct more than one redd. His data on distribution has also been interesting in that only 6 of 15 fish tagged remained in main-stem Prairie Cree. The other 9 fish moved into tributaries to Prairie Creek.
Photo 3
Day of Season
0 10 20 30 40
Cou
nt
0
2
4
6
8
10
12
FemaleMale
Flooding
10
Escapement estimates
We initiated weekly escapement estimates from walking Prairie Creek the week prior to the installation of the weir. These data will be used to derive escapement estimates and compared with weir counts. Steelhead relative weight Kate McLaughlin has completed her analysis and developed a preliminary general weight equation for steelhead. She will present this work at the CalNeva Chapter meeting this spring. Her abstract is included below.
A Proposed Standard Weight Equation for Juvenile Steelhead (Oncorhycus mykiss) Condition factors are widely used in fisheries management to determine the health of a population or as an indicator of environmental quality. There are a variety of condition factors used by biologists including Fulton’s condition factor (K), relative condition (Kn) and relative weight (Wr). The use of Wr is advantageous because fish of different lengths or from different populations may be compared. Wr is calculated using the formula, where W is the weight of the fish in question and Ws is the standard weight of a fish at a specified weight, calculated using a standard weight equation. Length and weight data from one hundred and nineteen populations of juvenile steelhead, ranging from California to Alaska, were incorporated in the juvenile steelhead Ws equation. The proposed equation is log10Ws(g) = -4.792 + 2.929 log10fork length (FL, mm). The equation may be used on length-weight data from juvenile steelhead between 50 and 200 mm. There are applications for the equation in the evaluation of restoration projects. Period January 1 – March 31, 2006 Activities during the past quarter were directed toward weir operation, adult escapement and smolt trapping. Operation of the resistance board weir We operated the weir from 10 December 2005 through 24 March 2006. The weir held up well and continued fishing through periods of flooding in December, January and February. For some period during each of these flood events, however, water topped the weir allowing fish to pass and high water prevented us from safely entering the stream. In March, a scour hole appeared under a 3’ section of the weir, the result of sustained high water. On 23 March we documented steelhead above the weir that had not been recorded at the weir and, therefore, removed the weir for the season.
The weir provided us with an opportunity to gather valuable biological data, despite discontinuous collections caused by record rainfall. We also learned important lessons on operating the weir that will improve future data collection. During the season we observed 68 coho salmon passing the weir, 36 males and 32 females. Coho salmon observations peaked during 18-23 December and ranged from 10 December through 31 January. We observed only 11 Chinook salmon (9 males, 2 females), all in the period from 10-27 December. We observed 13 steelhead at the weir (10 males, 3 females), with the first arriving on 24 December and the last on 4 February. However, we documented steelhead passing through an eroded hole below the

11
weir in March. We also observed 1 female chum salmon at the weir. In future years we will widen the apron on which the weir rests. This should prevent
erosion and enable us to better document steelhead run timing. Less rainfall will, of course, also be a benefit. Adult Escapement
We continued weekly spawning surveys from walking Prairie Creek through 24 March. Operation of the weir in concert with spawning surveys will allow us to estimate residence time of adult fish. Residence time, and adult spawning survey data when compared with weir counts, will help refine area-under-the-curve estimates of numbers of fish entering the stream.
Smolt trapping
We installed a single smolt trap in Prairie Creek on March 2, 2006. Although water has remained high through the spring, we have be able to operate the trap almost continuously since installation. Data from the trap will be used to compare with adult escapement and juvenile population sizes. Presentations Kate McLaughlin and Walt Duffy each presented oral papers at the Cal/Neva Chapter of AFS meeting in San Lois Obispo in March. Support by CDFG was acknowledged by both speakers. Titles are: McLaughlin, K.D. and W.G. Duffy. A proposed standard weight equation for juvenile steelhead (Oncorhynchus mykiss). California/Nevada Chapter, American Fisheries Society, San Luis Obispo, CA, March 30, 2006. Duffy, W.G., S. Gough and K.D. McLaughlin. Influence of turbidity on bioenergetics of coastal cutthroat trout (Oncorhynchus clarki clarki). California/Nevada Chapter, American Fisheries Society, San Luis Obispo, CA, March 30, 2006. Period April 1 – June 30, 2006 Activities during the past quarter were directed toward smolt trapping, assessing the condition of juvenile steelhead following winter and editing chapters of reports.
Smolt trapping
We continued to operate a downstream migrant smolt trap in Prairie Creek through the first week in June, 2006. Water remained higher than normal through the trapping period, but we did not experience large storms and expect to have a good data set from which to judge numbers of smolts leaving the system. Data are now being entered and will be available soon. Juvenile steelhead condition Kate McLaughlin began sampling some streams to assess the condition of juvenile steelhead as soon after winter as possible. Although her analyses are focused on the late summer to early fall period when most sampling occurs in California, we thought it would be wise to
12
examine condition as soon after winter as possible. These samples will allow her to follow seasonal trends in condition to judge whether fish in poor condition during spring gain weight during summer, or not. Streams to be sampled this spring were Jacoby Creek, Freshwater Creek, Maple Creek, North Fork – and South Fork Casper Creek. Habitat typing for each reach to be sampled was completed in early June, and sampling for fish was completed by mid-June. Kate will examine these data to see if condition of juvenile steelhead in spring (or summer) is correlated with turbidity the previous winter. Editing reports Two sections of department protocols for validation monitoring were edited and returned to the project officer. This quarter, Duffy will begin drafting an introduction to these protocols. The intent of this introduction will be to clearly define how the protocols may be used to assess watershed responses to a set of likely restoration actions. Period July 1 – September 30, 2006 Activities during the past quarter were directed toward assessing the condition of juvenile steelhead following winter, analysis and writing of a thesis/report and installing the weir before winter. Juvenile steelhead condition Kate McLaughlin finished sampling streams to assess the condition of juvenile steelhead in July. She sampled a total of eight streams during June – July 2006. These data will allow us to compare steelhead condition soon after winter with their condition in the late summer and early fall period when most sampling occurs in California. Preliminary analysis of the data Kate has collected suggest condition is correlated with turbidity. However, it seems that no two turbidity gauging stations are operated during the same period. Some begin as early as October while others begin as late as December. We are in the process of trying to identify appropriate period to use in modeling steelhead condition. Response of juvenile salmonids to placement of large woody debris in California coastal streams.
Casey Justice finished a draft of his thesis, having the above title. The abstract of his thesis in included here.
Abstract
Large woody debris (LWD) is frequently placed into streams of the Pacific Northwest in an effort to mitigate for reductions in LWD and associated habitat degradation resulting from timber harvest and other anthropogenic disturbances. Unfortunately, many restoration projects do not incorporate monitoring of biotic response to these activities. In particular, the effect of instream restoration structures on juvenile coho salmon salmon (Oncorhynchus kisutch) and steelhead trout (Oncorhynchus mykiss) in regard to growth and survival is not well understood. This project compared stream reaches and individual channel units with differing quantities of

13
LWD to determine the effects of LWD restoration structures on fish biomass, size, growth, movement and survival. No significant differences in any response variables were detected between stream reaches with and without artificially placed LWD with the exception of age-0 trout biomass, which was significantly less in treatment than control reaches. Biomass of juvenile coho salmon salmon during summer and fall was positively related to stream depth, whereas steelhead biomass was positively related to both stream depth and cover. Mean growth rates of coho salmon salmon were not significantly related to any of the variables measured, whereas steelhead trout growth was negatively related to depth during summer and positively related to stream volume during the winter. Retention over summer for both coho salmon salmon and steelhead trout was positively related to depth. No significant trends were observed for age-0 trout. The fact that I did not detect differences between restored versus reference reaches may be related to the relatively small volume of LWD added when compared with undisturbed, old-growth streams, natural variation among selected study reaches that is unrelated to stream restoration, or low statistical power. Stream depth appeared to be the most influential physical habitat feature for salmonid productivity in these study sites. Although direct effects of habitat restoration were not detected in this study, these results indicate that stream restoration structures that effectively create deeper pools can positively benefit coho salmon and steelhead populations. The results of this study facilitate a broader understanding of salmonid response to restoration activities and provide insights into potential shortcomings of the post-treatment experimental design for monitoring effectiveness of stream restoration. Weir installation We began installation of the resistance board weir on Prairie Creek in late September and anticipate completing installation in October. Installing the weir at this time allows us to work in shallower water and insures the weir will be functioning when Redwood Creek estuary opens. The location of the weir was moved slightly downstream from the location used last winter. The new site was selected because the stream is wider and has larger substrate at this location. We believe this allow us the access the weir at higher flows and minimize possible erosion around the weir. Period October 1 – December 31, 2006 Activities this quarter have been devoted to improving estimates of escapement in Prairie Creek. We finished installing the resistance board weir on Prairie Creek in late October at the tail of a wide riffle 50 m downstream from the site used last year. We anticipated that shallower water and larger substrate at this site would allow us the access the weir at higher flows as well as minimize erosion around the weir. This has proven to be true, to date, although discharge this winter appear to be lower that last winter. The mouth of Redwood Creek opened this year on November 4, 2006. Somewhat surprisingly, this is the same date it opened in 2005. The first fish to reached the weir on November 15, and was a coho salmon. From 15 November through 8 January (yesterday) we have captured 90 coho salmon at the weir. Daily capture rates peaked during a storm event on December 9-12 and became more regular around 25 December (Figure 1). During this period we also captured 12 Chinook salmon, 4 cutthroat trout and 2 steelhead.
14
Day of Water Year
50 60 70 80 90 100
Num
ber
0
2
4
6
8
10
12
14
16
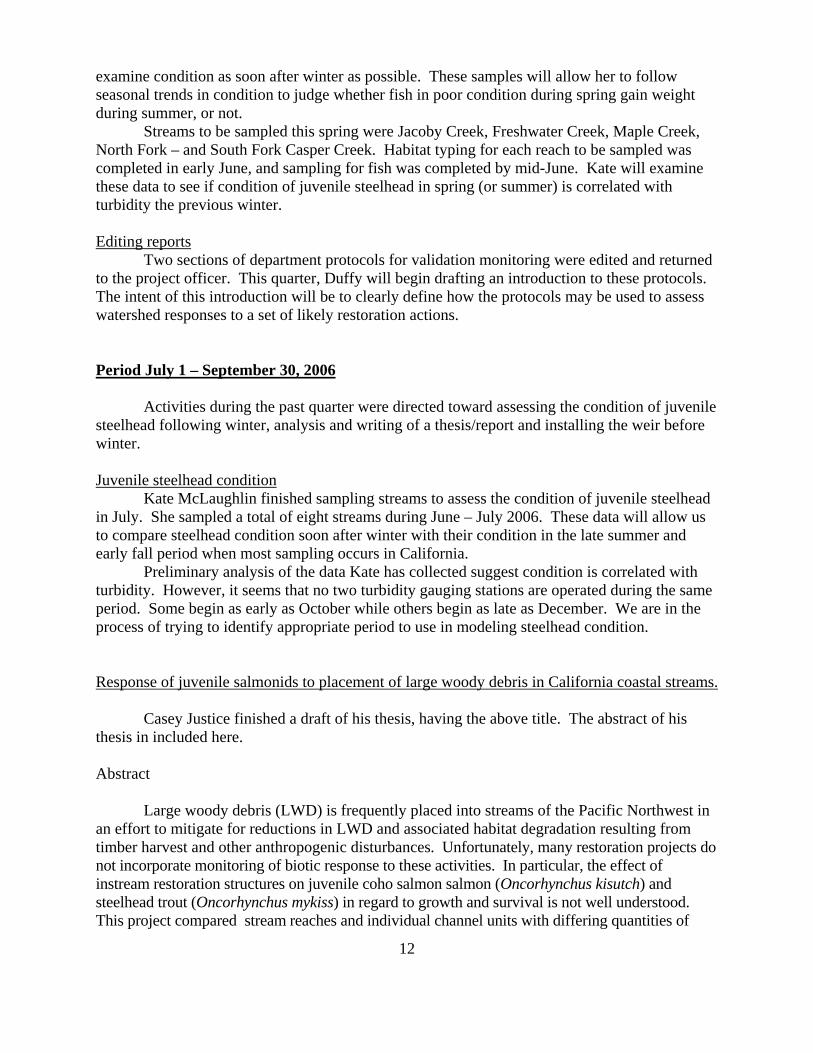
Figure 1. Catch of coho salmon in a weir on Prairie Creek during water year 2007 (10-1-2006 – 9-31-2007). Day 45 = 15 November, day 70 = 9 December and day 90 = 29 December.
PIT tags were implanted in 70 coho salmon, as well as in 4 Chinook salmon and 2 steelhead. Radio tags have been applied to 12 coho salmon and 3 Chinook salmon by Mike Sparkman (CDFG). In addition to operating the weir, we have conducted surveys above the weir visual. Surveys have consisted of visual observations of live fish, recapture of carcasses and locating PIT tagged fish using a backpack remote antenna. We have attempted to repeat these surveys on a 4-day cycle, although high water has prevented us from repeating surveys that frequently during two periods. Period January 1 – March 31, 2007 Activities this quarter were again devoted to improving estimates of escapement in Prairie Creek. These activities included:
• Operating the weir daily, • Operating a video camera and DVD recorder linked to a motion sensor, • PIT tagging adult salmon and steelhead captured, • Weekly stream surveys with a hand held PIT tag antenna to document re-sightings, and • Weekly stream surveys to record numbers of each species of salmonid.
Weather this past winter permitted us to operate the weir almost continuously from 8
November through 10 April. During this period we detected 100 coho salmon and 81 steelhead (Table 1). Note that jack males are not distinguished from adult males in this table. This was the first winter season in which we gathered reliable data on steelhead escapement to Prairie Creek and numbers were higher than we anticipated.
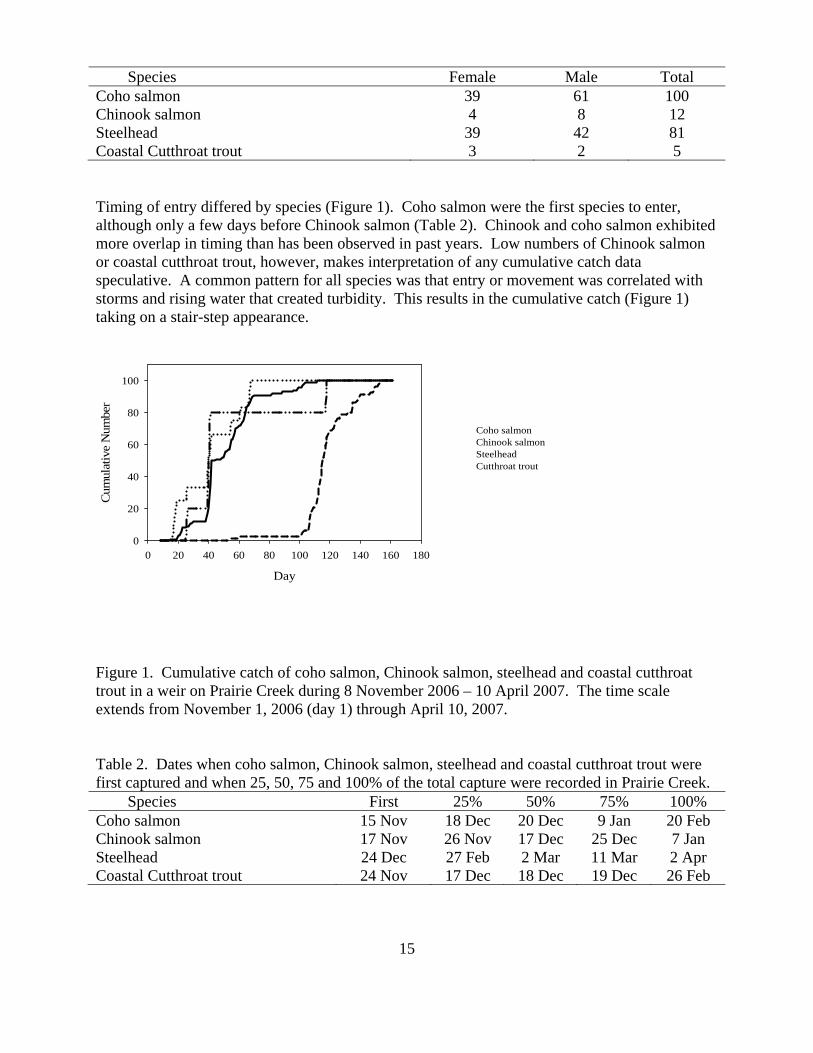
Table 1. Number and gender of salmon, streelhead and coastal cutthroat trout captured at a weir on Prairie Creek, 11/8/06 – 4/10/07.
15
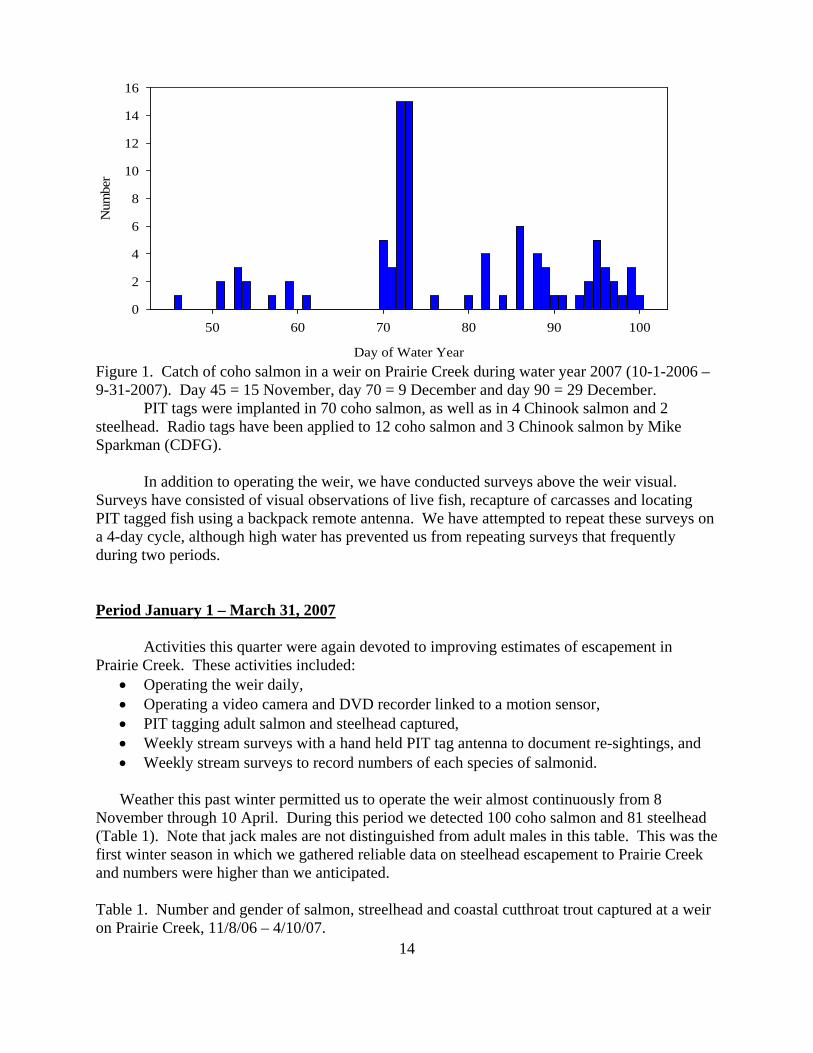
Species Female Male Total Coho salmon 39 61 100 Chinook salmon 4 8 12 Steelhead 39 42 81 Coastal Cutthroat trout 3 2 5 Timing of entry differed by species (Figure 1). Coho salmon were the first species to enter, although only a few days before Chinook salmon (Table 2). Chinook and coho salmon exhibited more overlap in timing than has been observed in past years. Low numbers of Chinook salmon or coastal cutthroat trout, however, makes interpretation of any cumulative catch data speculative. A common pattern for all species was that entry or movement was correlated with storms and rising water that created turbidity. This results in the cumulative catch (Figure 1) taking on a stair-step appearance.
Coho salmonChinook salmonSteelheadCutthroat trout
Figure 1. Cumulative catch of coho salmon, Chinook salmon, steelhead and coastal cutthroat trout in a weir on Prairie Creek during 8 November 2006 – 10 April 2007. The time scale extends from November 1, 2006 (day 1) through April 10, 2007. Table 2. Dates when coho salmon, Chinook salmon, steelhead and coastal cutthroat trout were first captured and when 25, 50, 75 and 100% of the total capture were recorded in Prairie Creek. Species First 25% 50% 75% 100% Coho salmon 15 Nov 18 Dec 20 Dec 9 Jan 20 Feb Chinook salmon 17 Nov 26 Nov 17 Dec 25 Dec 7 Jan Steelhead 24 Dec 27 Feb 2 Mar 11 Mar 2 Apr Coastal Cutthroat trout 24 Nov 17 Dec 18 Dec 19 Dec 26 Feb
Day
0 20 40 60 80 100 120 140 160 180
Cum
ulat
ive
Num
ber
0
20
40
60
80
100
16
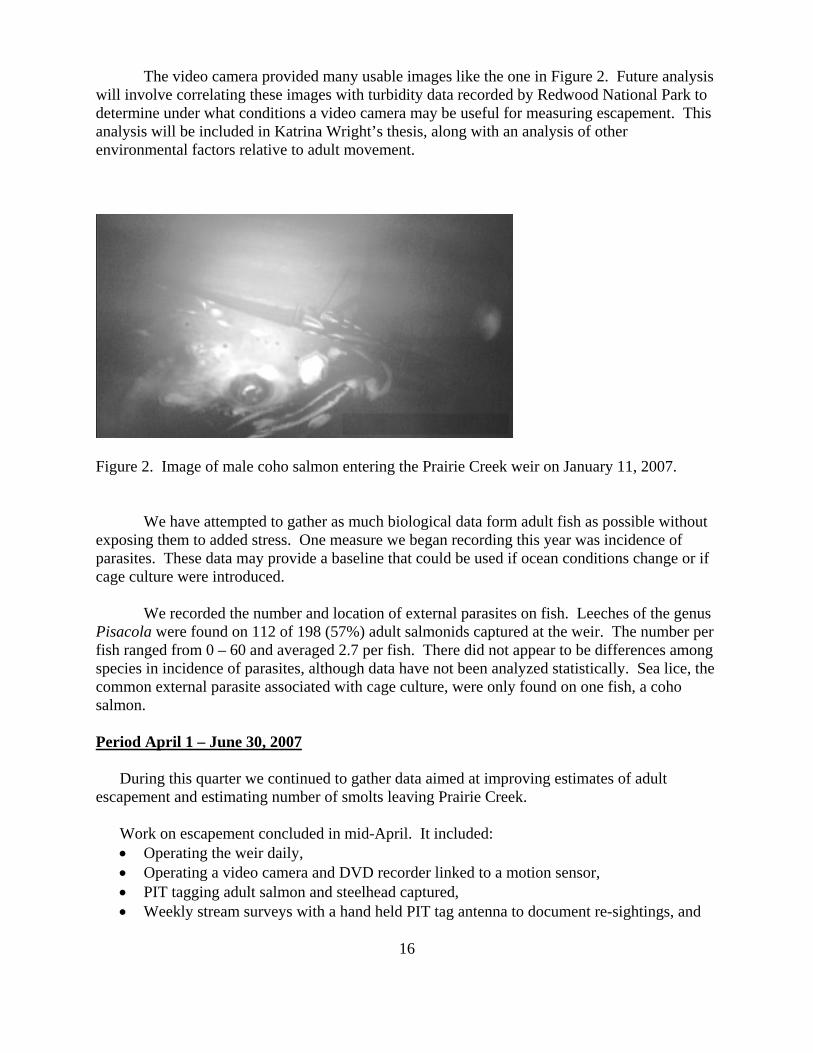
The video camera provided many usable images like the one in Figure 2. Future analysis will involve correlating these images with turbidity data recorded by Redwood National Park to determine under what conditions a video camera may be useful for measuring escapement. This analysis will be included in Katrina Wright’s thesis, along with an analysis of other environmental factors relative to adult movement.
Figure 2. Image of male coho salmon entering the Prairie Creek weir on January 11, 2007. We have attempted to gather as much biological data form adult fish as possible without exposing them to added stress. One measure we began recording this year was incidence of parasites. These data may provide a baseline that could be used if ocean conditions change or if cage culture were introduced.
We recorded the number and location of external parasites on fish. Leeches of the genus Pisacola were found on 112 of 198 (57%) adult salmonids captured at the weir. The number per fish ranged from 0 – 60 and averaged 2.7 per fish. There did not appear to be differences among species in incidence of parasites, although data have not been analyzed statistically. Sea lice, the common external parasite associated with cage culture, were only found on one fish, a coho salmon. Period April 1 – June 30, 2007
During this quarter we continued to gather data aimed at improving estimates of adult escapement and estimating number of smolts leaving Prairie Creek.
Work on escapement concluded in mid-April. It included: • Operating the weir daily, • Operating a video camera and DVD recorder linked to a motion sensor, • PIT tagging adult salmon and steelhead captured, • Weekly stream surveys with a hand held PIT tag antenna to document re-sightings, and
17
• Weekly stream surveys to record numbers of each species of salmonid.
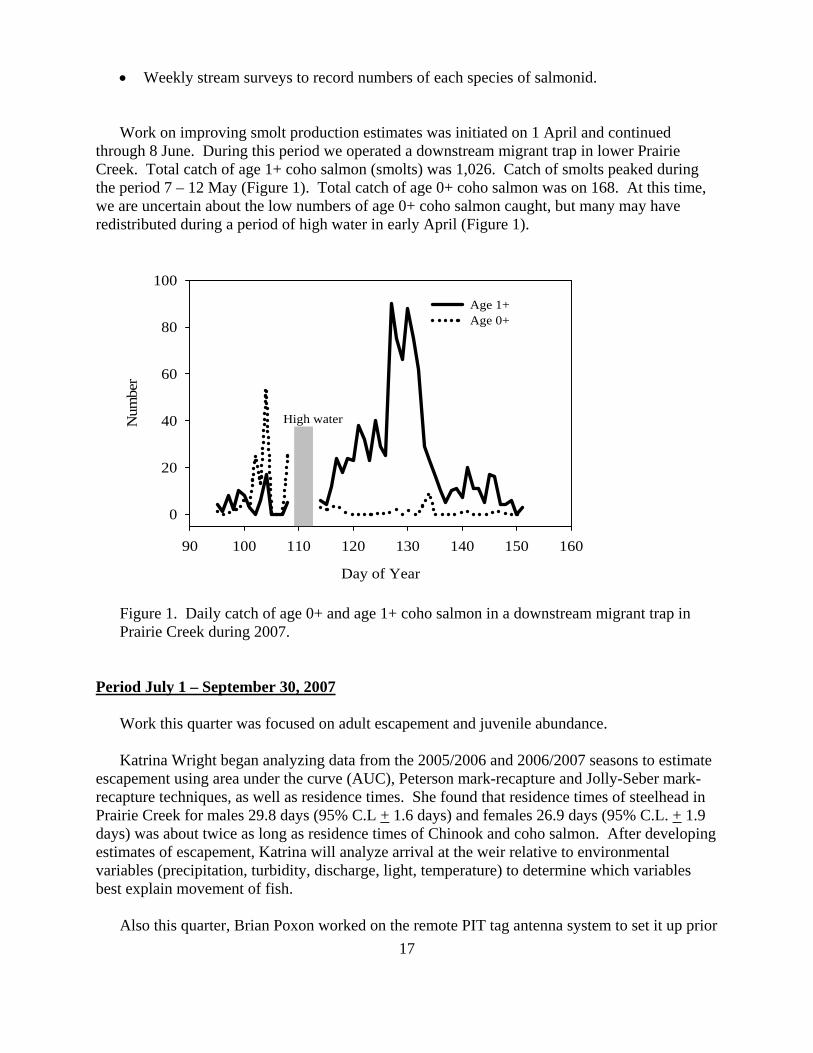
Work on improving smolt production estimates was initiated on 1 April and continued through 8 June. During this period we operated a downstream migrant trap in lower Prairie Creek. Total catch of age 1+ coho salmon (smolts) was 1,026. Catch of smolts peaked during the period 7 – 12 May (Figure 1). Total catch of age 0+ coho salmon was on 168. At this time, we are uncertain about the low numbers of age 0+ coho salmon caught, but many may have redistributed during a period of high water in early April (Figure 1).
Day of Year
90 100 110 120 130 140 150 160
Num
ber
0
20
40
60
80
100Age 1+Age 0+
High water
Figure 1. Daily catch of age 0+ and age 1+ coho salmon in a downstream migrant trap in Prairie Creek during 2007.
Period July 1 – September 30, 2007
Work this quarter was focused on adult escapement and juvenile abundance.
Katrina Wright began analyzing data from the 2005/2006 and 2006/2007 seasons to estimate escapement using area under the curve (AUC), Peterson mark-recapture and Jolly-Seber mark-recapture techniques, as well as residence times. She found that residence times of steelhead in Prairie Creek for males 29.8 days (95% C.L + 1.6 days) and females 26.9 days (95% C.L. + 1.9 days) was about twice as long as residence times of Chinook and coho salmon. After developing estimates of escapement, Katrina will analyze arrival at the weir relative to environmental variables (precipitation, turbidity, discharge, light, temperature) to determine which variables best explain movement of fish.
Also this quarter, Brian Poxon worked on the remote PIT tag antenna system to set it up prior

18
to the fall. Brian calibrated the antenna, developed an experimental design and identified locations in the field where antenna should best work. Brian will focus his graduate work on developing observer efficiency information that will improve AUC escapement estimates.
Finally, we completed juvenile abundance sampling for Prairie Creek in August. Methods
used were the same as previous years. However, we also completed a small experiment to compare daytime diver observations with observations from the surface at night.
In this experiment, we selected 10 pools in which divers had recorded numbers of juvenile
coho salmon and steelhead/cutthroat. We revisited these 10 pools within one week of diver observations and recorded numbers of the same species at night using an infrared light. Preliminary results of total numbers of fish indicated no difference between the two techniques. Our interest in developing this technique is that it may be a less intrusive method of gathering abundance data.
Period October 1 – December 31, 2007 Work this quarter was focused on adult escapement, data analysis and preparing reports.
We installed the weir on Prairie Creek on 15 October just as the first storm of the season was
arriving. This early storm did not result in any fish arriving at the Prairie Creek weir. However, fish arrived with the next storm in November (Figure 1). This winter has been characterized by storms separated by about two weeks and most, before this recent January storm, have been brief. Entry of fish into the stream has coincided with these storms (Figure 1). As of late December we had recorded 56 coho salmon, 9 Chinook salmon and 14 cutthroat trout at the weir.
Brian Poxon worked installed the remote PIT tag antenna system in October before fish entered the system and the antenna are functioning. Brian also developed a protocol for estimating observer efficiency for adults and has been implementing this during live fish surveys, about every other week.
Katrina Wright has been organizing data and calculating AUC estimates for all years based
on our improved residence times. This month she will begin modeling data for arrival at the weir from 2006/2007 to identify those variables that best explain fish movement or arrival at the weir. After that she will begin writing her thesis.
I have begun organizing and analyzing data from all years to write reports and publications.
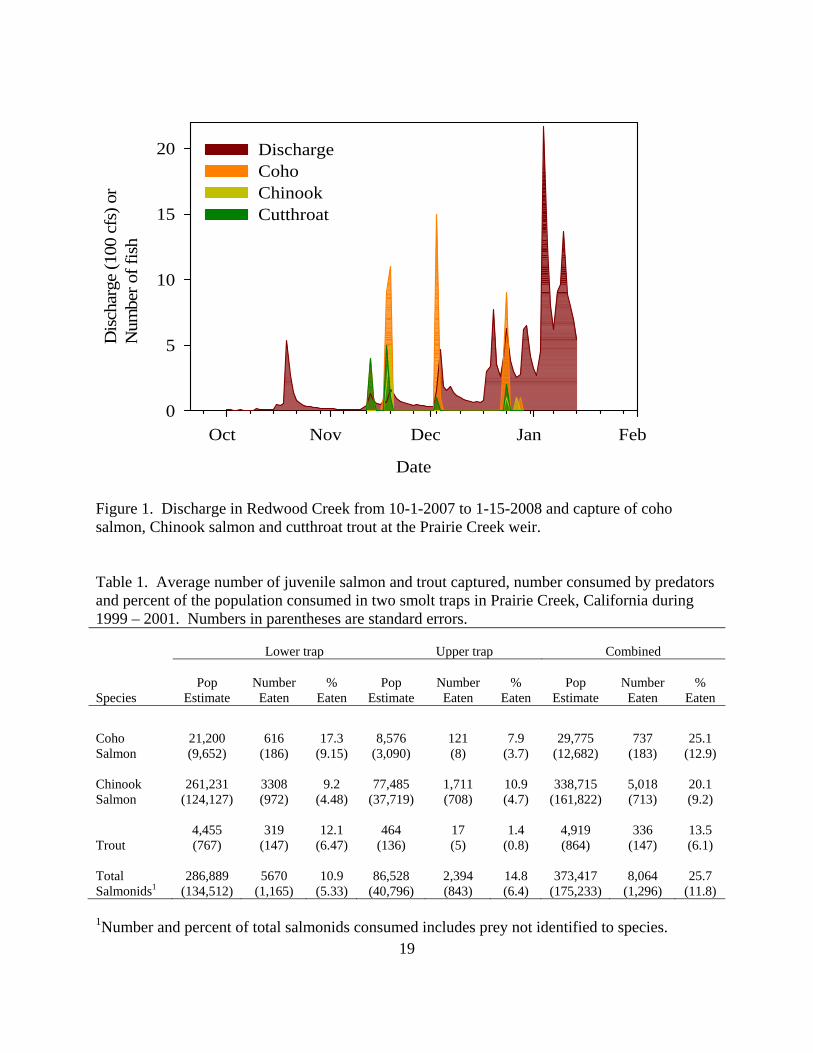
I am currently working, with Eric Bjorkstedt and a former student, on data we have collected for predation in downstream migrant traps. While we have not finished the statistical analyses, initial results are quite alarming (Table 1) in that a higher proportion of the coho and Chinook salmon fry populations are predated in traps than I would have estimated. I will appraise you of progress on this report since it may result in conservative recommendations for monitoring.
19
Date
Oct Nov Dec Jan Feb
Dis
char
ge (1
00 c
fs) o
rN
umbe
r of f
ish
0
5
10
15
20 Discharge CohoChinookCutthroat
Figure 1. Discharge in Redwood Creek from 10-1-2007 to 1-15-2008 and capture of coho salmon, Chinook salmon and cutthroat trout at the Prairie Creek weir. Table 1. Average number of juvenile salmon and trout captured, number consumed by predators and percent of the population consumed in two smolt traps in Prairie Creek, California during 1999 – 2001. Numbers in parentheses are standard errors.
Lower trap Upper trap Combined
Species
Pop
Estimate Number Eaten
% Eaten
Pop Estimate
Number Eaten
% Eaten
Pop Estimate
Number Eaten
% Eaten
Coho Salmon
21,200 (9,652)
616 (186)
17.3
(9.15) 8,576
(3,090) 121 (8)
7.9 (3.7)
29,775 (12,682)
737 (183)
25.1 (12.9)
Chinook Salmon
261,231
(124,127) 3308 (972)
9.2 (4.48)
77,485 (37,719)
1,711 (708)
10.9 (4.7)
338,715 (161,822)
5,018 (713)
20.1 (9.2)
Trout
4,455 (767)
319 (147)
12.1 (6.47)
464 (136)
17 (5)
1.4 (0.8)
4,919 (864)
336 (147)
13.5 (6.1)
Total Salmonids1
286,889 (134,512)
5670 (1,165)
10.9 (5.33)
86,528 (40,796)
2,394 (843)
14.8 (6.4)
373,417 (175,233)
8,064 (1,296)
25.7 (11.8)
1Number and percent of total salmonids consumed includes prey not identified to species.
20
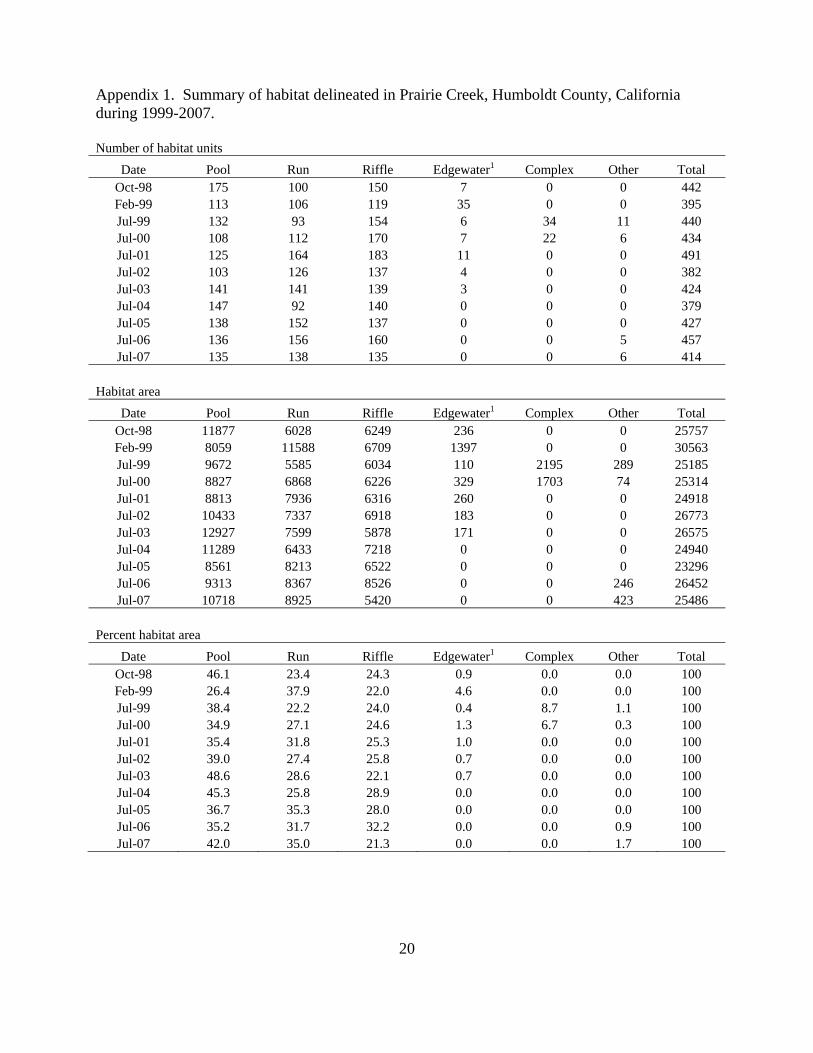
Appendix 1. Summary of habitat delineated in Prairie Creek, Humboldt County, California during 1999-2007. Number of habitat units
Date Pool Run Riffle Edgewater1 Complex Other Total Oct-98 175 100 150 7 0 0 442 Feb-99 113 106 119 35 0 0 395 Jul-99 132 93 154 6 34 11 440 Jul-00 108 112 170 7 22 6 434 Jul-01 125 164 183 11 0 0 491 Jul-02 103 126 137 4 0 0 382 Jul-03 141 141 139 3 0 0 424 Jul-04 147 92 140 0 0 0 379 Jul-05 138 152 137 0 0 0 427 Jul-06 136 156 160 0 0 5 457 Jul-07 135 138 135 0 0 6 414
Habitat area
Date Pool Run Riffle Edgewater1 Complex Other Total Oct-98 11877 6028 6249 236 0 0 25757 Feb-99 8059 11588 6709 1397 0 0 30563 Jul-99 9672 5585 6034 110 2195 289 25185 Jul-00 8827 6868 6226 329 1703 74 25314 Jul-01 8813 7936 6316 260 0 0 24918 Jul-02 10433 7337 6918 183 0 0 26773 Jul-03 12927 7599 5878 171 0 0 26575 Jul-04 11289 6433 7218 0 0 0 24940 Jul-05 8561 8213 6522 0 0 0 23296 Jul-06 9313 8367 8526 0 0 246 26452 Jul-07 10718 8925 5420 0 0 423 25486
Percent habitat area
Date Pool Run Riffle Edgewater1 Complex Other Total Oct-98 46.1 23.4 24.3 0.9 0.0 0.0 100 Feb-99 26.4 37.9 22.0 4.6 0.0 0.0 100 Jul-99 38.4 22.2 24.0 0.4 8.7 1.1 100 Jul-00 34.9 27.1 24.6 1.3 6.7 0.3 100 Jul-01 35.4 31.8 25.3 1.0 0.0 0.0 100 Jul-02 39.0 27.4 25.8 0.7 0.0 0.0 100 Jul-03 48.6 28.6 22.1 0.7 0.0 0.0 100 Jul-04 45.3 25.8 28.9 0.0 0.0 0.0 100 Jul-05 36.7 35.3 28.0 0.0 0.0 0.0 100 Jul-06 35.2 31.7 32.2 0.0 0.0 0.9 100 Jul-07 42.0 35.0 21.3 0.0 0.0 1.7 100
21
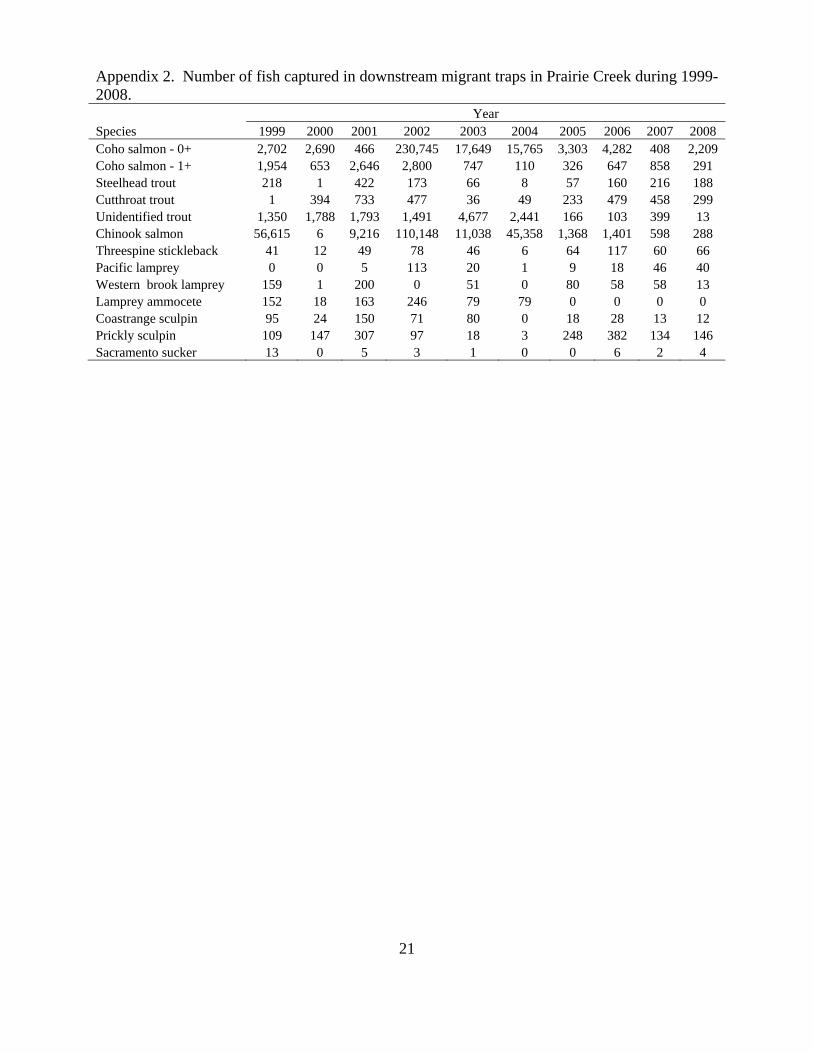
Appendix 2. Number of fish captured in downstream migrant traps in Prairie Creek during 1999-2008.
Year Species 1999 2000 2001 2002 2003 2004 2005 2006 2007 2008 Coho salmon - 0+ 2,702 2,690 466 230,745 17,649 15,765 3,303 4,282 408 2,209 Coho salmon - 1+ 1,954 653 2,646 2,800 747 110 326 647 858 291 Steelhead trout 218 1 422 173 66 8 57 160 216 188 Cutthroat trout 1 394 733 477 36 49 233 479 458 299 Unidentified trout 1,350 1,788 1,793 1,491 4,677 2,441 166 103 399 13 Chinook salmon 56,615 6 9,216 110,148 11,038 45,358 1,368 1,401 598 288 Threespine stickleback 41 12 49 78 46 6 64 117 60 66 Pacific lamprey 0 0 5 113 20 1 9 18 46 40 Western brook lamprey 159 1 200 0 51 0 80 58 58 13 Lamprey ammocete 152 18 163 246 79 79 0 0 0 0 Coastrange sculpin 95 24 150 71 80 0 18 28 13 12 Prickly sculpin 109 147 307 97 18 3 248 382 134 146 Sacramento sucker 13 0 5 3 1 0 0 6 2 4