Embed Size (px)
Citation preview

February 2014 M&A and Investment Summary
Expertise. Commitment. Results.

2 | M&A and Investment Summary February 2014
Table of Contents
Overview of Monthly M&A and Investment Activity 31
Monthly M&A and Investment Activity by Industry Segment 92
Additional Monthly M&A and Investment Activity Data 403
About Petsky Prunier 554
Securities offered through Petsky Prunier Securities, LLC, member of FINRA.
This M&A and Investment Summary has been prepared by and is being distributed in the United States by Petsky Prunier, a broker dealer registered with the U.S. SEC and a member of FINRA. Petsky Prunier is not affiliated with Altium Capital Ltd, but has partnered with Altium to expand its international presence. Altium has not prepared or verified the information in this Summary. Persons in the United States should contact Petsky Prunier for further information or services. This M&A and Investment Summary is not being distributed by Altium Capital Ltd in the United States and Altium Capital Ltd is not offering any services to persons in the United States.

3 | M&A and Investment Summary February 2014
M&A and Investment Summary for All Segments
Transaction Distribution
A total of 444 deals were announced in February 2014, of which 249 were worth $81.5 billion in aggregate reported value
Marketing Technology was the most active segment with 97 deals announced, respectively
Traditional Media was the highest reported value segment with 16 deals announced, of which eight were reported at $45.4 billion in aggregate value
Strategic buyers announced 209 deals (47 percent of total volume), of which 48 were worth $74.4 billion in aggregate value
VC/Growth Capital investors announced 226 deals, of which 198 were reported for $5.9 billion
Buyout investors announced nine deals during the month, of which three were reported at $1.2 billion in aggregate value
# % $MM % # $MM # $MM # $MM
Marketing Technology 97 22% $949.1 1% 34 $214.4 0 ‐ 63 $734.7
Digital Media/Commerce 89 20% 23,087.6 28% 33 22,638.7 1 ‐ 55 448.9
Software 89 20% 6,936.0 9% 34 5,398.4 4 260.0 51 1,277.6
Technology & Communications 48 11% 865.5 1% 25 312.9 0 ‐ 23 552.6
Digital Advertising 39 9% 697.7 1% 17 376.5 0 ‐ 22 321.2
Information & Business Services 37 8% 3,548.3 4% 25 56.7 2 915.0 10 2,576.6
Agency & Marketing Services 29 7% 12.5 0% 25 5.0 2 ‐ 2 7.5
Traditional Media 16 4% 45,365.6 56% 16 45,365.6 0 ‐ 0 ‐
Total 444 100% 81,462.2 100% 209 74,368.2 9 1,175.0 226 5,919.1
February 2014
BUYER/INVESTOR BREAKDOWN
Transactions Reported Value Strategic Buyout Venture/Growth Capital

4 | M&A and Investment Summary February 2014
M&A and Investment Summary for All Segments
Transaction Distribution
Compared to the previous month aggregate reported value in February increased 344 percent from January 2014, and 47 percent in deal volume from January 2013
Strategic activity accounted for 47 percent of reported deal value during the month, and included:
• Comcast’s purchase of Time Warner Cable for approximately $45.2 billion, at a valuation of 3.1x revenue, and 9.0x EBITDA
• Facebook’s $19 billion acquisition of WhatsApp, which provides a free cross‐platform mobile messaging application
• Rakuten’s $900 million purchase of Cyprus‐based Viber, a messaging platform and application developer
• Oracle’s acquisition of DMP BlueKai for a reported $400 million
(1) Aggregate totals for February 2013 do not include Liberty Global’s $24.3 billion acquisition of Virgin Media or Comcast’s $16.7 billion acquisition of its remaining 49 percent stake in NBC Universal(2) Aggregate totals for June 2013 do not include Vodafone’s $14 billion acquisition of Kabel Deutschland
$6.1 $8.7 $7.5
$20.2 $21.6
$38.0
$7.7
$18.0
$8.4 $11.7 $14.7
$18.4
$81.5
299 336 359 364 392 369 384 375 309 293 301 384 444 $-
$100.0
$200.0
$300.0
$400.0
$500.0
$‐
$10.0
$20.0
$30.0
$40.0
$50.0
$60.0
$70.0
$80.0
$90.0
Feb‐13 Mar‐13 Apr‐13 May‐13 Jun‐13 Jul‐13 Aug‐13 Sep‐13 Oct‐13 Nov‐13 Dec‐13 Jan‐14 Feb‐14
Omnicom/Publicis
WhatsApp/Facebook
Time Warner Cable/Comcast
(1)
(2)

5 | M&A and Investment Summary February 2014
Selected Transactions with Valuation Information Disclosed($ in Millions)
Target Subsegment Buyer/Investor Ent. Value Rev EBITDA EV/REV EV/EBITDA
Digital Media/CommerceZale Corporation eCommerce Signet Jewelers Ltd 1,234.0$ 1,893.0$ 70.0$ 0.7x 17.6xViber Media, Inc. Mobile Content/Apps Rakuten, Inc. 900.0 1.5 (26.5) NM NM Eddie Bauer Holdings, Inc. eCommerce Joseph A. Bank Clothiers, Inc. 825.0 825.0 86.8 1.0x 9.5xCoastal Contacts, Inc. eCommerce Essilor International SA 385.7 195.2 (11.0) 2.0x NM
Information & Business ServicesMedpace, Inc. Healthcare Consulting CCMP Capital Advisors, LLC 915.0 ‐ 95.0 NA 9.6xPeople & Print Group B.V. Printing Services VistaPrint USA, Inc. 32.9 46.8 4.1 0.7x 8.0xStaff Management Group Staffing Diamond Staffing Services, Inc. 10.0 85.0 ‐ 0.1x NA
Marketing Technology
Blue Kai, Inc. Online Targeting/Optimization Oracle Corporation 400.0 64.0 ‐ 6.3x NA
Software
Kronos Incorporated HR Software The Blackstone Group 4,500.2 243.4 78.7 18.5x 57.2x
Coverity, Inc. Software Development Tools Synopsys, Inc 350.0 74.5 ‐ 4.7x NA
Transics International Geo‐Demo Software WABCO Europe BVBA 156.4 50.3 8.7 3.1x 18.0x
Technology & Communications
ForwardThink Group, Inc. Financial Technology Perficient, Inc. 46.0 30.6 ‐ 1.5x NA
Traditional Media
Time Warner Cable Inc. Cable & Satell ite Television Comcast Corporation 69,392.2 22,120.0 7,729.0 3.1x 9.0x

6 | M&A and Investment Summary February 2014
Securities in Registration($ in Millions)
Aggregate Date Company Name Country Segment Offering Value Rev EBITDA
Feb‐14 Everyday Health, Inc. United States Digita l Media/Commerce 115.0 155.9 10.6
Feb‐14 Grub Hub, Inc. United States Digita l Media/Commerce NA NA NA
Feb‐14 Aerohive Networks , Inc. United States Software 75.0 107.1 (28.3)
Feb‐14 Borderfree, Inc. United States Software 86.3 110.5 1.4
Feb‐14 King Digita l Enterta inment plc United States Software 500.0 1,844.3 720.3
Feb‐14 Castl ight Heal th United States Software 100.0 13.0 NA
Feb‐14 Amber Road, Inc. United States Software 75.0 52.5 (11.7)
Jan‐14 Coupons.com United States Digita l Media/Commerce NA NA NA
Jan‐14 JD.com China Digita l Media/Commerce 1,500.0 NA NA
Jan‐14 Paylocity Corporation United States Software NA 46.0 NA
Dec‐13 IMS Health United States Software 100.0 NA NA
Oct‐13 Varonis Systems, Inc. United States Software 100.0 NA NA
Sep‐13 Midasplayer.com Ltd. (King.com) United Kingdom Digita l Media/Commerce NA NA NA
Jun‐12 goldenTech SA Switzerland Software 5.2 NA NA
Jun‐12 Shanghai Amarsoft Information Technology China Software NA NA NA
Apr‐12 BlackStratus , Inc. United States Software 20.0 9.2 (0.6)
Apr‐12 NSFOCUS Information Technology Co., Ltd. China Technology & Communications NA NA NA
Apr‐12 Shenzhen Tinno Mobi le Technology Corp. China Technology & Communications 451.0 NA NA
Mar‐12 Reva l Holdings , Inc. United States Software 75.0 47.0 (12.1)
LTM

7 | M&A and Investment Summary February 2014
LTM IPO Performance
Initial Offering Final Price Stock Price at Close Stock Price on % Change from
Date Ticker Company Name Country Price Range Per Share on 1st Trading Day Feb 28, 2014 1st Trading Day
Jan‐14 NYSE:CRCM Care.com, Inc. Uni ted States $14.00‐$16.00 $17.00 $24.30, up 43% $18.51 (23.8%)
Dec‐13 NYSE:ATHM Autohome Inc. China 14.00‐16.00 17.00 26.95, up 58% 41.20 52.9%
Dec‐13 NYSE:NMBL Nimble Storage, Inc. United States 18.00‐20.00 21.00 33.81, up 61% 48.01 42.0%
Nov‐13 NYSE:CUDA Barrracuda Networks , Inc. Uni ted States 18.00‐21.00 18.00 21.55, up 20% 35.95 66.8%
Nov‐13 NYSE:CHGG Chegg, Inc. Uni ted States 9.50‐11.50 12.50 9.64, down 23% 6.30 (34.6%)
Nov‐13 NYSE:MVNR Mavenir Systems, Inc. Uni ted States 15.00‐17.00 10.00 9.55, down 4.5% 15.45 61.8%
Nov‐13 NasdaqGM:GOMO Sungy Mobi le Limited China 9.50‐11.50 11.22 13.35, up 19% 27.56 106.4%
Nov‐13 NYSE:TWTR Twitter United States 23.00‐25.00 26.00 44.90, up 73% 54.91 22.3%
Nov‐13 NasdaqGM:WIX Wix.com Ltd. Uni ted States 14.50‐16.50 16.50 16.31, down 1% 30.90 89.5%
Nov‐13 NasdaqGS:ZU zul i ly, Inc. Uni ted States 18.00‐20.00 22.00 37.70, up 71% 68.39 81.4%
Oct‐13 NasdaqGS:COMM CommScope Holding Company Inc. Uni ted States 18.00‐21.00 15.00 4.99, flat 24.22 385.4%
Oct‐13 NasdaqGS:CRTO Cri teo SA France 27.00‐29.00 31.00 35.39, up 15% 53.47 51.1%
Oct‐13 NasdaqGS:EIGI Endurance International Group Holdings , Inc. China 14.00‐16.00 12.00 13.84, up 32% 15.09 9.0%
Oct‐13 SEHK:484 Forgame Holdings China 5.60‐7.09 6.58 8.70, up 32% 6.84 (21.4%)
Oct‐13 NasdaqGS:SFXE SFX Entertainment Inc. Uni ted States 11.00‐13.00 13.00 11.89, down 9% 8.59 (27.8%)
Oct‐13 NYSE:VEEV Veeva Systems Inc. Uni ted States 12.00‐14.00 20.00 37.16, up 86% 35.30 (5.0%)
Sep‐13 NasdaqGM:BNFT Benefitfocus , Inc. Uni ted States 21.50‐24.50 26.50 53.55, up 102% 64.78 21.0%
Sep‐13 NasdaqGS:COVS Covis int Corporation United States 9.00‐11.00 10.00 12.31, up 23% 10.75 (12.7%)
Sep‐13 NasdaqGS:FEYE Fi reEye, Inc. Uni ted States 12.00‐14.00 20.00 39.40, up 97% 85.64 117.4%
Sep‐13 NasdaqGS:MONT Montage Technology Group Limited China 12.00‐14.00 10.00 12.80, up 28% 15.73 22.9%
Sep‐13 NasdaqGS:PINC Premier, Inc. Uni ted States 23.00‐26.00 27.00 30.65, up 14% 33.45 9.1%
Sep‐13 NasdaqGS:FUEL Rocket Fuel , Inc. Uni ted States 27.00‐29.00 29.00 55.42, up 91% 56.06 1.2%
Sep‐13 NYSE:VMEM Viol in Memory, Inc. Uni ted States 8.00‐10.00 9.00 7.20, down 20% 4.35 (39.6%)
Aug‐13 NYSE:CVT Cvent, Inc. Uni ted States 17.00‐19.00 21.00 32.92, up 57% 39.28 19.3%
Aug‐13 NYSE:YUME YuMe, Inc. Uni ted States 12.00‐14.00 9.00 9.00, flat 6.39 (29.0%)
Jul ‐13 NasdaqGS:SALE Reta i lMeNot, Inc. Uni ted States 20.00‐22.00 21.00 27.70, up 32% 41.77 50.8%
Jun‐13 NYSE:GIMO Gigamon LLC United States 18.00‐20.00 19.00 28.47, up 50% 31.56 10.9%
Jun‐13 NasdaqGS:GOGO Gogo Inc. Uni ted States 15.00‐17.00 17.00 16.00, down 6% 20.85 30.3%

8 | M&A and Investment Summary February 2014
LTM IPO Performance
Initial Offering Final Price Stock Price at Close Stock Price on % Change from
Date Ticker Company Name Country Price Range Per Share on 1st Trading Day Feb 28, 2014 1st Trading Day
Jun‐13 NSEI:JUSTDIAL Just Dia l Limited India $8.39‐$9.69 $9.46 $10.77, up 14% 23.20 115.4%
Jun‐13 NYSE:LITB Light in the Box China 8.50‐10.50 9.50 11.61, up 22% 8.47 (27.0%)
Jun‐13 NYSE:LXFT Luxoft Holding, Inc. Switzerland 16.00‐18.00 17.00 20.71, up 22% 37.43 83.7%
Jun‐13 NYSE:TXTR Textura Corporation United States 13.00‐15.00 15.00 20.35, up 36% $26.91 32.2%
Jun‐13 NYSE:TRMR Tremor Video, Inc. Uni ted States 11.00‐13.00 10.00 8.50, down 15% 4.34 (48.9%)
May‐13 NYSE:ECOM ChannelAdvisor Corporation United States 12.00‐14.00 14.00 18.44, up 32% 45.38 146.1%
May‐13 NYSE:CYNI Cyan, Inc. Uni ted States 10.00‐12.00 11.00 11.14, up 1% 3.36 (69.8%)
May‐13 NasdaqGS:MKTO Marketo, Inc. Uni ted States 11.00‐13.00 13.00 23.10, up 78% 41.00 77.5%
May‐13 NYSE:Q Quinti les Transnational Holdings Inc. Uni ted States 36.00‐40.00 40.00 42.11, up 5% 54.15 28.6%
May‐13 NYSE:DATA Tableau Software, Inc. Uni ted States 28.00‐30.00 31.00 50.75, up 64% 94.34 85.9%
Apr‐13 NYSE:RALY Ral ly Software Development Corp. United States 11.00‐13.00 14.00 17.81, up 27% 19.89 11.7%
Mar‐13 NYSE:MRIN Marin Software United States 11.00‐13.00 14.00 16.26, up 16% 11.45 (29.6%)
Mar‐13 NYSE:MODN Model N, Inc. Uni ted States 12.50‐14.50 15.50 18.45, up 19% 10.99 (40.4%)
Mar‐13 TSE:3182 Ois ix Inc. Japan 10.42‐12.51 12.51 28.73, up 30% 31.30 8.9%
Mar‐13 NasdaqCM:IPDN Profess iona l Divers i ty Network LLC United States 10.00‐12.00 8.00 7.67, down 4% 3.19 (58.4%)
Feb‐13 AIM:DGS Digi ta l Globe Services , Ltd. Uni ted States No Range 2.47 2.59, up 5% 3.73 43.9%
Feb‐13 TSE:3671 Softmax Co., Ltd Japan 11.44‐13.52 13.52 31.16, up 30% 25.66 (17.6%)
Feb‐13 NasdaqGS:XOOM Xoom Corporation United States 13.00‐15.00 16.00 25.49, up 59% 28.03 10.0%

9 | M&A and Investment Summary February 2014
Digital Media/Commerce
Of the total $23.1 billion in value reported in the Digital Media/Commerce segment, $449 million in Venture/Growth investments were reported, while another $22.6 billion of strategic and buyout transactions were made
eCommerce and Mobile Content/Apps were the most active subsegments across all segments, with 35 and 25 transactions announced, respectively, worth a combined total of $22.7 billion
Select acquisitions:
• Facebook’s $19 billion acquisition of WhatsApp, which provides a free cross‐platform mobile messaging application
• Rakuten’s $900 million purchase of Cyprus‐based Viber, a messaging platform and application developer
• Signet Jewlers’ $1.2 billion purchase of Zale Corporation, at a valuation of 0.7x revenue, and 17.6x EBITDA
Select investments:
• The $58 million investment led by Goldman Sachs in SpiceWorks, a social community to IT professionals
• Microsoft’s $15 million investment in Foursquare, a social, location‐based check‐in application that also serves as a local search platform
# % $MM % # $MM # $MM # $MM
eCommerce 35 39% $2,768.9 12% 13 $2,578.7 1 ‐ 21 $190.2
Mobile Content/Apps 25 28% 19,939.9 86% 11 19,900.0 0 ‐ 14 39.9
Social Media/Apps 10 11% 106.1 0% 3 ‐ 0 ‐ 7 106.1
Classifieds/Auctions/P‐to‐P 6 7% 75.1 0% 0 ‐ 0 ‐ 6 75.1
Niche Content 5 6% 5.7 0% 2 ‐ 0 ‐ 3 5.7
Gaming 8 9% 191.9 1% 4 160.0 0 ‐ 4 31.9
Total 89 100% 23,087.6 100% 33 22,638.7 1 0.0 55 448.9
BUYER/INVESTOR BREAKDOWN
Transactions Reported Value Strategic Buyout Venture/Growth Capital
DIGITAL MEDIA/COMMERCE TRANSACTIONS BY SEGMENT

10 | M&A and Investment Summary February 2014
Digital Media/CommercePublic Company Valuation
($ in Millions, except stock price data)Stock Price Chg % From Equity Ent. LTM LTM Margin LTM LTM Multiples
Company Name Headquarters 03/02/14 52WK High Value Value Revenue EBITDA EBITDA Rev Growth EV/Rev EV/EBITDA1‐800‐Flowers.com Inc. United States $5.28 ‐26% $ 339.0 $ 342.6 $ 753.9 $ 46.4 6.2% 4.5% 0.5x 7.4x58.com Inc. * China 41.99 ‐8% 3,335.6 3,409.8 145.7 19.3 13.2% 67.3% 23.4x 176.9xAmazon.com Inc. United States 360.13 ‐12% 165,395.1 159,084.1 74,452.0 3,547.0 4.8% 21.9% 2.1x 44.9xAOL Inc. United States 44.52 ‐16% 3,537.2 3,451.9 2,319.9 436.3 18.8% 5.8% 1.5x 7.9xBaidu, Inc. China 178.92 ‐4% 62,676.3 59,616.0 5,198.1 2,067.8 39.8% 43.2% 11.5x 28.8xBlucora, Inc. United States 19.26 ‐36% 812.5 781.5 574.0 102.7 17.9% 41.1% 1.4x 7.6xBlue Nile Inc. United States 35.84 ‐27% 457.7 342.4 450.0 15.8 3.5% 12.5% 0.8x 21.6xCafePress Inc. United States 5.59 ‐25% 96.0 61.8 245.9 5.2 2.1% 12.9% 0.3x 11.8xCare.com, Inc. * United States 20.03 ‐32% 595.8 718.1 81.5 NA NA 68.0% 8.8x NA CDW Corporation United States 25.54 0% 4,391.8 7,711.5 10,768.6 710.5 6.6% 6.3% 0.7x 10.9xCopart, Inc. United States 36.36 ‐5% 4,576.3 4,885.3 1,107.7 334.1 30.2% 13.5% 4.4x 14.6xCupid plc United Kingdom 1.03 ‐57% 73.6 52.7 142.3 22.8 16.0% 109.5% 0.4x 2.3xCyberAgent Inc. Japan 44.37 ‐17% 2,764.5 2,605.5 1,620.1 172.7 10.7% 10.4% 1.6x 15.1xDemand Media, Inc. United States 4.97 ‐49% 424.2 366.9 394.6 171.8 43.5% 3.7% 0.9x 2.1xDeNA Co., Ltd. Japan 20.88 ‐26% 2,704.5 2,174.3 1,898.4 679.3 35.8% 0.0% 1.1x 3.2xeBay Inc. United States 58.34 ‐2% 75,530.2 70,628.2 16,047.0 4,771.0 29.7% 14.0% 4.4x 14.8xE‐Commerce China Dangdang Inc. * China 13.11 ‐2% 1,054.5 855.2 1,029.2 (25.1) NM 21.8% 0.8x NM eLong Inc. * China 17.33 ‐27% 598.9 296.0 164.3 (26.0) NM 35.7% 1.8x NM Expedia Inc. United States 78.62 ‐4% 10,178.0 10,559.3 4,771.3 654.9 13.7% 18.4% 2.2x 16.1xFacebook, Inc. United States 68.94 ‐3% 175,779.3 164,806.3 7,872.0 3,932.0 49.9% 54.7% 20.9x 41.9xForgame Holdings Limited China 6.97 ‐27% 883.7 950.6 163.3 51.7 31.6% 0.0% 5.8x 18.4xG5 Entertainment AB (publ) Sweden 4.12 ‐54% 36.2 30.9 14.3 4.3 29.7% 21.6% 2.2x 7.3xGameLoft SA France 10.89 ‐6% 896.9 813.2 307.2 46.6 15.2% 21.8% 2.6x 17.5xGeeknet, Inc. United States 14.77 ‐26% 98.3 45.2 138.3 1.1 0.8% 16.3% 0.3x 40.6xGlu Mobile, Inc. * United States 5.05 ‐3% 393.7 365.2 105.6 (12.9) NM ‐2.4% 3.5x NM Google Inc. United States 1,219.21 ‐1% 409,716.5 358,801.5 59,825.0 18,028.0 30.1% 19.2% 6.0x 19.9xGree, Inc. Japan 10.95 ‐18% 2,545.9 2,160.5 1,399.3 441.5 31.6% ‐12.7% 1.5x 4.9xHollywood Media Corp. * United States 1.33 ‐32% 30.1 5.3 0.5 (5.9) NM ‐22.1% 10.3x NM HSN, Inc. United States 57.35 ‐12% 3,046.5 3,090.7 3,404.0 307.6 9.0% 4.2% 0.9x 10.0xIAC/InterActiveCorp United States 76.67 ‐1% 6,303.6 6,362.6 3,023.0 545.0 18.0% 7.9% 2.1x 11.7xInternational Game Technology United States 15.06 ‐29% 3,715.3 5,328.0 2,352.5 778.3 33.1% 5.2% 2.3x 6.8xiProperty Group Limited * Malaysia 2.58 ‐4% 468.5 454.6 17.0 (2.4) NM 23.2% 26.7x NM j2 Global, Inc. United States 51.51 ‐8% 2,398.7 2,345.8 520.8 225.6 43.3% 40.2% 4.5x 10.4xJiayuan.com International Ltd. China 8.23 ‐13% 247.1 152.2 80.2 11.0 13.7% 19.9% 1.9x 13.9xJobStreet Corp. Bhd. * Malaysia 0.77 ‐16% 486.4 482.3 2.6 2.0 77.8% ‐94.7% 184.7x 237.3xKongzhong Corp. China 10.23 ‐31% 429.2 249.4 173.7 20.2 11.6% ‐3.8% 1.4x 12.4xLifeLock, Inc. United States 20.37 ‐11% 1,870.5 1,697.9 369.7 27.5 7.4% 33.7% 4.6x 61.8xLiberty Interactive Corporation United States 29.67 ‐1% 15,085.0 25,092.0 11,252.0 2,096.0 18.6% 11.9% 2.2x 12.0xLightInTheBox Holding Co., Ltd. * China 8.56 ‐63% 419.1 315.4 292.4 (3.6) NM 46.2% 1.1x NM LinkedIn Corporation * United States 213.77 ‐17% 25,765.9 23,441.6 1,528.5 166.7 10.9% 57.2% 15.3x 140.6xLiquidity Services, Inc. * United States 26.26 ‐36% 847.9 746.4 505.6 NA NA 2.9% 1.5x NA

11 | M&A and Investment Summary February 2014
Digital Media/CommercePublic Company Valuation
Stock Price Chg % From Equity Ent. LTM LTM Margin LTM LTM Multiples Company Name Headquarters 03/02/14 52WK High Value Value Revenue EBITDA EBITDA Rev Growth EV/Rev EV/EBITDAMediabistro Inc. * United States 2.31 ‐57% $ 13.9 $ 20.8 $ 12.8 $ (1.9) NM ‐8.8% 1.6x NM MeetMe, Inc. * United States 2.66 ‐9% 102.3 101.1 39.0 (4.4) NM ‐4.9% 2.6x NM Mercadolibre, Inc. Argentina $104.18 ‐29% 4,599.9 4,400.4 472.6 165.4 35.0% 26.5% 9.3x 26.6xMixi, Inc. * Japan 61.52 ‐31% 954.2 850.1 88.8 1.8 2.0% ‐33.9% 9.6x NM NCsoft Corporation South Korea 183.86 ‐22% 3,667.0 3,103.3 776.6 248.6 32.0% 36.3% 4.0x 12.5xNetflix, Inc. * United States 452.23 ‐1% 27,046.6 26,376.8 4,374.6 276.7 6.3% 21.2% 6.0x 95.3xNEXON Co., Ltd. Japan 8.85 ‐34% 3,886.3 3,041.4 1,521.7 634.4 41.7% 43.2% 2.0x 4.8xOpenTable, Inc. United States 80.72 ‐8% 1,892.8 1,778.3 190.1 58.1 30.6% 17.6% 9.4x 30.6xOrbitz Worldwide, Inc. United States 9.52 ‐28% 1,030.1 1,356.0 847.0 116.1 13.7% 8.8% 1.6x 11.7xOverstock.com Inc. United States 20.56 ‐42% 492.6 343.9 1,304.2 30.6 2.3% 18.6% 0.3x 11.2xPacific Online Ltd. China 0.78 ‐5% 845.7 801.0 123.4 50.5 40.9% 12.1% 6.5x 15.9xPandora Media, Inc. * United States 38.49 ‐3% 7,598.8 7,254.4 588.3 (42.0) NM 53.5% 12.3x NM PC Home Online Inc. Taiwan 7.17 ‐12% 589.7 494.6 522.1 23.5 4.5% 8.6% 0.9x 21.0xPerform Group plc. United Kingdom 3.84 ‐63% 1,009.9 1,052.5 296.0 58.6 19.8% 40.8% 3.6x 18.0xPetMed Express, Inc. United States 13.60 ‐23% 271.0 229.5 235.9 29.3 12.4% 1.4% 1.0x 7.8xPhoenix New Media Limited China 11.10 ‐17% 855.1 624.2 231.8 43.8 18.9% 28.2% 2.7x 14.2xpriceline.com Incorporated United States 1,357.79 ‐1% 70,797.9 65,947.7 6,793.3 2,553.1 37.6% 29.1% 9.7x 25.8xRakuten, Inc. Japan 14.45 ‐20% 19,041.0 19,159.2 5,079.8 1,187.2 23.4% 0.0% 3.8x 16.1xRealNetworks Inc. * United States 7.57 ‐15% 270.5 44.3 206.2 (31.7) NM ‐20.3% 0.2x NM Rediff.com India Limited * India 2.12 ‐40% 58.5 38.5 16.4 (6.0) NM 1.8% 2.3x NM Renren Inc. * China 3.65 ‐21% 1,382.6 474.2 192.6 (104.3) NM 20.3% 2.5x NM Shutterfly, Inc. United States 53.69 ‐10% 2,053.0 1,798.9 783.6 86.1 11.0% 22.3% 2.3x 20.9xShutterstock, Inc. United States 102.84 0% 3,606.7 3,396.9 235.5 47.0 19.9% 38.9% 14.4x 72.3xSky‐mobi Limited China 6.28 ‐7% 185.8 85.0 84.3 7.2 8.6% ‐16.3% 1.0x 11.8xSNAP Interactive, Inc. * United States 0.30 ‐74% 11.7 10.2 13.6 (4.4) NM ‐34.7% 0.8x NM Spark Networks, Inc. * United States 5.96 ‐36% 143.0 125.8 68.5 (9.1) NM 17.4% 1.8x NM Stamps.com Inc. United States 36.15 ‐27% 582.0 494.8 127.8 36.5 28.6% 10.5% 3.9x 13.5xTaomee Holdings Ltd. China 6.35 ‐18% 233.5 117.5 44.9 5.0 11.0% 8.7% 2.6x 23.7xTheStreet, Inc. * United States 2.94 ‐3% 99.8 50.6 54.5 0.3 0.6% 7.4% 0.9x 146.0xTwitter, Inc. * United States 55.77 ‐25% 30,377.7 28,341.3 664.9 (541.5) NM 109.8% 42.6x NM U.S. Auto Parts Network, Inc. United States 1.99 ‐37% 66.2 83.2 257.9 1.7 0.7% ‐19.0% 0.3x 48.3xUnited Online, Inc. United States 11.43 ‐82% 157.1 88.8 233.6 20.3 8.7% ‐73.2% 0.4x 4.4xValueVision Media Inc. United States 5.74 ‐19% 285.7 294.8 624.7 14.1 2.3% 12.2% 0.5x 21.0xVipshop Holdings Limited * China 116.57 ‐5% 6,487.9 6,006.2 1,345.3 36.6 2.7% 170.3% 4.5x 164.1xVitacost.com, Inc. * United States 7.46 ‐21% 251.0 226.2 382.7 (7.0) NM 15.7% 0.6x NM WebMD Health Corp. United States 45.35 ‐12% 1,773.2 1,900.5 515.3 84.3 16.4% 9.7% 3.7x 22.5xXO Group Inc. United States 12.46 ‐21% 336.4 250.2 133.4 24.0 18.0% 4.3% 1.9x 10.4xYahoo! Inc. United States 38.47 ‐8% 39,025.6 36,900.6 4,680.4 1,206.3 25.8% ‐6.1% 7.9x 30.6xYandex N.V. Netherlands 37.68 ‐17% 12,195.3 11,676.4 1,099.7 460.3 41.9% 37.3% 10.6x 25.4xYY Inc. China 75.00 ‐3% 4,140.4 3,835.6 240.5 59.0 24.5% 121.9% 15.9x 65.0xzulily, Inc. United States 72.75 ‐1% 8,880.3 8,572.1 695.7 19.3 2.8% 110.0% 5.2x 30.0xZynga, Inc. United States 5.21 ‐2% 4,568.6 3,443.1 873.3 73.6 8.4% ‐31.8% 3.9x 46.8x
Adjusted Weighted Average 8.9x 27.7x
12 | M&A and Investment Summary February 2014
Digital Advertising
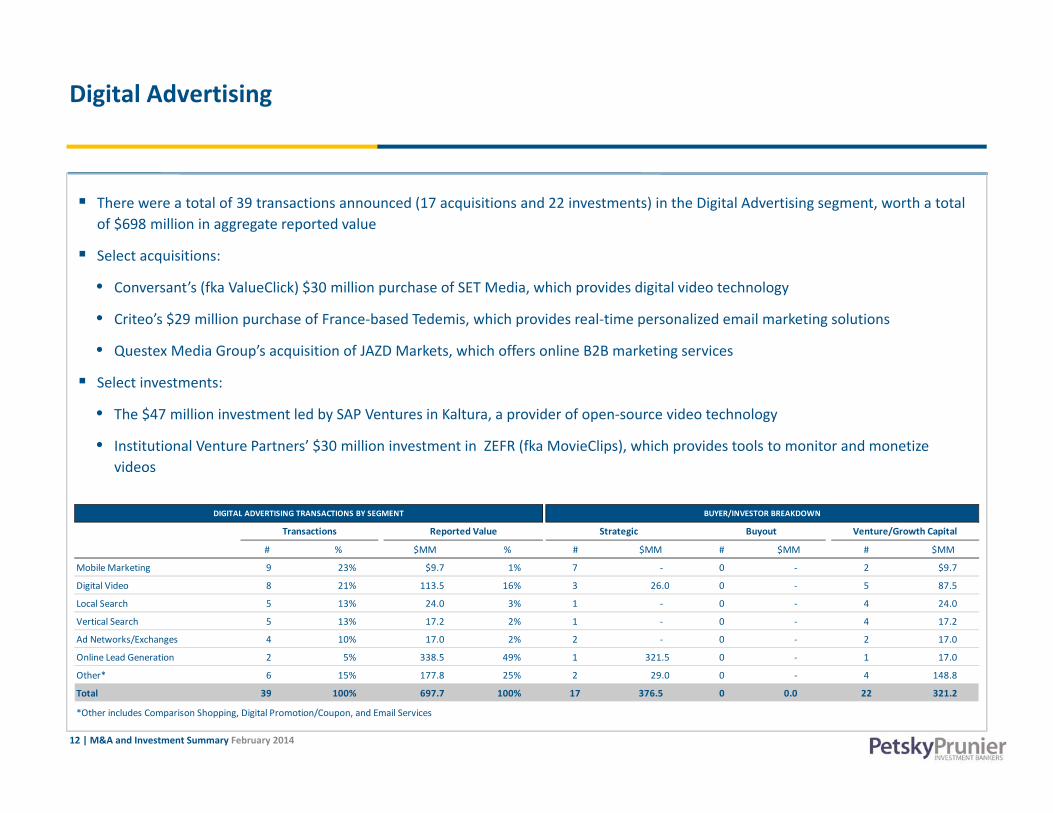
There were a total of 39 transactions announced (17 acquisitions and 22 investments) in the Digital Advertising segment, worth a total of $698 million in aggregate reported value
Select acquisitions:
• Conversant’s (fka ValueClick) $30 million purchase of SET Media, which provides digital video technology
• Criteo’s $29 million purchase of France‐based Tedemis, which provides real‐time personalized email marketing solutions
• Questex Media Group’s acquisition of JAZD Markets, which offers online B2B marketing services
Select investments:
• The $47 million investment led by SAP Ventures in Kaltura, a provider of open‐source video technology
• Institutional Venture Partners’ $30 million investment in ZEFR (fka MovieClips), which provides tools to monitor and monetize videos
# % $MM % # $MM # $MM # $MM
Mobile Marketing 9 23% $9.7 1% 7 ‐ 0 ‐ 2 $9.7
Digital Video 8 21% 113.5 16% 3 26.0 0 ‐ 5 87.5
Local Search 5 13% 24.0 3% 1 ‐ 0 ‐ 4 24.0
Vertical Search 5 13% 17.2 2% 1 ‐ 0 ‐ 4 17.2
Ad Networks/Exchanges 4 10% 17.0 2% 2 ‐ 0 ‐ 2 17.0
Online Lead Generation 2 5% 338.5 49% 1 321.5 0 ‐ 1 17.0
Other* 6 15% 177.8 25% 2 29.0 0 ‐ 4 148.8
Total 39 100% 697.7 100% 17 376.5 0 0.0 22 321.2
*Other includes Comparison Shopping, Digital Promotion/Coupon, and Email Services
DIGITAL ADVERTISING TRANSACTIONS BY SEGMENT BUYER/INVESTOR BREAKDOWN
Transactions Reported Value Strategic Buyout Venture/Growth Capital

13 | M&A and Investment Summary February 2014
Digital AdvertisingPublic Company Valuation
($ in Millions, except stock price data)
Stock Price Chg % From Equity Ent. LTM LTM Margin LTM LTM Multiples Company Name Headquarters 03/02/14 52WK High Value Value Revenue EBITDA EBITDA Rev Growth EV/Rev EV/EBITDAAngie's List, Inc. United States $13.91 ‐51% $ 813.8 $ 772.9 $ 245.6 $ (24.0) NM 57.7% 3.1x NM AOL Inc. United States 43.78 ‐18% 3,478.5 3,393.2 2,319.9 436.3 18.8% 5.8% 1.5x 7.8xAutobytel Inc. United States 15.76 ‐16% 140.4 130.7 78.4 4.6 5.8% 17.3% 1.7x 28.7xBankrate, Inc. United States 20.13 ‐13% 2,069.5 2,136.4 457.4 108.8 23.8% 0.1% 4.7x 19.6xBlinkx plc United States 1.69 ‐57% 674.3 602.5 227.5 31.8 14.0% 49.9% 2.6x 18.9xBlucora, Inc. United States 19.24 ‐36% 811.7 780.7 574.0 103.0 17.9% 41.1% 1.4x 7.6xConstant Contact, Inc. United States 27.57 ‐16% 845.3 722.1 285.4 30.5 10.7% 13.2% 2.5x 23.7xConversant, Inc. United States 24.86 ‐23% 1,659.6 1,718.3 573.1 207.2 36.1% ‐13.3% 3.0x 8.3xCriteo SA * France 53.47 ‐1% 3,040.1 2,733.3 613.0 33.4 5.4% 63.3% 4.5x 81.9xCtrip.com International Ltd. China 54.01 ‐12% 7,008.8 6,324.6 876.6 152.1 17.4% 29.5% 7.2x 41.6xDemand Media, Inc. United States 4.85 ‐50% 414.0 356.7 394.6 46.4 11.8% 3.7% 0.9x 7.7xDice Holdings, Inc. United States 7.36 ‐29% 398.7 478.4 213.5 62.7 29.4% 9.3% 2.2x 7.6xDigital Globe Services Inc. United States 3.73 ‐21% 111.2 106.8 25.5 3.4 13.4% 27.8% 4.2x 31.2xeHealth, Inc. * United States 48.00 ‐24% 893.8 786.8 179.2 11.6 6.5% 15.2% 4.4x 68.1xGoogle Inc. United States 1,215.65 ‐1% 408,520.2 357,605.2 59,825.0 18,028.0 30.1% 19.2% 6.0x 19.8xGroupon, Inc. United States 8.31 ‐35% 5,677.7 4,444.6 2,573.7 140.0 5.4% 10.2% 1.7x 31.7xHi‐Media S.A. France 3.05 ‐7% 136.4 155.0 258.2 15.9 6.2% ‐12.3% 0.6x 9.7xHomeAway, Inc. * United States 45.87 ‐6% 4,238.8 3,858.0 346.5 59.2 17.1% 23.6% 11.1x 65.2xIAC/InterActiveCorp United States 77.53 ‐1% 6,374.3 6,433.3 3,023.0 545.0 18.0% 7.9% 2.1x 11.8xInternetQ PLC United Kingdom 6.62 ‐4% 257.4 250.1 115.4 11.5 9.9% 36.9% 2.2x 21.8xLeGuide.com S.A. France 40.04 ‐28% 142.9 106.9 66.5 14.4 21.6% 41.3% 1.6x 7.4xMakeMyTrip Limited India 25.85 ‐13% 972.0 906.3 249.7 (16.7) NM 13.2% 3.6x NM Millennial Media Inc. United States 6.04 ‐42% 642.1 542.9 259.2 (11.1) NM 45.9% 2.1x NM Monster Worldwide, Inc. United States 7.97 ‐2% 766.1 867.2 807.6 112.3 13.9% ‐9.3% 1.1x 7.7xMove, Inc. United States 12.91 ‐30% 507.3 471.0 227.0 13.6 6.0% 14.0% 2.1x 34.7xOpera Software ASA Norway 13.62 ‐14% 1,801.5 1,635.9 300.1 82.5 27.5% 38.9% 5.5x 19.8xOPT, Inc. Japan 9.20 ‐28% 271.1 153.1 662.4 20.4 3.1% ‐14.3% 0.2x 7.5xPacific Online Ltd. China 0.76 ‐8% 826.0 781.3 123.4 50.5 40.9% 12.1% 6.3x 15.5xQuinStreet, Inc. United States 6.59 ‐32% 286.6 249.6 297.8 26.7 9.0% ‐9.5% 0.8x 9.3xReachLocal, Inc. United States 10.58 ‐39% 293.9 213.7 514.1 22.5 4.4% 12.9% 0.4x 9.5xRetailMeNot, Inc. United States 41.77 ‐14% 2,203.2 2,078.6 209.8 70.8 33.7% 45.0% 9.9x 29.4xRightmove plc * United Kingdom 46.16 ‐2% 4,468.0 4,456.7 234.5 163.8 69.9% 17.2% 19.0x 27.2xRocket Fuel Inc. United States 56.06 ‐22% 1,965.1 1,878.7 240.6 (10.2) NM 125.7% 7.8x NM Rovi Corporation United States 24.84 ‐6% 2,428.9 3,099.9 538.1 181.3 33.7% 2.3% 5.8x 17.1xSepteni Holdings Co., Ltd. Japan 12.11 ‐20% 305.5 255.6 466.5 22.3 4.8% 12.0% 0.5x 11.4xTiVo Inc. * United States 13.50 ‐5% 1,628.3 798.4 406.3 9.0 2.2% 33.7% 2.0x 88.9xTradeDoubler AB Sweden 2.74 ‐26% 116.2 75.3 312.1 8.3 2.7% ‐13.3% 0.2x 9.0xTravelzoo Inc. United States 23.62 ‐30% 354.1 287.5 158.2 27.3 17.2% 4.7% 1.8x 10.5xTree.Com, Inc. United States 33.81 ‐3% 376.6 288.9 126.8 6.7 5.3% 97.6% 2.3x 42.9xTremor Video, Inc. United States 4.34 ‐61% 215.5 122.8 131.8 (7.2) NM 25.3% 0.9x NM
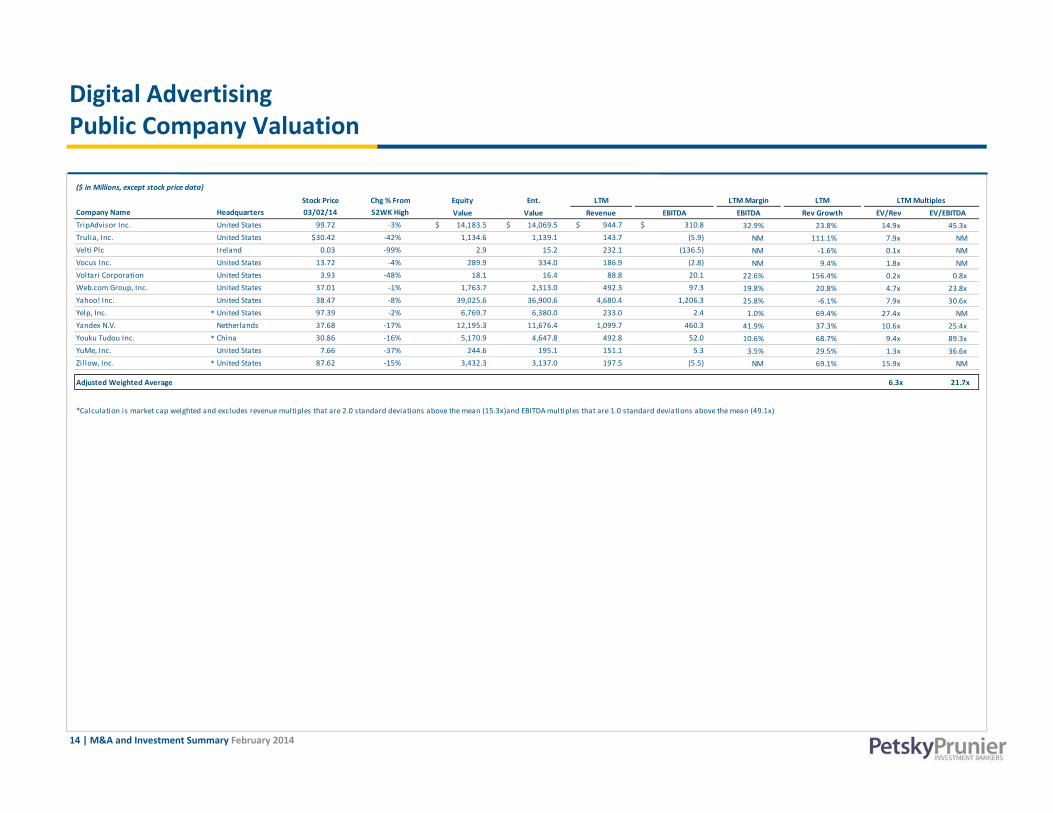
14 | M&A and Investment Summary February 2014
Digital AdvertisingPublic Company Valuation
($ in Millions, except stock price data)
Stock Price Chg % From Equity Ent. LTM LTM Margin LTM LTM Multiples Company Name Headquarters 03/02/14 52WK High Value Value Revenue EBITDA EBITDA Rev Growth EV/Rev EV/EBITDATripAdvisor Inc. United States 99.72 ‐3% $ 14,183.5 $ 14,069.5 $ 944.7 $ 310.8 32.9% 23.8% 14.9x 45.3xTrulia, Inc. United States $30.42 ‐42% 1,134.6 1,139.1 143.7 (5.9) NM 111.1% 7.9x NM Velti Plc Ireland 0.03 ‐99% 2.9 15.2 232.1 (136.5) NM ‐1.6% 0.1x NM Vocus Inc. United States 13.72 ‐4% 289.9 334.0 186.9 (2.8) NM 9.4% 1.8x NM Voltari Corporation United States 3.93 ‐48% 18.1 16.4 88.8 20.1 22.6% 156.4% 0.2x 0.8xWeb.com Group, Inc. United States 37.01 ‐1% 1,763.7 2,313.0 492.3 97.3 19.8% 20.8% 4.7x 23.8xYahoo! Inc. United States 38.47 ‐8% 39,025.6 36,900.6 4,680.4 1,206.3 25.8% ‐6.1% 7.9x 30.6xYelp, Inc. * United States 97.39 ‐2% 6,769.7 6,380.0 233.0 2.4 1.0% 69.4% 27.4x NM Yandex N.V. Netherlands 37.68 ‐17% 12,195.3 11,676.4 1,099.7 460.3 41.9% 37.3% 10.6x 25.4xYouku Tudou Inc. * China 30.86 ‐16% 5,170.9 4,647.8 492.8 52.0 10.6% 68.7% 9.4x 89.3xYuMe, Inc. United States 7.66 ‐37% 244.6 195.1 151.1 5.3 3.5% 29.5% 1.3x 36.6xZil low, Inc. * United States 87.62 ‐15% 3,432.3 3,137.0 197.5 (5.5) NM 69.1% 15.9x NM
Adjusted Weighted Average 6.3x 21.7x
*Calculation is market cap weighted and excludes revenue multiples that are 2.0 standard deviations above the mean (15.3x)and EBITDA multiples that are 1.0 standard deviations above the mean (49.1x)

15 | M&A and Investment Summary February 2014
Marketing Technology
Social Technology was the most active Marketing Technology subsegment with 15 transactions announced, worth $78 million in aggregate reported value. Commerce Management was the highest reported value subsegment with eight deals announced, worth $157 million in aggregate reported value
Select acquisitions:
• Oracle’s acquisition of DMP BlueKai for a reported $400 million
• Rovi Corporation’s $69 million purchase of Veveo, which provides personalized search and discovery solutions for TV providers
• Open Table’s $17 million acquisition of Ness Computing, which provides a personalized restaurant recommendation platform
Select investments:
• TPG Growth’s $125 million investment in Domo, which provides business intelligence tools
# % $MM % # $MM # $MM # $MM
Social Technology 15 15% $78.1 8% 4 $4.7 0 ‐ 11 $73.4
Mobile Technology 13 13% 92.4 10% 4 19.7 0 ‐ 9 72.7
Analytics & Reporting 12 12% 51.6 5% 2 ‐ 0 ‐ 10 51.6
Content Management 12 12% 129.7 14% 6 ‐ 0 ‐ 6 129.7
Commerce Management 8 8% 157.1 17% 3 100.0 0 ‐ 5 57.1
BI Tools 6 6% 134.2 14% 2 4.0 0 ‐ 4 130.2
CRM 5 5% 19.5 2% 2 ‐ 0 ‐ 3 19.5
Other* 26 27% 286.5 30% 11 86.0 0 ‐ 15 200.5
Total 97 100% 949.1 100% 34 214.4 0 0.0 63 734.7
*Other includes MRM/Workflow Management, Online Targeting/Optimization, SEM/SEO Tools, Website Creation/Hosting, Search & Discovery, Data Quality, Market Research Software, Product/Price, SFA/Lead Management
MARKETING TECHNOLOGY TRANSACTIONS BY SEGMENT BUYER/INVESTOR BREAKDOWN
Transactions Reported Value Strategic Buyout Venture/Growth Capital

16 | M&A and Investment Summary February 2014
Marketing TechnologyPublic Company Valuation
($ in Millions, except stock price data)Stock Price Chg % From Equity Ent. LTM LTM Margin LTM LTM Multiples
Company Name Headquarters 03/02/14 52WK High Value Value Revenue EBITDA EBITDA Rev Growth EV/Rev EV/EBITDAAccelrys Inc. * United States $12.49 ‐1% $ 695.3 $ 628.4 $ 168.5 $ 4.5 2.7% 3.7% 3.7x 138.3xActuate Corporation United States 5.67 ‐31% 270.1 191.1 134.5 13.7 10.2% ‐3.1% 1.4x 13.9xAdobe Systems Inc. United States 69.92 0% 34,722.6 33,062.8 4,055.2 770.4 19.0% ‐7.9% 8.2x 42.9xBazaarvoice, Inc. United States 6.99 ‐39% 515.0 440.2 176.1 (35.2) NM 32.1% 2.5x NM Bitauto Holdings Limited China 40.11 ‐1% 1,664.5 1,560.6 213.3 41.7 19.5% 41.0% 7.3x 37.5xBlackbaud Inc. United States 31.85 ‐25% 1,436.6 1,577.6 503.8 99.0 19.7% 12.6% 3.1x 15.9xBrightcove, Inc. United States 10.12 ‐38% 291.2 255.1 109.9 (1.6) NM 24.9% 2.3x NM ChannelAdvisor Corporation United States 44.79 ‐10% 1,089.6 986.7 68.0 (10.6) NM 26.9% 14.5x NM ChinaCache International Holdings China 21.25 ‐11% 497.3 453.7 160.9 0.1 0.1% 28.7% 2.8x NM Constant Contact, Inc. United States 27.95 ‐15% 857.0 733.8 285.4 30.5 10.7% 13.2% 2.6x 24.1xCovisint Corporation United States 10.63 ‐28% 398.5 343.8 98.4 (27.1) NM 13.9% 3.5x NM Cvent, Inc. * United States 39.79 ‐14% 1,613.2 1,455.4 111.1 5.7 5.2% 33.1% 13.1x 253.4xDealertrack Technologies, Inc. United States 54.37 ‐2% 2,400.9 2,438.2 481.5 57.9 12.0% 23.8% 5.1x 42.1xDemandware, Inc. * United States 75.03 ‐2% 2,596.2 2,320.9 103.7 (16.4) NM 30.5% 22.4x NM Digital River Inc. United States 18.06 ‐11% 597.5 293.8 389.7 33.5 8.6% 0.9% 0.8x 8.8xE2open, Inc. United States 28.51 ‐4% 818.8 811.5 69.5 (18.7) NM ‐6.6% 11.7x NM eBay Inc. United States 58.34 ‐2% 75,530.2 70,628.2 16,047.0 4,771.0 29.7% 14.0% 4.4x 14.8xEndurance International Group United States 15.41 ‐6% 1,922.7 2,923.3 520.3 61.5 11.8% 78.1% 5.6x 47.5xInformatica Corporation United States 41.35 ‐6% 4,515.9 3,838.5 948.2 164.1 17.3% 16.8% 4.0x 23.4xInfosystems S.A. Poland 0.86 ‐41% 3.5 2.9 2.8 1.2 41.1% 14.7% 1.0x 2.5xInteractive Intelligence Group Inc. United States 78.07 ‐3% 1,579.0 1,480.9 318.2 28.1 8.8% 34.1% 4.7x 52.7xIBM Corporation United States 185.27 ‐14% 192,929.2 221,731.2 99,751.0 25,019.0 25.1% ‐4.6% 2.2x 8.9xJive Software, Inc. United States 8.42 ‐54% 583.0 483.2 145.8 (59.8) NM 28.2% 3.3x NM LivePerson Inc. * United States 13.34 ‐12% 722.1 630.2 177.8 5.7 3.2% 13.0% 3.5x 110.7xMarin Software Incorporated United States 12.15 ‐39% 396.5 298.3 77.3 (29.6) NM 29.8% 3.9x NM Marketo, Inc. United States 42.06 ‐7% 1,650.9 1,530.1 95.9 (40.5) NM 64.2% 16.0x NM Mercadolibre, Inc. Argentina 94.23 ‐35% 4,160.5 3,961.0 472.6 165.4 35.0% 26.5% 8.4x 23.9xMicroStrategy Inc. United States 134.45 ‐1% 1,519.4 1,162.1 575.9 40.3 7.0% 1.8% 2.0x 28.8xNetSuite Inc. * United States 119.63 ‐1% 8,934.4 8,736.9 414.5 (38.4) NM 34.2% 21.1x NM Nuance Communications, Inc. United States 15.29 ‐35% 4,849.3 6,435.5 1,863.0 209.9 11.3% 6.3% 3.5x 30.7xOpen Text Corporation Canada 50.85 ‐4% 6,150.2 6,181.1 1,372.9 421.8 30.7% 7.6% 4.5x 14.7xOpera Software ASA Norway 13.32 ‐16% 1,761.7 1,596.1 300.1 82.5 27.5% 38.9% 5.3x 19.3xOracle Corporation United States 38.95 0% 175,174.1 162,844.1 37,552.0 16,289.0 43.4% 0.9% 4.3x 10.0xPROS Holdings, Inc. * United States 41.06 ‐1% 1,154.8 1,110.1 144.8 10.0 6.9% 23.0% 7.7x 110.8xPTC Inc. United States 39.87 0% 4,732.7 4,729.4 1,298.7 289.0 22.3% 3.3% 3.6x 16.4xQlik Technologies, Inc. * United States 30.87 ‐18% 2,739.8 2,512.1 470.5 11.7 2.5% 21.1% 5.3x 215.6xRovi Corporation United States 24.99 ‐6% 2,443.5 3,114.6 538.1 181.3 33.7% 2.3% 5.8x 17.2xSage Group plc United Kingdom 7.26 ‐1% 7,964.7 8,567.5 2,305.6 669.0 29.0% 2.7% 3.7x 12.8xSalesforce.com, Inc United States 66.22 0% 39,930.7 40,966.0 4,071.0 83.3 2.0% 33.5% 10.1x NM SAP AG Germany 80.29 ‐10% 95,826.4 97,919.6 23,219.9 7,596.8 32.7% 3.7% 4.2x 12.9x

17 | M&A and Investment Summary February 2014
Marketing TechnologyPublic Company Valuation
($ in Millions, except stock price data)Stock Price Chg % From Equity Ent. LTM LTM Margin LTM LTM Multiples
Company Name Headquarters 03/02/14 52WK High Value Value Revenue EBITDA EBITDA Rev Growth EV/Rev EV/EBITDASizmek Inc. United States 11.51 ‐1% $ 354.5 $ 331.9 $ 161.1 $ 22.9 14.2% 14.6% 2.1x 14.5xSky‐mobi Limited China 6.28 ‐7% 185.8 85.0 84.3 7.2 8.6% ‐16.3% 1.0x 11.8xSungy Mobile Limited China 26.12 ‐8% 845.1 826.0 47.3 14.1 29.8% 0.0% 17.5x 58.7xSynchronoss Technologies, Inc. United States 34.75 ‐12% 1,413.0 1,349.7 349.0 78.5 22.5% 27.5% 3.9x 17.2xTableau Software, Inc. * United States 97.00 ‐5% 6,115.4 5,862.8 232.4 10.5 4.5% 82.0% 25.2x NM Teradata Corporation United States 46.28 ‐30% 7,367.8 6,920.8 2,692.0 714.0 26.5% 1.0% 2.6x 9.7xTIBCO Software Inc. United States 22.03 ‐19% 3,577.0 3,372.1 1,070.0 193.7 18.1% 4.4% 3.2x 17.4xVerint Systems Inc. United States 47.17 ‐4% 2,521.5 2,797.6 880.5 177.0 20.1% 7.0% 3.2x 15.8xVocus Inc. United States 13.72 ‐4% 289.9 334.0 186.9 (2.8) NM 9.4% 1.8x NM Weborama France 15.27 ‐25% 53.3 49.9 38.2 3.9 10.3% 3.8% 1.3x 12.7xWix.com ltd Israel 31.32 ‐4% 1,166.7 1,065.5 80.5 (25.3) NM 84.2% 13.2x NM
Adjusted Weighted Average 4.3x 13.6x
*Calculation is market cap weighted and excludes revenue multiples that are 2.0 standard deviations above the mean (17.8x)and EBITDA multiples that are 1.0 standard deviations above the mean (92.0x)

18 | M&A and Investment Summary February 2014
Agency & Marketing Services
There were 29 transactions announced in the Agency & Marketing Services segment in February. Digital Agency and Branded Communications were the most active subsegments with five and three transactions announced, respectively
Select acquisitions:
• HB Agency’s acquisition of Winans Creative, which provides website branding and designing
• Didit’s acquisition of Public Relations firm LVM Group
• Acosta Sales & Marketing’s purchase of Anderson Daymon Worldwide, a sales and marketing agency
# % $MM % # $MM # $MM # $MM
Digital Agency 5 17% ‐ 0% 5 ‐ 0 ‐ 0 ‐
Branded Communications 3 10% 5.0 40% 3 5.0 0 ‐ 0 ‐
Specialty Agency 3 10% ‐ 0% 3 ‐ 0 ‐ 0 ‐
Database/Analytics 2 7% 7.5 60% 0 ‐ 1 ‐ 1 7.5
Other* 16 55% ‐ 0% 14 ‐ 1 ‐ 1 ‐
Total 29 100% 12.5 0% 25 5.0 2 0.0 2 7.5*Other includes DM Agency, Loyalty/Retention, Media Planning/Buying, B‐to‐B Agency, Channel Services, Design Agency, Experiential Marketing, General Agency, Marketing Consulting, Promotion Agency, Public Relations, Retail Services, and Social Agency
AGENCY & MARKETING SERVICES TRANSACTIONS BY SEGMENT BUYER/INVESTOR BREAKDOWN
Transactions Reported Value Strategic Buyout Venture/Growth Capital

19 | M&A and Investment Summary February 2014
AgencyPublic Company Valuation
($ in Millions, except stock price data)
Stock Price Chg % From Equity Ent. LTM LTM Margin LTM LTM Multiples Company Name Headquarters 03/02/14 52WK High Value Value Revenue EBITDA EBITDA Rev Growth EV/Rev EV/EBITDACello Group Plc United Kingdom $1.39 ‐11% $ 115.6 $ 134.7 $ 241.4 $ 13.9 5.8% 11.9% 0.6x 9.7xCharm Communications Inc. China 4.00 ‐32% 160.1 80.2 168.8 (2.5) NM ‐15.1% 0.5x NM Chime Communications plc * United Kingdom 5.93 ‐6% 575.8 603.4 530.8 15.5 2.9% ‐0.7% 1.1x 38.9xCreston plc United Kingdom 1.88 ‐3% 112.1 109.3 123.5 18.5 15.0% ‐2.5% 0.9x 5.9xDentsu Inc. Japan 37.76 ‐12% 10,889.7 11,131.3 21,467.5 699.4 3.3% 0.0% 0.5x 15.9xEnero Group Limited Austral ia 0.80 ‐5% 68.8 53.3 202.5 3.3 1.7% ‐23.4% 0.3x NM Havas France 8.41 ‐4% 3,391.8 4,038.0 2,466.0 399.4 16.2% 4.5% 1.6x 10.1xHuntsworth plc United Kingdom 1.18 ‐2% 371.3 486.9 291.1 50.7 17.4% ‐1.5% 1.7x 9.6xM&C Saatchi plc United Kingdom 4.96 ‐15% 307.5 278.4 291.2 33.7 11.6% 5.9% 1.0x 8.3xMDC Partners Inc. United States 22.90 ‐13% 1,125.0 1,858.1 1,148.9 108.0 9.4% 7.3% 1.6x 17.2xNext Fifteen Communications Group plc United Kingdom 1.81 ‐7% 109.5 116.2 161.0 16.0 9.9% 4.9% 0.7x 7.3xOmnicom Group Inc. United States 75.28 ‐2% 19,437.7 21,436.2 14,584.5 2,151.5 14.8% 2.6% 1.5x 10.0xOPT, Inc. Japan 9.20 ‐28% 271.1 153.1 662.4 20.4 3.1% ‐14.3% 0.2x 7.5xPorta Communications Plc United Kingdom 0.27 ‐9% 43.5 49.6 25.4 (3.1) NM 531.3% 1.9x NM Publicis Groupe SA France 93.92 ‐3% 19,402.2 18,651.1 9,600.3 1,817.1 18.9% 5.2% 1.9x 10.3xSapient Corp. United States 17.36 ‐3% 2,433.7 2,154.6 1,223.9 158.1 12.9% 12.3% 1.8x 13.6xThe Interpublic Group of Companies, Inc. United States 17.49 ‐2% 7,416.5 7,721.6 7,122.3 816.3 11.5% 2.4% 1.1x 9.5xWPP plc United Kingdom 21.53 ‐8% 28,991.6 33,180.4 18,462.6 3,057.4 16.6% 6.2% 1.8x 10.9x
1.5x 11.1xAdjusted Weighted Average
*Calculation is market cap weighted and excludes revenue multiples that are 2.0 standard deviations above the mean (2.3x)and EBITDA multiples that are 1.0 standard deviations above the mean (20.3x)

20 | M&A and Investment Summary February 2014
Marketing ServicesPublic Company Valuation
($ in Millions, except stock price data)
Stock Price Chg % From Equity Ent. LTM LTM Margin LTM LTM Multiples Company Name Headquarters 03/02/14 52WK High Value Value Revenue EBITDA EBITDA Rev Growth EV/Rev EV/EBITDAAcxiom Corporation United States $37.86 ‐2% $ 2,891.7 $ 2,834.1 $ 1,097.5 $ 182.0 16.6% ‐1.1% 2.6x 15.6xAimia Inc. Canada 16.62 ‐7% 2,874.8 3,135.7 1,510.0 (467.4) NM ‐25.6% 2.1x NM Alliance Data Systems Corporation * United States 284.27 ‐2% 13,847.6 18,956.4 4,319.1 1,315.0 30.4% 18.6% 4.4x 14.4xCSG Systems International Inc. United States 27.72 ‐14% 938.0 992.2 747.5 143.1 19.2% ‐1.2% 1.3x 6.9xData Group Ltd. Canada 0.60 ‐74% 14.2 105.8 290.3 23.7 8.2% ‐5.2% 0.4x 4.5xDST Systems Inc. United States 94.99 ‐1% 3,970.6 4,274.8 2,658.6 454.5 17.1% 3.2% 1.6x 9.4xFair Isaac Corporation United States 53.15 ‐16% 1,855.6 2,237.7 737.8 191.1 25.9% 6.0% 3.0x 11.7xHarte‐Hanks Inc. United States 7.97 ‐21% 498.5 522.8 559.6 61.1 10.9% ‐27.1% 0.9x 8.6xHigh Co. SA France 8.04 ‐3% 83.9 45.1 184.1 15.4 8.4% ‐0.7% 0.2x 2.9xInsignia Systems Inc. United States 3.16 ‐2% 40.3 19.5 27.8 3.5 12.5% 37.6% 0.7x 5.6xMultiplus SA Brazil 11.61 ‐29% 1,882.6 1,465.7 717.2 118.5 16.5% 16.0% 2.0x 12.4xPDI, Inc. United States 5.10 ‐35% 77.3 26.2 150.8 (2.9) NM 18.9% 0.2x NM Pitney Bowes Inc. United States 25.00 ‐4% 5,063.4 7,767.7 3,869.4 824.3 21.3% ‐1.2% 2.0x 9.4xPoints International Ltd. * Canada 29.62 ‐8% 454.3 407.1 174.0 3.3 1.9% 32.2% 2.3x 122.4xVitreous Glass, Inc. Canada 2.53 ‐7% 15.5 15.4 6.2 2.0 33.0% ‐4.6% 2.5x 7.5xViad Corp United States 24.13 ‐17% 490.5 381.6 972.8 68.2 7.0% ‐5.1% 0.4x 5.6x
2.0x 12.3xAdjusted Weighted Average
*Calculation is market cap weighted and excludes revenue multiples that are 2.0 standard deviations above the mean (4.0x)and EBITDA multiples that are 1.0 standard deviations above the mean (47.5x)

21 | M&A and Investment Summary February 2014
Traditional Media
There were 16 transactions announced in the Traditional Media segment in February, all of which were strategic acquisitions, worth a total of $45.4 billion in aggregate reported value
Select acquisitions:
• Comcast’s purchase of Time Warner Cable for approximately $45.2 billion, at a valuation of 3.1x revenue, and 9.0x EBITDA
• Emmis Communications’ $131 million purchase of urban adult contemporary stations WBLS 107.5 and WLIB 1190
• The E.W. Scripps Company’s acquisition of two television stations owned by Granite Broadcasting Corp., WMYD and WKBW for $110 million in cash
• Ubiquity Broadcasting Corporation’s $3 million purchase of video and film production company Stray Angel Films
# % $MM % # $MM # $MM # $MM
Entertainment Media 7 44% $65.3 0% 7 $65.3 0 ‐ 0 ‐
Consumer Magazine Publishing 3 19% 4.1 0% 3 4.1 0 ‐ 0 ‐
Broadcast Television 2 13% 165.0 0% 2 165.0 0 ‐ 0 ‐
B‐to‐B Media 1 6% ‐ 0% 1 ‐ 0 ‐ 0 ‐
Cable & Satellite Television 1 6% 45,000.2 99% 1 45,000.2 0 ‐ 0 ‐
Radio 1 6% 131.0 0% 1 131.0 0 ‐ 0 ‐
Other* 1 6% 0.0 0% 1 ‐ 0 ‐ 0 ‐
Total 16 100% 45,365.6 0% 16 45,365.6 0 0.0 0 0.0
*Other includes Consumer Book Publishing
TRADTIONAL MEDIA TRANSACTIONS BY SEGMENT BUYER/INVESTOR BREAKDOWN
Transactions Reported Value Strategic Buyout Venture/Growth Capital

22 | M&A and Investment Summary February 2014
Traditional Media Public Company Valuation
($ in Millions, except stock price data)
Stock Price Chg % From Equity Ent. LTM LTM Margin LTM LTM Multiples Company Name Headquarters 03/02/14 52WK High Value Value Revenue EBITDA EBITDA Rev Growth EV/Rev EV/EBITDACBS Corporation United States $66.40 ‐1% $ 39,408.1 $ 45,447.1 $ 15,284.0 $ 3,736.0 24.4% 8.5% 3.0x 12.2xDiscovery Communications, Inc. * United States 82.13 ‐10% 28,203.3 34,202.3 5,535.0 2,304.0 41.6% 23.4% 6.2x 14.8xNews Corporation United States 18.02 ‐1% 10,433.9 7,667.9 8,747.0 645.0 7.4% 2.4% 0.9x 11.9xTime Warner Inc. United States 65.77 ‐7% 58,710.3 77,013.3 29,795.0 7,769.0 26.1% 3.7% 2.6x 9.9xTwenty‐First Century Fox, Inc. * United States 33.04 ‐8% 74,656.2 89,455.2 29,789.0 6,104.0 20.5% 40.3% 3.0x 14.7xViacom, Inc. United States 86.86 ‐1% 38,045.2 48,717.2 13,677.0 4,344.0 31.8% 3.2% 3.6x 11.2xThe Walt Disney Company United States 80.48 ‐1% 141,005.7 154,981.7 46,009.0 12,362.0 26.9% 7.4% 3.4x 12.5x
Adjusted Weighted Average 3.3x 11.8x
B‐to‐B Media
Stock Price Chg % From Equity Ent. LTM LTM Margin LTM LTM Multiples Company Name Headquarters 03/02/14 52WK High Value Value Revenue EBITDA EBITDA Rev Growth EV/Rev EV/EBITDAEuromoney Institutional Investor PLC United Kingdom $22.07 ‐5% $ 2,795.8 $ 2,826.3 $ 678.1 $ 206.3 30.4% 2.7% 4.2x 13.7xGlobal Sources Ltd. Hong Kong 6.80 ‐18% 233.9 100.1 198.1 42.0 21.2% ‐14.6% 0.5x 2.4xInforma plc Switzerland 8.66 ‐10% 5,231.1 6,543.3 1,897.3 616.6 32.5% ‐8.1% 3.4x 10.6xTechTarget, Inc. * United States 7.00 ‐6% 222.1 179.9 88.5 3.6 4.1% ‐11.5% 2.0x 49.6xThe Dolan Company United States 0.13 ‐96% 4.0 129.4 255.4 33.2 13.0% 38.9% 0.5x 3.9xUBM plc United Kingdom 11.73 ‐8% 2,847.4 3,692.3 1,326.5 307.1 23.2% 12.2% 2.8x 12.0x
Adjusted Weighted Average 3.4x 11.6x
Radio Broadcasting
Stock Price Chg % From Equity Ent. LTM LTM Margin LTM LTM Multiples Company Name Headquarters 03/02/14 52WK High Value Value Revenue EBITDA EBITDA Rev Growth EV/Rev EV/EBITDABeasley Broadcast Group Inc. United States $9.03 ‐10% $ 208.0 $ 300.5 $ 104.9 $ 29.1 27.7% 4.7% 2.9x 10.3xCC Media Holdings, Inc. United States 7.00 ‐13% 615.6 20,632.1 6,243.0 1,783.5 28.6% ‐0.1% 3.3x 11.6xCumulus Media Inc. United States 6.53 ‐20% 1,339.9 3,967.3 1,087.8 352.9 32.4% 1.3% 3.6x 11.2xEmmis Communications Corp. United States 3.24 ‐12% 135.1 310.9 201.5 35.7 17.7% 8.7% 1.5x 8.7xEntercom Communications Corp. United States 9.74 ‐15% 377.4 896.5 377.6 100.9 26.7% ‐2.9% 2.4x 8.9xJournal Communications Inc. United States 9.14 ‐6% 465.8 685.2 418.1 87.1 20.8% 12.8% 1.6x 7.9xRadio One Inc. United States 5.02 ‐14% 237.9 1,223.5 448.7 135.9 30.3% 5.7% 2.7x 9.0xSalem Communications Corp. United States 8.93 ‐12% 222.5 506.9 236.9 50.9 21.5% 3.4% 2.1x 10.0xSirius XM Holdings Inc. * United States 3.61 ‐14% 22,010.7 25,473.9 3,799.1 1,300.5 34.2% 11.7% 6.7x 19.6xSpanish Broadcasting System Inc. United States 4.50 ‐9% 32.7 369.1 153.2 47.3 30.9% 8.8% 2.4x 7.8xPandora Media, Inc. * United States 38.49 ‐3% 7,598.8 7,254.4 588.3 (42.0) NM 53.5% 12.3x NM
Adjusted Weighted Average 6.2x 10.2x
*Calculation is market cap weighted and excludes revenue multiples that are 2.0 standard deviations above the mean (10.1x)and EBITDA multiples that are 1.0 standard deviations above the mean (13.9x)
Large Cap Diversified Media
*Calculation is market cap weighted and excludes revenue multiples that are 2.0 standard deviations above the mean (6.4x)and EBITDA multiples that are 1.0 standard deviations above the mean (14.2x)
*Calculation is market cap weighted and excludes revenue multiples that are 2.0 standard deviations above the mean (5.3x)and EBITDA multiples that are 1.0 standard deviations above the mean (32.8x)

23 | M&A and Investment Summary February 2014
Traditional Media Public Company Valuation
($ in Millions, except stock price data)
Broadcast, Cable, and Satellite Television
Stock Price Chg % From Equity Ent. LTM LTM Margin LTM LTM Multiples Company Name Headquarters 03/02/14 52WK High Value Value Revenue EBITDA EBITDA Rev Growth EV/Rev EV/EBITDAAMC Networks Inc. * United States $73.75 ‐1% $ 5,332.0 $ 7,007.0 $ 1,591.9 $ 511.3 32.1% 17.7% 4.4x 13.7xBritish Sky Broadcasting Group plc United Kingdom 15.74 ‐1% 24,475.7 27,112.8 12,497.3 2,645.6 21.2% 7.2% 2.2x 10.2xCablevision Systems Corporation United States 17.41 ‐14% 4,659.6 13,743.5 6,232.2 1,597.6 25.6% ‐7.1% 2.2x 8.6xCBS Corporation United States 66.40 ‐1% 39,408.1 45,447.1 15,284.0 3,736.0 24.4% 8.5% 3.0x 12.2xCharter Communications, Inc. United States 124.14 ‐14% 13,176.7 27,358.7 8,155.0 2,810.0 34.5% 8.7% 3.4x 9.7xComcast Corporation United States 51.08 ‐8% 132,266.5 176,143.5 64,657.0 21,434.0 33.2% 3.3% 2.7x 8.2xCrown Media Holdings Inc. United States 3.34 ‐8% 1,201.3 1,601.8 377.8 287.2 76.0% 8.0% 4.2x 5.6xDIRECTV United States 76.12 0% 38,781.1 56,517.1 31,754.0 7,806.0 24.6% 6.8% 1.8x 7.2xDiscovery Communications, Inc. * United States 82.13 ‐10% 28,203.3 34,202.3 5,535.0 2,304.0 41.6% 23.4% 6.2x 14.8xDish Network Corp. United States 57.24 ‐5% 26,235.6 30,167.0 13,904.9 2,884.8 20.7% 5.5% 2.2x 10.5xEntravision Communications Corporation United States 6.03 ‐17% 531.0 851.2 223.9 69.5 31.0% 0.3% 3.8x 12.2xGeneral Communication Inc. United States 10.39 ‐12% 420.7 1,759.4 780.0 245.2 31.4% 12.2% 2.3x 7.2xGray Television Inc. United States 11.68 ‐23% 677.4 1,467.1 377.3 143.4 38.0% 4.0% 3.9x 10.2xGrupo Televisa, S.A.B. Mexico 28.78 ‐10% 14,815.3 19,027.7 5,570.6 2,175.8 39.1% 6.5% 3.4x 8.7xJournal Communications Inc. United States 9.14 ‐6% 465.8 685.2 418.1 87.1 20.8% 12.8% 1.6x 7.9xLiberty Global plc United Kingdom 85.35 ‐6% 33,324.7 77,513.0 14,474.2 6,447.0 44.5% 45.8% 5.4x 12.0xLIN Media LLC United States 22.28 ‐24% 1,222.8 2,167.8 652.4 197.4 30.3% 17.9% 3.3x 11.0xNexstar Broadcasting Group, Inc. * United States 42.10 ‐25% 1,280.1 2,267.0 502.3 168.1 33.5% 32.7% 4.5x 13.5xScripps Networks Interactive, Inc. United States 80.96 ‐7% 11,837.1 12,988.1 2,530.8 1,102.5 43.6% 9.7% 5.1x 11.8xSinclair Broadcast Group Inc. United States 28.32 ‐24% 2,837.7 5,091.3 1,363.1 455.2 33.4% 28.4% 3.7x 11.2xThe E. W. Scripps Company United States 19.59 ‐11% 1,091.0 1,075.2 855.8 96.8 11.3% 1.7% 1.3x 11.1xTime Warner Inc. United States 65.77 ‐7% 58,710.3 77,013.3 29,795.0 7,769.0 26.1% 3.7% 2.6x 9.9xZiggo N.V. Netherlands 45.46 ‐3% 9,092.1 13,269.8 2,160.6 1,191.9 55.2% 1.8% 6.1x 11.1x
Adjusted Weighted Average 3.2x 9.6x
Entertainment Media
Stock Price Chg % From Equity Ent. LTM LTM Margin LTM LTM Multiples Company Name Headquarters 03/02/14 52WK High Value Value Revenue EBITDA EBITDA Rev Growth EV/Rev EV/EBITDADreamWorks Animation SKG Inc. * United States $30.01 ‐17% $ 2,537.9 $ 2,743.6 $ 706.9 $ 91.3 12.9% ‐5.7% 3.9x 30.1xEros International Plc United Kingdom 12.15 ‐2% 596.3 772.6 224.3 61.6 27.5% 10.3% 3.4x 12.5xLions Gate Entertainment Corp. United States 30.79 ‐19% 4,249.7 5,429.3 2,694.1 305.4 11.3% 4.9% 2.0x 17.8xLive Nation Entertainment, Inc. United States 23.02 ‐7% 4,606.3 5,357.6 6,478.5 492.1 7.6% 11.3% 0.8x 10.9xSFX Entertainment Inc. United States 8.45 ‐37% 745.8 824.3 100.8 (60.5) NM 0.0% 8.2x NM Twenty‐First Century Fox, Inc. United States 33.04 ‐8% 74,656.2 89,455.2 29,789.0 6,104.0 20.5% 40.3% 3.0x 14.7xLiberty Media Corporation United States 136.10 ‐15% 15,543.1 28,813.1 4,652.0 1,234.0 26.5% 258.7% 6.2x 23.3xVillage Roadshow Limited Austral ia 6.68 ‐7% 1,066.1 1,387.3 814.7 133.1 16.3% ‐1.1% 1.7x 10.4xWorld Wrestling Entertainment Inc. * United States 22.74 ‐9% 1,708.9 1,629.1 508.0 42.0 8.3% 4.9% 3.2x 38.8x
Adjusted Weighted Average 3.4x 15.9x
*Calculation is market cap weighted and excludes revenue multiples that are 2.0 standard deviations above the mean (8.2x)and EBITDA multiples that are 1.0 standard deviations above the mean (30.0x)
*Calculation is market cap weighted and excludes revenue multiples that are 2.0 standard deviations above the mean (6.2x)and EBITDA multiples that are 1.0 standard deviations above the mean (12.7x)

24 | M&A and Investment Summary February 2014
Traditional Media Public Company Valuation
($ in Millions, except stock price data)
Out‐of‐Home Media
Stock Price Chg % From Equity Ent. LTM LTM Margin LTM LTM Multiples Company Name Headquarters 03/02/14 52WK High Value Value Revenue EBITDA EBITDA Rev Growth EV/Rev EV/EBITDAAirMedia Group Inc. China $2.33 ‐27% $ 139.4 $ 36.0 $ 277.7 $ 13.6 4.9% ‐3.9% 0.1x 2.7xAPG|SGA SA Switzerland 300.48 ‐2% 884.7 823.8 364.6 151.7 41.6% ‐1.2% 2.3x 5.4xClear Channel Outdoor Holdings Inc. United States 10.00 ‐6% 3,592.8 8,411.9 2,946.2 719.9 24.4% 0.0% 2.9x 11.7xClear Media Ltd. Hong Kong 0.98 ‐2% 525.3 417.7 212.3 85.3 40.2% 8.2% 2.0x 4.9xJCDecaux SA France 43.87 ‐3% 9,748.1 9,825.8 3,653.6 766.2 21.0% 4.5% 2.7x 12.8xLamar Advertising Co. United States 51.62 ‐3% 4,895.5 6,855.6 1,245.8 527.4 42.3% 5.3% 5.5x 13.0xMood Media Corporation Canada 0.79 ‐55% 136.3 660.3 513.0 94.5 18.4% 28.4% 1.3x 7.0xNational CineMedia, Inc. United States 15.62 ‐23% 958.8 1,931.0 462.8 222.5 48.1% 3.1% 4.2x 8.7xNTN Buzztime Inc. * United States 0.60 ‐40% 46.3 44.2 23.1 1.9 8.3% ‐4.7% 1.9x 23.0xTom Group Ltd. Hong Kong 0.26 ‐28% 1,027.6 1,277.1 248.4 (1.3) NM ‐12.6% 5.1x NM Vitreous Glass, Inc. Canada 2.53 ‐7% 15.5 15.4 6.2 2.0 33.0% ‐4.6% 2.5x 7.5x
Adjusted Weighted Average 3.5x 11.9x
Publishing
Stock Price Chg % From Equity Ent. LTM LTM Margin LTM LTM Multiples Company Name Headquarters 03/02/14 52WK High Value Value Revenue EBITDA EBITDA Rev Growth EV/Rev EV/EBITDAA. H. Belo Corporation United States $10.50 ‐2% $ 229.6 $ 147.4 $ 366.3 $ 29.6 8.1% ‐16.8% 0.4x 5.0xDaily Mail and General Trust plc United Kingdom 17.51 ‐3% 6,190.7 7,366.9 2,936.4 504.5 17.2% 0.3% 2.5x 14.6xEmmis Communications Corp. United States 3.24 ‐12% 135.1 310.9 201.5 35.7 17.7% 8.7% 1.5x 8.7xGannett Co., Inc. United States 29.31 ‐4% 6,664.1 8,076.3 5,161.4 1,044.9 20.2% ‐3.6% 1.6x 7.7xGlacier Media, Inc. Canada 1.21 ‐39% 107.9 251.5 297.4 39.4 13.2% 12.5% 0.8x 6.4xJohn Wiley & Sons Inc. United States 56.95 ‐1% 3,354.3 3,853.5 1,778.5 324.9 18.3% 1.7% 2.2x 11.9xJournal Communications Inc. United States 9.14 ‐6% 465.8 685.2 418.1 87.1 20.8% 12.8% 1.6x 7.9xMartha Stewart Living Omnimedia Inc. * United States 5.46 0% 309.1 267.9 160.7 2.7 1.7% ‐18.7% 1.7x 97.9xMeredith Corporation United States 46.04 ‐14% 2,046.3 2,360.5 1,467.1 251.2 17.1% 2.2% 1.6x 9.4x
Reed Elsevier plc(1) * United Kingdom 15.47 ‐2% 17,979.9 40,233.1 9,944.2 3,154.3 31.7% 0.0% 4.0x 12.8xScholastic Corporation United States 34.87 0% 1,109.2 1,059.6 1,785.0 165.3 9.3% ‐12.6% 0.6x 6.4xThe E. W. Scripps Company United States 19.59 ‐11% 1,091.0 1,075.2 855.8 96.8 11.3% 1.7% 1.3x 11.1xThe McClatchy Company United States 5.27 ‐1% 455.0 1,971.0 1,242.2 264.1 21.3% ‐5.1% 1.6x 7.5xThe New York Times Company United States 15.83 ‐2% 2,370.7 2,284.0 1,577.2 251.9 16.0% ‐20.7% 1.4x 9.1x
Adjusted Weighted Average 1.8x 11.4x
*Calculation is market cap weighted and excludes revenue multiples that are 2.0 standard deviations above the mean (3.4x)and EBITDA multiples that are 1.0 standard deviations above the mean (39.3x)
(1) All financials are representative of the Reed Elsevier combined businesses, except per stock data, which represents Reed Elsevier (LSE:REL)
*Calculation is market cap weighted and excludes revenue multiples that are 2.0 standard deviations above the mean (6.0x)and EBITDA multiples that are 1.0 standard deviations above the mean (15.5x)

25 | M&A and Investment Summary February 2014
# % $MM % # $MM # $MM # $MM
Financial Technology 10 21% $213.3 25% 5 $163.0 0 ‐ 5 $50.3
Big Data Technology 7 15% 20.1 2% 2 ‐ 0 ‐ 5 20.1
Communications Software 7 15% 16.9 2% 5 ‐ 0 ‐ 2 16.9
Cloud Computing Technology 5 10% 62.4 7% 4 60.0 0 ‐ 1 2.4
Networking Equipment 4 8% 4.2 0% 1 ‐ 0 ‐ 3 4.2
Enterprise Mobility 3 6% 14.7 2% 3 14.7 0 ‐ 0 ‐
Virtualization Technology 3 6% 25.5 3% 1 9.7 0 ‐ 2 15.8
Cloud Storage 2 4% 350.0 40% 1 ‐ 0 ‐ 1 350.0
Other* 9 19% 508.4 59% 4 65.5 0 ‐ 5 442.9
Total 48 100% 865.5 100% 25 312.9 0 0.0 23 552.6
*Other includes Communications Equipment, Data Center Technology, VoIP Equipment & Software, and Software‐Defined Networking
TECHNOLOGY & COMMUNICATIONS TRANSACTIONS BY SEGMENT BUYER/INVESTOR BREAKDOWN
Transactions Reported Value Strategic Buyout Venture/Growth Capital
Technology & Communications
Of the $866 million in reported transaction value in the Technology & Communications segment, $553 million were made in Venture/Growth Capital investments
Activity in the segment was led by the Financial Technology subsegment with 10 deals announced, of which seven were reported at $213 million
Select acquisitions:
• Perficient‘s $46 million purchase of ForwardThink Group, a provider of financial technology consulting and software development services, at a valuation of 1.5x revenue.
• ClickSoftware Technologies $14.7 million acquisition of Xora, which provides mobile workforce management SaaS for businesses
• J2 Global Communications’ acquisition of Faxmate and Ozefax, which are providers of subscription‐based online faxing services for consumers and businesses

26 | M&A and Investment Summary February 2014
TechnologyPublic Company Valuation
($ in Millions, except stock price data)
Stock Price Chg % From Equity Ent. LTM LTM Margin LTM LTM Multiples Company Name Headquarters 03/02/14 52WK High Value Value Revenue EBITDA EBITDA Rev Growth EV/Rev EV/EBITDA3M Company United States $134.34 ‐4% $ 89,026.0 $ 92,202.0 $ 30,871.0 $ 8,037.0 26.0% 3.2% 3.0x 11.5xACI Worldwide, Inc. United States 59.66 ‐10% 2,299.7 2,960.0 864.9 193.0 22.3% 29.8% 3.4x 15.3xADATA Technology Co., Ltd. Taiwan 2.41 ‐22% 548.7 695.5 1,062.8 87.8 8.3% 9.3% 0.7x 7.9xAdvanced Micro Devices, Inc. United States 3.71 ‐20% 2,693.9 3,654.9 5,299.0 308.0 5.8% ‐2.3% 0.7x 11.9xAkamai Technologies, Inc. United States 62.74 ‐1% 11,230.5 10,556.6 1,577.9 592.2 37.5% 14.8% 6.7x 17.8xAVG Technologies N.V. Netherlands 19.15 ‐28% 1,042.6 1,030.2 407.1 135.0 33.2% 14.4% 2.5x 7.6xBrightcove, Inc. United States 10.12 ‐38% 291.2 255.1 109.9 (1.6) NM 24.9% 2.3x NM CA Technologies United States 33.39 ‐8% 14,951.0 13,868.0 4,582.0 1,566.0 34.2% ‐2.1% 3.0x 8.9xCarbonite, Inc. * United States 10.27 ‐38% 271.6 206.2 107.2 4.0 3.7% 27.5% 1.9x 51.8xCDW Corporation United States 25.54 0% 4,391.8 7,711.5 10,768.6 710.5 6.6% 6.3% 0.7x 10.9xCheck Point Software Technologies Ltd. Israel 68.08 ‐1% 13,091.8 11,925.0 1,394.1 771.9 55.4% 3.8% 8.6x 15.4xChinaCache International Holdings Ltd. China 21.25 ‐11% 497.3 453.7 160.9 0.1 0.1% 28.7% 2.8x NM Citrix Systems, Inc. United States 60.92 ‐21% 11,194.2 10,459.5 2,918.4 648.8 22.2% 12.8% 3.6x 16.1xCommVault Systems, Inc. United States 69.52 ‐23% 3,301.9 2,801.3 567.8 103.4 18.2% 20.4% 4.9x 27.1xCray Inc. United States 36.06 ‐14% 1,379.2 1,172.5 525.7 35.9 6.8% 24.9% 2.2x 32.7xCrossroads Systems, Inc. United States 2.30 ‐33% 29.6 36.8 12.6 (11.9) NM ‐9.8% 2.9x NM Datalink Corporation United States 14.86 ‐3% 338.6 282.5 594.2 26.9 4.5% 21.0% 0.5x 10.5xDot Hil l Systems Corp. * United States 5.38 ‐5% 317.4 279.9 191.8 2.7 1.4% ‐2.9% 1.5x 102.8xElecom Co., Ltd. Japan 15.57 ‐3% 342.8 225.2 629.5 80.2 12.7% 0.6% 0.4x 2.8xEMC Corporation United States 26.47 ‐3% 53,618.5 51,598.5 23,222.0 5,612.0 24.2% 6.9% 2.2x 9.2xePlus inc. United States 56.23 ‐16% 453.4 551.1 1,033.9 77.9 7.5% 7.1% 0.5x 7.1xEuronet Worldwide Inc. United States 38.48 ‐23% 1,950.8 1,959.5 1,413.1 182.6 12.9% 11.5% 1.4x 10.7xF‐Secure Oyj Finland 3.09 ‐6% 481.8 415.6 214.2 49.8 23.3% ‐1.3% 1.9x 8.3xFusion‐io, Inc. United States 11.46 ‐43% 1,222.0 978.1 374.5 (70.8) NM ‐14.8% 2.6x NM Gemalto NV Netherlands 112.25 ‐11% 9,667.0 9,292.1 3,257.2 516.6 15.9% 11.9% 2.9x 18.0xGoogle Inc. United States 1,219.21 ‐1% 409,716.5 358,801.5 59,825.0 18,028.0 30.1% 19.2% 6.0x 19.9xGreen Dot Corporation United States 20.33 ‐24% 767.0 277.3 582.3 76.2 13.1% 5.0% 0.5x 3.6xImperva Inc. United States 62.68 ‐2% 1,583.7 1,466.0 137.8 (22.4) NM 32.2% 10.6x NM Integrated Electrical Services, Inc. United States 5.31 ‐24% 95.1 90.7 487.4 4.3 0.9% 2.7% 0.2x 21.2xIntel Corporation United States 24.76 ‐9% 123,106.7 116,556.7 52,708.0 20,563.0 39.0% ‐1.2% 2.2x 5.7xIBM Corporation United States 185.27 ‐14% 192,929.2 221,731.2 99,751.0 25,019.0 25.1% ‐4.6% 2.2x 8.9xInterxion Holding NV Netherlands 24.78 ‐11% 1,705.1 2,084.8 416.8 168.8 40.5% 12.4% 5.0x 12.4xJ‐Stream Inc. Japan 4.51 ‐49% 52.4 37.4 44.3 4.0 9.1% ‐15.3% 0.8x 9.3xLimelight Networks, Inc. United States 2.22 ‐13% 217.2 99.6 173.4 (10.3) NM ‐3.8% 0.6x NM LogMeIn, Inc. * United States 42.25 ‐1% 1,023.3 833.8 166.3 7.5 4.5% 19.8% 5.0x 111.7xLSI Corporation United States 11.07 0% 6,180.7 5,370.9 2,370.2 446.0 18.8% ‐5.4% 2.3x 12.0xMelbourne IT Ltd. Australia 1.23 ‐44% 103.2 18.1 92.4 8.4 9.1% ‐39.4% 0.2x 2.1xMicron Technology Inc. United States 24.19 ‐6% 25,662.7 28,522.7 11,281.0 3,109.0 27.6% 41.4% 2.5x 9.2xMicrosoft Corporation United States 37.86 ‐3% 314,265.4 254,968.4 83,433.0 31,828.0 38.1% 14.4% 3.1x 8.0xMontage Technology Group Limited China 16.00 ‐40% 440.0 332.3 110.9 29.6 26.7% 41.7% 3.0x 11.2xNEC Corporation Japan 3.42 ‐2% 8,883.0 14,889.5 29,243.1 1,657.1 5.7% ‐3.5% 0.5x 9.0x
27 | M&A and Investment Summary February 2014
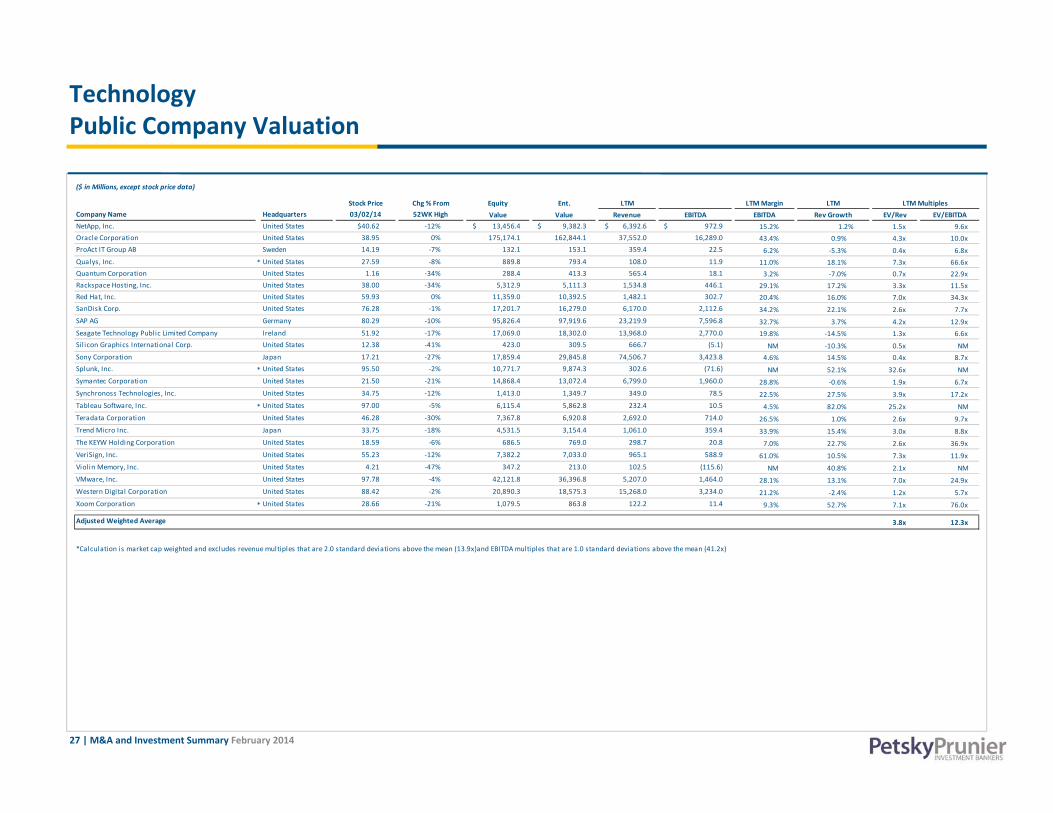
TechnologyPublic Company Valuation
($ in Millions, except stock price data)
Stock Price Chg % From Equity Ent. LTM LTM Margin LTM LTM Multiples Company Name Headquarters 03/02/14 52WK High Value Value Revenue EBITDA EBITDA Rev Growth EV/Rev EV/EBITDANetApp, Inc. United States $40.62 ‐12% $ 13,456.4 $ 9,382.3 $ 6,392.6 $ 972.9 15.2% 1.2% 1.5x 9.6xOracle Corporation United States 38.95 0% 175,174.1 162,844.1 37,552.0 16,289.0 43.4% 0.9% 4.3x 10.0xProAct IT Group AB Sweden 14.19 ‐7% 132.1 153.1 359.4 22.5 6.2% ‐5.3% 0.4x 6.8xQualys, Inc. * United States 27.59 ‐8% 889.8 793.4 108.0 11.9 11.0% 18.1% 7.3x 66.6xQuantum Corporation United States 1.16 ‐34% 288.4 413.3 565.4 18.1 3.2% ‐7.0% 0.7x 22.9xRackspace Hosting, Inc. United States 38.00 ‐34% 5,312.9 5,111.3 1,534.8 446.1 29.1% 17.2% 3.3x 11.5xRed Hat, Inc. United States 59.93 0% 11,359.0 10,392.5 1,482.1 302.7 20.4% 16.0% 7.0x 34.3xSanDisk Corp. United States 76.28 ‐1% 17,201.7 16,279.0 6,170.0 2,112.6 34.2% 22.1% 2.6x 7.7xSAP AG Germany 80.29 ‐10% 95,826.4 97,919.6 23,219.9 7,596.8 32.7% 3.7% 4.2x 12.9xSeagate Technology Public Limited Company Ireland 51.92 ‐17% 17,069.0 18,302.0 13,968.0 2,770.0 19.8% ‐14.5% 1.3x 6.6xSil icon Graphics International Corp. United States 12.38 ‐41% 423.0 309.5 666.7 (5.1) NM ‐10.3% 0.5x NM Sony Corporation Japan 17.21 ‐27% 17,859.4 29,845.8 74,506.7 3,423.8 4.6% 14.5% 0.4x 8.7xSplunk, Inc. * United States 95.50 ‐2% 10,771.7 9,874.3 302.6 (71.6) NM 52.1% 32.6x NM Symantec Corporation United States 21.50 ‐21% 14,868.4 13,072.4 6,799.0 1,960.0 28.8% ‐0.6% 1.9x 6.7xSynchronoss Technologies, Inc. United States 34.75 ‐12% 1,413.0 1,349.7 349.0 78.5 22.5% 27.5% 3.9x 17.2xTableau Software, Inc. * United States 97.00 ‐5% 6,115.4 5,862.8 232.4 10.5 4.5% 82.0% 25.2x NM Teradata Corporation United States 46.28 ‐30% 7,367.8 6,920.8 2,692.0 714.0 26.5% 1.0% 2.6x 9.7xTrend Micro Inc. Japan 33.75 ‐18% 4,531.5 3,154.4 1,061.0 359.4 33.9% 15.4% 3.0x 8.8xThe KEYW Holding Corporation United States 18.59 ‐6% 686.5 769.0 298.7 20.8 7.0% 22.7% 2.6x 36.9xVeriSign, Inc. United States 55.23 ‐12% 7,382.2 7,033.0 965.1 588.9 61.0% 10.5% 7.3x 11.9xViolin Memory, Inc. United States 4.21 ‐47% 347.2 213.0 102.5 (115.6) NM 40.8% 2.1x NM VMware, Inc. United States 97.78 ‐4% 42,121.8 36,396.8 5,207.0 1,464.0 28.1% 13.1% 7.0x 24.9xWestern Digital Corporation United States 88.42 ‐2% 20,890.3 18,575.3 15,268.0 3,234.0 21.2% ‐2.4% 1.2x 5.7xXoom Corporation * United States 28.66 ‐21% 1,079.5 863.8 122.2 11.4 9.3% 52.7% 7.1x 76.0x
3.8x 12.3xAdjusted Weighted Average
*Calculation is market cap weighted and excludes revenue multiples that are 2.0 standard deviations above the mean (13.9x)and EBITDA multiples that are 1.0 standard deviations above the mean (41.2x)

28 | M&A and Investment Summary February 2014
CommunicationsPublic Company Valuation
($ in Millions, except stock price data)
Stock Price Chg % From Equity Ent. LTM LTM Margin LTM LTM Multiples Company Name Headquarters 03/02/14 52WK High Value Value Revenue EBITDA EBITDA Rev Growth EV/Rev EV/EBITDAAastra Technologies Ltd. Canada $37.84 ‐12% $ 450.7 $ 373.1 $ 540.6 $ 40.6 7.5% ‐5.1% 0.7x 9.2xADTRAN Inc. United States 26.39 ‐6% 1,494.8 1,377.0 641.7 63.1 9.8% 3.4% 2.1x 21.8xAlcatel‐Lucent France 4.35 ‐9% 11,996.8 12,738.3 19,932.3 1,332.4 6.7% ‐0.1% 0.6x 9.6xAllot Communications Ltd. Israel 17.13 ‐5% 557.9 436.3 96.5 (1.7) NM ‐7.8% 4.5x NM Ambient Corporation United States 1.90 ‐54% 31.8 27.2 20.0 (12.9) NM ‐60.4% 1.4x NM Aruba Networks, Inc. * United States 20.89 ‐20% 2,279.9 2,001.6 637.5 9.2 1.4% 11.6% 3.1x 218.1xAudioCodes Ltd. Israel 9.09 0% 350.5 309.7 137.2 5.8 4.2% 7.6% 2.3x 53.5xAviat Networks, Inc. United States 1.99 ‐46% 123.7 65.0 406.5 (13.7) NM ‐13.8% 0.2x NM Axesstel Inc. United States 0.15 ‐91% 3.7 12.4 27.4 (6.1) NM ‐54.9% 0.5x NM BlackBerry Limited Canada 10.54 ‐32% 5,466.1 3,489.9 8,514.0 (2,037.0) NM ‐32.3% 0.4x NM Barracuda Networks, Inc. * United States 37.51 ‐9% 1,907.9 1,791.3 225.9 (0.1) NM 0.0% 7.9x NM Blonder Tongue Laboratories Inc. United States 1.05 ‐24% 6.5 11.9 28.4 (1.1) NM ‐3.3% 0.4x NM BroadSoft, Inc. United States 30.88 ‐19% 872.1 804.6 178.5 (0.0) NM 8.3% 4.5x NM Brocade Communications Systems, Inc. United States 9.71 ‐2% 4,215.8 3,815.8 2,198.7 537.0 24.4% ‐3.0% 1.7x 7.1xCalAmp Corp. United States 32.67 ‐3% 1,127.5 1,098.7 224.4 24.0 10.7% 32.2% 4.9x 45.8xCalix Inc. United States 8.06 ‐42% 404.8 322.1 382.6 10.3 2.7% 15.9% 0.8x 31.3xCiena Corporation United States 25.12 ‐10% 2,605.1 3,345.7 2,082.5 132.4 6.4% 13.6% 1.6x 25.3xCisco Systems, Inc. United States 21.92 ‐17% 112,916.1 83,023.1 47,873.0 12,980.0 27.1% 1.3% 1.7x 6.4xClearfield, Inc. United States 23.45 ‐12% 304.6 283.5 59.2 10.1 17.1% 53.6% 4.8x 28.0xClearOne, Inc. United States 11.56 ‐19% 103.8 83.5 49.6 8.3 16.7% 6.8% 1.7x 10.1xCOM DEV International Ltd. Canada 3.60 ‐9% 275.7 268.5 194.4 36.4 18.7% 3.3% 1.4x 7.4xCommScope Holding Company, Inc. United States 23.63 ‐3% 4,392.6 6,560.8 3,480.1 654.7 18.8% 4.8% 1.9x 10.0xCommunications Systems Inc. United States 13.02 ‐1% 111.3 96.4 129.8 9.4 7.3% 25.0% 0.7x 10.2xCorning Inc. United States 19.34 ‐1% 26,923.7 25,058.7 7,819.0 2,459.0 31.4% ‐2.4% 3.2x 10.2xCTX Virtual Technologies, Inc. United States 1.85 ‐26% 14.8 14.9 119.2 16.9 14.2% 198.1% 0.1x 0.9xCyan, Inc. United States 3.46 ‐77% 160.7 101.5 116.6 (34.9) NM 21.6% 0.9x NM DDS Wireless International Inc. Canada 1.64 ‐26% 22.3 13.5 33.8 2.1 6.3% ‐9.0% 0.4x 6.3xDigi International Inc. United States 9.81 ‐23% 253.9 156.0 195.7 16.8 8.6% 2.5% 0.8x 9.3xDragonWave Inc. Canada 1.43 ‐57% 81.7 75.2 100.4 (41.8) NM ‐4.1% 0.7x NM EchoStar Corp. United States 49.85 ‐4% 4,513.6 5,324.2 3,282.5 647.4 19.7% 5.1% 1.6x 8.2xEmulex Corporation United States 7.38 ‐18% 596.8 541.8 475.0 48.0 10.1% ‐4.3% 1.1x 11.3xEricsson Sweden 13.01 ‐8% 41,871.4 34,664.4 35,457.9 4,999.2 14.1% ‐0.2% 1.0x 6.9xExtreme Networks Inc. United States 5.89 ‐28% 564.7 551.8 370.2 18.7 5.1% 18.4% 1.5x 29.5xF5 Networks, Inc. United States 114.51 0% 8,639.0 8,060.8 1,522.3 469.3 30.8% 7.2% 5.3x 17.2xFinisar Corp. United States 23.93 ‐10% 2,300.4 2,034.3 1,038.6 130.8 12.6% 11.0% 2.0x 15.6xFleetmatics Group PLC Ireland 37.15 ‐29% 1,369.2 1,255.8 177.4 45.1 25.5% 39.2% 7.1x 27.8xFranklin Wireless Corp. United States 1.75 ‐15% 18.2 8.4 23.2 (0.1) NM ‐36.6% 0.4x NM Gigamon Inc. United States 32.06 ‐23% 996.6 858.5 140.3 (27.4) NM 45.1% 6.1x NM Gogo Inc. * United States 21.30 ‐40% 1,791.3 1,754.4 299.1 11.6 3.9% 38.2% 5.9x 151.9xHarmonic Inc. United States 6.51 ‐21% 647.2 476.6 461.9 23.2 5.0% ‐12.9% 1.0x 20.6xHarris Corporation United States 74.07 0% 7,910.5 9,251.2 4,978.4 1,085.0 21.8% ‐7.0% 1.9x 8.5xInfoblox Inc. * United States 23.96 ‐51% 1,288.4 1,037.5 245.5 3.1 1.3% 27.6% 4.2x 332.5xInteractive Intell igence Group Inc. United States 78.07 ‐3% 1,579.0 1,480.9 318.2 28.1 8.8% 34.1% 4.7x 52.7x

29 | M&A and Investment Summary February 2014
CommunicationsPublic Company Valuation
($ in Millions, except stock price data)
Stock Price Chg % From Equity Ent. LTM LTM Margin LTM LTM Multiples Company Name Headquarters 03/02/14 52WK High Value Value Revenue EBITDA EBITDA Rev Growth EV/Rev EV/EBITDAJDS Uniphase Corporation United States $14.06 ‐15% $ 3,282.9 $ 2,773.8 $ 1,703.2 $ 150.1 8.8% 0.9% 1.6x 18.5xJuniper Networks, Inc. United States 27.01 ‐6% 13,535.25 11,688.65 4,669.10 794.9 17.0% 7.0% 2.5x 14.7xKVH Industries Inc. United States 12.96 ‐11% 202.3 185.0 162.3 11.9 7.3% 18.4% 1.1x 15.5xMavenir Systems, Inc. United States 14.99 ‐3% 351.1 335.6 101.3 (3.7) NM 37.2% 3.3x NM Meru Networks, Inc. United States 4.12 ‐41% 93.3 68.9 105.7 (8.4) NM 8.4% 0.7x NM Mitel Networks Corporation Canada 9.19 ‐11% 901.6 1,120.0 579.4 88.5 15.3% ‐2.1% 1.9x 12.7xMotorola Solutions, Inc. United States 65.90 ‐3% 16,729.7 15,993.7 8,696.0 1,576.0 18.1% 0.0% 1.8x 10.1xNetgear Inc. United States 34.17 ‐2% 1,245.8 997.7 1,369.6 139.2 10.2% 7.7% 0.7x 7.2xNokia Corporation Finland 7.73 ‐8% 28,690.0 25,374.8 17,547.8 2,366.6 13.5% ‐57.9% 1.4x 10.7xNuance Communications, Inc. United States 15.29 ‐35% 4,849.3 6,435.5 1,863.0 209.9 11.3% 6.3% 3.5x 30.7xNumerex Corp. United States 14.81 ‐7% 275.5 251.5 75.2 4.1 5.5% 20.5% 3.3x 61.4xOptical Cable Corp. United States 3.70 ‐25% 24.3 33.1 75.3 2.8 3.7% ‐9.9% 0.4x 11.8xPalo Alto Networks, Inc. * United States 72.49 ‐9% 5,369.0 4,930.8 482.9 (17.9) NM 49.2% 10.2x NM PCTEL, Inc. United States 8.73 ‐14% 161.8 106.8 104.1 4.1 4.0% 25.4% 1.0x 25.9xPlantronics, Inc. United States 44.57 ‐11% 1,853.3 1,531.3 813.7 154.5 19.0% 10.6% 1.9x 9.9xPolycom, Inc. United States 13.22 0% 1,809.6 1,530.7 1,368.4 119.3 8.7% ‐1.7% 1.1x 12.8xProcera Networks, Inc. United States 11.74 ‐29% 238.9 132.3 74.7 (15.8) NM 25.2% 1.8x NM RadiSys Corporation United States 4.00 ‐23% 116.4 123.9 237.9 (13.9) NM ‐16.9% 0.5x NM Radware Ltd. Israel 17.54 ‐10% 786.1 651.3 193.0 27.4 14.2% 2.0% 3.4x 23.7xRELM Wireless Corp. United States 3.15 ‐23% 42.8 35.1 26.6 2.2 8.3% ‐3.3% 1.3x 15.9xRingCentral, Inc. * United States 23.52 ‐1% 1,464.0 1,382.4 160.5 (32.1) NM 40.1% 8.6x NM Riverbed Technology, Inc. United States 20.65 ‐3% 3,303.8 3,369.4 1,041.0 147.5 14.2% 24.4% 3.2x 22.8xSandvine Corporation Canada 2.89 ‐9% 432.1 355.2 106.5 24.5 23.0% 21.2% 3.3x 14.5xShoreTel, Inc. United States 8.78 ‐10% 539.4 492.2 332.7 10.5 3.1% 17.0% 1.5x 47.1xSierra Wireless Inc. Canada 21.02 ‐18% 653.8 481.3 441.9 11.3 2.6% 11.2% 1.1x 42.5xSolarWinds, Inc. * United States 46.49 ‐24% 3,493.0 3,347.7 335.4 139.8 41.7% 24.7% 10.0x 23.9xSolera Holdings Inc. United States 68.68 ‐3% 4,737.1 6,135.7 890.1 347.7 39.1% 11.1% 6.9x 17.6xSonus Networks, Inc. * United States 3.87 ‐2% 1,030.2 821.3 276.7 1.9 0.7% 8.9% 3.0x 431.3xTelcoware Co., Ltd. South Korea 13.19 ‐2% 71.1 23.6 51.6 6.9 13.4% 1.3% 0.5x 3.4xTeleCommunication Systems Inc. United States 2.19 ‐32% 128.6 214.2 362.3 21.1 5.8% ‐25.7% 0.6x 10.1xTESSCO Technologies Inc. United States 37.90 ‐10% 312.0 306.2 594.0 30.2 5.1% ‐24.7% 0.5x 10.1xTransmode AB (publ) Sweden 16.69 ‐12% 462.9 395.6 160.5 30.4 18.9% 1.8% 2.5x 13.0xUbiquitous Corporation * Japan 10.97 ‐72% 95.8 86.0 7.8 (2.0) NM ‐11.6% 11.0x NM Vecima Networks Inc. Canada 4.96 ‐22% 110.8 81.1 78.5 13.4 17.1% ‐15.2% 1.0x 6.0xVerint Systems Inc. United States 47.17 ‐4% 2,521.5 2,797.6 880.5 177.0 20.1% 7.0% 3.2x 15.8xViaSat Inc. United States 67.12 ‐9% 3,093.6 3,729.4 1,316.2 165.1 12.5% 25.2% 2.8x 22.6xVonage Holdings Corporation United States 4.76 ‐4% 1,006.8 1,056.9 829.1 77.2 9.3% ‐2.4% 1.3x 13.7xWestell Technologies, Inc. United States 4.06 ‐17% 241.0 154.2 89.6 4.2 4.7% 126.8% 1.7x 36.4xZTE Corp. China 2.09 ‐30% 7,181.7 10,709.1 12,716.2 476.6 3.7% ‐12.3% 0.8x 22.5x
Adjusted Weighted Average 2.0x 11.6x
*Calculation is market cap weighted and excludes revenue multiples that are 2.0 standard deviations above the mean (7.3x)and EBITDA multiples that are 1.0 standard deviations above the mean (188.8x)

30 | M&A and Investment Summary February 2014
Software
Within the Software segment, a total of $5.4 billion in reported value was reported in strategic activity, while another $1.3 billion in investments were announced
Security Software was the most active subsegment with 22 transactions announced worth $291 million, followed by ERP Software and Healthcare Software with 11 transactions each worth a combined total of $4.7 billion
Select acquisitions:
• Star Investment Holdings and Partners Group’s $4.4 billion acquisition of Healthcare IT Company Multiplan
• Synopsys’ $350 million purchase of Coverity, which provides software development solutions enabling developers to analyze code
Select investments:
• The Blackstone Group and GIC’s $750 million investment in Kronos, a provider of workforce management solutions
# % $MM % # $MM # $MM # $MM
Security 22 25% $291.1 4% 8 $155.0 0 ‐ 14 $136.1
ERP 11 12% 215.8 3% 5 ‐ 2 160.0 4 55.8
Healthcare 11 12% 4,446.9 64% 3 4,400.0 1 ‐ 7 46.9
HR 8 9% 911.7 13% 3 120.0 0 ‐ 5 791.7
Infrastructure 7 8% 20.7 0% 3 ‐ 0 ‐ 4 20.7
Software Development Tools 7 8% 403.3 6% 3 387.0 0 ‐ 4 16.3
Other* 23 26% 646.5 9% 9 336.4 1 100.0 13 210.1
Total 89 100% 6,936.0 100% 34 5,398.4 4 260.0 51 1,277.6
*Other includes Application Management, Collaboration, Data Management, Engineering, Financial, Geo‐Demo, and Legal
SOFTWARE TRANSACTIONS BY SEGMENT BUYER/INVESTOR BREAKDOWN
Transactions Reported Value Strategic Buyout Venture/Growth Capital

31 | M&A and Investment Summary February 2014
SoftwarePublic Company Valuation
($ in Millions, except stock price data)
Stock Price Chg % From Equity Ent. LTM LTM Margin LTM LTM Multiples Company Name Headquarters 03/02/14 52WK High Value Value Revenue EBITDA EBITDA Rev Growth EV/Rev EV/EBITDAAdvent Software, Inc. United States $30.95 ‐15% $ 1,588.8 $ 1,859.9 $ 383.0 $ 71.2 18.6% 6.7% 4.9x 26.1xEbix Inc. United States 16.75 ‐21% 642.1 663.7 207.9 83.9 40.3% 9.8% 3.2x 7.9xEpiq Systems, Inc. United States 14.12 ‐16% 503.4 775.5 438.7 31.1 7.1% 27.2% 1.8x 24.9xFidessa group plc United Kingdom 41.28 ‐3% 1,554.2 1,431.9 467.5 92.7 19.8% 0.1% 3.1x 15.5xGuidewire Software, Inc. United States 53.97 0% 3,614.9 3,086.2 303.9 3.7 1.2% 25.1% 10.2x NM Innovation Group plc United Kingdom 0.59 ‐2% 588.1 548.9 342.5 43.3 12.6% 5.5% 1.6x 12.7xManagement Consulting Group PLC United Kingdom 0.42 ‐22% 209.3 295.8 439.6 37.4 8.5% ‐10.7% 0.7x 7.9xModel N, Inc. * United States 11.68 ‐53% 283.2 180.6 101.1 2.5 2.5% 14.2% 1.8x 71.8xNetSuite Inc. * United States 119.63 ‐1% 8,934.4 8,736.9 414.5 (38.4) NM 34.2% 21.1x NM Performant Financial Corporation United States 7.23 ‐49% 348.2 399.6 255.3 83.5 32.7% 21.5% 1.6x 4.8xRealPage, Inc. United States 17.75 ‐33% 1,392.2 1,357.7 377.0 57.2 15.2% 17.0% 3.6x 23.7xSolera Holdings Inc. United States 68.68 ‐3% 4,737.1 6,135.7 890.1 347.7 39.1% 11.1% 6.9x 17.6xSS&C Technologies Holdings, Inc. United States 38.73 ‐17% 3,288.9 3,978.9 712.7 282.7 39.7% 29.1% 5.6x 14.1xTyler Technologies, Inc. United States 94.50 ‐12% 3,111.4 3,032.5 416.6 78.8 18.9% 14.7% 7.3x 38.5x
Adjusted Weighted Average 6.1x 21.0x
Healthcare Software
Stock Price Chg % From Equity Ent. LTM LTM Margin LTM LTM Multiples Company Name Headquarters 03/02/14 52WK High Value Value Revenue EBITDA EBITDA Rev Growth EV/Rev EV/EBITDAAccelrys Inc. * United States $12.49 ‐1% $ 695.3 $ 628.4 $ 168.5 $ 4.5 2.7% 3.7% 3.7x 138.3xAllscripts Healthcare Solutions, Inc. * United States 18.55 ‐2% 3,274.8 3,773.3 1,373.1 30.8 2.2% ‐5.1% 2.7x 122.5xathenahealth, Inc. * United States 200.96 ‐3% 7,512.1 7,671.2 595.0 54.8 9.2% 40.9% 12.9x 140.0xCegedim SA France 38.66 ‐3% 538.7 1,264.7 1,250.8 167.9 13.4% ‐0.8% 1.0x 7.5xCerner Corporation United States 61.21 ‐3% 21,052.9 20,339.4 2,840.6 744.9 26.2% 8.8% 7.2x 27.3xComputer Programs & Systems Inc. United States 69.44 ‐3% 774.9 752.4 200.9 53.7 26.7% 9.6% 3.7x 14.0xCraneware plc United Kingdom 9.93 ‐7% 268.1 234.7 41.5 11.6 27.9% 0.9% 5.7x 20.3xMcKesson Corporation United States 174.43 ‐3% 40,141.1 42,584.1 130,370.0 3,327.0 2.6% 5.8% 0.3x 12.8xMedAssets, Inc. United States 25.06 ‐6% 1,548.7 2,319.5 680.4 206.5 30.3% 6.3% 3.4x 11.2xMedidata Solutions, Inc. * United States 65.16 ‐3% 3,529.8 3,518.4 276.8 31.9 11.5% 26.8% 12.7x 110.4xMerge Healthcare Incorporated United States 2.51 ‐47% 236.2 453.7 231.7 32.1 13.9% ‐6.9% 2.0x 14.1xQuality Systems Inc. United States 17.52 ‐27% 1,054.9 960.9 440.8 72.8 16.5% ‐3.7% 2.2x 13.2xStreamline Health Solutions, Inc. United States 6.43 ‐24% 111.7 127.8 28.7 0.6 2.1% 33.3% 4.4x NM USMD Holdings, Inc. United States 14.08 ‐68% 142.3 180.6 232.0 13.0 5.6% 291.4% 0.8x 13.9xVeeva Systems Inc. * United States 35.85 ‐27% 4,467.2 4,193.8 187.1 38.4 20.5% 0.0% 22.4x 109.1x
Adjusted Weighted Average 4.1x 17.4x
*Calculation is market cap weighted and excludes revenue multiples that are 2.0 standard deviations above the mean (15.8x)and EBITDA multiples that are 1.0 standard deviations above the mean (40.4x)
Financial & Credit/Risk Management Software
*Calculation is market cap weighted and excludes revenue multiples that are 2.0 standard deviations above the mean (17.7x)and EBITDA multiples that are 1.0 standard deviations above the mean (109.0x)

32 | M&A and Investment Summary February 2014
SoftwarePublic Company Valuation
($ in Millions, except stock price data)
HR Software
Stock Price Chg % From Equity Ent. LTM LTM Margin LTM LTM Multiples Company Name Headquarters 03/02/14 52WK High Value Value Revenue EBITDA EBITDA Rev Growth EV/Rev EV/EBITDA51job Inc. China $75.15 ‐13% $ 2,222.3 $ 1,702.4 $ 261.8 $ 84.2 32.2% 11.1% 6.5x 20.2xAllocate Software plc. United Kingdom 1.98 ‐1% 133.5 121.1 64.0 6.5 10.2% 4.4% 1.9x 18.5xBenefitfocus, Inc. United States 66.05 ‐14% 1,615.8 1,538.7 96.7 (18.3) NM 0.0% 15.9x NM Concur Technologies, Inc. * United States 127.99 ‐2% 7,248.2 7,056.9 586.1 36.5 6.2% 26.8% 12.0x 193.3xCornerstone OnDemand, Inc. United States 60.86 0% 3,213.5 3,124.0 185.1 (25.5) NM 57.0% 16.9x NM Dice Holdings, Inc. United States 7.49 ‐28% 405.7 485.4 213.5 62.7 29.4% 9.3% 2.3x 7.7xLinkedIn Corporation United States 213.77 ‐17% 25,765.9 23,441.6 1,528.5 166.7 10.9% 57.2% 15.3x 140.6xMonster Worldwide, Inc. United States 8.09 ‐1% 777.6 878.8 807.6 112.3 13.9% ‐9.3% 1.1x 7.8xSaba Software, Inc. United States 12.81 ‐8% 381.6 367.4 121.3 (9.8) NM 7.7% 3.0x NM The Ultimate Software Group, Inc. United States 169.00 ‐2% 4,719.7 4,639.2 410.4 59.3 14.4% 23.5% 11.3x 78.3xWorkday, Inc. * United States 115.47 ‐1% 20,881.9 19,476.7 468.9 (107.3) NM 71.4% 41.5x NM
Adjusted Weighted Average 13.6x 119.0x
Security Software
Stock Price Chg % From Equity Ent. LTM LTM Margin LTM LTM Multiples Company Name Headquarters 03/02/14 52WK High Value Value Revenue EBITDA EBITDA Rev Growth EV/Rev EV/EBITDAAbsolute Software Corporation Canada $6.32 ‐14% $ 273.5 $ 219.8 $ 86.4 $ 17.6 20.3% 10.3% 2.5x 12.5xAVG Technologies N.V. Netherlands 19.15 ‐28% 1,042.6 1,030.2 407.1 135.0 33.2% 14.4% 2.5x 7.6xCheck Point Software Technologies Ltd. Israel 68.08 ‐1% 13,091.8 11,925.0 1,394.1 771.9 55.4% 3.8% 8.6x 15.4xCisco Systems, Inc. United States 21.92 ‐17% 112,916.1 83,023.1 47,873.0 12,980.0 27.1% 1.3% 1.7x 6.4xFireEye, Inc. * United States 87.03 ‐1% 11,989.1 11,815.2 161.6 (142.9) NM 93.9% 73.1x NM Fortinet Inc. United States 23.86 ‐5% 3,900.2 3,408.8 615.3 87.7 14.3% 15.3% 5.5x 38.9xGemalto NV Netherlands 112.25 ‐11% 9,667.0 9,292.1 3,257.2 516.6 15.9% 11.9% 2.9x 18.0xImperva Inc. United States 62.68 ‐2% 1,583.7 1,466.0 137.8 (22.4) NM 32.2% 10.6x NM Infoblox Inc. United States 23.96 ‐51% 1,288.4 1,037.5 245.5 3.1 1.3% 27.6% 4.2x NM Juniper Networks, Inc. United States 27.01 ‐6% 13,535.3 11,688.7 4,669.1 794.9 17.0% 7.0% 2.5x 14.7xNQ Mobile Inc. China 21.21 ‐18% 1,131.8 982.4 158.9 4.8 3.0% 113.0% 6.2x NM Palo Alto Networks, Inc. United States 72.49 ‐9% 5,369.0 4,930.8 482.9 (17.9) NM 49.2% 10.2x NM Proofpoint, Inc. United States 41.61 ‐4% 1,503.8 1,407.3 137.9 (20.2) NM 29.8% 10.2x NM Qihoo 360 Technology Co. Ltd. * China 110.76 ‐1% 13,598.2 13,206.0 552.4 145.9 26.4% 91.5% 23.9x 90.5xSymantec Corporation United States 21.50 ‐21% 14,868.4 13,072.4 6,799.0 1,960.0 28.8% ‐0.6% 1.9x 6.7xTrend Micro Inc. Japan 33.75 ‐18% 4,531.5 3,154.4 1,061.0 359.4 33.9% 15.4% 3.0x 8.8xVeriSign, Inc. United States 55.23 ‐12% 7,382.2 7,033.0 965.1 588.9 61.0% 10.5% 7.3x 11.9x
Adjusted Weighted Average 4.4x 9.3x
*Calculation is market cap weighted and excludes revenue multiples that are 2.0 standard deviations above the mean (34.8x)and EBITDA multiples that are 1.0 standard deviations above the mean (140.9x)
*Calculation is market cap weighted and excludes revenue multiples that are 2.0 standard deviations above the mean (44.5x)and EBITDA multiples that are 1.0 standard deviations above the mean (45.8x)

33 | M&A and Investment Summary February 2014
SoftwarePublic Company Valuation
($ in Millions, except stock price data)
Engineering Software
Stock Price Chg % From Equity Ent. LTM LTM Margin LTM LTM Multiples Company Name Headquarters 03/02/14 52WK High Value Value Revenue EBITDA EBITDA Rev Growth EV/Rev EV/EBITDAAnsys, Inc. United States $83.20 ‐7% $ 7,699.3 $ 6,956.3 $ 861.3 $ 403.5 46.9% 7.9% 8.1x 17.2xAutodesk, Inc. * United States 54.28 ‐7% 12,137.0 10,616.3 2,273.9 426.5 18.8% ‐1.7% 4.7x 24.9xAveva Group plc United Kingdom 35.69 ‐20% 2,276.5 2,116.0 387.2 114.0 29.4% 10.9% 5.5x 18.6xDassault Systemes SA France 114.12 ‐20% 14,142.3 12,195.3 2,852.7 889.6 31.2% 1.9% 4.3x 13.7x
Adjusted Weighted Average 5.3x 15.3x
Infrastructure Software
Stock Price Chg % From Equity Ent. LTM LTM Margin LTM LTM Multiples Company Name Headquarters 03/02/14 52WK High Value Value Revenue EBITDA EBITDA Rev Growth EV/Rev EV/EBITDAAdobe Systems Inc. * United States $69.92 0% $ 34,722.6 $ 33,062.8 $ 4,055.2 $ 770.4 19.0% ‐7.9% 8.2x 42.9xCA Technologies United States 33.39 ‐8% 14,951.0 13,868.0 4,582.0 1,566.0 34.2% ‐2.1% 3.0x 8.9xCommVault Systems, Inc. United States 69.52 ‐23% 3,301.9 2,801.3 567.8 103.4 18.2% 20.4% 4.9x 27.1xCovisint Corporation United States 10.63 ‐28% 398.5 343.8 98.4 (27.1) NM 13.9% 3.5x NM Daegis Inc. United States 1.08 ‐35% 17.7 29.0 33.4 3.6 10.8% ‐17.1% 0.9x 8.1xEndurance International Group Holdings, Inc. * United States 15.41 ‐6% 1,922.7 2,923.3 520.3 61.5 11.8% 78.1% 5.6x 47.5xGuidance Software, Inc. United States 10.75 ‐5% 311.8 292.0 110.5 (13.6) NM ‐14.6% 2.6x NM IBM Corporation United States 185.27 ‐14% 192,929.2 221,731.2 99,751.0 25,019.0 25.1% ‐4.6% 2.2x 8.9xInformatica Corporation United States 41.35 ‐6% 4,515.9 3,838.5 948.2 164.1 17.3% 16.8% 4.0x 23.4xIntraLinks Holdings, Inc. United States 11.64 ‐7% 644.3 634.1 234.5 28.6 12.2% 8.2% 2.7x 22.2xNetSuite Inc. * United States 119.63 ‐1% 8,934.4 8,736.9 414.5 (38.4) NM 34.2% 21.1x NM Opera Software ASA Norway 13.32 ‐16% 1,761.7 1,596.1 300.1 82.5 27.5% 38.9% 5.3x 19.3xOracle Corporation United States 38.95 0% 175,174.1 162,844.1 37,552.0 16,289.0 43.4% 0.9% 4.3x 10.0xRally Software Development Corp. United States 20.29 ‐39% 495.3 400.5 70.2 (14.7) NM 33.5% 5.7x NM Salesforce.com, Inc United States 66.22 0% 39,930.7 40,966.0 4,071.0 83.3 2.0% 33.5% 10.1x NM ServiceNow, Inc. * United States 70.12 ‐2% 9,728.2 9,508.5 424.7 (42.1) NM 74.2% 22.4x NM Textura Corporation United States 26.55 ‐44% 658.6 583.3 40.8 (33.2) NM 70.1% 14.3x NM TIBCO Software Inc. United States 22.03 ‐19% 3,577.0 3,372.1 1,070.0 193.7 18.1% 4.4% 3.2x 17.4x
Adjusted Weighted Average 4.2x 9.8x
*Calculation is market cap weighted and excludes revenue multiples that are 2.0 standard deviations above the mean (19.4x)and EBITDA multiples that are 1.0 standard deviations above the mean (34.9x)
*Calculation is market cap weighted and excludes revenue multiples that are 2.0 standard deviations above the mean (9.0x)and EBITDA multiples that are 1.0 standard deviations above the mean (23.3x)

34 | M&A and Investment Summary February 2014
Information & Business Services
Venture/Growth Capital investments accounted for 73 percent of reported value during the month
IT Consulting/Systems Integration was the most active subsegment with seven transactions announced
Logistics was the highest reported value subsegment with four deals, $2.5 billion of which was from Hopu Funds’ and Bank of China Group’s purchase of a 34 percent stake in Global Logistic Properties
Select acquisitions:
• Cinven’s $915 million acquisition of Medpace, a clinical research organization that provides clinical development services for the pharmaceutical and biotechnology markets
• Broadridge Financial Solutions’ $60 million purchase of Emerald Connect, which provides marketing programs to the financial services industry
• Corporate Resource Services’ purchase of Alar Staffing
# % $MM % # $MM # $MM # $MM
IT Consulting/Systems Integration 7 19% ‐ 0% 7 ‐ 0 ‐ 0 ‐
Staffing 5 14% 10.0 0% 3 10.0 1 ‐ 1 ‐
Logistics 4 11% 2,521.5 71% 0 ‐ 0 ‐ 4 2,521.5
Printing Services 4 11% 34.0 1% 3 32.9 0 ‐ 1 1.1
BPO 3 8% ‐ 0% 3 ‐ 0 ‐ 0 ‐
Healthcare Information 3 8% 8.3 0% 2 ‐ 0 ‐ 1 8.3
Other* 11 30% 974.5 27% 7 13.8 1 915.0 3 45.7
Total 37 100% 3,548.3 100% 25 56.7 2 915.0 10 2,576.6
*Other includes Healthcare Consulting, HR Consulting, HR Information, Corporate Training, Credit/Risk Management Information, Financial Consulting, Financial Information, and Legal Information
INFORMATION & BUSINESS SERVICES TRANSACTIONS BY SEGMENT BUYER/INVESTOR BREAKDOWN
Transactions Reported Value Strategic Buyout Venture/Growth Capital

35 | M&A and Investment Summary February 2014
Information ServicesPublic Company Valuation
($ in Millions, except stock price data)
Stock Price Chg % From Equity Ent. LTM LTM Margin LTM LTM Multiples Company Name Headquarters 03/02/14 52WK High Value Value Revenue EBITDA EBITDA Rev Growth EV/Rev EV/EBITDABroadridge Financial Solutions, Inc. United States $37.54 ‐7% $ 4,483.9 $ 4,767.7 $ 2,507.6 $ 499.7 19.9% 7.3% 1.9x 9.5xComputershare Limited Australia 10.70 ‐1% 5,949.5 7,013.1 2,012.1 454.9 22.6% 0.3% 3.5x 15.4xCoreLogic, Inc. United States 32.76 ‐9% 2,990.1 3,683.3 1,330.6 291.1 21.9% ‐15.1% 2.8x 12.7xCoStar Group Inc. * United States 203.81 ‐2% 5,880.7 5,777.9 440.9 94.0 21.3% 26.0% 13.1x 61.5xDST Systems Inc. United States 94.99 ‐1% 3,970.6 4,274.8 2,658.6 454.5 17.1% 3.2% 1.6x 9.4xDun & Bradstreet Corp. United States 98.91 ‐21% 3,774.4 5,021.3 1,655.2 555.8 33.6% ‐0.5% 3.0x 9.0xEnvestnet, Inc. * United States 42.20 ‐13% 1,426.4 1,376.4 242.5 21.3 8.8% 54.2% 5.7x 64.6xEquifax Inc. United States 70.02 ‐3% 8,535.4 9,781.8 2,303.9 810.8 35.2% 6.6% 4.2x 12.1xExperian plc Ireland 18.40 ‐15% 17,827.6 21,257.1 4,784.0 1,635.0 34.2% 3.5% 4.4x 13.0xFactSet Research Systems Inc. United States 104.55 ‐12% 4,472.9 4,285.1 870.0 327.0 37.6% 6.0% 4.9x 13.1xFair Isaac Corporation United States 53.15 ‐16% 1,855.6 2,237.7 737.8 191.1 25.9% 6.0% 3.0x 11.7xFidelity National Information Services, Inc. United States 56.02 0% 16,309.3 20,387.2 6,070.7 1,835.3 30.2% 4.5% 3.4x 11.1xFinancial Engines, Inc. * United States 56.45 ‐21% 2,879.2 2,633.4 239.0 48.9 20.5% 28.6% 11.0x 53.8xMcGraw Hill Financial, Inc. United States 79.69 ‐3% 21,596.0 21,688.0 4,875.0 1,749.0 35.9% 9.6% 4.4x 12.4xMoody's Corporation United States 78.89 ‐8% 16,858.8 16,934.3 2,972.5 1,342.3 45.2% 8.9% 5.7x 12.6xMorningstar Inc. United States 82.66 ‐4% 3,719.7 3,421.1 698.3 216.3 31.0% 6.1% 4.9x 15.8xMSCI Inc. United States 43.72 ‐4% 5,102.3 5,626.0 1,035.7 450.7 43.5% 9.0% 5.4x 12.5xReis, Inc. United States 17.50 ‐11% 190.9 180.6 34.1 7.0 20.6% 15.1% 5.3x 25.8xSEI Investments Co. United States 34.29 ‐4% 5,811.8 5,233.5 1,126.1 271.4 24.1% 13.5% 4.6x 19.3xThomson Reuters Corporation United States 34.52 ‐9% 28,312.9 34,985.3 12,702.0 2,375.0 18.7% ‐4.3% 2.8x 14.7xThe Nasdaq OMX Group, Inc. United States 38.42 ‐6% 6,509.4 8,696.4 3,211.0 928.0 28.9% 2.9% 2.7x 9.4xVerisk Analytics, Inc. United States 63.79 ‐8% 10,642.4 11,748.6 1,595.7 736.0 46.1% 13.3% 7.4x 16.0x
Adjusted Weighted Average 4.1x 13.1x
($ in Millions, except stock price data)
Marketing Information
Stock Price Chg % From Equity Ent. LTM LTM Margin LTM LTM Multiples Company Name Headquarters 03/02/14 52WK High Value Value Revenue EBITDA EBITDA Rev Growth EV/Rev EV/EBITDAAcxiom Corporation United States $37.23 ‐4% $ 2,843.6 $ 2,786.0 $ 1,097.5 $ 182.0 16.6% ‐1.1% 2.5x 15.3xAlliance Data Systems Corporation * United States 285.11 ‐2% 15,160.2 24,399.0 4,319.1 1,281.1 29.7% 18.6% 5.6x 19.0xBrainjuicer Group Plc United Kingdom 7.32 ‐6% 92.0 82.9 35.5 4.3 12.1% ‐3.6% 2.3x 19.3xCello Group Plc United Kingdom 1.39 ‐11% 115.6 134.7 241.4 13.9 5.8% 11.9% 0.6x 9.7xCision AB Sweden 8.07 ‐11% 119.8 156.3 128.8 18.8 14.6% ‐15.3% 1.2x 8.3xcomScore, Inc. * United States 31.62 ‐5% 1,092.7 1,048.6 286.9 26.3 9.2% 12.4% 3.7x 39.9xCross Marketing Inc. Japan 12.65 ‐20% 68.1 62.7 61.6 8.5 13.9% 15.5% 1.0x 7.3xEbiquity plc United Kingdom 2.10 ‐3% 147.5 183.2 111.0 20.2 18.2% 11.5% 1.7x 9.1xGfK SE Germany 58.40 ‐8% 2,131.8 2,723.4 2,081.9 267.5 12.8% 2.4% 1.3x 10.2xHarte‐Hanks Inc. United States 7.99 ‐21% 499.8 524.1 559.6 61.1 10.9% ‐27.1% 0.9x 8.6xInnerWorkings Inc. United States 7.88 ‐50% 404.0 454.2 893.4 18.0 2.0% 12.0% 0.5x 25.2x
Financial & Credit/Risk Management Information
*Calculation is market cap weighted and excludes revenue multiples that are 2.0 standard deviations above the mean (10.3x)and EBITDA multiples that are 1.0 standard deviations above the mean (36.6x)
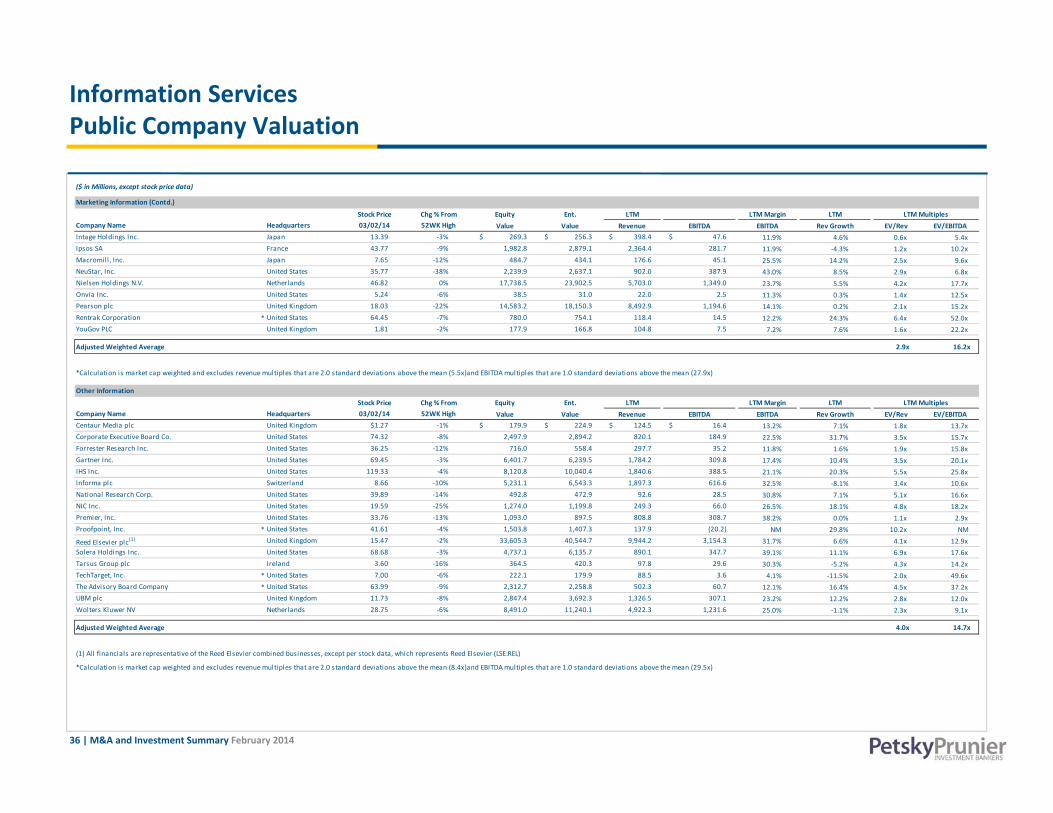
36 | M&A and Investment Summary February 2014
Information Services Public Company Valuation
($ in Millions, except stock price data)
Marketing Information (Contd.)
Stock Price Chg % From Equity Ent. LTM LTM Margin LTM LTM Multiples Company Name Headquarters 03/02/14 52WK High Value Value Revenue EBITDA EBITDA Rev Growth EV/Rev EV/EBITDAIntage Holdings Inc. Japan 13.39 ‐3% $ 269.3 $ 256.3 $ 398.4 $ 47.6 11.9% 4.6% 0.6x 5.4xIpsos SA France 43.77 ‐9% 1,982.8 2,879.1 2,364.4 281.7 11.9% ‐4.3% 1.2x 10.2xMacromill, Inc. Japan 7.65 ‐12% 484.7 434.1 176.6 45.1 25.5% 14.2% 2.5x 9.6xNeuStar, Inc. United States 35.77 ‐38% 2,239.9 2,637.1 902.0 387.9 43.0% 8.5% 2.9x 6.8xNielsen Holdings N.V. Netherlands 46.82 0% 17,738.5 23,902.5 5,703.0 1,349.0 23.7% 5.5% 4.2x 17.7xOnvia Inc. United States 5.24 ‐6% 38.5 31.0 22.0 2.5 11.3% 0.3% 1.4x 12.5xPearson plc United Kingdom 18.03 ‐22% 14,583.2 18,150.3 8,492.9 1,194.6 14.1% 0.2% 2.1x 15.2xRentrak Corporation * United States 64.45 ‐7% 780.0 754.1 118.4 14.5 12.2% 24.3% 6.4x 52.0xYouGov PLC United Kingdom 1.81 ‐2% 177.9 166.8 104.8 7.5 7.2% 7.6% 1.6x 22.2x
Adjusted Weighted Average 2.9x 16.2x
Other Information
Stock Price Chg % From Equity Ent. LTM LTM Margin LTM LTM Multiples Company Name Headquarters 03/02/14 52WK High Value Value Revenue EBITDA EBITDA Rev Growth EV/Rev EV/EBITDACentaur Media plc United Kingdom $1.27 ‐1% $ 179.9 $ 224.9 $ 124.5 $ 16.4 13.2% 7.1% 1.8x 13.7xCorporate Executive Board Co. United States 74.32 ‐8% 2,497.9 2,894.2 820.1 184.9 22.5% 31.7% 3.5x 15.7xForrester Research Inc. United States 36.25 ‐12% 716.0 558.4 297.7 35.2 11.8% 1.6% 1.9x 15.8xGartner Inc. United States 69.45 ‐3% 6,401.7 6,239.5 1,784.2 309.8 17.4% 10.4% 3.5x 20.1xIHS Inc. United States 119.33 ‐4% 8,120.8 10,040.4 1,840.6 388.5 21.1% 20.3% 5.5x 25.8xInforma plc Switzerland 8.66 ‐10% 5,231.1 6,543.3 1,897.3 616.6 32.5% ‐8.1% 3.4x 10.6xNational Research Corp. United States 39.89 ‐14% 492.8 472.9 92.6 28.5 30.8% 7.1% 5.1x 16.6xNIC Inc. United States 19.59 ‐25% 1,274.0 1,199.8 249.3 66.0 26.5% 18.1% 4.8x 18.2xPremier, Inc. United States 33.76 ‐13% 1,093.0 897.5 808.8 308.7 38.2% 0.0% 1.1x 2.9xProofpoint, Inc. * United States 41.61 ‐4% 1,503.8 1,407.3 137.9 (20.2) NM 29.8% 10.2x NM
Reed Elsevier plc(1) United Kingdom 15.47 ‐2% 33,605.3 40,544.7 9,944.2 3,154.3 31.7% 6.6% 4.1x 12.9xSolera Holdings Inc. United States 68.68 ‐3% 4,737.1 6,135.7 890.1 347.7 39.1% 11.1% 6.9x 17.6xTarsus Group plc Ireland 3.60 ‐16% 364.5 420.3 97.8 29.6 30.3% ‐5.2% 4.3x 14.2xTechTarget, Inc. * United States 7.00 ‐6% 222.1 179.9 88.5 3.6 4.1% ‐11.5% 2.0x 49.6xThe Advisory Board Company * United States 63.99 ‐9% 2,312.7 2,258.8 502.3 60.7 12.1% 16.4% 4.5x 37.2xUBM plc United Kingdom 11.73 ‐8% 2,847.4 3,692.3 1,326.5 307.1 23.2% 12.2% 2.8x 12.0xWolters Kluwer NV Netherlands 28.75 ‐6% 8,491.0 11,240.1 4,922.3 1,231.6 25.0% ‐1.1% 2.3x 9.1x
Adjusted Weighted Average 4.0x 14.7x
*Calculation is market cap weighted and excludes revenue multiples that are 2.0 standard deviations above the mean (5.5x)and EBITDA multiples that are 1.0 standard deviations above the mean (27.9x)
*Calculation is market cap weighted and excludes revenue multiples that are 2.0 standard deviations above the mean (8.4x)and EBITDA multiples that are 1.0 standard deviations above the mean (29.5x)
(1) All financials are representative of the Reed Elsevier combined businesses, except per stock data, which represents Reed Elsevier (LSE:REL)
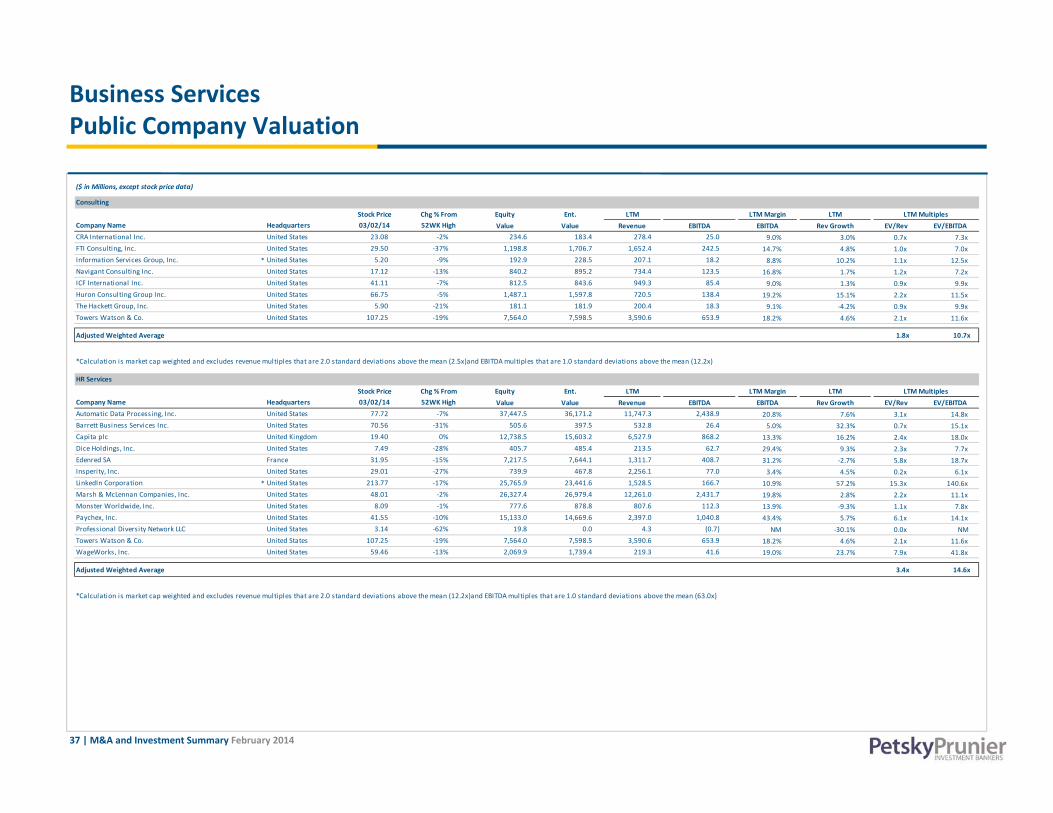
37 | M&A and Investment Summary February 2014
Business Services Public Company Valuation
($ in Millions, except stock price data)
Consulting
Stock Price Chg % From Equity Ent. LTM LTM Margin LTM LTM Multiples Company Name Headquarters 03/02/14 52WK High Value Value Revenue EBITDA EBITDA Rev Growth EV/Rev EV/EBITDACRA International Inc. United States 23.08 ‐2% 234.6 183.4 278.4 25.0 9.0% 3.0% 0.7x 7.3xFTI Consulting, Inc. United States 29.50 ‐37% 1,198.8 1,706.7 1,652.4 242.5 14.7% 4.8% 1.0x 7.0xInformation Services Group, Inc. * United States 5.20 ‐9% 192.9 228.5 207.1 18.2 8.8% 10.2% 1.1x 12.5xNavigant Consulting Inc. United States 17.12 ‐13% 840.2 895.2 734.4 123.5 16.8% 1.7% 1.2x 7.2xICF International Inc. United States 41.11 ‐7% 812.5 843.6 949.3 85.4 9.0% 1.3% 0.9x 9.9xHuron Consulting Group Inc. United States 66.75 ‐5% 1,487.1 1,597.8 720.5 138.4 19.2% 15.1% 2.2x 11.5xThe Hackett Group, Inc. United States 5.90 ‐21% 181.1 181.9 200.4 18.3 9.1% ‐4.2% 0.9x 9.9xTowers Watson & Co. United States 107.25 ‐19% 7,564.0 7,598.5 3,590.6 653.9 18.2% 4.6% 2.1x 11.6x
Adjusted Weighted Average 1.8x 10.7x
HR Services
Stock Price Chg % From Equity Ent. LTM LTM Margin LTM LTM Multiples Company Name Headquarters 03/02/14 52WK High Value Value Revenue EBITDA EBITDA Rev Growth EV/Rev EV/EBITDAAutomatic Data Processing, Inc. United States 77.72 ‐7% 37,447.5 36,171.2 11,747.3 2,438.9 20.8% 7.6% 3.1x 14.8xBarrett Business Services Inc. United States 70.56 ‐31% 505.6 397.5 532.8 26.4 5.0% 32.3% 0.7x 15.1xCapita plc United Kingdom 19.40 0% 12,738.5 15,603.2 6,527.9 868.2 13.3% 16.2% 2.4x 18.0xDice Holdings, Inc. United States 7.49 ‐28% 405.7 485.4 213.5 62.7 29.4% 9.3% 2.3x 7.7xEdenred SA France 31.95 ‐15% 7,217.5 7,644.1 1,311.7 408.7 31.2% ‐2.7% 5.8x 18.7xInsperity, Inc. United States 29.01 ‐27% 739.9 467.8 2,256.1 77.0 3.4% 4.5% 0.2x 6.1xLinkedIn Corporation * United States 213.77 ‐17% 25,765.9 23,441.6 1,528.5 166.7 10.9% 57.2% 15.3x 140.6xMarsh & McLennan Companies, Inc. United States 48.01 ‐2% 26,327.4 26,979.4 12,261.0 2,431.7 19.8% 2.8% 2.2x 11.1xMonster Worldwide, Inc. United States 8.09 ‐1% 777.6 878.8 807.6 112.3 13.9% ‐9.3% 1.1x 7.8xPaychex, Inc. United States 41.55 ‐10% 15,133.0 14,669.6 2,397.0 1,040.8 43.4% 5.7% 6.1x 14.1xProfessional Diversity Network LLC United States 3.14 ‐62% 19.8 0.0 4.3 (0.7) NM ‐30.1% 0.0x NM Towers Watson & Co. United States 107.25 ‐19% 7,564.0 7,598.5 3,590.6 653.9 18.2% 4.6% 2.1x 11.6xWageWorks, Inc. United States 59.46 ‐13% 2,069.9 1,739.4 219.3 41.6 19.0% 23.7% 7.9x 41.8x
Adjusted Weighted Average 3.4x 14.6x
*Calculation is market cap weighted and excludes revenue multiples that are 2.0 standard deviations above the mean (2.5x)and EBITDA multiples that are 1.0 standard deviations above the mean (12.2x)
*Calculation is market cap weighted and excludes revenue multiples that are 2.0 standard deviations above the mean (12.2x)and EBITDA multiples that are 1.0 standard deviations above the mean (63.0x)

38 | M&A and Investment Summary February 2014
Business Services Public Company Valuation
($ in Millions, except stock price data)
IT Consulting/Systems Integration
Stock Price Chg % From Equity Ent. LTM LTM Margin LTM LTM Multiples Company Name Headquarters 03/02/14 52WK High Value Value Revenue EBITDA EBITDA Rev Growth EV/Rev EV/EBITDAAccenture plc Ireland 83.36 ‐3% $ 53,099.5 $ 49,084.1 $ 28,701.6 $ 4,421.0 15.4% 2.5% 1.7x 11.1xAmdocs Limited Channel Islands 44.39 ‐1% 7,085.4 5,873.9 3,383.5 626.8 18.5% 3.6% 1.7x 9.4xBechtle AG Germany 79.09 ‐5% 1,660.9 1,647.4 3,042.5 148.1 4.9% 6.5% 0.5x 11.1xBooz Allen Hamilton Holding Corporation United States 20.83 ‐6% 3,009.8 4,281.1 5,624.2 562.4 10.0% ‐2.2% 0.8x 7.6xBroadridge Financial Solutions, Inc. United States 37.54 ‐7% 4,483.9 4,767.7 2,507.6 499.7 19.9% 7.3% 1.9x 9.5xBusiness & Decision SA France 6.19 ‐7% 48.8 94.5 288.1 19.7 6.8% ‐13.0% 0.3x 4.8xCap Gemini S.A. France 77.63 ‐3% 12,319.8 11,538.3 13,934.4 1,375.2 9.9% ‐1.7% 0.8x 8.4xCGI Group, Inc. Canada 33.04 ‐12% 10,167.1 12,819.7 9,200.0 1,331.1 14.5% 62.5% 1.4x 9.6xCognizant Technology Solutions Corporation * United States 103.20 ‐2% 31,343.1 27,595.6 8,843.2 1,857.8 21.0% 20.4% 3.1x 14.9xComputer Sciences Corporation United States 63.27 ‐1% 9,217.9 9,781.9 13,970.0 2,169.5 15.5% ‐3.8% 0.7x 4.5xCSG Systems International Inc. United States 27.72 ‐14% 938.0 992.2 747.5 143.1 19.2% ‐1.2% 1.3x 6.9xDigi International Inc. United States 9.81 ‐23% 253.9 156.0 195.7 16.8 8.6% 2.5% 0.8x 9.3xInformation Services Group, Inc. United States 5.20 ‐9% 192.9 228.5 207.1 18.2 8.8% 10.2% 1.1x 12.5xInternational Business Machines Corporation United States 185.27 ‐14% 192,929.2 221,731.2 99,751.0 25,019.0 25.1% ‐4.6% 2.2x 8.9xInfosys Ltd. * India 61.57 ‐1% 35,181.8 30,942.7 8,095.0 2,140.0 26.4% 11.9% 3.8x 14.5xiSoftStone Holdings Limited * China 5.09 ‐11% 296.5 377.2 418.1 26.2 6.3% 15.2% 0.9x 14.4xITS Group France 8.41 ‐1% 48.4 57.7 124.5 9.3 7.4% ‐3.9% 0.5x 6.2xNCI, Inc. United States 11.75 ‐10% 151.9 152.8 332.3 19.5 5.9% ‐9.8% 0.5x 7.8xNTT Data Corporation Japan 41.73 ‐1% 11,705.2 14,132.3 13,053.9 1,923.9 14.7% 4.6% 1.1x 7.3xPerficient Inc. * United States 20.67 ‐14% 682.7 693.3 343.5 42.7 12.4% 15.2% 2.0x 16.2xTata Consultancy Services Limited * India 35.33 ‐8% 69,192.7 67,388.3 12,413.1 3,759.6 30.3% 28.2% 5.4x 17.9xWipro Ltd. * India 9.77 ‐1% 23,918.5 21,911.2 6,675.3 1,431.7 21.4% 27.8% 3.3x 15.3x
Adjusted Weighted Average 2.3x 9.1x
($ in Millions, except stock price data)
Outsourced Services
Stock Price Chg % From Equity Ent. LTM LTM Margin LTM LTM Multiples Company Name Headquarters 03/02/14 52WK High Value Value Revenue EBITDA EBITDA Rev Growth EV/Rev EV/EBITDAAMREP Corporation * United States $7.40 ‐41% $ 53.2 $ 51.3 $ 85.3 $ 0.2 0.2% 4.9% 0.6x 254.2xCenveo Inc. United States 3.39 ‐14% 224.9 1,399.1 1,777.8 145.0 8.2% 2.3% 0.8x 9.6xCommunisis plc United Kingdom 1.19 ‐5% 230.7 252.3 399.5 33.9 8.5% 6.9% 0.6x 7.5xCineplex Inc. Canada 36.99 ‐9% 2,328.2 2,590.4 1,056.8 176.1 16.7% 7.2% 2.5x 14.7xContax Participacoes S.A. Brazil 1.53 ‐36% 644.4 997.0 1,550.2 187.3 12.1% ‐0.1% 0.6x 5.3xConvergys Corporation United States 20.47 ‐16% 2,062.9 1,460.3 2,046.1 237.8 11.6% 2.0% 0.7x 6.1xElanders AB Sweden 7.00 ‐10% 159.2 274.4 326.9 35.7 10.9% 8.9% 0.8x 7.7xEniro AB Sweden 10.21 ‐1% 1,023.2 1,416.5 570.8 132.4 23.2% ‐8.5% 2.5x 10.7xExlservice Holdings, Inc. United States 27.99 ‐15% 921.8 786.0 472.0 86.2 18.3% 10.3% 1.7x 9.1xFirstsource Solutions Limited India 0.45 ‐5% 299.6 445.5 487.0 56.9 11.7% 9.2% 0.9x 7.8xGenpact Limited Bermuda 16.68 ‐22% 3,865.0 3,957.0 2,132.0 384.0 18.0% 12.1% 1.9x 10.3xInnerWorkings Inc. * United States 7.88 ‐50% 404.0 454.2 893.4 18.0 2.0% 12.0% 0.5x 25.2x
*Calculation is market cap weighted and excludes revenue multiples that are 2.0 standard deviations above the mean (4.2x)and EBITDA multiples that are 1.0 standard deviations above the mean (14.2x)

39 | M&A and Investment Summary February 2014
Business Services Public Company Valuation
($ in Millions, except stock price data)
Outsourced Services (Contd.)
Stock Price Chg % From Equity Ent. LTM LTM Margin LTM LTM Multiples Company Name Headquarters 03/02/14 52WK High Value Value Revenue EBITDA EBITDA Rev Growth EV/Rev EV/EBITDALuxoft Holding, Inc. * British Virgin Islands 38.74 ‐11% $ 1,269.1 $ 1,254.7 $ 378.0 $ 68.4 18.1% 25.5% 3.3x 18.3xMAXIMUS, Inc. United States 48.78 ‐4% 3,310.0 3,190.8 1,451.6 240.4 16.6% 32.3% 2.2x 13.3xQuad/Graphics, Inc. United States 23.50 ‐36% 1,128.3 2,538.7 4,795.9 578.0 12.1% 17.1% 0.5x 4.4xQuintiles Transnational Holdings Inc. United States 53.50 ‐3% 6,950.8 8,243.4 3,808.3 557.0 14.6% 3.1% 2.2x 14.8xR.R. Donnelley & Sons Company United States 19.04 ‐10% 3,765.9 6,617.3 10,480.3 1,116.5 10.7% 2.5% 0.6x 5.9xSalmat Limited Australia 1.84 ‐25% 291.3 231.5 407.8 30.2 7.4% ‐43.1% 0.6x 7.7xSerco Group plc United Kingdom 6.88 ‐40% 3,363.5 4,632.0 8,579.7 659.5 7.7% 18.9% 0.5x 7.0xSt Ives plc United Kingdom 3.23 ‐4% 390.7 415.3 540.6 55.5 10.3% ‐2.1% 0.8x 7.5xStarTek, Inc. United States 6.95 ‐4% 106.3 95.3 231.3 8.0 3.5% 16.7% 0.4x 11.9xSykes Enterprises, Incorporated United States 19.86 ‐15% 871.4 757.4 1,263.5 114.1 9.0% 12.0% 0.6x 6.6xTeleperformance France 61.96 ‐2% 3,472.2 3,336.9 3,359.3 422.5 12.6% 3.7% 1.0x 7.9xTeleTech Holdings Inc. United States 24.41 ‐10% 1,230.8 1,075.3 1,193.2 151.4 12.7% 2.6% 0.9x 7.1xTrans Cosmos, Inc. Japan 21.80 ‐6% 896.7 659.8 1,746.2 103.2 5.9% 7.6% 0.4x 6.4xTranscom WorldWide SA Luxembourg 0.19 ‐18% 238.9 288.7 901.9 36.9 4.1% 7.9% 0.3x 7.8xTranscontinental Inc. Canada 13.53 ‐13% 1,053.6 1,427.2 1,903.9 338.4 17.8% ‐0.1% 0.7x 4.2xVistaprint N.V. Netherlands 50.08 ‐14% 1,664.1 1,806.3 1,213.6 137.8 11.4% 9.6% 1.5x 13.1xWest Corporation United States 24.95 ‐26% 2,091.7 5,387.0 2,685.9 662.6 24.7% 1.8% 2.0x 8.1xXchanging PLC United Kingdom 2.96 ‐7% 716.2 551.3 1,149.2 170.9 14.9% 2.6% 0.5x 3.2x
Adjusted Weighted Average 1.6x 3.2x
*Calculation is market cap weighted and excludes revenue multiples that are 2.0 standard deviations above the mean (1.3x)and EBITDA multiples that are 1.0 standard deviations above the mean (29.7x)

40 | M&A and Investment Summary February 2014
PPLLC Indices Valuation Summary
Public Company Index MEAN MEDIAN W. AVG ADJ. W. AVG*Digital Media/Commerce 7.0x 2.3x 9.0x 8.9xDigital Advertising 4.7x 2.4x 6.8x 6.3xMarketing Technology 6.2x 4.0x 4.7x 4.3xAgency 1.1x 1.1x 1.5x 1.5xMarketing Services 1.7x 1.8x 3.0x 2.0xTraditional Media 2.9x 2.5x 3.3x 3.2xTechnology 3.7x 2.5x 4.1x 3.8xCommunications 2.5x 1.7x 2.3x 2.0xSoftware 7.7x 4.4x 7.1x 5.5xInformation 3.8x 3.5x 4.4x 4.1xBusiness Services 1.5x 0.8x 3.1x 2.1x
Public Company Index MEAN MEDIAN W. AVG ADJ. W. AVG*Digital Media/Commerce 32.9x 16.1x 31.5x 27.7xDigital Advertising 26.5x 19.8x 22.7x 21.7xMarketing Technology 38.4x 17.2x 13.9x 13.6xAgency 12.3x 10.0x 11.2x 11.1xMarketing Services 16.9x 9.0x 12.7x 12.3xTraditional Media 12.5x 10.4x 11.4x 11.4xTechnology 19.0x 11.0x 12.3x 12.3xCommunications 50.1x 15.5x 16.8x 11.6xSoftware 34.4x 17.4x 19.8x 12.8xInformation 18.2x 13.1x 16.3x 14.2xBusiness Services 14.0x 9.9x 20.8x 12.7x
deviations above the mean and EBITDA multiples that are 2 standard deviations above the mean
Revenue Multiples
EBITDA Multiples
As of close of business on 02/28/14
*Calculation is market cap weighted and excludes revenue multiples that are 3 standard

41 | M&A and Investment Summary February 2014
PPLLC IndicesLTM Share Pricing Trends
Note: LTM as of 2/28/14
LTM Index Performance
• S&P 500 – 22.9%
• Digital Media/Commerce –61.6%
• Traditional Media – 36.9%
LTM Index Performance
• S&P 500 – 22.9% %
• Marketing Technology – 5.1%
LTM Index Performance
• S&P 500 – 22.9%
• Digital Advertising – 61.6%
LTM Index Performance
• S&P 500 – 22.9%
• Agency – 39.3%
• Marketing Services – 40.1%
Digital Media/Commerce and Traditional Media Digital Advertising
Agency & Marketing ServicesMarketing Technology
80
95
110
125
140
155
170
Feb‐13 Apr‐13 Jun‐13 Aug‐13 Oct‐13 Dec‐13 Feb‐14
Index Performance (%
)
S&P 500 Digital Media/Commerce Traditional Media
80
95
110
125
140
155
170
Feb‐13 Apr‐13 Jun‐13 Aug‐13 Oct‐13 Dec‐13 Feb‐14
Index Performance (%
)
S&P 500 Digital Advertising
80
90
100
110
120
130
Feb‐13 Apr‐13 Jun‐13 Aug‐13 Oct‐13 Dec‐13 Feb‐14
Index Performance (%
)
S&P 500 Marketing Technology
80
95
110
125
140
155
Feb‐13 Apr‐13 Jun‐13 Aug‐13 Oct‐13 Dec‐13 Feb‐14
Index Performance (%
)
S&P 500 Agency Marketing Services
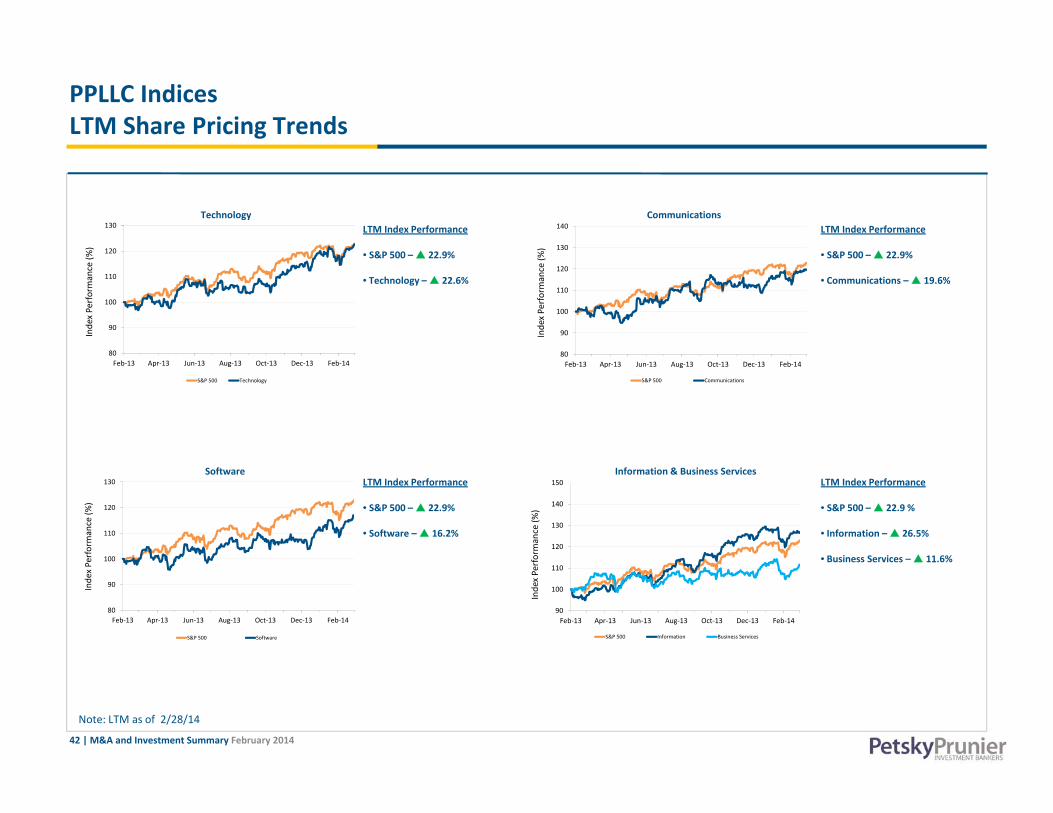
42 | M&A and Investment Summary February 2014
PPLLC IndicesLTM Share Pricing Trends
Note: LTM as of 2/28/14
LTM Index Performance
• S&P 500 – 22.9%
• Technology – 22.6%
LTM Index Performance
• S&P 500 – 22.9%
• Software – 16.2%
LTM Index Performance
• S&P 500 – 22.9%
• Communications – 19.6%
LTM Index Performance
• S&P 500 – 22.9 %
• Information – 26.5%
• Business Services – 11.6%
Technology Communications
Information & Business ServicesSoftware
80
90
100
110
120
130
Feb‐13 Apr‐13 Jun‐13 Aug‐13 Oct‐13 Dec‐13 Feb‐14
Index Performance (%
)
S&P 500 Technology
80
90
100
110
120
130
140
Feb‐13 Apr‐13 Jun‐13 Aug‐13 Oct‐13 Dec‐13 Feb‐14
Index Performance (%
)
S&P 500 Communications
80
90
100
110
120
130
Feb‐13 Apr‐13 Jun‐13 Aug‐13 Oct‐13 Dec‐13 Feb‐14
Index Performance (%
)
S&P 500 Software
90
100
110
120
130
140
150
Feb‐13 Apr‐13 Jun‐13 Aug‐13 Oct‐13 Dec‐13 Feb‐14
Index Performance (%
)
S&P 500 Information Business Services

43 | M&A and Investment Summary February 2014
Target Target Segment Buyer/Investor Reported TV StrategicValues Disclosed
Time Warner Cable Inc. Tradi tional Media Comcast Corporation 45,000.2$ WhatsApp, Inc. Digi ta l Media/Commerce Facebook 19,000.0 MultiPlan, Inc. Software Partners Group AG 4,400.0 Zale Corporation Digi ta l Media/Commerce Signet Jewelers Ltd 1,234.0 Viber Media , Inc. Digi ta l Media/Commerce Rakuten, Inc. 900.0 Eddie Bauer Holdings , Inc. Digi ta l Media/Commerce Joseph A. Bank Clothiers , Inc. 825.0 Blue Kai , Inc. Marketing Technology Oracle Corporation 400.0 Coasta l Contacts , Inc. Digi ta l Media/Commerce Ess i lor International SA 385.7 Coveri ty, Inc. Software Synopsys , Inc 350.0 Hercules Tire & Rubber Company Digi ta l Adverti s ing American Tire Dis tributors , Inc. 321.5 Third Coast Holdings Software Wolters Kluwer Corporate Lega l Services 180.0 BASH Gaming Digi ta l Media/Commerce Game Show Network 160.0 Trans ics Internationa l Software WABCO Europe BVBA 156.4 Interthinx Software Fi rs t American Financia l Corporation 155.0 Lefeng.com Digi ta l Media/Commerce Vipshop 132.0 WBLS 107.5, WLIB 1190 AM Traditional Media Emmis Communications 131.0 Bright Software LinkedIn Corporation 120.0 Simple Finance Technology Corporation Technology & Communications BBVA 117.0 WMYD, WKBW Traditional Media The E.W. Scripps Company 110.0 Pozi tron Marketing Technology Moniti se plc 100.0 Veveo, Inc. Marketing Technology Rovi Corporation 69.0 Express Data Holdings Pty Ltd. Technology & Communications Dicker Data Limited 65.5 Rock in Rio Tradi tional Media SFX Enterta inment, Inc. 62.3 Emerald Connect, Inc. Information & Bus iness Services Broadridge Financia l Solutions , Inc. 60.0 Skyfence Networks , Inc. Technology & Communications Imperva, Inc. 60.0 Trace Partners SAS Tradi tional Media Modern Times Group MTG AB 55.0 Kingsdale Shareholder Services Agency & Marketing Services MDC Partners , Inc. 50.0 ForwardThink Group, Inc. Technology & Communications Perficient, Inc. 46.0 DAX Technologies Corp. Software Spirent Communications plc 37.0 People & Print Group B.V. Information & Bus iness Services VistaPrint USA, Inc. 32.9 Tedemis Digi ta l Adverti s ing Criteo 29.0 SET Media , Inc. Digi ta l Advertis ing Conversant, Inc. 26.0 Ness Computing, Inc. Marketing Technology OpenTable.com, Inc. 17.0 Xora, Inc. Technology & Communications Cl ickSoftware Technologies Ltd. 14.7 Bl ink Technologies , Inc. Marketing Technology ePunk, Inc. 14.4 Equipos Ltd. Information & Bus iness Services SimCorp A/S 13.8 Wander Digi ta l Media/Commerce Yahoo!, Inc. 10.0 Staff Management Group Information & Bus iness Services Diamond Staffing Services , Inc. 10.0 V3 Systems, Inc. Technology & Communications Sphere 3D Corporation 9.7 GetJar, Inc. Marketing Technology Sungy Mobi le Limited 5.3 ODigMa Agency & Marketing Services Infibeam 5.0 Technolab Marketing Technology The Hackett Group, Inc. 4.0 Stray Angel Fi lms Tradi tional Media Ubiqui ty Broadcasting Corporation 3.0
All Segments($ in Millions)
Strategic Transactions
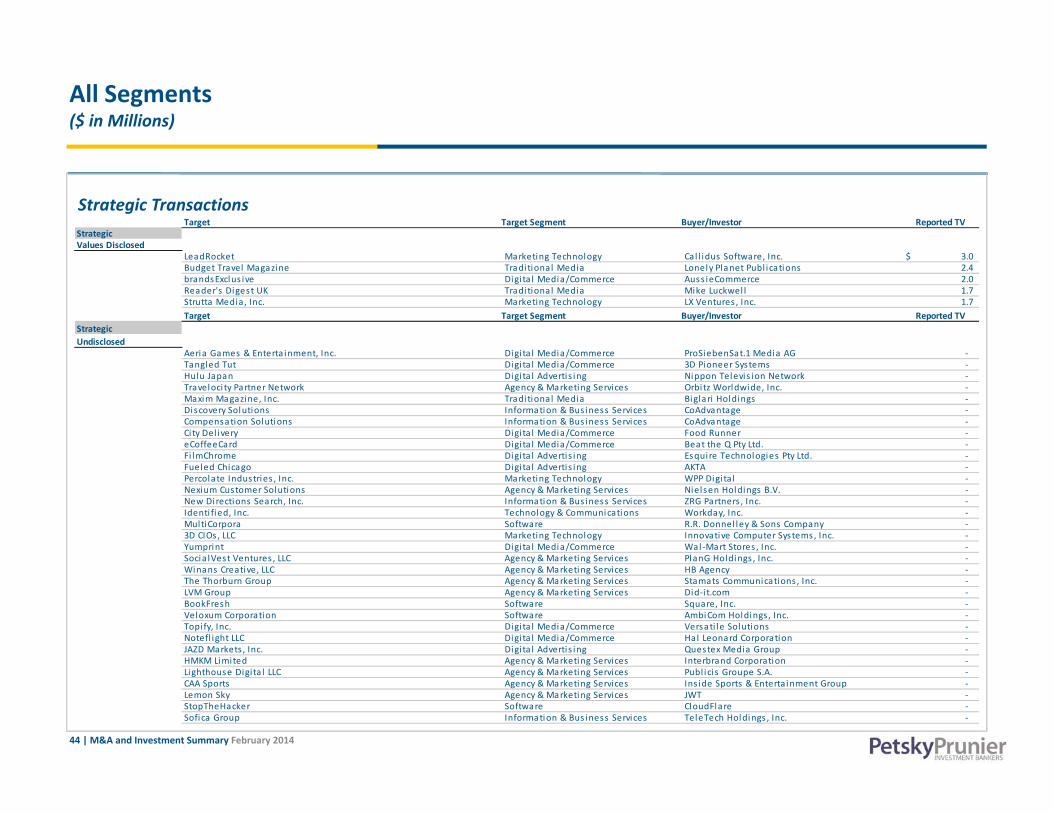
44 | M&A and Investment Summary February 2014
Target Target Segment Buyer/Investor Reported TV StrategicUndisclosed
Aeria Games & Enterta inment, Inc. Digi ta l Media/Commerce ProSiebenSat.1 Media AG ‐ Tangled Tut Digi ta l Media/Commerce 3D Pioneer Systems ‐ Hulu Japan Digi ta l Adverti s ing Nippon Televis ion Network ‐ Traveloci ty Partner Network Agency & Marketing Services Orbi tz Worldwide, Inc. ‐ Maxim Magazine, Inc. Tradi tional Media Biglari Holdings ‐ Discovery Solutions Information & Bus iness Services CoAdvantage ‐ Compensation Solutions Information & Bus iness Services CoAdvantage ‐ City Del ivery Digi ta l Media/Commerce Food Runner ‐ eCoffeeCard Digi ta l Media/Commerce Beat the Q Pty Ltd. ‐ Fi lmChrome Digi ta l Adverti s ing Esquire Technologies Pty Ltd. ‐ Fueled Chicago Digi ta l Adverti s ing AKTA ‐ Percolate Industries , Inc. Marketing Technology WPP Digi ta l ‐ Nexium Customer Solutions Agency & Marketing Services Nielsen Holdings B.V. ‐ New Directions Search, Inc. Information & Bus iness Services ZRG Partners , Inc. ‐ Identi fied, Inc. Technology & Communications Workday, Inc. ‐ MultiCorpora Software R.R. Donnel ley & Sons Company ‐ 3D CIOs , LLC Marketing Technology Innovative Computer Systems, Inc. ‐ Yumprint Digi ta l Media/Commerce Wal ‐Mart Stores , Inc. ‐ Socia lVest Ventures , LLC Agency & Marketing Services PlanG Holdings , Inc. ‐ Winans Creative, LLC Agency & Marketing Services HB Agency ‐ The Thorburn Group Agency & Marketing Services Stamats Communications , Inc. ‐ LVM Group Agency & Marketing Services Did‐i t.com ‐ BookFresh Software Square, Inc. ‐ Veloxum Corporation Software AmbiCom Holdings , Inc. ‐ Topify, Inc. Digi ta l Media/Commerce Versati le Solutions ‐ Notefl ight LLC Digi ta l Media/Commerce Hal Leonard Corporation ‐ JAZD Markets , Inc. Digi ta l Adverti s ing Questex Media Group ‐ HMKM Limited Agency & Marketing Services Interbrand Corporation ‐ Lighthouse Digita l LLC Agency & Marketing Services Publ ici s Groupe S.A. ‐ CAA Sports Agency & Marketing Services Ins ide Sports & Enterta inment Group ‐ Lemon Sky Agency & Marketing Services JWT ‐ StopTheHacker Software CloudFlare ‐ Sofica Group Information & Bus iness Services TeleTech Holdings , Inc. ‐
Target Target Segment Buyer/Investor Reported TV StrategicValues Disclosed
LeadRocket Marketing Technology Cal l idus Software, Inc. 3.0$ Budget Travel Magazine Tradi tional Media Lonely Planet Publ ications 2.4 brandsExclus ive Digi ta l Media/Commerce Auss ieCommerce 2.0 Reader's Digest UK Tradi tional Media Mike Luckwel l 1.7 Strutta Media, Inc. Marketing Technology LX Ventures , Inc. 1.7
All Segments($ in Millions)
Strategic Transactions

45 | M&A and Investment Summary February 2014
Target Target Segment Buyer/Investor Reported TV StrategicUndisclosed
Booklr Marketing Technology Vook, Inc. ‐ eReputationBui lder Marketing Technology Dealer Authority ‐ GetTVG Marketing Technology Xumani i Internationa l ‐ Burstly Digi ta l Adverti s ing Apple Inc. ‐ GRASP Systems Marketing Technology Infor Global Solutions , Inc. ‐ Dai ly Deal Bui lder Marketing Technology DiscountCoupons.com ‐ Martino & Binzer, Inc. Agency & Marketing Services BlueSpire Strategic Marketing ‐ 22Feet Communications Pvt. Ltd. Agency & Marketing Services DDB Mudra Group ‐ Cloudant, Inc. Technology & Communications International Bus iness Machines Corporation ‐ BoxTone, Inc. Technology & Communications Good Technology, Inc. ‐ C‐SAM, Inc. Technology & Communications MasterCard, Inc. ‐ FTAPI Software GmbH Software QSC AG ‐ The Onl ine Journal of Nurs ing Informatics Information & Bus iness Services Heal thcare Information and Management System ‐ TalentBin Information & Bus iness Services Monster Worldwide, Inc. ‐ Gozaik LLC Information & Bus iness Services Monster Worldwide, Inc. ‐ iSearch Media, Inc. Marketing Technology 3Q Digita l ‐ Espion International , Inc. Software VersAi , Inc. ‐ Spider.io Software Google, Inc. ‐ Treo Solutions Information & Bus iness Services 3M Company ‐ Citessentia ls Digi ta l Advertis ing Impact Telecom ‐ HYDRANT Agency & Marketing Services Cibo Globa l , LLC ‐ SolutionIQ, LLC Agency & Marketing Services Il luminati Studios ‐ Publ i shNext, Seattle Book Company Tradi tional Media Thomson‐Shore, Inc. ‐ DiGa Vis ion Tradi tional Media ITV plc ‐ Findwise Search Center Technology & Communications Meltwater Group ‐ AppSl ingr, Inc. Software OTOY, Inc. ‐ PhiSix Fashion Labs Software eBay Incorporated ‐ Audax Health Solutions Software Optum Inc. ‐ Al l ied Technology Group Software ManTech Internationa l Corporation ‐ Digi ta l PlaySpace, Inc. Digi ta l Media/Commerce 3D Systems Corporation ‐ Digi ta l Scout Digi ta l Media/Commerce 2080 Media ‐ Join Sess ions , Inc. Digi ta l Media/Commerce MyFitnessPal , LLC ‐ al ivenotdead.com Digi ta l Media/Commerce mig33 ‐ Mobi Girl Media Digi ta l Adverti s ing SuperAwesome Limited ‐ Dachis Group Marketing Technology Sprinkl r ‐ Connexi ty LLC Agency & Marketing Services Shopzi l la , Inc. ‐ Bel lefield Systems, LLC Technology & Communications AIRTIME‐Manager Cl ient Base ‐
All Segments($ in Millions)
Strategic Transactions
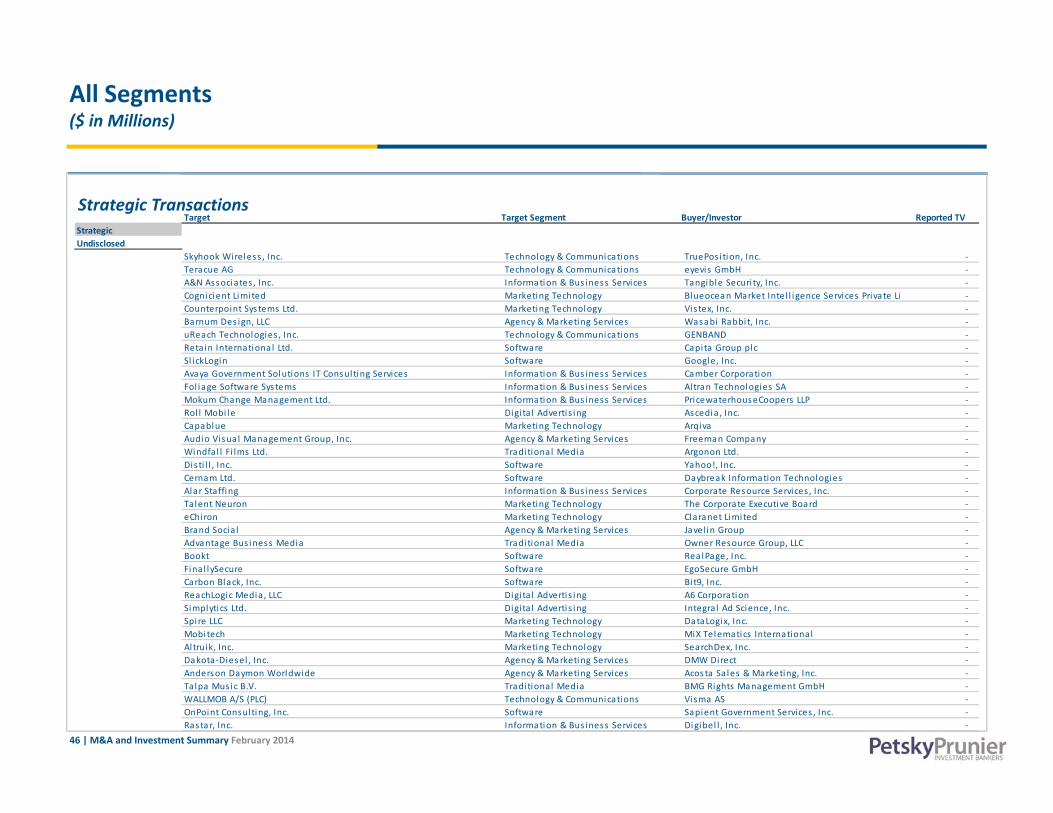
46 | M&A and Investment Summary February 2014
Target Target Segment Buyer/Investor Reported TV StrategicUndisclosed
Skyhook Wireless , Inc. Technology & Communications TruePos i tion, Inc. ‐ Teracue AG Technology & Communications eyevis GmbH ‐ A&N Associates , Inc. Information & Bus iness Services Tangible Securi ty, Inc. ‐ Cognicient Limited Marketing Technology Blueocean Market Intel l igence Services Private Li ‐ Counterpoint Sys tems Ltd. Marketing Technology Vistex, Inc. ‐ Barnum Des ign, LLC Agency & Marketing Services Wasabi Rabbit, Inc. ‐ uReach Technologies , Inc. Technology & Communications GENBAND ‐ Reta in Internationa l Ltd. Software Capita Group plc ‐ Sl ickLogin Software Google, Inc. ‐ Avaya Government Solutions IT Consul ting Services Information & Bus iness Services Camber Corporation ‐ Fol iage Software Sys tems Information & Bus iness Services Al tran Technologies SA ‐ Mokum Change Management Ltd. Information & Bus iness Services PricewaterhouseCoopers LLP ‐ Rol l Mobi le Digi ta l Adverti s ing Ascedia , Inc. ‐ Capablue Marketing Technology Arqiva ‐ Audio Visua l Management Group, Inc. Agency & Marketing Services Freeman Company ‐ Windfal l Fi lms Ltd. Tradi tional Media Argonon Ltd. ‐ Disti l l , Inc. Software Yahoo!, Inc. ‐ Cernam Ltd. Software Daybreak Information Technologies ‐ Alar Staffing Information & Bus iness Services Corporate Resource Services , Inc. ‐ Talent Neuron Marketing Technology The Corporate Executive Board ‐ eChiron Marketing Technology Claranet Limited ‐ Brand Socia l Agency & Marketing Services Javel in Group ‐ Advantage Bus iness Media Tradi tional Media Owner Resource Group, LLC ‐ Bookt Software Rea lPage, Inc. ‐ Final lySecure Software EgoSecure GmbH ‐ Carbon Black, Inc. Software Bit9, Inc. ‐ ReachLogic Media, LLC Digi ta l Adverti s ing A6 Corporation ‐ Simplytics Ltd. Digi ta l Adverti s ing Integral Ad Science, Inc. ‐ Spire LLC Marketing Technology DataLogix, Inc. ‐ Mobitech Marketing Technology MiX Telematics International ‐ Altruik, Inc. Marketing Technology SearchDex, Inc. ‐ Dakota ‐Diesel , Inc. Agency & Marketing Services DMW Direct ‐ Anderson Daymon Worldwide Agency & Marketing Services Acosta Sales & Marketing, Inc. ‐ Talpa Music B.V. Tradi tional Media BMG Rights Management GmbH ‐ WALLMOB A/S (PLC) Technology & Communications Visma AS ‐ OnPoint Consul ting, Inc. Software Sapient Government Services , Inc. ‐ Rastar, Inc. Information & Bus iness Services Digibel l , Inc. ‐
All Segments($ in Millions)
Strategic Transactions
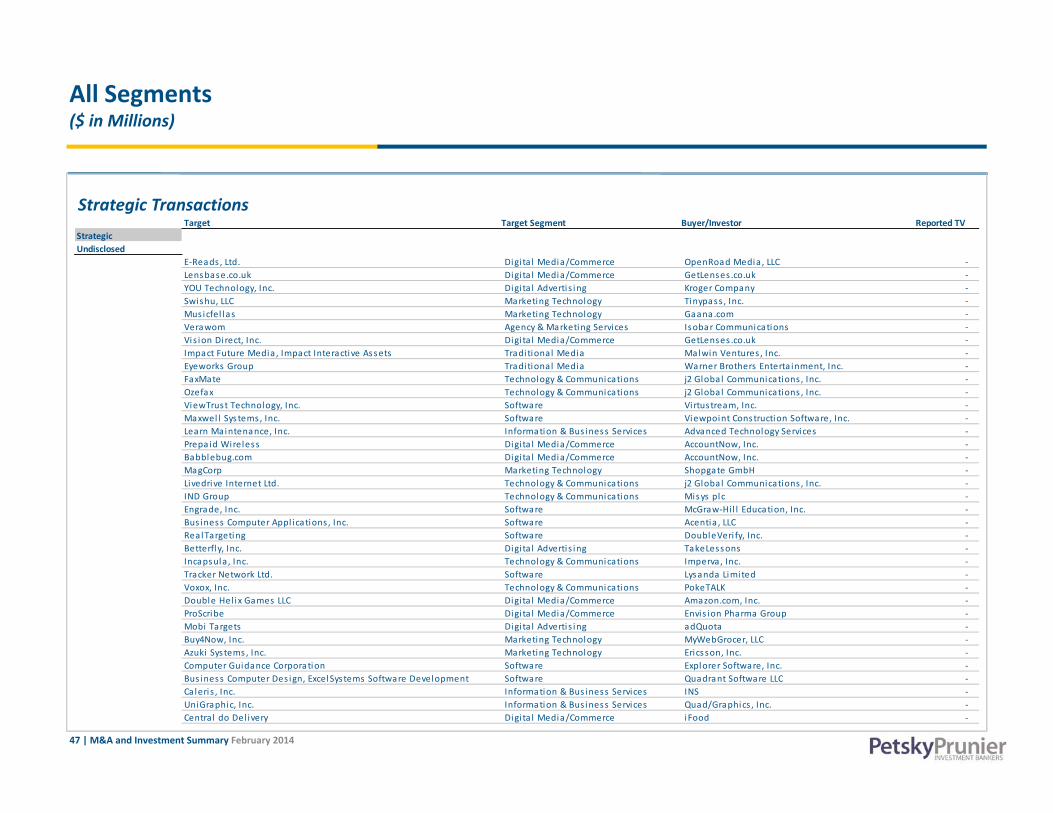
47 | M&A and Investment Summary February 2014
All Segments($ in Millions)
Target Target Segment Buyer/Investor Reported TV StrategicUndisclosed
E‐Reads , Ltd. Digi ta l Media/Commerce OpenRoad Media, LLC ‐ Lensbase.co.uk Digi ta l Media/Commerce GetLenses .co.uk ‐ YOU Technology, Inc. Digi ta l Adverti s ing Kroger Company ‐ Swishu, LLC Marketing Technology Tinypass , Inc. ‐ Musicfel las Marketing Technology Gaana.com ‐ Verawom Agency & Marketing Services Isobar Communications ‐ Vis ion Direct, Inc. Digi ta l Media/Commerce GetLenses .co.uk ‐ Impact Future Media , Impact Interactive Assets Tradi tional Media Malwin Ventures , Inc. ‐ Eyeworks Group Tradi tional Media Warner Brothers Enterta inment, Inc. ‐ FaxMate Technology & Communications j2 Globa l Communications , Inc. ‐ Ozefax Technology & Communications j2 Globa l Communications , Inc. ‐ ViewTrust Technology, Inc. Software Virtustream, Inc. ‐ Maxwel l Sys tems, Inc. Software Viewpoint Construction Software, Inc. ‐ Learn Maintenance, Inc. Information & Bus iness Services Advanced Technology Services ‐ Prepa id Wireless Digi ta l Media/Commerce AccountNow, Inc. ‐ Babblebug.com Digi ta l Media/Commerce AccountNow, Inc. ‐ MagCorp Marketing Technology Shopgate GmbH ‐ Livedrive Internet Ltd. Technology & Communications j2 Globa l Communications , Inc. ‐ IND Group Technology & Communications Misys plc ‐ Engrade, Inc. Software McGraw‐Hil l Education, Inc. ‐ Bus iness Computer Appl ications , Inc. Software Acentia , LLC ‐ RealTargeting Software DoubleVeri fy, Inc. ‐ Betterfly, Inc. Digi ta l Advertis ing TakeLessons ‐ Incapsula, Inc. Technology & Communications Imperva, Inc. ‐ Tracker Network Ltd. Software Lysanda Limited ‐ Voxox, Inc. Technology & Communications PokeTALK ‐ Double Hel ix Games LLC Digi ta l Media/Commerce Amazon.com, Inc. ‐ ProScribe Digi ta l Media/Commerce Envis ion Pharma Group ‐ Mobi Targets Digi ta l Adverti s ing adQuota ‐ Buy4Now, Inc. Marketing Technology MyWebGrocer, LLC ‐ Azuki Systems , Inc. Marketing Technology Ericsson, Inc. ‐ Computer Guidance Corporation Software Explorer Software, Inc. ‐ Bus iness Computer Des ign, ExcelSystems Software Development Software Quadrant Software LLC ‐ Caleris , Inc. Information & Bus iness Services INS ‐ UniGraphic, Inc. Information & Bus iness Services Quad/Graphics , Inc. ‐ Centra l do Del ivery Digi ta l Media/Commerce iFood ‐
Strategic Transactions

48 | M&A and Investment Summary February 2014
All Segments($ in Millions)
Target Target Segment Buyer/Investor Reported TV Buyout DealsValues Disclosed
Medpace, Inc. Information & Bus iness Services CCMP Capita l Advisors , LLC 915.0$ Changepoint, Uniface, CW Profess iona l Services Software Marl in Equity Partners 160.0 Col labNet, Inc. Software Vector Capita l Corporation 100.0
Buyout DealsUndisclosed
The Delta Companies Information & Bus iness Services Mitsui & Company, Ltd. ‐ AFS Technologies , Inc. Software Court Square Capita l Partners ‐ Cal lcredi t Information Group Ltd. Agency & Marketing Services GTCR, LLC ‐ Women's Marketing, Inc. Agency & Marketing Services PNC RiverArch Capita l ‐ General Tools & Instruments LLC Digi ta l Media/Commerce High Road Capita l Partners ‐ Global Healthcare Exchange, LLC Software Thoma Bravo, Inc. ‐
Buyout Transactions

49 | M&A and Investment Summary February 2014
All Segments($ in Millions)
Target Target Segment Buyer/Investor Reported TV VC/Growth CapitalValues Disclosed
Global Logis tic Properties , Inc. Information & Bus iness Services Bank of China Group Investment 2,500.0$ Kronos Incorporated Software The Blackstone Group 750.0 Dropbox Technology & Communications BlackRock, Inc. 350.0 SnapDeal .com Digi ta l Adverti s ing eBay Incorporated 133.7 Domo, Inc. Marketing Technology TPG Growth 125.0 TutorGroup Marketing Technology Al ibaba Group 100.0 17u.cn Digi ta l Media/Commerce Tencent Holdings Ltd. 82.0 Tradeshi ft Software Scentan Ventures 75.0 Tintri , Inc. Technology & Communications Ins ight Venture Partners 75.0 Spiceworks , Inc. Digi ta l Media/Commerce Adams Street Partners , LLC 57.6 ClearSl ide, Inc. Marketing Technology Socia l and Capita l Partnership 50.0 MINDBODY, Inc. Marketing Technology W Capita l Partners 50.0 Cheyipai Digi ta l Media/Commerce Sequoia Capita l 50.0 Kaltura, Inc. Digi ta l Adverti s ing SAP Ventures 47.0 Intacct Corporation Software Battery Ventures 45.0 Elementum SCM Software Lightspeed Venture Partners 44.0 eCommera Limited Marketing Technology Dawn Capita l 41.0 Shape Security, Inc. Software Norwest Venture Partners 40.0 AtTask, Inc. Marketing Technology JMI Equity 38.0 Voalte, Inc. Software Bedford Funding 36.0 Specia l i s ts On Cal l , Inc. Information & Bus iness Services Warburg Pincus LLC 32.0 ZEFR Digi ta l Adverti s ing U.S. Venture Partners 30.0 Avalara Software Battery Ventures 30.0 Jabong.com Digi ta l Media/Commerce CDC Group 27.5 Socia lbakers Marketing Technology Index Ventures 26.0 Ionic Securi ty, Inc. Software Google Ventures 25.5 CloudPassage, Inc. Software Shasta Ventures 25.5 Wel lTok, Inc. Marketing Technology NEA 22.0 Joyme.com Digi ta l Media/Commerce BlueRun Ventures 21.5 Powa Technologies Ltd. Technology & Communications (Private Investors ) 20.7 Trade Desk, Inc. Marketing Technology Hermes Growth Partners 20.0 Cylance, Inc. Software Blacks tone Capita l Partners LP 20.0 ZenPayrol l , Inc. Software Genera l Cata lys t Partners LLC 20.0 FoodPanda Digi ta l Media/Commerce Phenomen Ventures 20.0 Vungle, Inc. Digi ta l Adverti s ing Thomvest 17.0 OUTFITTERY GmbH Digi ta l Media/Commerce Highland Capita l Partners 16.7 Nok Nok Labs , Inc. Software Lenovo Group Limited 16.5 Postmates , Inc. Information & Bus iness Services Spark Capita l 16.0 Char Software, Inc. Marketing Technology Foundation Capita l 16.0 Totango Marketing Technology Canvas Venture Fund 15.5 Newlans , Inc. Technology & Communications Intel Capita l 15.0 UrbanSi tter Digi ta l Adverti s ing DBL Investors 15.0
Venture/Growth Capital Transactions
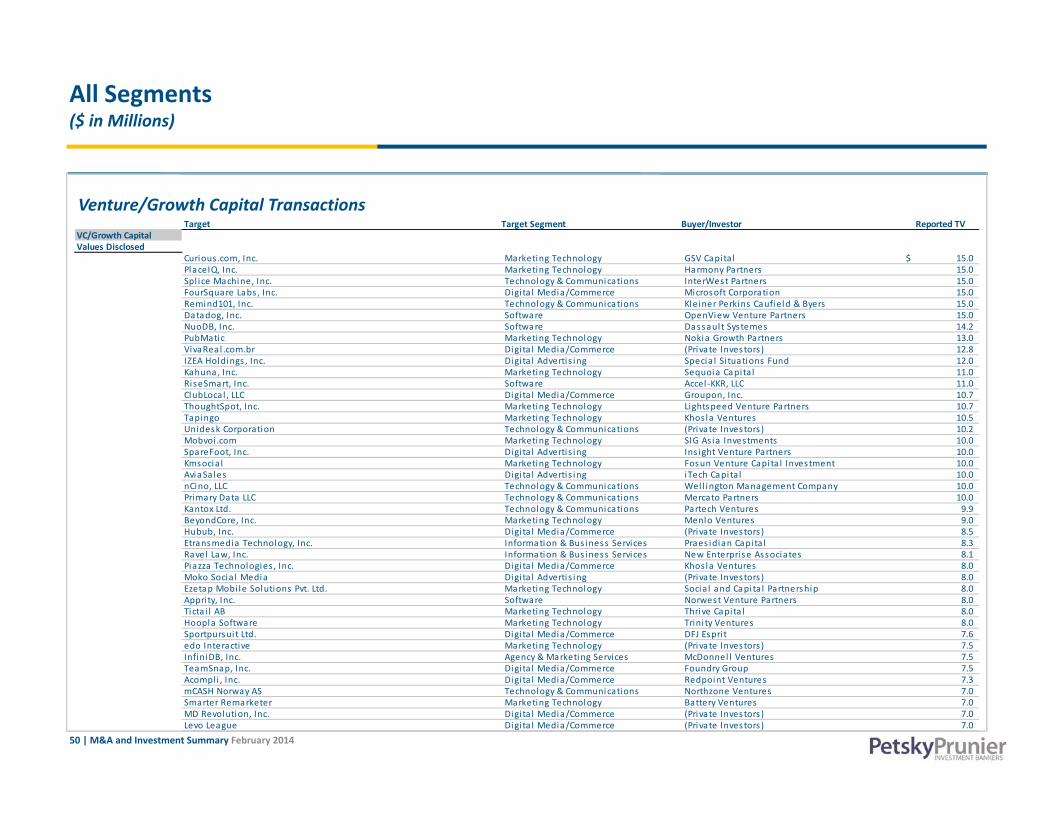
50 | M&A and Investment Summary February 2014
Target Target Segment Buyer/Investor Reported TV VC/Growth CapitalValues Disclosed
Curious .com, Inc. Marketing Technology GSV Capita l 15.0$ PlaceIQ, Inc. Marketing Technology Harmony Partners 15.0 Spl ice Machine, Inc. Technology & Communications InterWest Partners 15.0 FourSquare Labs , Inc. Digi ta l Media/Commerce Microsoft Corporation 15.0 Remind101, Inc. Technology & Communications Kleiner Perkins Caufield & Byers 15.0 Datadog, Inc. Software OpenView Venture Partners 15.0 NuoDB, Inc. Software Dassaul t Systemes 14.2 PubMatic Marketing Technology Nokia Growth Partners 13.0 VivaReal .com.br Digi ta l Media/Commerce (Private Investors ) 12.8 IZEA Holdings , Inc. Digi ta l Adverti s ing Specia l Si tuations Fund 12.0 Kahuna, Inc. Marketing Technology Sequoia Capita l 11.0 RiseSmart, Inc. Software Accel ‐KKR, LLC 11.0 ClubLocal , LLC Digi ta l Media/Commerce Groupon, Inc. 10.7 ThoughtSpot, Inc. Marketing Technology Lightspeed Venture Partners 10.7 Tapingo Marketing Technology Khos la Ventures 10.5 Unidesk Corporation Technology & Communications (Private Investors ) 10.2 Mobvoi .com Marketing Technology SIG Asia Investments 10.0 SpareFoot, Inc. Digi ta l Adverti s ing Ins ight Venture Partners 10.0 Kmsocia l Marketing Technology Fosun Venture Capita l Investment 10.0 AviaSa les Digi ta l Adverti s ing iTech Capita l 10.0 nCino, LLC Technology & Communications Wel l ington Management Company 10.0 Primary Data LLC Technology & Communications Mercato Partners 10.0 Kantox Ltd. Technology & Communications Partech Ventures 9.9 BeyondCore, Inc. Marketing Technology Menlo Ventures 9.0 Hubub, Inc. Digi ta l Media/Commerce (Private Investors ) 8.5 Etransmedia Technology, Inc. Information & Bus iness Services Praes idian Capita l 8.3 Ravel Law, Inc. Information & Bus iness Services New Enterprise Associates 8.1 Piazza Technologies , Inc. Digi ta l Media/Commerce Khos la Ventures 8.0 Moko Socia l Media Digi ta l Adverti s ing (Private Investors ) 8.0 Ezetap Mobi le Solutions Pvt. Ltd. Marketing Technology Socia l and Capita l Partnership 8.0 Apprity, Inc. Software Norwest Venture Partners 8.0 Ticta i l AB Marketing Technology Thrive Capita l 8.0 Hoopla Software Marketing Technology Trini ty Ventures 8.0 Sportpursui t Ltd. Digi ta l Media/Commerce DFJ Espri t 7.6 edo Interactive Marketing Technology (Private Investors ) 7.5 InfiniDB, Inc. Agency & Marketing Services McDonnel l Ventures 7.5 TeamSnap, Inc. Digi ta l Media/Commerce Foundry Group 7.5 Acompl i , Inc. Digi ta l Media/Commerce Redpoint Ventures 7.3 mCASH Norway AS Technology & Communications Northzone Ventures 7.0 Smarter Remarketer Marketing Technology Battery Ventures 7.0 MD Revolution, Inc. Digi ta l Media/Commerce (Private Investors ) 7.0 Levo League Digi ta l Media/Commerce (Private Investors ) 7.0
All Segments($ in Millions)
Venture/Growth Capital Transactions

51 | M&A and Investment Summary February 2014
Target Target Segment Buyer/Investor Reported TV VC/Growth CapitalValues Disclosed
Noom, Inc. Digi ta l Media/Commerce RRE Investors 7.0$ OnShi ft, Inc. Software HLM Venture Partners 7.0 BaseKi t Platform Limited Marketing Technology Eden Ventures 6.8 If You Can Company Digi ta l Media/Commerce GreyLock Partners 6.5 Bitium, Inc. Software Polaris Partners 6.5 Bookmycab.com Digi ta l Media/Commerce Mumbai Angels 6.5 TrackMaven, Inc. Marketing Technology New Enterprise Associates 6.5 Skytap, Inc. Technology & Communications OpenView Venture Partners 6.4 Elastica, Inc. Software Mayfield Fund 6.3 Ski l lshare, Inc. Digi ta l Media/Commerce Union Square Ventures 6.1 Sideband Networks Software (Private Investors ) 6.0 CircleCI, Inc. Software Draper Fisher Jurvetson 6.0 Apartment Lis t Digi ta l Adverti s ing Glynn Capita l Management 6.0 Engagement Labs , Inc. Marketing Technology (Private Investors ) 6.0 Jivox, Inc. Digi ta l Adverti s ing Forti sure Ventures LLC 5.8 Unitas Globa l , LLC Software MK Capita l Management LLC 5.7 Saisei Networks , Pte Ltd. Technology & Communications Oxygen Ventures 5.6 Strevus Information & Bus iness Services Blumberg Capita l 5.6 TraceLink, Inc. Software Fi rs tMark Capita l 5.5 CyberSense, Inc. Software BRM Capita l 5.0 Spree Commerce, Inc. Marketing Technology Thrive Capita l 5.0 BigTinCan Mobile Pty Ltd. Marketing Technology Southern Cross Venture Partners 5.0 Campanja AB Marketing Technology DFJ Espiri t 5.0 Wel lspring Worldwide Software MK Capita l Management LLC 5.0 i socket Digi ta l Adverti s ing R&R Partners , Inc. 5.0 Apportable, Inc. Software Google Ventures 5.0 Cybereason Software Charles River Ventures 4.6 Del iv Information & Bus iness Services Simon Property Group 4.5 EDITD Marketing Technology Index Ventures 4.4 iDevices , LLC Software Stonehenge Capita l Company, LLC 4.3 Granular, Inc. Marketing Technology Andreessen Horowitz 4.2 ThreatStream, Inc. Software Google Ventures 4.0 Front Desk, Inc. Software FLOODGATE Fund LP 4.0 Capi l lary Technologies Ptv. Ltd. Marketing Technology American Express Ventures 4.0 Mojn Ltd. Digi ta l Adverti s ing Northzone Ventures 4.0 TriFort, Inc. Digi ta l Media/Commerce World Innovation Lab 3.9 Docurated, Inc. Marketing Technology Rogers Venture Partners 3.8 YEVVO Digi ta l Adverti s ing Aleph Global 3.7 Resourcing Edge Human Resources Software Centra l Val ley Cable 3.7 FlashNotes , Inc. Digi ta l Media/Commerce Stage 1 Ventures , LLC 3.6 ViSenze Marketing Technology Rakuten Ventures 3.5 myHealthTeams, Inc. Marketing Technology The Westly Group 3.4
All Segments($ in Millions)
Venture/Growth Capital Transactions

52 | M&A and Investment Summary February 2014
Target Target Segment Buyer/Investor Reported TV VC/Growth CapitalValues Disclosed
iCi ti zen Digi ta l Media/Commerce Martin Companies 3.3$ FarFaria Marketing Technology Inventus Capita l Partners 3.3 Bluel iv Software Kibo Ventures 3.2 CounterTack, Inc. Software Siemens Venture Capita l 3.0 CourseHorse Digi ta l Adverti s ing (Private Investors ) 3.0 GuestDriven Digi ta l Media/Commerce Plaza Ventures 3.0 Vars i ty News Network, LLC Digi ta l Media/Commerce Arsenal Capita l Partners , Inc. 3.0 BlueConic, Inc. Marketing Technology Sigma Prime Ventures 3.0 MeraJob India Private Limited Digi ta l Adverti s ing (Private Investors ) 3.0 The Orange Chef Company Digi ta l Media/Commerce Google Ventures 3.0 Workboard, Inc. Software Grani te Ventures , LLC 2.8 Transcriptic, Inc. Software IA Ventures 2.8 PitchPoint Solutions , Inc. Technology & Communications BEST Funds 2.7 CloudOne Corporation Software Bootstrap Venture Fund 2.7 Stoke, Inc. Technology & Communications (Private Investors ) 2.7 The Black Tux, Inc. Digi ta l Media/Commerce Lerer Ventures 2.6 wise.io, Inc. Technology & Communications (Private Investors ) 2.6 npm, Inc. Software True Ventures 2.6 Rocketrip, Inc. Marketing Technology Canaan Partners 2.6 HiConvers ion, Inc. Marketing Technology LB Merchant HC‐2 2.6 Powerl inx, Inc. Digi ta l Media/Commerce (Private Investors ) 2.5 Adar IT Technology & Communications MK Capita l Management LLC 2.4 Rise Labs , Inc. Digi ta l Media/Commerce FLOODGATE Fund LP 2.3 Tapiture Digi ta l Media/Commerce Jump Capita l 2.3 Moti lo Digi ta l Adverti s ing (Private Investors ) 2.2 Opal Labs , Inc. Marketing Technology Oregon Angel Fund 2.1 Magisto Digi ta l Media/Commerce Mai l .Ru 2.0 Archi tizer LLC Digi ta l Adverti s ing Gaspar Global Ventures 2.0 Bloom That, Inc. Digi ta l Media/Commerce (Private Investors ) 2.0 Celery Marketing Technology Y Combinator 2.0 iFood Digi ta l Media/Commerce Movi le 2.0 Jack Erwin, Inc. Digi ta l Media/Commerce Cross l ink Capita l 2.0 Wisembly Software Alven Capita l Partners 2.0 Carwow Digi ta l Media/Commerce Balderton Capita l 2.0 Confide, Inc. Technology & Communications WGI Group 1.9 Boost Communications Digi ta l Adverti s ing Investinor 1.7 SoundFocus Digi ta l Media/Commerce Kapor Capita l 1.7 Little Bird, Inc. Marketing Technology Oregon Angel Fund 1.7 Kl ipfol io, Inc. Marketing Technology BDC Venture Capita l 1.7 Casper Sleep Digi ta l Media/Commerce Norwest Venture Partners 1.6 UXPin Sp. z o.o. Software Andreessen Horowitz 1.6
All Segments($ in Millions)
Venture/Growth Capital Transactions

53 | M&A and Investment Summary February 2014
All Segments($ in Millions)
Target Target Segment Buyer/Investor Reported TV VC/Growth CapitalValues Disclosed
XipLink, Inc. Technology & Communications BEST Funds 1.5$ EdSurge, Inc. Digi ta l Media/Commerce GSV Capita l 1.5 BlueTalon, Inc. Marketing Technology Data Col lective 1.5 VoApps , Inc. Technology & Communications Buckhead Investment Partners 1.5 PrivateGri ffe S.p.a . Digi ta l Media/Commerce VAM Investments 1.5 Bulu Box, Inc. Digi ta l Media/Commerce (Private Investors ) 1.4 Dunwel lo, Inc. Marketing Technology NextView Ventures 1.4 DataRank, Inc. Marketing Technology The Founders Club 1.4 Little Borrowed Dress , Inc. Digi ta l Media/Commerce Index Ventures 1.3 Askem TLV Ltd. Digi ta l Media/Commerce Microsoft Ventures 1.3 PredicSis Technology & Communications Innovacom 1.3 ArborMetrix, Inc. Software Renaissance Venture Capita l 1.3 ArborMetrix, Inc. Software Renaissance Venture Capita l 1.3 Dash Software, LLC Marketing Technology New York Angels , Inc. 1.2 Crayon Data Pte. Ltd. Technology & Communications Jungle Ventures 1.2 PandoDai ly Digi ta l Media/Commerce VegasTechFund 1.2 LoginRadius , Inc. Marketing Technology BDC Venture Capita l 1.2 atVenu, Inc. Marketing Technology Rea l Ventures 1.1 Easy Socia l Shop Marketing Technology lool ventures 1.1 Newscrafted LLC Information & Bus iness Services Broadmark Capita l , LLC 1.1 TradeYa! Digi ta l Media/Commerce (Private Investors ) 1.1 Options Away, LLC Digi ta l Adverti s ing (Private Investors ) 1.1 Opternative, Inc. Digi ta l Media/Commerce Chicago Ventures 1.0 Beat the Q Pty Ltd. Digi ta l Media/Commerce (Private Investors ) 1.0 Kanga Information & Bus iness Services (Private Investors ) 1.0 AdStage, Inc. Marketing Technology Digi ta l Garage, Inc. 1.0 Kanvas Labs , Inc. Digi ta l Media/Commerce Dace Ventures LLC 1.0 Brand Embassy Ltd. Marketing Technology Rockaway Capita l 1.0 Lai la ihui .com Digi ta l Media/Commerce CDH Investments 1.0 Donde, Inc. Marketing Technology Mercury Fund 1.0 Watchup, Inc. Digi ta l Adverti s ing Microsoft Ventures 1.0
Venture/Growth Capital Transactions

54 | M&A and Investment Summary February 2014
All Segments($ in Millions)
Target Target Segment Buyer/Investor Reported TV VC/Growth CapitalUndisclosed
Yeapoo Marketing Technology Intel Capita l ‐ Ramen Software (Private Investors ) ‐ China Cloud Software Intel Capita l ‐ BlueWhale Software Intel Capita l ‐ etta in group, Inc. Information & Bus iness Services New MainStream Capita l , LP ‐ Spire Technologies & Solutions Technology & Communications (Private Investors ) ‐ Clari ty Software Solutions , Inc. Software North Bridge Venture Partners ‐ Daxko, Inc. Marketing Technology Paml ico Capita l ‐ Transzap, Inc. Software Accel ‐KKR, LLC ‐ Tonic Health Software Hearst Health ‐ On Time Technologies Pvt. Ltd. Digi ta l Media/Commerce Celkon Mobi les ‐ MaintenanceNet, Inc. Software Kayne Partners ‐ Madison Plus Select, Inc. Digi ta l Media/Commerce (Angel Investors ) ‐ Storyvine, Inc. Digi ta l Media/Commerce Pavonis Capita l ‐ Encore Marketing Technology CIT Gap Funds ‐ RestOpol i s s .r.l Digi ta l Adverti s ing (Angel Investors ) ‐ Revionics , Inc. Marketing Technology Motorola Solutions Venture Capita l ‐ abus ix GmbH Software Target Partners ‐ Bluefly, Inc. Digi ta l Media/Commerce CrunchFund ‐ KPI Consul ting (Assets ) Marketing Technology Perigee Capita l Partners ‐ Platfora, Inc. Marketing Technology Ci ti Venture Capita l Internationa l ‐ DeviceAuthori ty, Inc. Software Alsop Louie Partners ‐ CoPromote Marketing Technology ff Venture Capita l ‐ AVAST Software a.s . Software CVC Capita l Partners Ltd. ‐ Mech Mocha Game Studios Digi ta l Media/Commerce CIIE ‐ DataMentors , Inc. Marketing Technology Brook Venture Partners ‐ e.l .f. Cosmetics Digi ta l Media/Commerce TPG Growth ‐ RedZebra Analytics Ltd. Agency & Marketing Services SBT Venture Capita l ‐
Venture/Growth Capital Transactions

55 | M&A and Investment Summary February 2014
Petsky Prunier: Maximizing Shareholder Value
Overview
Founded in 1999 Focused on the technology, marketing, media, eCommerce, and healthcare industries
• More than 35 focused professionals Unique combination of investment banking and consulting expertise New York, Palo Alto, Las Vegas, Chicago, Boston, Tampa Sell‐side and private placement close rate is unmatched at our level of deal volume Deep relationships across a broad spectrum of venture capital and private equity groups, lenders and strategic buyers With strategic consulting firm Winterberry Group, one of the largest industry‐specific advisors providing strategic and transactional
services International reach enhanced through our partnership with investment bank Altium, which operates from eight offices across Europe Securities transactions processed through Petsky Prunier Securities LLC, a licensed broker‐dealer
Sell‐Side Representation Capital Raising and Private Placements Corporate Divestitures M&A Advisory Fairness Opinions
Strategic Development and Competitive Analysis M&A Transaction Due Diligence Support and
Valuation Analysis Acquisition Strategy and Target Identification Publishing and Thought Leadership
Technology Marketing Media eCommerce Healthcare
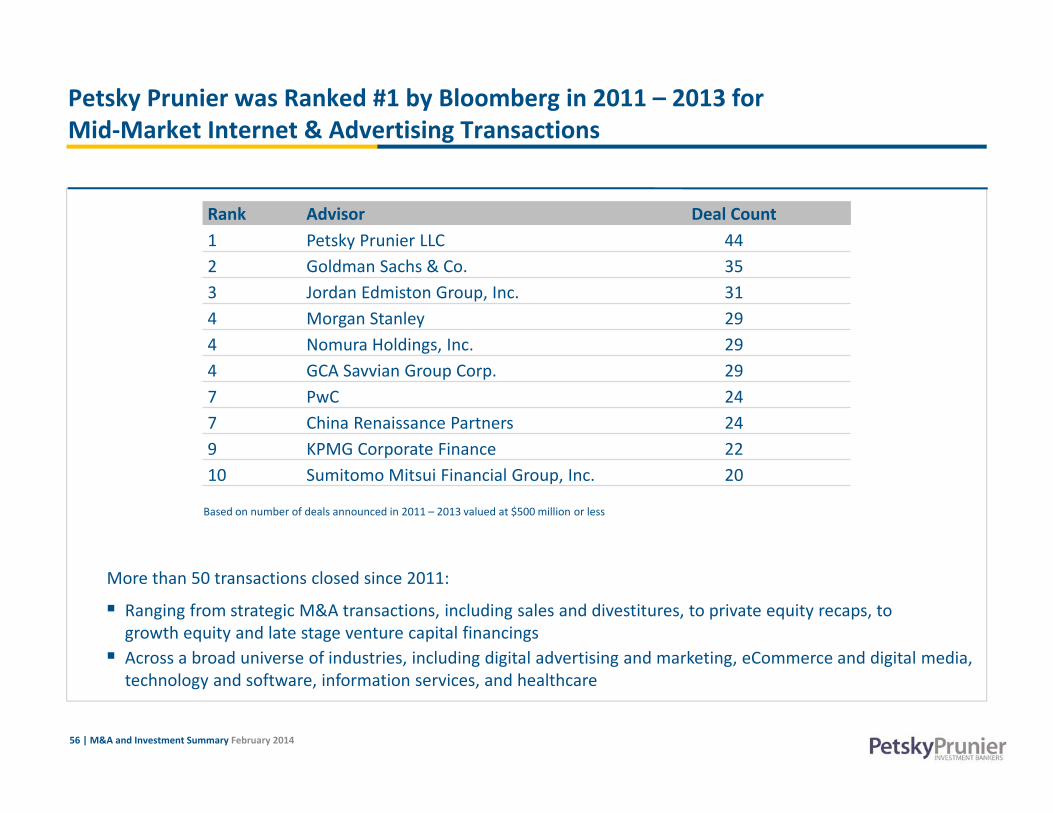
56 | M&A and Investment Summary February 2014
Petsky Prunier was Ranked #1 by Bloomberg in 2011 – 2013 for Mid‐Market Internet & Advertising Transactions
Rank Advisor Deal Count1 Petsky Prunier LLC 442 Goldman Sachs & Co. 353 Jordan Edmiston Group, Inc. 314 Morgan Stanley 294 Nomura Holdings, Inc. 294 GCA Savvian Group Corp. 297 PwC 247 China Renaissance Partners 249 KPMG Corporate Finance 2210 Sumitomo Mitsui Financial Group, Inc. 20
Based on number of deals announced in 2011 – 2013 valued at $500 million or less
More than 50 transactions closed since 2011:
Ranging from strategic M&A transactions, including sales and divestitures, to private equity recaps, to growth equity and late stage venture capital financings Across a broad universe of industries, including digital advertising and marketing, eCommerce and digital media,
technology and software, information services, and healthcare

57 | M&A and Investment Summary February 2014
International Partnership with Altium
Description Network
Altium provides M&A and corporate finance advisory services to companies, private equity firms, and entrepreneurs
European‐based, mid‐market financial advisory group, employee‐owned and truly independent
A leading advisor for more than 25 years
Founded as the corporate finance arm of private equity investor Apax Partners
Operates eight international offices in Europe with additional partnerships in the U.S. and Asia
Completed 50+ technology transactions across 12 countries in the past five years
Allegro Advisors is a leading provider of investment banking services to corporations and public institutions in India with offices in Bangalore, Mumbai, Delhi
Hina Group has provided M&A advisory and corporate finance services on 50+ transactions in China
BeijingShanghai
New York Palo AltoLas Vegas ChicagoBoston Tampa
India
Madrid ManchesterLondonParis
Zurich FrankfurtMilanMunich

58 | M&A and Investment Summary February 2014
a leading provider of online customer acquisition services to the
insurance industry
has been sold to
(NYSE: RATE)
has sold
specializing in retail, digital, shopper marketing and consumer services
to
along with digital subsidiary
has been sold to
a leading digital advertising monetization and shopper marketing partner for e‐commerce
retailers
with financing from
a portfolio company of
has sold
provider of online travel guides for top destinations around the world
to
(NYSE: GCI )
a provider of a cloud‐based integration platform for the digital marketing industry
has received $15MM financing led by
a leader in technology and global in‐app advertising for Facebook,
Apple (iOS), and Android developers
has received $66M investmentfrom
a leading digital direct marketing company utilizing a proprietary database to provide
customer acquisition solutions formajor brands
has received an equity investment from
with debt financing from
Representative Recent Transactions
has been sold to
the top independentdirect‐to‐consumer marketer of
dental savings planshas been sold to
a leader in global healthcare primary market research and influence
network mapping
a portfolio company of
a leader in multichannel retail, ecommerce and loyalty marketing
services
has been sold to
a leading provider of taxi‐based outdoor media
has been sold to
(NYSE: PAY)
has sold
and
leading provider of services for domain name registration, acquisition, brokerage
and salesto
has been sold to
a leading provider of digital production services to brands and agencies
(NYSE: ACN)
has been acquired by
a real‐time behavioral advertising company
(NYSE: AOL)
has been sold to
a leading provider of in‐store and shopper marketing signage to major North American retailers has received a mezzanine debt
investment from
a leading provider of transportation‐based digital media networks
has been acquired by
a dynamic display media andretargeting company
(JASDAQ:4755)
has been sold to
a premier global provider of SaaS‐based online brand protection and domain recovery solutionsa portfolio company of
(Euronext Amsterdam: WKL)
a leading UK‐based supplier of healthcare software and IT services
a portfolio company of
(AIM: EMIS)
has been sold to
a leading provider of data‐driven enrollment marketing solutions to
higher education institutions
has acquired select assets of
has been sold to
one of the largest digital agencies
(Nasdaq: RNWK)(ENXTPA: PUB)
has received a $68MM minority investment from
a leading provider of social software solutions and digital marketing services for some of the world’s largest brands, one of just thirteen Facebook Strategic Preferred Marketing Developers (sPMD)
has been sold to
a leading developer of popular real‐money and social gaming
(Nasdaq: RNWK)
has been sold to
the largest provider of cloud‐based SaaS tools for printing signs, labels and tags,
and publishing digital displays for retailers
a unit of
(NYSE: LXK )
a leading SaaS‐based, cross channel campaign management platform
for B2C marketers
has been sold to
a leading provider of transaction‐based media cost databases and software for television, radio, and digital
advertising cost analysis
has been sold to
a technology company delivering highly targeted programmatic marketing solutions using unstructured data
has received a $16MM Series B investment led by
has received a double‐digit million Euro investment led by
a Berlin‐based worldwide travel solution provider for premium transportation
one of the largest independentin‐store media companies in the U.S.
has been sold to
has sold
a portfolio company of
toSample Management Business
a consumer enthusiast mediaand commerce company
has been sold to
the largest independent eCommerce retailer of promotional products
has been sold to