Embed Size (px)
Citation preview

June 2011 Marketing, Media, Technology, and Services M&A & Investment Summary
Expertise Commitment ResultsExpertise. Commitment. Results.
TABLE OF CONTENTS
Overview of Monthly M&A and Investment Activity 3
Monthly M&A and Investment Activity by Industry Segment 6
Additional Monthly M&A and Investment Activity Data 24
About Petsky Prunier 31
2M&A & INVESTMENT SUMMARY JUNE 2011

MARKETING, MEDIA, TECHNOLOGY, AND SERVICE INDUSTRIES
A t t l f 210 d l th i t l $5 4 billi d i J 2011
Transaction Distribution
• A total of 210 deals worth approximately $5.4 billion were announced in June 2011
• Digital Media/Commerce was the most active segment with 94 transactions
• Digital Media/Commerce was also the highest value segment worth approximately $2.3 billion
• Strategic buyers announced 84 deals for approximately $3.1 billion (40% of total volume)
• VC/Growth Capital investors announced 125 deals for approximately $2.1 billion
• Buyout investors announced 1 deal
JUNE 2011
BUYER/INVESTOR BREAKDOWN
Transactions Est. Value Strategic Buyout Venture/Growth Capital
# % $MM % # $MM # $MM # $MM
Digital Media/Commerce 94 45% 2,298.9 42% 31 747.0 0 0.0 63 1,551.9
Marketing Technology 44 21% 1,527.4 28% 19 1,285.0 0 0.0 25 242.4
Software & Information 35 17% 1,005.7 18% 11 806.4 0 0.0 24 199.3
Digital Advertising 16 8% 186.6 3% 8 93.0 0 0.0 8 93.6
Agency/Consulting 15 7% 195.0 4% 12 178.0 0 0.0 3 17.0
$18.3 $18 0 $20.0
)
Marketing, Media, Technology, and Service Industries M&A and Investment Volume - Last 13 Months
Agency/Consulting 15 7% 195.0 4% 12 178.0 0 0.0 3 17.0
Marketing Services 6 3% 224.9 4% 3 23.0 1 200.0 2 1.9
Total 210 100% 5,438.4 100% 84 3,132.5 1 200.0 125 2,106.0
$2.3 $3.9 $3.0
$5.8
$3.0
$9.7 $7.3
$8.8
$5.9
$10.8
$14.6
$5.4
$2 0 $4.0 $6.0 $8.0
$10.0 $12.0 $14.0 $16.0 $18.0
Val
ue
($ in
bil
lio
ns)
$8.5Skype/ MSFT
3M&A & INVESTMENT SUMMARY JUNE 2011
$-$2.0
Jun-10 Jul-10 Aug-10 Sep-10 Oct-10 Nov-10 Dec-10 Jan-11 Feb-11 Mar-11 Apr-11 May-11 Jun-11
21076 238 25449 65 148 177 24664 89 208199

($ in Millions)
SELECTED TRANSACTIONS WITH VALUATION INFORMATION DISCLOSED AND IPOS AFTER FINAL PRICING
Target Subsegment Buyer/Investor Ent. Value Rev EBITDA EV/REV EV/EBITDA
Digital Media/CommerceMyprotein.com(1) eCommerce The Hut Group $94.9 $41.1 - 2.3x NABetsafe.com(2) Gaming Betsson AB 84.5 44.5 - 1.9x NAi-POP Networks(3) Mobile Content/Apps InternetQ 3.6 9.3 - 0.4x NA
Marketing Technology
Selected Transactions With Multiples Information
MediaMind Technologies, Inc.(4) Media Management System DG FastChannel 414.0 83.7 14.8 4.9x 28.0x
Software & InformationMedical Present Value(5) Healthcare Providers Software Experian plc 185.0 22.2 - 8.3x NANed Davis Research Group(6) Financial Euromoney Institutional Investor plc 128.7 69.2 - 1.9x NAOpthalmic Imaging Systems Healthcare Providers Software Merge Healthcare 32.7 18.0 (3.5) 1.8x NM
Target Subsegment Buyer/Investor Ent. Value Rev EBITDA EV/REV EV/EBITDAIPOs After Final Pricing*
Bankrate, Inc. Financial IPO $1,791.2 $285.2 $92.9 6.3x 19.3xHomeAway, Inc. Classifieds/Auctions/P-to-P IPO 2,160.0 183.7 32.7 11.8x 66.1xPandora Media, Inc. Social Media/Apps IPO 2,498.9 137.8 (0.1) 18.1x NMTaomee Holdings Ltd. Gaming IPO 313.3 41.9 22.3 7.5x 14.1x
(1) Revenue per The Hut Group, 06/01/2011(2) Revenue per thenuts.com , 05/13/2011(3) Revenue per The Wall Street Journal , 06/08/2011(4) R d EBITDA M di Mi d T h l i 10 K fil d 5/16/2011(4) Revenue and EBITDA per MediaMind Technologies 10-K, filed 5/16/2011(5) Revenue per statesman.com , 06/28/2011(6) Revenue per Integrity Research, 06/23/2011*IPO Multiples based on most recent financials and pro forma balance sheets according to S-1 filings
4M&A & INVESTMENT SUMMARY JUNE 2011

($ in Millions)IPO PIPELINE
Aggregate Company Name Segment Offering Value Rev Adj. EBITDA
Securities in Registration (as of 6/30/11)
LTM
Groupon* Digital Media/Commerce $750.0 713.4 NM
Newgistics Fulfillment 86.3 174.6 18.2
Reply.com Online Lead Generation 60.0 38.3 8.1
Zillow Online Lead Generation 51.8 30.5 0.1
Kayak.com Vertical Search 50.0 112.7 16.2
* Fil d J 2011* Filed June 2011
Initial Offering Final Price Stock Price at Close Stock Price on
Date Ticker Company Name Country Price Range Per Share on 1st Trading Day Jun 30, 2011
Jun-11 RATE Bankrate, Inc. United States $14.00 - $16.00 $15.00 16.44, up 9.6% $16.58
Jun-11 AWAY HomeAway United States 25.00 - 27.00 27.00 40.21, up 49% 38.70
Jun-11 P Pandora United States 10.00 - 12.00 17.42 17.42, down 13% 18.91
Jun-11 TAOM Taomee Holdings Ltd. China 9.00 - 11.00 9.00 8.23, down 8% 10.24
IPO Performance
May-11 LNKD LinkedIn Corp. United States 12.00 - 14.00 11.00 14.75, up 34% 90.09
May-11 FENG Phoenix New Media United States 12.00 - 14.00 14.00 18.01, up 29% 8.97
May-11 RENN RenRen Inc. United States 22.00 - 24.00 25.00 38.84, up 55% 8.85
May-11 ACTV The Active Network United States 16.00 - 18.00 15.00 15.9, up 6% 17.60
May-11 DATE Jiayuan.com International United States 10.00 - 12.00 11.00 10.52, down 4% 11.43
May-11 NQ NetQin Mobile India 32.00 - 35.00 45.00 94.25, up 109% 5.50
May-11 YNDX Yandex China 9.50 - 11.50 11.50 9.30, down 19% 35.51
Apr-11 MKTG Responsys United Kingdom 8.50 - 10.00 12.00 15.40, up 28% 17.73
Mar-11 QIHU Qihoo 360 Technology United States 10.50 - 12.50 14.50 34.00, up 134% 19.41
Mar-11 SREV ServiceSource International China 7.50 - 9.00 10.00 12.18, up 22% 22.22
Mar-11 CSOD Cornerstone OnDemand China 9.00 - 11.00 13.00 19.07, up 47% 17.65
Feb-11 EPOC Epocrates, Inc. China 13.00 - 15.00 16.00 21.96, up 37% 18.44
Jan-11 VELT Velti Plc China 9.00 - 11.00 12.00 15.58, up 30% 16.91
Jan-11 NLSN Nielsen Holdings B.V. Netherlands 20.00 - 22.00 23.00 25.00, up 9% 31.16
Jan-11 DMD Demand Media, Inc. United States 14.00 - 16.00 17.00 22.65, up 33% 13.55
Dec-10 ISS Isoftstone Holdings Ltd. China 11.00 - 13.00 13.00 16.62, up 28% 15.31
Dec-10 MOBI Sky-mobi Ltd. China 8.00 - 10.00 8.00 6.00, down 25% 7.30
Dec-10 DANG E-Commerce China Dangdang China 13.00 - 15.00 16.00 29.91, up 87% 11.59
Dec-10 YOKU Youku.com China 9.00 - 11.00 12.80 33.44, up 161% 34.35
Nov-10 BAH Booz Allen Hamilton United States 17.00 - 19.00 17.00 19.50, up 15% 19.11
Oct-10 BET Betfair Group United Kingdom 19.72 - 20.50 20.49 24.29, up 19% 12.15
Sep-10 CCIH ChinaCache International Holdings China 10.00 - 12.00 13.90 27.15, up 95% 9.26
Aug-10 MMYT MakeMyTrip Ltd. India 12.00 - 14.00 14.00 26.45, up 89% 24.50
Aug-10 MDMD MediaMind Technologies United States 14.00 - 16.00 11.50 11.00, down 4% 21.94
5M&A & INVESTMENT SUMMARY JUNE 2011
Jul-10 GDOT Green Dot Corp. United States 32.00 - 35.00 36.00 44.99, up 25% 33.98
Jul-10 QLIK Qlik Technologies United States 8.50 - 9.50 10.00 14.06, up 41% 34.06
Jun-10 MOTR Motricity United States 10.00 - 11.00 10.00 9.26, down 7% 7.73

Transactions by Segment and Buyer TypeDIGITAL ADVERTISING
• Ad Networks/Exchanges and Online Lead Generation were the most active subsegments, each with six transactions. With $101 million, Ad Networks/Exchanges was the highest value subsegment
• Select acquisitions› YuMe Networks’ acquisition of Appealing Media, a UK-based mobile video advertising and rich media ad
network› One to One Global’s acquisition of Renu Mobile Technologies, a mobile marketing agency
• Select investments› The $50 million investment in Seamlessweb, led by Spectrum Equity Investors› The $20 million growth capital investment in Animoto, which offers a platform to create video slideshows, led
by Madrona Venture Groupby Madrona Venture Group› The venture capital investment in Shopobot, a retail price-tracking company, led by Google Ventures
BUYER/INVESTOR BREAKDOWN
Transactions Est Value Strategic Buyout Venture/Growth Capital
DIGITAL ADVERTISING TRANSACTIONS BY SEGMENT
# % $MM % # $MM # $MM # $MM
Ad Networks/Exchanges 6 38% 101.0 54% 5 51.0 0 0.0 1 50.0
Online Lead Generation 6 38% 23.6 13% 0 0.0 0 0.0 6 23.6
Digital Video 1 6% 20.0 11% 0 0.0 0 0.0 1 20.0
Mobile Marketing 1 6% 15.0 8% 1 15.0 0 0.0 0 0.0
S h M k ti 1 6% 20 0 11% 1 20 0 0 0 0 0 0 0
Transactions Est. Value Strategic Buyout Venture/Growth Capital
Search Marketing 1 6% 20.0 11% 1 20.0 0 0.0 0 0.0
Email Services 1 6% 7.0 4% 1 7.0 0 0.0 0 0.0Total 16 100% 186.6 100% 8 93.0 0 0.0 8 93.6
6M&A & INVESTMENT SUMMARY JUNE 2011
DIGITAL ADVERTISING PUBLIC COMPANY VALUATION
Stock Price Chg % From Equity Ent LTM LTM Margin LTM LTM Multiples
($ in millions, except stock price data)
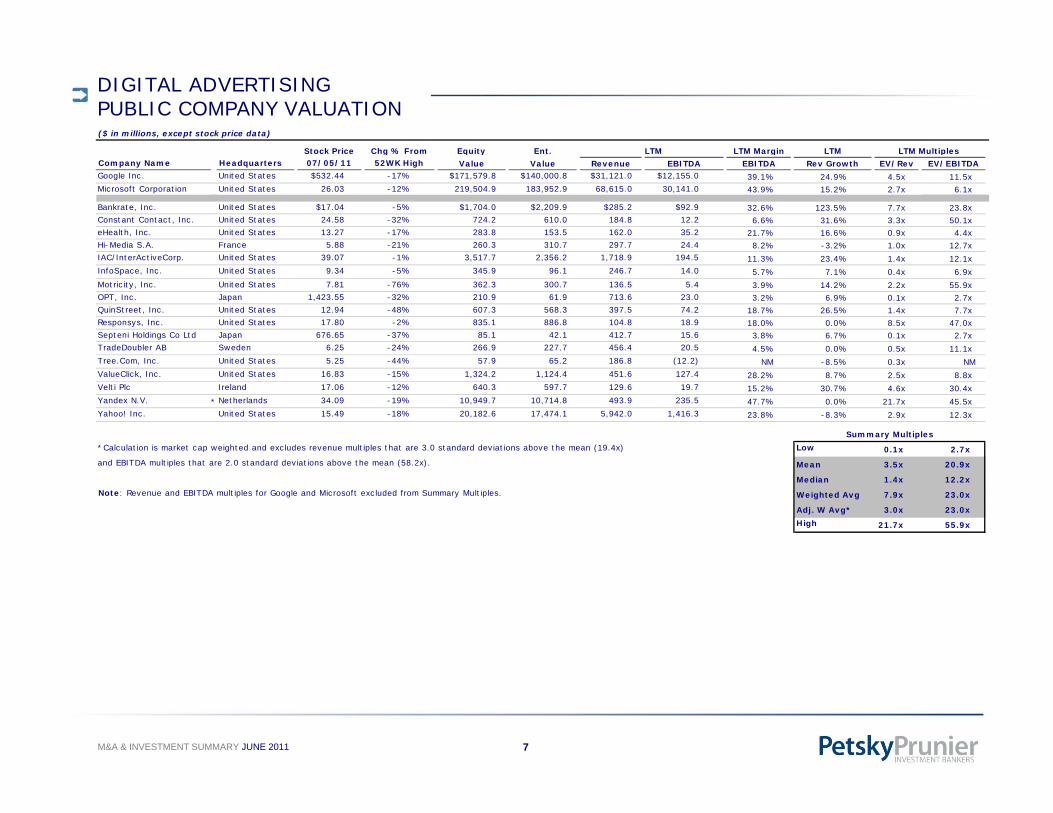
Stock Price Chg % From Equity Ent. LTM LTM Margin LTM LTM Multiples Company Name Headquarters 07/05/11 52WK High Value Value Revenue EBITDA EBITDA Rev Growth EV/Rev EV/EBITDAGoogle Inc. United States $532.44 -17% $171,579.8 $140,000.8 $31,121.0 $12,155.0 39.1% 24.9% 4.5x 11.5xMicrosoft Corporation United States 26.03 -12% 219,504.9 183,952.9 68,615.0 30,141.0 43.9% 15.2% 2.7x 6.1x
Bankrate, Inc. United States $17.04 -5% $1,704.0 $2,209.9 $285.2 $92.9 32.6% 123.5% 7.7x 23.8xConstant Contact, Inc. United States 24.58 -32% 724.2 610.0 184.8 12.2 6.6% 31.6% 3.3x 50.1xeHealth, Inc. United States 13.27 -17% 283.8 153.5 162.0 35.2 21.7% 16.6% 0.9x 4.4xHi-Media S.A. France 5.88 -21% 260.3 310.7 297.7 24.4 8.2% -3.2% 1.0x 12.7xIAC/InterActiveCorp. United States 39.07 -1% 3,517.7 2,356.2 1,718.9 194.5 11.3% 23.4% 1.4x 12.1xInfoSpace, Inc. United States 9.34 -5% 345.9 96.1 246.7 14.0 5.7% 7.1% 0.4x 6.9xMotricity, Inc. United States 7.81 -76% 362.3 300.7 136.5 5.4 3.9% 14.2% 2.2x 55.9xOPT, Inc. Japan 1,423.55 -32% 210.9 61.9 713.6 23.0 3.2% 6.9% 0.1x 2.7xQuinStreet, Inc. United States 12.94 -48% 607.3 568.3 397.5 74.2 18.7% 26.5% 1.4x 7.7xResponsys, Inc. United States 17.80 -2% 835.1 886.8 104.8 18.9 18.0% 0.0% 8.5x 47.0xSepteni Holdings Co Ltd Japan 676.65 -37% 85.1 42.1 412.7 15.6 3.8% 6.7% 0.1x 2.7xTradeDoubler AB Sweden 6.25 -24% 266.9 227.7 456.4 20.5 4.5% 0.0% 0.5x 11.1xTree.Com, Inc. United States 5.25 -44% 57.9 65.2 186.8 (12.2) NM -8.5% 0.3x NMValueClick, Inc. United States 16.83 -15% 1,324.2 1,124.4 451.6 127.4 28.2% 8.7% 2.5x 8.8xVelti Plc Ireland 17.06 -12% 640.3 597.7 129.6 19.7 15.2% 30.7% 4.6x 30.4xYandex N.V. * Netherlands 34.09 -19% 10,949.7 10,714.8 493.9 235.5 47.7% 0.0% 21.7x 45.5xYahoo! Inc. United States 15.49 -18% 20,182.6 17,474.1 5,942.0 1,416.3 23.8% -8.3% 2.9x 12.3x
Low 0.1x 2.7x
Summary Multiples*Calculation is market cap weighted and excludes revenue multiples that are 3.0 standard deviations above the mean (19.4x)
Mean 3.5x 20.9x
Median 1.4x 12.2x
Weighted Avg 7.9x 23.0x
Adj. W Avg* 3.0x 23.0xHigh 21.7x 55.9x
and EBITDA multiples that are 2.0 standard deviations above the mean (58.2x).
Note: Revenue and EBITDA multiples for Google and Microsoft excluded from Summary Multiples.
7M&A & INVESTMENT SUMMARY JUNE 2011

AGENCY/CONSULTINGTransactions by Segment and Buyer Type
• Digital Agency was the most active and highest value subsegment with seven transactions worth $99 million• Select acquisitions
› Charm Communications’ acquisition of ClickPro, a performance and search engine marketing firm› CREATETHE GROUP’s acquisition of Morpheus Media, a digital strategy and media agency providing marketing
solutionssolutions› Yellow Pages Group’s acquisition of UPTREND Media, an online advertising representation company providing
contextual-based interactive marketing services• Select investments
› The $7 million venture capital investment in OwnerIQ, which provides a real-time media buying platform, led by Atlas Ventureby Atlas Venture
# % $MM % # $MM # $MM # $MM
Digital Agency 7 47% 99.0 51% 6 90.0 0 0.0 1 9.0
P bli R l i 2 13% 27 0 14% 2 27 0 0 0 0 0 0 0
BUYER/INVESTOR BREAKDOWN
Transactions Est. Value Strategic Buyout Venture/Growth Capital
AGENCY/CONSULTING TRANSACTIONS BY SEGMENT
Public Relations 2 13% 27.0 14% 2 27.0 0 0.0 0 0.0
Social Agency 2 13% 30.0 15% 2 30.0 0 0.0 0 0.0
DM Agency 1 7% 11.0 6% 1 11.0 0 0.0 0 0.0
Experiential Marketing 1 7% 20.0 10% 1 20.0 0 0.0 0 0.0
Media Planning/Buying 1 7% 7.0 4% 0 0.0 0 0.0 1 7.0
Specialty Agency 1 7% 1.0 1% 0 0.0 0 0.0 1 1.0
Total 15 87% 195.0 96% 12 178.0 0 0.0 3 17.0
8M&A & INVESTMENT SUMMARY JUNE 2011

AGENCY/CONSULTINGPUBLIC COMPANY VALUATION
Stock Price Chg % From Equity Ent LTM Margin LTM LTM Multiples LTM
($ in millions, except stock price data)
Stock Price Chg % From Equity Ent. LTM Margin LTM LTM Multiples Company Name Headquarters 06/30/11 52WK High Value Value Revenue EBITDA EBITDA Rev Growth EV/Rev EV/EBITDAAegis Group plc United Kingdom $2.57 -9% $3,234.6 $3,709.8 $2,278.7 $231.6 10.2% 8.4% 1.6x 16.0xCello Group Plc United Kingdom 0.65 -37% 50.7 65.4 195.1 12.6 6.5% 1.0% 0.3x 5.2xCharm Communications Inc. *China 11.90 -6% 465.8 336.5 212.7 - NM 71.9% 1.6x NAChime Communications plc United Kingdom 4.45 -8% 342.4 330.0 468.1 39.9 8.5% -0.4% 0.7x 8.3xDentsu Inc. Japan 29.39 -15% 7,322.2 7,165.1 22,125.7 833.2 3.8% 9.2% 0.3x 8.6xHavas France 5.34 -15% 2,300.9 2,179.0 2,089.2 320.5 15.3% 8.1% 1.0x 6.8x
LTM
Huntsworth plc United Kingdom 1.17 -16% 286.3 371.5 271.1 50.4 18.6% 11.1% 1.4x 7.4xIPG United States 12.50 -6% 6,108.7 6,531.5 6,669.7 713.8 10.7% 10.4% 1.0x 9.2xM&C Saatchi plc United Kingdom 2.14 -12% 133.6 89.7 195.4 22.3 11.4% 21.0% 0.5x 4.0xMDC Partners Inc. Canada 18.03 -6% 522.7 987.9 779.4 71.0 9.1% 40.6% 1.3x 13.9xmktg, inc. United States 0.80 -38% 6.8 3.4 117.9 5.2 4.4% 51.1% 0.0x 0.7xNext Fifteen Communications Group plc United Kingdom 1.33 -3% 73.3 80.6 126.5 15.6 12.3% 19.4% 0.6x 5.2xOmnicom Group Inc. United States 48.16 -6% 13,538.8 15,907.4 12,773.8 1,891.8 14.8% 7.4% 1.2x 8.4xPh t G Li it d A t li 0 04 71% 66 1 253 2 589 8 45 2 Photon Group Limited Australia 0.04 -71% 66.1 253.2 589.8 45.2 7.7% -7.2% 0.4x 5.6xPublicis Groupe SA France 55.83 -8% 10,189.4 10,095.0 7,265.2 1,296.7 17.8% 19.8% 1.4x 7.8xSapient Corp. *United States 15.03 -3% 2,073.1 1,869.1 921.7 96.9 10.5% 30.0% 2.0x 19.3xWPP plc Ireland 12.53 -10% 15,583.7 18,939.8 14,569.4 2,146.9 14.7% 7.4% 1.3x 8.8x
Low 0.0x 0.7x
Mean 1.0x 8.4x
*Calculation is market cap weighted and excludes revenue multiples that are 3.0 standard deviations above the mean (2.7x)
and EBITDA multiples that are 2.0 standard deviations above the mean (17.7x).
Summary Multiples
Median 1.0x 8.0x
Weighted Avg 1.2x 9.2x
Adj. W Avg* 1.2x 8.9xHigh 2.0x 19.3x
9M&A & INVESTMENT SUMMARY JUNE 2011

DIGITAL MEDIA/COMMERCETransactions by Segment and Buyer Type
• Social Media/Apps was the most active subsegment with 25 transactions worth approximately $392.8 million. With $566.1 million, eCommerce was the highest value subsegment
• Select acquisitions› The Hut Group’s $94.9 million acquisition of MyProtein.com, a U.K.-based eCommerce site for sports nutrition
products› eBay’s $90 million acquisition of Magento, an open-source eCommerce platform that allows merchants to
control the look, content, and functionality of their online store› Specific Media’s $35 million acquisition of social network Myspace
• Select investments› The $306 million investment in Qunar com a China based travel search engine Qunar which allows users to › The $306 million investment in Qunar.com, a China-based travel search engine Qunar, which allows users to
search for air and rail tickets, hotels, and tour packages, from Baidu.com› The $165 million venture capital investment in CSN Stores, the second-largest online retailer of home goods
in the U.S., led by Battery Ventures
BUYER/INVESTOR BREAKDOWNDIGITAL MEDIA/COMMERCE TRANSACTIONS BY SEGMENT
# % $MM % # $MM # $MM # $MM
Social Media/Apps 25 27% 392.8 17% 8 215.0 0 0.0 17 177.8
eCommerce 15 16% 566.1 25% 4 209.9 0 0.0 11 356.2
Niche Content 12 13% 132.2 6% 6 87.0 0 0.0 6 45.2
Gaming 11 12% 381.9 17% 4 127.0 0 0.0 7 254.9
BUYER/INVESTOR BREAKDOWN
Transactions Est. Value Strategic Buyout Venture/Growth Capital
DIGITAL MEDIA/COMMERCE TRANSACTIONS BY SEGMENT
Gaming 11 12% 381.9 17% 4 127.0 0 0.0 7 254.9
Digital Promotion/Coupon 10 11% 271.7 12% 4 55.0 0 0.0 6 216.7
Mobile Content/Apps 9 10% 89.0 4% 1 3.5 0 0.0 8 85.5
Classifieds/Auctions/P-to-P 6 6% 118.8 5% 1 20.0 0 0.0 5 98.8
Comparison Shopping 2 2% 331.0 14% 1 25.0 0 0.0 1 306.0
Domain Portfolio/Marketplace 2 2% 4.6 0% 2 4.6 0 0.0 0 0.0
Local Search 2 2% 10.7 0% 0 0.0 0 0.0 2 10.7
10M&A & INVESTMENT SUMMARY JUNE 2011
Local Search 2 2% 10.7 0% 0 0.0 0 0.0 2 10.7
Total 94 100% 2,298.9 100% 31 747.0 0 0.0 63 1,551.9

DIGITAL MEDIA/COMMERCE PUBLIC COMPANY VALUATION
Stock Price % Chg Frm Equity Ent LTM LTM Margin LTM LTM Multiples
($ in millions, except stock price data)
Stock Price % Chg Frm Equity Ent. LTM LTM Margin LTM LTM Multiples Company Name Headquarters 06/30/11 52WK High Value Value Revenue EBITDA EBITDA Rev Growth EV/Rev EV/EBITDAAmazon.com Inc. United States $204.49 -3% $92,438.3 $85,557.3 $36,930.0 $1,792.0 4.9% 38.05% 2.3x 47.7xeBay Inc. United States 32.27 -9% 41,883.2 36,913.1 9,505.8 2,909.9 30.6% 6.77% 3.9x 12.7xpriceline.com Incorporated United States 511.93 -9% 25,415.8 24,303.0 3,309.8 907.8 27.4% 34.52% 7.3x 26.8xYahoo! Inc. United States 15.04 -20% 19,596.2 16,887.8 5,942.0 1,416.3 23.8% -8.26% 2.8x 11.9x 1-800-Flowers.com Inc. United States $3.10 -19% $198.4 $232.0 $668.1 $33.7 5.0% -0.98% 0.3x 6.9xAlibaba.com Limited China 1.59 -30% 8,061.9 6,574.2 896.3 290.5 32.4% 36.84% 7.3x 22.6xAncestry.com Inc. United States 41.39 -10% 1,861.8 1,759.5 327.5 105.2 32.1% 38.73% 5.4x 16.7xAOL, Inc. United States 19.86 -28% 2,123.6 1,840.4 2,303.8 579.9 25.2% -24.58% 0.8x 3.2xBetfair Group PLC United Kingdom 12.15 -53% 1,284.8 1,041.7 656.2 75.5 11.5% 15.37% 1.6x 13.8xBIDZ.com, Inc. United States 0.99 -60% 19.2 15.4 101.5 (1.5) -1.5% -5.52% 0.2x NMBlinkx plc United Kingdom 1.93 -23% 673.5 620.6 66.1 9.2 14.0% 96.36% 9.4x 67.2xBlue Nile Inc. United States 43.98 -32% 642.7 564.4 339.0 22.9 6.7% 8.04% 1.7x 24.7xBluefly Inc. United States 2.80 -20% 68.9 61.4 90.0 (1.1) -1.2% 10.37% 0.7x NMCyberAgent Inc. Japan 3,483.17 -7% 2,260.5 2,091.0 1,332.8 174.4 13.1% 19.38% 1.6x 12.0xDemand Media, Inc. United States 13.55 -51% 1,127.4 1,019.4 278.8 48.4 17.4% 35.04% 3.7x 21.0xDena Co. Ltd. Japan 42.84 -2% 6,317.8 5,575.8 1,360.4 700.1 51.5% 134.33% 4.1x 8.0xE-Commerce China Dangdang Inc. * China 11.59 -68% 907.2 658.7 385.0 4.6 1.2% 0.00% 1.7x 143.5xEdiets.com Inc. United States 1.60 -68% 21.1 20.3 25.3 (7.0) -27.8% 41.52% 0.8x NMExpedia Inc. United States 28.99 -3% 7,924.7 7,814.0 3,452.4 827.7 24.0% 13.65% 2.3x 9.4xGree, Inc. Japan 21.71 -11% 4,978.7 4,691.8 652.0 322.4 49.4% 83.53% 7.2x 14.6xHollywood Media Corp. United States 1.47 -25% 34.1 28.5 3.9 (7.3) -187.1% 0.00% 7.3x NMHomeAway, Inc. United States 38.70 -9% 3,089.4 3,480.7 183.7 31.5 17.1% 0.00% 18.9x 110.6xHSN, Inc. United States 32.92 -9% 1,926.5 1,891.2 3,037.5 223.7 7.4% 8.36% 0.6x 8.5xJiayuan.com China 11.43 -28% 357.3 346.4 32.5 7.0 21.5% 0.00% 10.6x 49.4xKongzhong Corp. China 5.04 -53% 190.4 73.1 145.9 21.1 14.5% 4.78% 0.5x 3.5xLinkedIn Corporation * United States 90.09 -27% 8,513.4 8,407.3 292.3 37.9 13 0% 0 00% 28 8x 222 0xLinkedIn Corporation United States 90.09 27% 8,513.4 8,407.3 292.3 37.9 13.0% 0.00% 28.8x 222.0xMakeMyTrip Limited * India 24.50 -43% 896.7 832.8 124.7 5.3 4.2% 49.26% 6.7x 158.3xMixi, Inc. Japan 4,470.21 -27% 693.3 530.3 203.6 46.9 23.0% 24.07% 2.6x 11.3xMonster Worldwide, Inc. United States 14.66 -43% 1,789.6 1,718.6 960.2 87.7 9.1% 10.87% 1.8x 19.6xMove, Inc. United States 2.19 -24% 347.6 310.7 197.9 11.5 5.8% -3.81% 1.6x 27.0xNetflix, Inc. United States 262.69 -5% 13,788.9 13,681.8 2,387.5 364.6 15.3% 34.90% 5.7x 37.5xOpenTable, Inc. United States 83.12 -30% 1956.98 1901.61 111.45 28.11 25.2% 50.91% 17.1x 67.7xOrbitz Worldwide Inc United States 2 49 -64% 255 4 573 7 755 3 115 5 15 3% 2 56% 0 8 5 0
11M&A & INVESTMENT SUMMARY JUNE 2011
Orbitz Worldwide, Inc. United States 2.49 -64% 255.4 573.7 755.3 115.5 15.3% 2.56% 0.8x 5.0xOverstock.com Inc. United States 15.22 -28% 353.9 294.8 1,091.0 21.3 1.9% 14.20% 0.3x 13.9xPandora Media, Inc. United States 18.91 -27% 3,020.5 2,984.2 167.2 -0.6 -0.3% 0.00% 17.8x NM
DIGITAL MEDIA/COMMERCE PUBLIC COMPANY VALUATION
Stock Price % Chg Frm Equity Ent LTM LTM Margin LTM LTM Multiples
($ in millions, except stock price data)
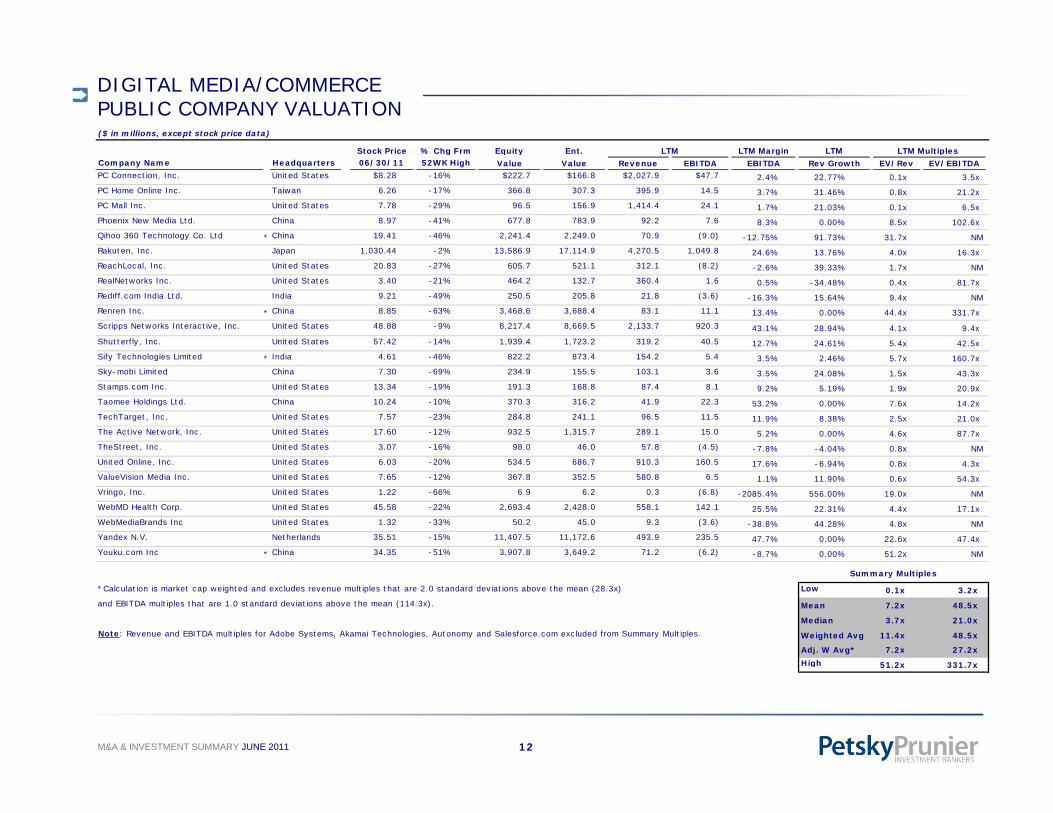
Stock Price % Chg Frm Equity Ent. LTM LTM Margin LTM LTM Multiples Company Name Headquarters 06/30/11 52WK High Value Value Revenue EBITDA EBITDA Rev Growth EV/Rev EV/EBITDAPC Connection, Inc. United States $8.28 -16% $222.7 $166.8 $2,027.9 $47.7 2.4% 22.77% 0.1x 3.5xPC Home Online Inc. Taiwan 6.26 -17% 366.8 307.3 395.9 14.5 3.7% 31.46% 0.8x 21.2xPC Mall Inc. United States 7.78 -29% 96.5 156.9 1,414.4 24.1 1.7% 21.03% 0.1x 6.5xPhoenix New Media Ltd. China 8.97 -41% 677.8 783.9 92.2 7.6 8.3% 0.00% 8.5x 102.6xQihoo 360 Technology Co. Ltd * China 19.41 -46% 2,241.4 2,249.0 70.9 (9.0) -12.75% 91.73% 31.7x NMRakuten, Inc. Japan 1,030.44 -2% 13,586.9 17,114.9 4,270.5 1,049.8 24 6% 13 76% 4 0x 16 3xRakuten, Inc. Japan 1,030.44 2% 13,586.9 17,114.9 4,270.5 1,049.8 24.6% 13.76% 4.0x 16.3xReachLocal, Inc. United States 20.83 -27% 605.7 521.1 312.1 (8.2) -2.6% 39.33% 1.7x NMRealNetworks Inc. United States 3.40 -21% 464.2 132.7 360.4 1.6 0.5% -34.48% 0.4x 81.7xRediff.com India Ltd. India 9.21 -49% 250.5 205.8 21.8 (3.6) -16.3% 15.64% 9.4x NMRenren Inc. * China 8.85 -63% 3,468.6 3,688.4 83.1 11.1 13.4% 0.00% 44.4x 331.7xScripps Networks Interactive, Inc. United States 48.88 -9% 8,217.4 8,669.5 2,133.7 920.3 43.1% 28.94% 4.1x 9.4xShutterfly, Inc. United States 57.42 -14% 1,939.4 1,723.2 319.2 40.5 12.7% 24.61% 5.4x 42.5xSify Technologies Limited * India 4 61 46% 822 2 873 4 154 2 5 4 3 5% 2 46% 5 7 160 7Sify Technologies Limited * India 4.61 -46% 822.2 873.4 154.2 5.4 3.5% 2.46% 5.7x 160.7xSky-mobi Limited China 7.30 -69% 234.9 155.5 103.1 3.6 3.5% 24.08% 1.5x 43.3xStamps.com Inc. United States 13.34 -19% 191.3 168.8 87.4 8.1 9.2% 5.19% 1.9x 20.9xTaomee Holdings Ltd. China 10.24 -10% 370.3 316.2 41.9 22.3 53.2% 0.00% 7.6x 14.2xTechTarget, Inc. United States 7.57 -23% 284.8 241.1 96.5 11.5 11.9% 8.38% 2.5x 21.0xThe Active Network, Inc. United States 17.60 -12% 932.5 1,315.7 289.1 15.0 5.2% 0.00% 4.6x 87.7xTheStreet, Inc. United States 3.07 -16% 98.0 46.0 57.8 (4.5) -7.8% -4.04% 0.8x NMUnited Online, Inc. United States 6.03 -20% 534.5 686.7 910.3 160.5 17.6% -6.94% 0.8x 4.3xValueVision Media Inc. United States 7.65 -12% 367.8 352.5 580.8 6.5 1.1% 11.90% 0.6x 54.3xVringo, Inc. United States 1.22 -66% 6.9 6.2 0.3 (6.8) -2085.4% 556.00% 19.0x NMWebMD Health Corp. United States 45.58 -22% 2,693.4 2,428.0 558.1 142.1 25.5% 22.31% 4.4x 17.1xWebMediaBrands Inc United States 1.32 -33% 50.2 45.0 9.3 (3.6) -38.8% 44.28% 4.8x NMYandex N.V. Netherlands 35.51 -15% 11,407.5 11,172.6 493.9 235.5 47.7% 0.00% 22.6x 47.4xYouku.com Inc * China 34.35 -51% 3,907.8 3,649.2 71.2 (6.2) -8.7% 0.00% 51.2x NM
Low 0.1x 3.2x
Mean 7.2x 48.5x
Median 3.7x 21.0x
Weighted Avg 11.4x 48.5x
Adj. W Avg* 7.2x 27.2xHigh 51 2 331 7
Summary Multiples
*Calculation is market cap weighted and excludes revenue multiples that are 2.0 standard deviations above the mean (28.3x)
and EBITDA multiples that are 1.0 standard deviations above the mean (114.3x).
Note: Revenue and EBITDA multiples for Adobe Systems, Akamai Technologies, Autonomy and Salesforce.com excluded from Summary Multiples.
12M&A & INVESTMENT SUMMARY JUNE 2011
High 51.2x 331.7x

MARKETING TECHNOLOGYTransactions by Segment and Buyer Type
• With 11 transactions for approximately $112 million, Content Management was the most active subsegment in Marketing Technology, and Media Management System was the highest value worth approximately $464 million
• Select acquisitions› Google’s $400 million acquisition of AdMeld, which provides ad network optimization technology for online
publishers› DG FastChannel’s $414 million acquisition of MediaMind Technologies, which provides digital advertising
campaign management solutions to media agencies and advertisers› Facebook’s acquisition of Sofa, a Netherlands-based software design company known for its Mac applications
and eCommerce products• Select investment
› The $100 million investment in mobile payments company Square, at a more than $1 billion valuation, led by Kleiner Perkins Caufield & Byers
# % $MM % # $MM # $MM # $MM
BUYER/INVESTOR BREAKDOWN
Transactions Est. Value Strategic Buyout Venture/Growth Capital
MARKETING TECHNOLOGY TRANSACTIONS BY SEGMENT
Content Management 11 25% 112.0 7% 4 85.0 0 0.0 7 27.0
Mobile Technology 8 18% 243.5 16% 1 110.0 0 0.0 7 133.5
Online Targeting/Optimization 4 9% 448.0 29% 3 435.0 0 0.0 1 13.0
Commerce Management 3 7% 67.0 4% 1 50.0 0 0.0 2 17.0
CRM 3 7% 59.0 4% 2 45.0 0 0.0 1 14.0
Email/Messaging Software 2 5% 26.0 2% 2 26.0 0 0.0 0 0.0
Media Management System 2 5% 464 0 30% 2 464 0 0 0 0 0 0 0Media Management System 2 5% 464.0 30% 2 464.0 0 0.0 0 0.0
MRM/Workflow Management 2 5% 35.0 2% 1 25.0 0 0.0 1 10.0
SEM/SEO tools 2 5% 15.0 1% 1 10.0 0 0.0 1 5.0
Teleservices/eServices 2 5% 32.0 2% 1 25.0 0 0.0 1 7.0
Content Delivery Network 1 2% 4.5 0% 0 0.0 0 0.0 1 4.5
Creative Production Platform 1 2% 5.5 0% 0 0.0 0 0.0 1 5.5
Analytics & Reporting 1 2% 1.6 0% 0 0.0 0 0.0 1 1.6
13M&A & INVESTMENT SUMMARY JUNE 2011
SFA/Lead Management 1 2% 10.0 1% 1 10.0 0 0.0 0 0.0
Social Technology 1 2% 4.3 0% 0 0.0 0 0.0 1 4.3
Total 44 100% 1,527.4 100% 19 1,285.0 0 0.0 25 242.4

MARKETING TECHNOLOGY PUBLIC COMPANY VALUATION
Stock Price % Chg Frm Equity Ent LTM LTM Margin LTM LTM Multiples
($ in millions, except stock price data)
Stock Price % Chg Frm Equity Ent. LTM LTM Margin LTM LTM Multiples Company Name Headquarters 06/30/11 52WK High Value Value Revenue EBITDA EBITDA Rev Growth EV/Rev EV/EBITDAAdobe Systems Inc. United States $31.45 -13% $15,532.1 $14,425.0 $4,049.2 $1,449.7 35.8% 24.34% 3.6x 10.0xAkamai Technologies, Inc. United States 31.47 -42% 5,875.7 5,312.2 1,059.5 399.1 37.7% 19.12% 5.0x 13.3xAutonomy Corp. plc United Kingdom 27.42 -13% 6,661.8 6,364.3 896.0 403.0 45.0% 11.43% 7.1x 15.8xSalesforce.com United States 148.98 -3% 19,948.4 19,712.0 1,784.7 138.7 7.8% 29.56% 11.0x 142.1x Alterian plc *United Kingdom $1.62 -53% $99.5 $88.3 $59.3 $1.3 2.2% -2.75% 1.5x 68.9xBlackbaud Inc United States 27 72 9% 1 200 9 1 176 7 338 1 65 2 Blackbaud Inc. United States 27.72 -9% 1,200.9 1,176.7 338.1 65.2 19.3% 8.78% 3.5x 18.1xChinaCache International Holdings Ltd. China 9.26 -74% 223.3 136.4 70.8 6.5 9.2% 0.00% 1.9x 21.0xConvio, Inc. United States 10.81 -17% 194.9 146.1 71.3 6.1 8.5% 9.51% 2.0x 24.1xDemandTec, Inc. United States 9.10 -35% 296.2 230.8 86.8 (7.4) -8.5% 11.97% 2.7x NMDG FastChannel, Inc. United States 32.05 -26% 878.5 795.8 258.1 117.3 45.5% 26.70% 3.1x 6.8xDigital River Inc. United States 32.16 -19% 1,275.2 906.4 362.7 46.5 12.8% -9.23% 2.5x 19.5xInformatica Corporation United States 58.43 -3% 6,180.6 5,627.8 683.0 165.3 24.2% 29.66% 8.2x 34.1xI W ki I U it d St t 8 34 9% 385 3 422 8 515 2 20 9 InnerWorkings Inc. United States 8.34 -9% 385.3 422.8 515.2 20.9 4.1% 23.14% 0.8x 20.2xInteractive Intelligence, Inc. United States 35.05 -16% 655.3 569.0 179.0 29.4 16.4% 30.71% 3.2x 19.3xJDA Software Group Inc. United States 30.89 -12% 1,306.9 1,353.6 649.2 162.0 25.0% 49.55% 2.1x 8.4xKeynote Systems Inc. United States 21.63 -9% 356.2 270.2 88.7 12.9 14.5% 10.95% 3.0x 21.0x
MediaMind Technologies Inc.(1) United States 21.94 -2% 425.6 324.5 83.7 14.8 17.7% 20.17% 3.9x 21.9xNetQin Mobile *China 5.50 -54% 252.0 278.9 22.9 (7.1) -31.1% 0.00% 12.2x NMOpen Text Corp. Canada 64.02 -5% 3,664.3 3,725.1 987.9 297.3 30.1% 12.86% 3.8x 12.5x
OS ldi i d S 1 9 11% 68 3 06 1PROS Holdings, Inc. *United States 17.49 -11% 468.3 406.5 75.1 5.4 7.2% 10.34% 5.4x 75.5xRightnow Technologies Inc. United States 32.40 -12% 1,070.7 996.1 195.7 21.3 10.9% 23.30% 5.1x 46.8xSage Group plc United Kingdom 4.64 -5% 6,114.7 6,232.1 2,341.4 647.0 27.6% 3.48% 2.7x 9.6xS1 Corporation United States 7.48 -3% 403.1 343.2 215.8 7.6 3.5% -6.92% 1.6x 45.0xSky-mobi Limited China 7.30 -69% 234.9 155.5 103.1 3.6 3.5% 24.08% 1.5x 43.3xSoundBite Communications, Inc. United States 2.42 -23% 39.7 5.8 38.8 (2.0) -5.1% -4.52% 0.1x NMTIBCO Software Inc. United States 29.02 -6% 4,692.7 4,453.3 827.5 184.3 22.3% 22.74% 5.4x 24.2xVerint Systems Inc. United States 37.04 -3% 1,419.7 2,125.9 730.5 140.9 19.3% 4.20% 2.9x 15.1xVocus Inc. United States 30.61 -3% 601.6 503.0 101.5 (0.5) -0.5% 17.40% 5.0x NM
Low 0.1x 6.8x
Mean 3.5x 27.8x
Median 3.0x 21.0x
Weighted Avg 4.5x 21.0x
and EBITDA multiples that are 2.0 standard deviations above the mean (65.8x).
(1) MediaMind Technologies was acquired by DG FastChannel, 06/16/11
Summary Multiples
*Calculation is market cap weighted and excludes revenue multiples that are 3.0 standard deviations above the mean (11.2x)
14M&A & INVESTMENT SUMMARY JUNE 2011
Weighted Avg 4.5x 21.0x
Adj. W Avg* 4.4x 20.8xHigh 12.2x 75.5x
Note: Revenue and EBITDA multiples for Adobe Systems, Akamai Technologies, Autonomy and Salesforce.com excluded from Summary Multiples.

SOFTWARE & INFORMATIONTransactions by Segment and Buyer Type
• With seven transactions, Infrastructure Software was the most active subsegment in Software & Information. Market Research was the highest value subsegment worth approximately $353 million
• Select acquisitions› Survey Sampling International’s acquisition of Opinionology, which provides survey research data collection
solutions for market researchers› Experian’s $185 million acquisition of Medical Present Value, which provides revenue cycle management
software, data, and analytics to U.S. physicians› Variety Magazine’s acquisition of Tvtracker, an entertainment research and data-tracking provider
• Select investments› The $25 million venture capital investment in Mu Sigma a decision science and analytic services provider led › The $25 million venture capital investment in Mu Sigma, a decision science and analytic services provider, led
by Sequoia Capital
# % $MM % # $MM # $MM # $MM
Infrastructure Software 10 33% 75.8 11% 0 0.0 0 0.0 10 75.8
BUYER/INVESTOR BREAKDOWN
Transactions Est. Value Strategic Buyout Venture/Growth Capital
SOFTWARE & INFORMATION TRANSACTIONS BY SEGMENT
Market Research 6 20% 353.0 49% 3 327.0 0 0.0 3 26.0
Financial Software 4 13% 31.3 4% 1 15.0 0 0.0 3 16.3
Healthcare Providers Software 0 0% 0.0 0% 0 0.0 0 0.0 0 0.0
HR Software 3 10% 71.7 10% 2 57.7 0 0.0 1 14.0
Healthcare Payors Software 0 0% 0.0 0% 0 0.0 0 0.0 0 0.0
Engineering/Scientific/Tech 1 3% 15.0 2% 0 0.0 0 0.0 1 15.0
ERP Software 1 3% 1.5 0% 0 0.0 0 0.0 1 1.5
Financial 1 3% 112.0 16% 1 112.0 0 0.0 0 0.0
Geo-Demo Software 1 3% 17.0 2% 1 17.0 0 0.0 0 0.0
Healthcare-BioPharma 1 3% 1.7 0% 0 0.0 0 0.0 1 1.7
Healthcare-Providers 1 3% 11.0 2% 0 0.0 0 0.0 1 11.0
Marketing Consulting 1 3% 25.0 3% 0 0.0 0 0.0 1 25.0
15M&A & INVESTMENT SUMMARY JUNE 2011
Other*
Total 30 100% 715.0 100% 8 528.7 0 0.0 22 186.3
SOFTWARE & INFORMATION PUBLIC COMPANY VALUATION
Stock Price % Chg Frm Equity Ent LTM LTM Margin LTM LTM Multiples
($ in millions, except stock price data)
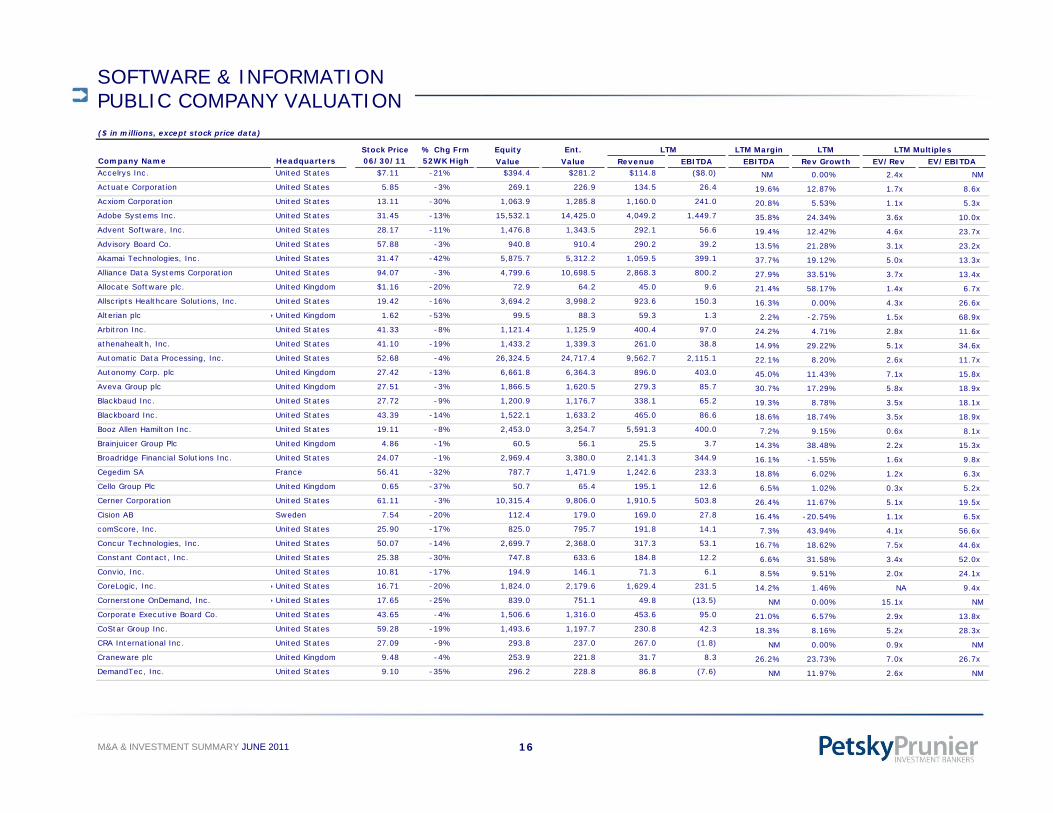
Stock Price % Chg Frm Equity Ent. LTM LTM Margin LTM LTM Multiples Company Name Headquarters 06/30/11 52WK High Value Value Revenue EBITDA EBITDA Rev Growth EV/Rev EV/EBITDAAccelrys Inc. United States $7.11 -21% $394.4 $281.2 $114.8 ($8.0) NM 0.00% 2.4x NMActuate Corporation United States 5.85 -3% 269.1 226.9 134.5 26.4 19.6% 12.87% 1.7x 8.6xAcxiom Corporation United States 13.11 -30% 1,063.9 1,285.8 1,160.0 241.0 20.8% 5.53% 1.1x 5.3xAdobe Systems Inc. United States 31.45 -13% 15,532.1 14,425.0 4,049.2 1,449.7 35.8% 24.34% 3.6x 10.0xAdvent Software, Inc. United States 28.17 -11% 1,476.8 1,343.5 292.1 56.6 19.4% 12.42% 4.6x 23.7xAdvisory Board Co. United States 57.88 -3% 940.8 910.4 290.2 39.2 13.5% 21.28% 3.1x 23.2xAkamai Technologies, Inc. United States 31.47 -42% 5,875.7 5,312.2 1,059.5 399.1 37.7% 19.12% 5.0x 13.3xAlliance Data Systems Corporation United States 94.07 -3% 4,799.6 10,698.5 2,868.3 800.2 27.9% 33.51% 3.7x 13.4xAllocate Software plc. United Kingdom $1.16 -20% 72.9 64.2 45.0 9.6 21.4% 58.17% 1.4x 6.7xAllscripts Healthcare Solutions, Inc. United States 19.42 -16% 3,694.2 3,998.2 923.6 150.3 16.3% 0.00% 4.3x 26.6xAlterian plc *United Kingdom 1.62 -53% 99.5 88.3 59.3 1.3 2.2% -2.75% 1.5x 68.9xArbitron Inc. United States 41.33 -8% 1,121.4 1,125.9 400.4 97.0 24.2% 4.71% 2.8x 11.6xathenahealth, Inc. United States 41.10 -19% 1,433.2 1,339.3 261.0 38.8 14.9% 29.22% 5.1x 34.6xA t ti D t P i I U it d St t 52 68 4% 26 324 5 24 717 4 9 562 7 2 115 1 Automatic Data Processing, Inc. United States 52.68 -4% 26,324.5 24,717.4 9,562.7 2,115.1 22.1% 8.20% 2.6x 11.7xAutonomy Corp. plc United Kingdom 27.42 -13% 6,661.8 6,364.3 896.0 403.0 45.0% 11.43% 7.1x 15.8xAveva Group plc United Kingdom 27.51 -3% 1,866.5 1,620.5 279.3 85.7 30.7% 17.29% 5.8x 18.9xBlackbaud Inc. United States 27.72 -9% 1,200.9 1,176.7 338.1 65.2 19.3% 8.78% 3.5x 18.1xBlackboard Inc. United States 43.39 -14% 1,522.1 1,633.2 465.0 86.6 18.6% 18.74% 3.5x 18.9xBooz Allen Hamilton Inc. United States 19.11 -8% 2,453.0 3,254.7 5,591.3 400.0 7.2% 9.15% 0.6x 8.1xBrainjuicer Group Plc United Kingdom 4.86 -1% 60.5 56.1 25.5 3.7 14.3% 38.48% 2.2x 15.3xBroadridge Financial Solutions Inc United States 24 07 -1% 2 969 4 3 380 0 2 141 3 344 9 16 1% 1 55% 1 6 9 8Broadridge Financial Solutions Inc. United States 24.07 -1% 2,969.4 3,380.0 2,141.3 344.9 16.1% -1.55% 1.6x 9.8xCegedim SA France 56.41 -32% 787.7 1,471.9 1,242.6 233.3 18.8% 6.02% 1.2x 6.3xCello Group Plc United Kingdom 0.65 -37% 50.7 65.4 195.1 12.6 6.5% 1.02% 0.3x 5.2xCerner Corporation United States 61.11 -3% 10,315.4 9,806.0 1,910.5 503.8 26.4% 11.67% 5.1x 19.5xCision AB Sweden 7.54 -20% 112.4 179.0 169.0 27.8 16.4% -20.54% 1.1x 6.5xcomScore, Inc. United States 25.90 -17% 825.0 795.7 191.8 14.1 7.3% 43.94% 4.1x 56.6xConcur Technologies, Inc. United States 50.07 -14% 2,699.7 2,368.0 317.3 53.1 16.7% 18.62% 7.5x 44.6xConstant Contact, Inc. United States 25.38 -30% 747.8 633.6 184.8 12.2 6 6% 31 58% 3 4x 52 0x, 6.6% 31.58% 3.4x 52.0xConvio, Inc. United States 10.81 -17% 194.9 146.1 71.3 6.1 8.5% 9.51% 2.0x 24.1xCoreLogic, Inc. *United States 16.71 -20% 1,824.0 2,179.6 1,629.4 231.5 14.2% 1.46% NA 9.4xCornerstone OnDemand, Inc. *United States 17.65 -25% 839.0 751.1 49.8 (13.5) NM 0.00% 15.1x NMCorporate Executive Board Co. United States 43.65 -4% 1,506.6 1,316.0 453.6 95.0 21.0% 6.57% 2.9x 13.8xCoStar Group Inc. United States 59.28 -19% 1,493.6 1,197.7 230.8 42.3 18.3% 8.16% 5.2x 28.3xCRA International Inc. United States 27.09 -9% 293.8 237.0 267.0 (1.8) NM 0.00% 0.9x NMCraneware plc United Kingdom 9.48 -4% 253.9 221.8 31.7 8.3 26.2% 23.73% 7.0x 26.7x
16M&A & INVESTMENT SUMMARY JUNE 2011
DemandTec, Inc. United States 9.10 -35% 296.2 228.8 86.8 (7.6) NM 11.97% 2.6x NM

SOFTWARE & INFORMATION PUBLIC COMPANY VALUATION
Stock Price % Chg Frm Equity Ent LTM LTM Margin LTM LTM Multiples
($ in millions, except stock price data)
Stock Price % Chg Frm Equity Ent. LTM LTM Margin LTM LTM Multiples Company Name Headquarters 06/30/11 52WK High Value Value Revenue EBITDA EBITDA Rev Growth EV/Rev EV/EBITDADG FastChannel, Inc. United States $32.05 -26% $878.5 $795.8 $258.1 $117.3 45.5% 26.70% 3.1x 6.8xDigital River Inc. United States 32.16 -19% 1,275.2 906.4 362.7 46.5 12.8% -9.23% 2.5x 19.5xDun & Bradstreet Corp. United States 75.54 -13% 3,732.1 4,548.1 1,683.0 495.0 29.4% 0.37% 2.7x 9.2xEbix Inc. United States 19.05 -37% 752.0 746.8 140.6 62.2 44.2% 29.47% 5.3x 12.0xEbiquity plc United Kingdom 1.49 -11% 87.9 98.3 52.0 5.9 11.4% 70.12% 1.9x 16.6xEnvestnet, Inc. United States 14.85 -16% 469.9 398.4 105.7 13.6 12.9% 30.67% 3.8x 29.3xEPIQ Systems, Inc. United States 14.22 -7% 503.5 594.9 251.4 58.0 23.1% 7.62% 2.4x 10.3xEpocrates, Inc. United States 18.44 -39% 431.6 338.4 108.8 7.4 6.8% 16.69% 3.1x 46.0xEquifax Inc. United States 34.72 -13% 4,273.0 5,220.8 1,889.1 602.8 31.9% 9.04% 2.8x 8.7xExperian plc Ireland 12.74 -4% 12,783.9 14,518.0 4,239.0 1,314.0 31.0% 9.25% 3.4x 11.0xFactSet Research Systems Inc. United States 102.32 -9% 4,686.3 4,477.6 702.8 274.6 39.1% 11.86% 6.4x 16.3xFair Isaac Corp. United States 30.20 -5% 1,203.0 1,464.7 619.2 149.1 24.1% 2.66% 2.4x 9.8xFidelity National Information Services, Inc. United States 30.79 -9% 9,415.2 14,261.5 5,417.9 1,514.7 28.0% 30.49% 2.6x 9.4xFid l U it d Ki d 31 11 3% 1 119 2 1 018 0 409 6 84 6 Fidessa group plc United Kingdom 31.11 -3% 1,119.2 1,018.0 409.6 84.6 20.7% 9.99% 2.5x 12.0xFinancial Engines, Inc. United States 25.92 -11% 1,153.0 1,036.2 119.7 16.8 14.0% 30.23% 8.7x 61.8xForrester Research Inc. United States 32.96 -18% 748.5 517.8 257.3 35.0 13.6% 8.96% 2.0x 14.8xFTI Consulting, Inc. United States 37.94 -13% 1,595.4 2,301.5 1,413.2 261.2 18.5% 0.79% 1.6x 8.8xGartner Inc. United States 40.29 -7% 3,918.6 4,068.1 1,322.2 197.5 14.9% 13.78% 3.1x 20.6xGfK SE Germany 52.85 -12% 1,917.1 2,534.3 1,876.9 280.1 14.9% 12.09% 1.4x 9.0xGlobeOp Financial Services S.A United Kingdom 6.29 -12% 658.4 582.9 189.3 50.0 26.4% 21.00% 3.1x 11.7xGreen Dot Corporation United States 33 98 -48% 1 428 2 1 265 8 407 6 70 9 17 4% 34 66% 3 1 17 9Green Dot Corporation United States 33.98 -48% 1,428.2 1,265.8 407.6 70.9 17.4% 34.66% 3.1x 17.9xHarris Interactive Inc. United States 0.85 -41% 46.5 46.6 163.7 5.2 3.2% -2.71% 0.3x 8.9xHarte-Hanks Inc. United States 8.12 -41% 517.9 634.0 860.7 109.8 12.8% 2.14% 0.7x 5.8xIHS Inc. United States 83.42 -7% 5,411.9 5,560.4 1,188.4 276.6 23.3% 18.38% 4.7x 20.1xInforma plc Switzerland 6.94 -8% 4,169.9 5,421.2 1,915.1 505.1 26.4% 0.39% 2.8x 10.7xInformatica Corporation United States 58.43 -3% 6,180.6 5,627.8 683.0 165.3 24.2% 29.66% 8.2x 34.1xInformation Services Group, Inc. United States 1.77 -28% 64.4 116.5 137.8 5.2 3.8% 3.40% 0.8x 22.4xInnerWorkings Inc. United States 8.34 -9% 385.3 422.8 515.2 20.9 4 1% 23 14% 0 8x 20 2xg 4.1% 23.14% 0.8x 20.2xInteractive Intelligence, Inc. United States 35.05 -16% 655.3 569.0 179.0 29.4 16.4% 30.71% 3.2x 19.3xInternational Datacasting Corporation Canada 0.38 -25% 23.1 16.3 34.4 2.3 6.7% 47.53% 0.5x 7.1xIpsos SA France 46.89 -13% 1,606.1 1,892.8 1,529.8 192.9 12.6% 20.89% 1.2x 9.8xIsoftstone Holdings Limited China 15.31 -32% 771.3 648.6 214.6 11.3 5.3% 0.00% 3.0x 57.4xJDA Software Group Inc. United States 30.89 -12% 1,306.9 1,353.6 649.2 162.0 25.0% 49.55% 2.1x 8.4xKenexa Corp. United States 23.98 -28% 633.2 655.1 216.7 17.2 7.9% 36.70% 3.0x 38.1xKeynote Systems Inc. United States 21.63 -9% 356.2 270.2 88.7 12.9 14.5% 10.95% 3.0x 21.0x
17M&A & INVESTMENT SUMMARY JUNE 2011
Lawson Software, Inc. United States 11.22 -14% 1,847.1 1,777.6 755.2 134.4 17.8% 4.08% 2.4x 13.2x

SOFTWARE & INFORMATION PUBLIC COMPANY VALUATION
Stock Price % Chg Frm Equity Ent LTM LTM Margin LTM LTM Multiples
($ in millions, except stock price data)
Stock Price % Chg Frm Equity Ent. LTM LTM Margin LTM LTM Multiples Company Name Headquarters 06/30/11 52WK High Value Value Revenue EBITDA EBITDA Rev Growth EV/Rev EV/EBITDALECG Corporation United States $0.03 -99% $2.8 $54.9 $297.0 -$7.8 NM 11.26% 0.2x NMLender Processing Services, Inc. United States 20.91 -40% 1,805.9 3,014.9 2,420.1 637.6 26.3% -0.53% 1.2x 4.7xMacdonald Dettwiler & Associates Ltd. Canada 56.65 -7% 2,332.1 1,572.5 765.2 120.4 15.7% 86.44% 2.1x 13.1xMedAssets, Inc. United States 13.36 -47% 783.1 1,693.7 428.5 107.0 25.0% 20.46% 4.0x 15.8xMediaMind Technologies Inc. United States 21.94 -2% 425.6 324.5 83.7 14.8 17.7% 20.17% 3.9x 21.9xMediware Information Systems Inc. United States 11.05 -19% 88.6 58.5 52.8 9.5 17.9% 17.32% 1.1x 6.2xMerge Healthcare Incorporated United States 5.20 -16% 438.2 628.9 173.0 30.8 17.8% 142.00% 3.6x 20.4xMisys plc United Kingdom 6.75 -2% 2,163.6 780.7 1,222.3 247.6 20.3% 37.54% 0.6x 3.2xMoody's Corp. United States 38.35 -9% 8,736.1 9,267.4 2,132.5 895.1 42.0% 14.35% 4.3x 10.4xMorningstar Inc. United States 60.78 -2% 3,055.2 2,670.9 578.8 167.1 28.9% 17.99% 4.6x 16.0xMSCI Inc. United States 37.68 -8% 4,526.8 5,468.2 662.9 295.2 44.5% 49.66% 8.2x 18.5xNational Research Corp. United States 36.53 -1% 245.2 257.9 65.8 19.8 30.1% 12.85% 3.9x 13.0xNavigant Consulting Inc. United States 10.49 -16% 541.0 769.2 718.9 89.6 12.5% 2.93% 1.1x 8.6xNi l H ldi N V N th l d 31 16 6% 11 160 6 18 022 6 5 232 0 1 283 0 Nielsen Holdings N.V. Netherlands 31.16 -6% 11,160.6 18,022.6 5,232.0 1,283.0 24.5% 6.73% 3.4x 14.0xOnvia Inc. United States 4.58 -8% 38.8 27.7 26.1 3.3 12.5% -2.20% 1.1x 8.5xOpen Text Corp. Canada 64.02 -5% 3,664.3 3,725.1 987.9 297.3 30.1% 12.86% 3.8x 12.5xParametric Technology Corporation United States 22.93 -9% 2,722.3 2,462.8 1,046.8 144.1 13.8% 7.75% 2.4x 17.1xPaychex Inc. United States 30.72 -9% 11,123.7 10,659.7 2,084.3 875.1 42.0% 4.17% 5.1x 12.2xPROS Holdings, Inc. *United States 17.49 -11% 468.3 406.5 75.1 5.4 7.2% 10.34% 5.4x 75.5xQlik Technologies, Inc. *United States 34.06 -1% 2,746.2 2,569.4 245.8 23.1 9.4% 40.67% 10.5x 111.2xQuality Systems Inc United States 87 30 -5% 2 547 3 2 429 6 353 4 101 7 28 8% 21 09% 6 9 23 9Quality Systems Inc. United States 87.30 -5% 2,547.3 2,429.6 353.4 101.7 28.8% 21.09% 6.9x 23.9xRealPage, Inc. United States 26.47 -23% 1,840.7 1,779.8 204.4 27.2 13.3% 36.63% 8.7x 65.4xReed Elsevier plc *United Kingdom 9.09 -5% 11,055.6 - - - NM 0.00% NA NAReis, Inc. United States 9.93 -3% 105.1 93.2 25.4 4.9 19.1% -20.06% 3.7x 19.2xRightnow Technologies Inc. United States 32.40 -12% 1,070.7 996.1 195.7 21.3 10.9% 23.30% 5.1x 46.8xS1 Corporation United States 7.48 -3% 403.1 343.2 215.8 7.6 3.5% -6.92% 1.6x 45.0xSage Group plc United Kingdom 4.64 -5% 6,114.7 6,232.1 2,341.4 647.0 27.6% 3.48% 2.7x 9.6xSalesforce.com *United States 148.98 -3% 19,948.4 19,712.0 1,784.7 138.7 7 8% 29 56% 11 0x 142 1x, , , 7.8% 29.56% 11.0x 142.1xSolera Holdings Inc. United States 59.16 -2% 4,179.5 4,500.8 657.3 282.4 43.0% 5.89% 6.8x 15.9xSPS Commerce, Inc. United States 17.79 -4% 212.7 172.2 47.0 4.1 8.7% 19.12% 3.7x 41.9xSS&C Technologies Holdings, Inc. United States 19.87 -9% 1,518.3 1,672.0 339.7 124.5 36.7% 19.05% 4.9x 13.4xStreamline Health Solutions, Inc. United States 1.92 -6% 19.0 20.1 18.2 1.1 6.3% 1.11% 1.1x 17.7xSuccessFactors, Inc. United States 29.40 -27% 2,323.2 1,955.7 228.8 (18.9) NM 40.73% 8.5x NMTaleo Corp. United States 37.03 -3% 1,520.6 1,375.0 253.7 28.9 11.4% 23.54% 5.4x 47.5xTemenos Group AG Switzerland 30.77 -34% 2,202.6 2,367.8 457.2 103.9 22.7% 19.34% 5.2x 22.8x
18M&A & INVESTMENT SUMMARY JUNE 2011
The Dolan Company United States 8.47 -44% 254.5 412.6 306.9 74.3 24.2% 11.20% 1.3x 5.5x

SOFTWARE & INFORMATION PUBLIC COMPANY VALUATION
Stock Price % Chg Frm Equity Ent LTM LTM Margin LTM LTM Multiples
($ in millions, except stock price data)
Stock Price % Chg Frm Equity Ent. LTM LTM Margin LTM LTM Multiples Company Name Headquarters 06/30/11 52WK High Value Value Revenue EBITDA EBITDA Rev Growth EV/Rev EV/EBITDAThe Hackett Group, Inc. United States $5.09 -2% $208.0 $191.5 $207.5 $17.6 8.5% 38.40% 0.9x 10.9xThe McGraw-Hill Companies, Inc. United States 41.91 -4% 12,770.0 12,756.4 6,259.8 1,611.7 25.7% 4.44% 2.0x 7.9xThomson Reuters Corporation United States 37.54 -13% 31,380.8 38,915.5 13,260.0 2,900.0 21.9% 1.95% 2.9x 13.4xTIBCO Software Inc. United States 29.02 -6% 4,692.7 4,453.3 827.5 184.3 22.3% 22.74% 5.4x 24.2xUltimate Software Group, Inc. *United States 54.43 -10% 1,406.4 1,354.8 236.7 19.1 8.1% 16.51% 5.7x 71.1xVerint Systems Inc. United States 37.04 -3% 1,419.7 2,125.9 730.5 140.9 19.3% 4.20% 2.9x 15.1xVerisk Analytics, Inc. United States 34.62 -2% 5,792.9 6,516.6 1,175.1 513.2 43.7% 11.12% 5.5x 12.7xVocus Inc. United States 30.61 -3% 601.6 503.0 101.5 (0.5) NM 17.40% 5.0x NMWolters Kluwer NV Netherlands 22.19 -15% 6,580.0 9,615.9 4,768.4 1,114.3 23.4% 3.82% 2.0x 8.6xYouGov PLC United Kingdom 0.88 -9% 85.0 67.7 80.0 8.2 10.3% 15.99% 0.8x 8.2x
Low 0.2x 3.2x
Mean 3.6x 22.2x
Summary Multiples
*Calculation is market cap weighted and excludes revenue multiples that are 3.0 standard deviations above the mean (11.1x)
and EBITDA multiples that are 2.0 standard deviations above the mean (65.6x).
Median 3.1x 15.2x
Weighted Avg 4.2x 23.4x
Adj. W Avg* 4.3x 15.5xHigh 15.1x 142.1x
19M&A & INVESTMENT SUMMARY JUNE 2011
MARKETING SERVICESTransactions by Segment and Buyer Type
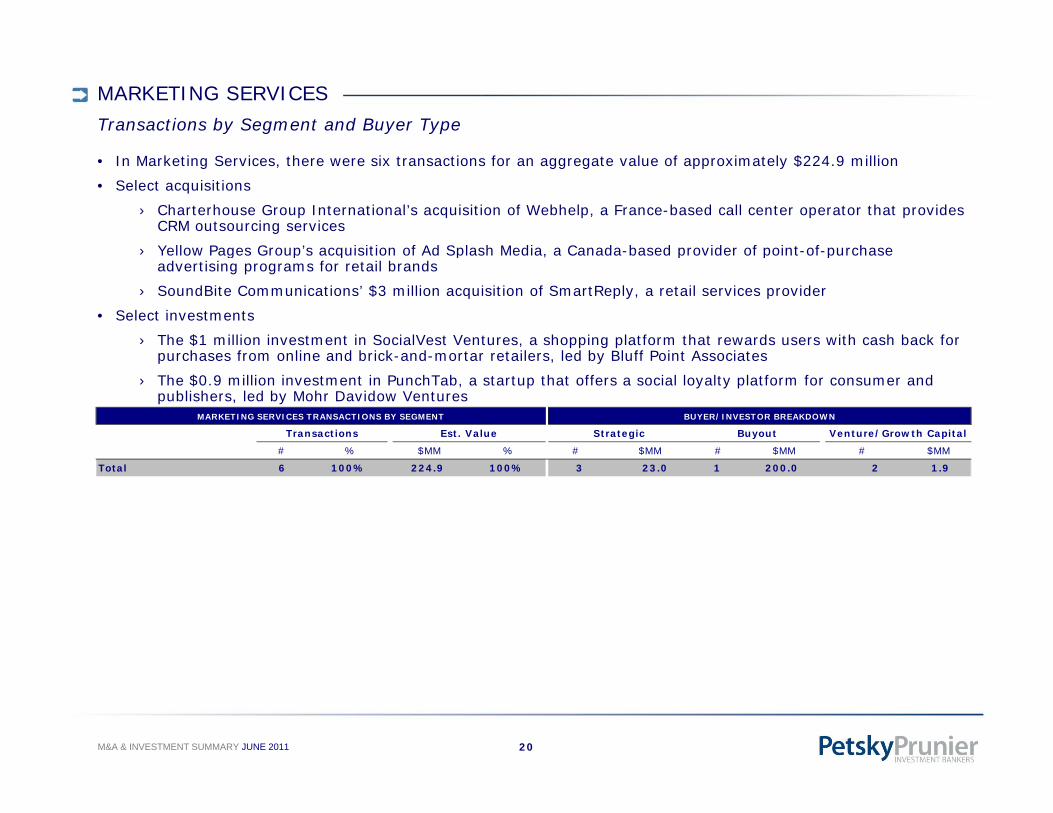
• In Marketing Services, there were six transactions for an aggregate value of approximately $224.9 million• Select acquisitions
› Charterhouse Group International’s acquisition of Webhelp, a France-based call center operator that provides CRM outsourcing services
› Yellow Pages Group’s acquisition of Ad Splash Media a Canada-based provider of point-of-purchase › Yellow Pages Group s acquisition of Ad Splash Media, a Canada based provider of point of purchase advertising programs for retail brands
› SoundBite Communications’ $3 million acquisition of SmartReply, a retail services provider• Select investments
› The $1 million investment in SocialVest Ventures, a shopping platform that rewards users with cash back for purchases from online and brick and mortar retailers led by Bluff Point Associatespurchases from online and brick-and-mortar retailers, led by Bluff Point Associates
› The $0.9 million investment in PunchTab, a startup that offers a social loyalty platform for consumer and publishers, led by Mohr Davidow Ventures
# % $MM % # $MM # $MM # $MM
BUYER/INVESTOR BREAKDOWN
Transactions Est. Value Strategic Buyout Venture/Growth Capital
MARKETING SERVICES TRANSACTIONS BY SEGMENT
Total 6 100% 224.9 100% 3 23.0 1 200.0 2 1.9
20M&A & INVESTMENT SUMMARY JUNE 2011

MARKETING SERVICES PUBLIC COMPANY VALUATION
Stock Price Chg % From Equity Ent LTM Margin LTM LTM Multiples
($ in millions, except stock price data)
LTMStock Price Chg % From Equity Ent. LTM Margin LTM LTM Multiples Company Name Headquarters 06/30/11 52WK High Value Value Revenue EBITDA EBITDA Rev Growth EV/Rev EV/EBITDAAcxiom Corporation United States $13.11 -30% $1,063.9 $1,285.8 $1,160.0 $241.0 20.8% 5.5% 1.1x 5.3xAlliance Data Systems Corporation United States 94.07 -3% 4,799.6 10,698.5 2,868.3 800.2 27.9% 33.5% 3.7x 13.4xAMREP Corp. United States 9.15 -37% 54.9 50.5 101.4 7.9 7.7% -20.5% 0.5x 6.4xCenveo Inc. United States 6.40 -8% 401.8 1,708.1 1,863.8 201.7 10.8% 6.1% 0.9x 8.5xConsolidated Graphics, Inc. United States 54.95 -10% 608.0 774.3 1,054.0 137.4 13.0% 6.4% 0.7x 5.6xConvergys Corporation United States 13.64 -9% 1,655.1 1,672.3 2,202.0 248.5 11 3% -6 0% 0 8x 6 7x
LTM
Convergys Corporation United States 13.64 9% 1,655.1 1,672.3 2,202.0 248.5 11.3% -6.0% 0.8x 6.7xDST Systems Inc. United States 52.80 -11% 2,453.3 3,145.7 2,353.5 468.9 19.9% 5.8% 1.3x 6.7xFair Isaac Corp. United States 30.20 -5% 1,203.0 1,464.7 619.2 149.1 24.1% 2.7% 2.4x 9.8xGroupe Aeroplan Inc. Canada 13.81 -6% 2,481.5 2,846.1 2,153.6 263.4 12.2% 31.6% 1.3x 10.8xHarte-Hanks Inc. United States 8.12 -41% 517.9 634.0 860.7 109.8 12.8% 2.1% 0.7x 5.8xInnotrac Corp. United States 1.59 -18% 20.3 19.9 81.2 1.4 1.7% -10.3% 0.2x 14.1xQuad/Graphics, Inc. United States 38.86 -22% 1,833.1 3,437.2 4,090.4 567.3 13.9% 130.2% 0.8x 6.1xR R Donnelley & Sons Company United States 19 61 8% 4 069 1 7 207 6 10 187 3 1 237 8 12 2% 3 8% 0 7 5 8R.R. Donnelley & Sons Company United States 19.61 -8% 4,069.1 7,207.6 10,187.3 1,237.8 12.2% 3.8% 0.7x 5.8xServiceSource Corporation *United States 22.22 -6% 1,500.4 1,428.1 166.9 4.7 2.8% 0.0% 8.6x 302.9xStarTek, Inc. United States 3.45 -43% 52.3 31.9 257.5 3.7 1.4% -9.9% 0.1x 8.7xSykes Enterprises, Incorporated United States 21.53 -6% 1,005.5 805.6 1,202.3 145.0 12.1% 37.1% 0.7x 5.6xTeleperformance France 29.42 -29% 1,664.1 1,671.5 2,762.3 345.8 12.5% 11.3% 0.6x 4.8xTeleTech Holdings Inc. United States 21.08 -10% 1,195.9 1,096.8 1,104.4 145.9 13.2% -2.7% 1.0x 7.5xTranscontinental Inc. Canada 15.08 -16% 1,218.0 1,880.1 2,227.3 432.3 19.4% 0.9% 0.8x 4.3xViad Corp United States 22.29 -18% 454.1 322.3 910.5 53.2 5.8% 15.4% 0.4x 6.1xValassis Communications Inc. United States 30.30 -19% 1,488.8 1,984.3 2,330.5 288.9 12.4% 3.9% 0.9x 6.9xVistaprint N.V. Netherlands 47.85 -15% 2,062.3 1,854.3 772.5 131.5 17.0% 20.5% 2.4x 14.1x
Low 0.1x 4.3x
Mean 1.4x 21.2x
Median 0.8x 6.7x
Weighted Avg 1 8x 22 2x
*Calculation is market cap weighted and excludes revenue multiples that are 3.0 standard deviations above the mean (6.8x)
and EBITDA multiples that are 2.0 standard deviations above the mean (147.2x).
Weighted Avg 1.8x 22.2x
Adj. W Avg* 1.5x 8.3xHigh 8.6x 302.9x
21M&A & INVESTMENT SUMMARY JUNE 2011

JUNE SUMMARY TRADING VALUATION INFORMATION
Segment Name MEAN MEDIAN W. AVG ADJ. W. AVG*Digital Advertising 3 2x 1 4x 8 1x 2 8x
Revenue Multiples
Current Summary Trading Valuation
Digital Advertising 3.2x 1.4x 8.1x 2.8xAgency/Consulting 1.0x 1.0x 1.2x 1.2xDigital Media/Commerce 7.2x 3.7x 11.4x 7.2xMarketing Technology 3.5x 3.0x 4.5x 4.4xSoftware & Information 3.6x 3.1x 4.2x 4.3xMarketing Services 1.4x 0.8x 1.8x 1.5x
Segment Name MEAN MEDIAN W. AVG ADJ. W. AVG*Di it l Ad ti i
EBITDA Multiples
Digital Advertising 19.2x 11.7x 22.8x 23.3xAgency/Consulting 8.4x 8.0x 9.2x 8.9xDigital Media/Commerce 48.5x 21.0x 48.5x 27.2xMarketing Technology 27.8x 21.0x 21.0x 20.8xSoftware & Information 22 2x 15 2x 23 4x 15 5xSoftware & Information 22.2x 15.2x 23.4x 15.5xMarketing Services 21.2x 6.7x 22.2x 8.3x
As of close of business on 06/30/11.
22M&A & INVESTMENT SUMMARY JUNE 2011
*Calculation is market cap weighted and excludes revenue multiples that are 3 standard deviations above the mean and EBITDA multiples that are 2 standard deviations above the mean.

Index Performance• S&P 500 – 28.5 %
PPLLC INDICES – LTM as of 06/30/11
Index Performance• S&P 500 – 28.5%
140
150
e (
%)
130
140
e (
%)
• Software &Information – 31.7%
• Digital Advertising – 16.0%
80
90
100
110
120
130
Ind
ex P
erf
orm
an
c
80
90
100
110
120
Ind
ex P
erf
orm
an
c
Index Performance• S&P 500 – 28.5 %• Marketing
Index Performance• S&P 500 – 28.5 %• Agency/Consulting – 37.9%
80
Jul-10 Sep-10 Nov-10 Jan-11 Mar-11 May-11
S&P 500 Digital Advertising Google Microsoft
130
140
150
nce
(%
)
80
Jul-10 Sep-10 Nov-10 Jan-11 Mar-11 May-11
S&P 500 Software & Information
120
130
140
an
ce (
%)
gServices – 29.1%
g y/ g
80
90
100
110
120
Ind
ex P
erf
orm
an
80
90
100
110
Jul-10 Sep-10 Nov-10 Jan-11 Mar-11 May-11
Ind
ex P
erf
orm
a
Index Performance• S&P 500 – 28.5 %• Digital Media/
Commerce – 26.4%
Index Performance• S&P 500 – 28.5%• Marketing
Technology – 66.4%
Jul-10 Sep-10 Nov-10 Jan-11 Mar-11 May-11
S&P 500 Agency/Consulting
220
240
260
280
300
320
man
ce (
%)
Jul 10 Sep 10 Nov 10 Jan 11 Mar 11 May 11
S&P 500 Marketing Services
160
180
200
220
man
ce (
%)
Commerce 26.4% Technology 66.4%
60
80
100
120
140
160
180
200
Jul-10 Sep-10 Nov-10 Jan-11 Mar-11 May-11
Ind
ex P
erf
orm
60
80
100
120
140
Jul-10 Sep-10 Nov-10 Jan-11 Mar-11 May-11
Ind
ex P
erf
orm
23M&A & INVESTMENT SUMMARY JUNE 2011
S&P 500 Digital Media/Commerce
Amazon eBay
priceline Yahoo!
S&P 500 Marketing Technology Adobe
Akamai Autonomy Salesforce

ALL SEGMENTSStrategic Transactions ($ in Millions)
Reported
Target Buyer/InvestorTransaction
Value StrategicValues Disclosed
MediaMind Technologies, Inc. DG $414.0AdMeld, Inc. Google, Inc. 400.0Medical Present Value Experian plc 185.0Ned Davis Research Group Euromoney Institutional Investor plc 112 0Ned Davis Research Group Euromoney Institutional Investor plc 112.0Fundamo Visa, Inc. 110.0Myprotein.com The Hut Group 94.9Magento eBay Incorporated 90.0Hewlett-Packard, Visual Collaboraton Business Polycom, Inc. 89.0Betsafe.com Betsson AB 84.5Health Risk Partners Verisk Health 60.0Jobpartners Taleo Corporation 38.0Myspace Specific Media 35.0Opthalmic Imaging Systems Merge Healthcare 32.7GlobalExpense Concur Technologies, Inc. 19.7i-POP Networks InternetQ 3.5SmartReply, Inc. SoundBite Communications, Inc. 3.0Social.com (Unnamed) 2.6The Joined Up Media Company Ebiquity 2.0Crowd Ignite Evolve Media Corporation 1 0Crowd Ignite Evolve Media Corporation 1.0
StrategicUndisclosed
Beloit Solutions Group Cloud Sherpas - DealKeren LivingSocial.com - GoNablt LivingSocial.com - Ensogo LivingSocial.com - SolutionX iCentris Inc SolutionX iCentris, Inc. - GoMo News bNET Communications, Inc. - Fanvibe BeRecruited, Inc. - Notehall Chegg, Inc. - MusicMatrix.com Pegasus Tel, Inc. - LAPTOP TechMediaNetwork - Fatwire Corporation Oracle Corporation - Wheelhouse Solutions Champion Exposition Services -
24M&A & INVESTMENT SUMMARY JUNE 2011
p pSideshow SAY Media - SageTV Google, Inc. - Assetlink, Inc. SAS Institute, Inc. -
ALL SEGMENTSStrategic Transactions ($ in Millions)
Reported
Target Buyer/InvestorTransaction
Value StrategicUndisclosed
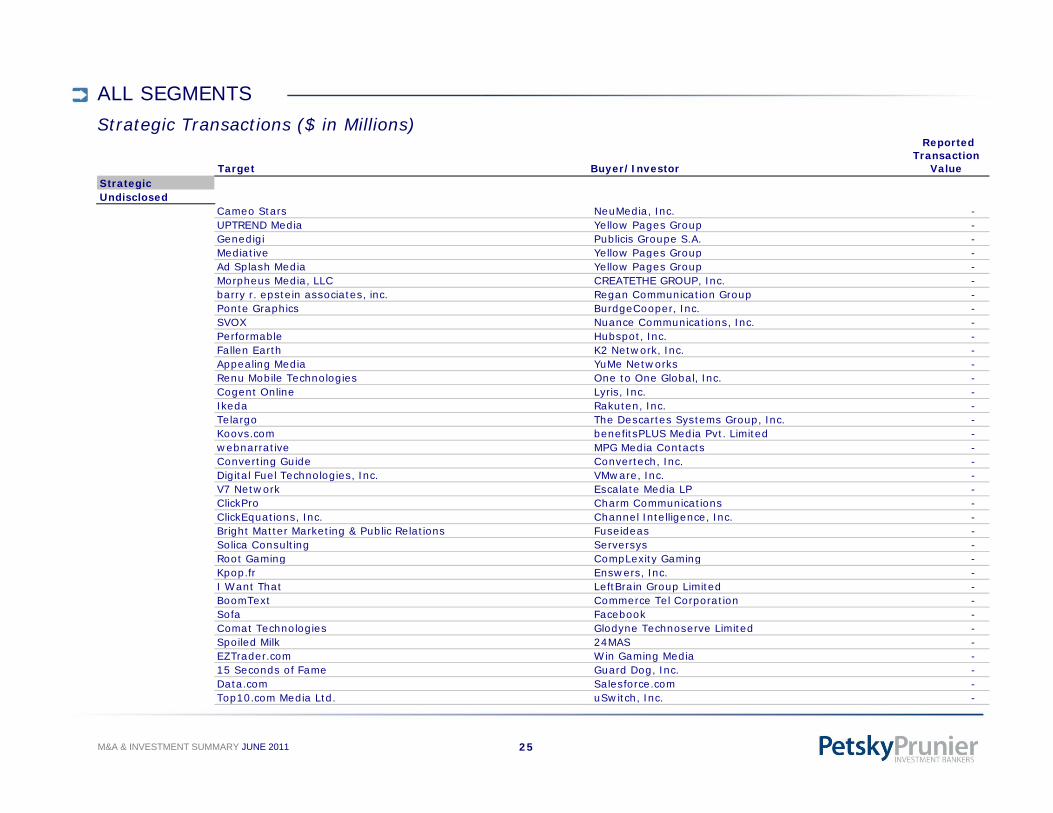
Cameo Stars NeuMedia, Inc. - UPTREND Media Yellow Pages Group - Genedigi Publicis Groupe S.A. - Mediative Yellow Pages Group - Mediative Yellow Pages Group - Ad Splash Media Yellow Pages Group - Morpheus Media, LLC CREATETHE GROUP, Inc. - barry r. epstein associates, inc. Regan Communication Group - Ponte Graphics BurdgeCooper, Inc. - SVOX Nuance Communications, Inc. - Performable Hubspot, Inc. - Fallen Earth K2 Network, Inc. - ,Appealing Media YuMe Networks - Renu Mobile Technologies One to One Global, Inc. - Cogent Online Lyris, Inc. - Ikeda Rakuten, Inc. - Telargo The Descartes Systems Group, Inc. - Koovs.com benefitsPLUS Media Pvt. Limited - webnarrative MPG Media Contacts - C ti G id C t h I Converting Guide Convertech, Inc. - Digital Fuel Technologies, Inc. VMware, Inc. - V7 Network Escalate Media LP - ClickPro Charm Communications - ClickEquations, Inc. Channel Intelligence, Inc. - Bright Matter Marketing & Public Relations Fuseideas - Solica Consulting Serversys - Root Gaming CompLexity Gaming - Root Gaming CompLexity Gaming Kpop.fr Enswers, Inc. - I Want That LeftBrain Group Limited - BoomText Commerce Tel Corporation - Sofa Facebook - Comat Technologies Glodyne Technoserve Limited - Spoiled Milk 24MAS - EZTrader.com Win Gaming Media -
25M&A & INVESTMENT SUMMARY JUNE 2011
15 Seconds of Fame Guard Dog, Inc. - Data.com Salesforce.com - Top10.com Media Ltd. uSwitch, Inc. -

ALL SEGMENTSStrategic Transactions ($ in Millions)
Reported
Target Buyer/InvestorTransaction
Value StrategicUndisclosed
TapJS appMobi - ADmantX Atlante Ventures Mezzogiorno - ICUC Moderation Services Aegis Group plc - WordOne Mansell Group Inc - WordOne Mansell Group, Inc. - Tvtracker Variety Magazine - Vontoo, LLC One Call Now - Bliscy.pl MyHeritage, Inc. - AutoWereld.net Inno Holding - DailyDealSquad.com CrowdSavings.com - Adfunky Batanga Network - I-Network Batanga Network - gOpinionology Survey Sampling International, LLC - Wilde Company Universal, Inc. - Mermaid Gaming Gaming Media Group -
26M&A & INVESTMENT SUMMARY JUNE 2011

ALL SEGMENTSVenture/Growth Capital Transactions ($ in Millions)
Reported
Target Buyer/Investor
Reported Transaction
Value Buyout DealsUndisclosed
OpenChime lightbank -
Reported Transaction
Target Buyer/InvestorTransaction
Value VC/Growth CapitalValues Disclosed
Qunar.com, Inc. Baidu.com, Inc. $306.0Coupons, Inc. (Unnamed Fund Contibuters) 200.0 Mind Candy Ltd (Unnamed Fund Contibuters) 200.0 CSN Stores Battery Ventures 165.0 Square, Inc. Kleiner Perkins Caufield & Byers 100.0 Squa e, c e e e s Cau e d & ye s 00 0Wimdu GmbH Investment AB Kinnevik 90.0 FourSquare Labs, Inc. Andreessen Horowitz Fund 50.0 OkBuy.com Draper Fisher Jurvetson 50.0 Seamlessweb Professional Solutions, Inc. Spectrum Equity Investors, LP 50.0 ihush.com Matrix Partners China 43.0 Lumos Labs, Inc. Menlo Ventures 32.5 RockMelt, Inc. Accel Partners 30.0 Mu Sigma Sequoia Capital 25.0 ViVOt h I Si T l I 8 24 0 ViVOtech, Inc. SingTel Innov8 24.0 BeachMint, Inc. Scale Venture Partners 23.5 Blue Jeans Network Accel Partners 23.5 Shazam Entertainment, Inc. Kleiner Perkins Caufield & Byers 23.0 Ping Identity Corporation Triangle Peak Partners, LP 21.0 Animoto, Inc. Madrona Venture Group 20.0 Flipkart Online Services Private Limited Tiger Global Management, LLC 20.0 Prosper Marketplace, Inc. Draper Fisher Jurvetson 17.2 Aylus Networks Inc m8 Capital 16 0 Aylus Networks, Inc. m8 Capital 16.0 Enablon Environmental Technology Fund 15.0 SMS Assist, LLC New World Ventures, LLC 15.0 Streetline, Inc. Fontinalis Partners, LLC 15.0 ServiceMax Mayfield Fund 14.0 The SAVO Group SAP Ventures 14.0 TellApart, Inc. Bain Capital, LLC 13.0 Intacct Corporation Split Rock Partners, LLC 12.3 Allegiance, Inc. El Dorado Ventures 12.0
27M&A & INVESTMENT SUMMARY JUNE 2011
g ,Sapato.ru Intel Capital 12.0 Alliance Health Networks, Inc. New World Ventures, LLC 11.0 Room 77 General Catalyst Partners LLC 10.5

ALL SEGMENTSVenture/Growth Capital Transactions ($ in Millions)
Reported
Target Buyer/Investor
Reported Transaction
Value VC/Growth CapitalValues Disclosed
StorSimple, Inc. Ignition Partners LLC $10.2Act-On Software, Inc. Trinity Ventures 10.0 AlterGeo Intel Capital 10.0 Justdial SAP Ventures 10.0 Service2Media BV Prime Ventures 10.0 SteelHouse, Inc. (Unnamed Fund Contibuters) 10.0 Bromium Andreessen Horowitz Fund 9.2 Pulse New Enterprise Associates 9.0 Taykey LTD. Sequoia Capital 9.0 VirtualWorks Group, Inc. New World Angels, Inc. 8.5 DisplayLink (Unnamed Fund Contibuters) 8.0 AisleBuyer, LLC Old Willow Partners, LLC 7.5 Basho Technologies Inc (Unnamed Fund Contibuters) 7 5 Basho Technologies, Inc. (Unnamed Fund Contibuters) 7.5 Digital Assent LLC BIP Investment Partners 7.5 Glympse, Inc. Menlo Ventures 7.5 OwnerIQ, Inc. Atlas Venture 7.0 Telltale Games IDG Ventures SF 7.0 VirtuOz, Inc. Mohr, Davidow Ventures 7.0 Nimbic, Inc. Austral Capital Partners 6.9 Facebook GSV Capital 6.6 Bunchball, Inc. Triangle Peak Partners, LP 6.5 , g ,Ifeelgoods Idinvest Partners 6.5 Health Guru Media, Inc. Western Technology Investment 6.0 Juice in the City Tandem Entrepreneurs 6.0 MovieClips, Inc. (Unnamed Fund Contibuters) 6.0 Smarter Agent, LLC (Unnamed Fund Contibuters) 6.0 UberMedia DLD Ventures 5.6 Cloud9 IDE Accel Partners 5.5 Kyruus, Inc. Highland Capital Partners 5.5 V l ll B t B C it l 5 5 Valencell Best Buy Capital 5.5 HealthTeacher, Inc. Chrysalis Ventures 5.3 OnSwipe Spark Capital 5.0 TravelShark DLA Holdings 5.0 LearnVest Accel Partners 4.5 ProtonMedia LLC Originate Ventures 4.5 ReadyForZero, Inc. Polaris Venture Partners 4.5 Viralheat Mayfield Fund 4.3 CustomerXPs Software Private Limited Jafco America Ventures, Inc. 4.0
28M&A & INVESTMENT SUMMARY JUNE 2011
CustomerXPs Software Private Limited Jafco America Ventures, Inc. 4.0 ROBLOX Corporation Altos Ventures 4.0 buuteeq, Inc. (Angel Investors) 3.5 Pressplane Madrona Venture Group 3.5

ALL SEGMENTSVenture/Growth Capital Transactions ($ in Millions)
Reported
Target Buyer/Investor
Reported Transaction
Value VC/Growth CapitalValues Disclosed
Social Point S.L. Nauta Capital $3.4Everloop Band of Angels 3.1 Canvas Networks Union Square Ventures 3.0 Boston Technologies, Inc. Bridge Bank, N.A. 2.5 Pawngo lightbank 2.3 Copious, Inc. Blackberry Partners Fund 2.0 FieldView Solutions SJF Ventures 2.0 Lendio, Inc. Square 1 Bank 2.0 LockPath, Inc. El Dorado Ventures 2.0 VibeDeck (Unnamed Fund Contibuters) 2.0 VideoGenie, Inc. Blumberg Capital 2.0 Tapad, Inc. FirstMark Capital 1.8 Assay Depot Inc (Unnamed Fund Contibuters) 1 7 Assay Depot, Inc. (Unnamed Fund Contibuters) 1.7 EDITD Index Ventures 1.6 OneLogin, Inc. Charles River Ventures 1.5 Vivecoach TIBCO Software, Inc. 1.5 Wave Accounting, Inc. OMERS Capital Partners 1.5 Wikets (Unnamed Fund Contibuters) 1.5 Restalo.es Restaurant Reservations Active Venture Partners 1.5 Smarterer True Ventures 1.3 XYDO EPIC Ventures 1.3 App47 Valhalla Partners, L.P. 1.0 Coursekit, Inc. Founder Collective 1.0 DoNanza Innovation Endeavors 1.0 GoAPK Shanda Interactive Entertainment Limited 1.0 myGengo, Inc. Point Nine Financial Technologies Limited 1.0 Pusher Ltd. Passion Capital 1.0 SocialVest Ventures, LLC Bluff Point Associates 1.0 Usabilla B.V. Boralis 1.0 P hT b I M h D id V t 0 9 PunchTab, Inc. Mohr, Davidow Ventures 0.9 CityPockets Great Oaks Venture Capital 0.7 AppRedeem SV Angel, LLC 0.7 OpenChime lightbank 0.7 BestVendor SoftBank Capital 0.6 500px, Inc. High Line Venture Partners 0.5 Ringleadr.com (Angel Investors) 0.5 LeftBrain Group Limited Baidu.com, Inc. 0.5
29M&A & INVESTMENT SUMMARY JUNE 2011

ALL SEGMENTSVenture/Growth Capital Transactions ($ in Millions)
Reported
Target Buyer/InvestorTransaction
Value VC/Growth CapitalUndisclosed
15miles LSF interactive, Inc. - Billing Revolution Citi Venture Capital International - Bloom Studio, Inc. O'Reilly AlphaTech Ventures, LLC - CodeGuard, Inc. Imlay Investments - , yCore Mobile Networks, Inc. Citrix Systems - Daily Deals for Mom (Angel Investors) - Eternite International Company Limited Aspire International, Inc. - Flirtic Almaz Capital Partners - PhoCusWright Northstar Travel Media, LLC - Sharecare, Inc. New Evolution Ventures - Shopobot Google Ventures - SoundCloud Ltd. A-Grade Fund - Vsee Salesforce.com - WorkSmart Labs, Inc. Kleiner Perkins Caufield & Byers -
30M&A & INVESTMENT SUMMARY JUNE 2011

F d d i 1999
Petsky Prunier: Expertise. Commitment. Results.
• Founded in 1999• Sectors covered: Digital Advertising, Digital Media/Commerce, Marketing Technology, Agency/Consulting,
Marketing Services, and Software & Information
• More than 30 focused professionals› Unique combination of investment banking and consulting expertise› New York-based with a West Coast office and a Chicago presence
• Deep relationships across a broad spectrum of private equity groups, senior and mezzanine lenders and strategic buyers
• Securities transactions processed through Petsky Prunier Securities LLC, a licensed broker-dealer
STRATEGIC ADVISORYIntelligenceINVESTMENT BANKING ConsultingIntelligence
• Sell-Side Representation• Corporate Divestitures• Capital Raising and Private
PlacementsM&A Ad iso
INVESTMENT BANKING Consulting
• Opportunity Mapping: Strategic Development
• Business Process Engineering/Enhancement
• M&T Transaction Due Diligence Support
• Market Research• Competitive Landscape Analysis• Valuation Analysis• Publishing & Thought Leadership
• M&A Advisory• Fairness Opinions
M&T Transaction Due Diligence Support• Acquisition Strategy/Target Identification
31M&A & INVESTMENT SUMMARY JUNE 2011

REPRESENTATIVE TRANSACTIONSSelected Transactions in 2010 and 2011
a leading advertising technology company
has been sold to
has sold
an integrated digital and promotional marketing agency
in a management-led buyout
to
a portfolio company of
Vestar Capital Partners has sold
has sold
a premier provider of affinity programs for universities and colleges
to
has acquired
a pioneer in measuring the impact of promotion on
physician prescribing behavior
has sold its
a leading provider of media buying, out-of-home and sampling
services in niche markets
to
Niche Market Media Buying Business
has received a majority investment fromhas acquired
has been sold to
a portfolio company of
KRG Capital Partners
one of North America’s largest mobile marketing and gateway
solution providers
and
a portfolio company of
Parthenon Capital Partners
has merged with
has acquired
a fast growing compiler of consumer marketing data
has been sold to
a leading online video advertising network
has received a growth capital investment from
has sold theExperiential Marketing Business of
to
has been sold to
a provider of multichannel marketing software services
has been sold to
a digital communications agency with a proprietary software
platform serving biopharmaceutical companies
has been sold to
one of Europe’s leading online advertising networks
has partnered with
to form a joint venture
C t S C d
refinancing of debt facilities
has been acquired by
a premier provider of benchmark-based advisory services to the
pharmaceutical and biotech industry
has acquired
a division of
has been sold to
a leading performance-basedadvertising network
has been sold toa leading national in-store
advertising network and shoppermarketing company
has sold
to
CentrSource Canada
has been acquired by
a leading marketing database and data analytics solution
provider
has been sold to
has sold the assets of
to
has sold its fulfillment and database management
divisions to
one of Europe’s largestindependent providers of
digital direct marketingservices for customer
acquisition and retentiona leading online community for
automotive enthusiastsand social networking
has sold
New Digital Group
32M&A & INVESTMENT SUMMARY JUNE 2011
to
The Dialogue Companya leading fulfillment and direct
marketing organization
has received a majorityinvestment from
technology platformto