Embed Size (px)
Citation preview

May 2017 M&A and Investment Summary
2 | M&A and Investment Summary May 2017
Table of Contents
Overview of Monthly M&A and Investment Activity 3 1
Monthly M&A and Investment Activity by Industry Segment 8 2
Additional Monthly M&A and Investment Activity Data 42 3
About Petsky Prunier 55 4
Securities offered through Petsky Prunier Securities, LLC, member of FINRA.
This M&A and Investment Summary has been prepared by and is being distributed in the United States by Petsky Prunier, a broker dealer registered with the U.S. SEC and a member of FINRA.

3 | M&A and Investment Summary May 2017
M&A and Investment Summary for All Segments
Transaction Distribution
A total of 520 deals were announced in May 2017, of which 323 were worth $44.6 billion in aggregate reported value
Software was the most active segment with 189 deals announced — 123 of these transactions reported $10.0 billion in value
Digital Media/Commerce was also active with 117 transactions announced, of which 94 were worth a reported $14.1 billion in value
Strategic buyers announced 203 deals (49 reported $14.9 billion in value)
VC/Growth Capital investors announced 291 transactions (262 reported $15.7 billion in value)
Private Equity investors announced 26 deals during the month (12 reported $13.9 billion in value)
* Sinclair Broadcast Group’s $6.6 billion acquisition of Tribune Media has been excluded to limit comparative distortions
# % $MM % # $MM # $MM # $MM
Software 189 36% $9,977.8 22% 59 $2,328.8 10 $4,845.0 120 $2,804.0
Digital Media/Commerce 117 23% 14,126.0 32% 36 2,027.4 2 1,500.0 79 10,598.6
Marketing Technology 85 16% 1,784.4 4% 20 178.1 3 564.0 62 1,042.3
Business Services 49 9% 13,318.4 30% 28 6,028.0 8 7,038.0 13 252.4
Agency & Marketing Services 28 5% 110.1 0% 25 105.1 2 - 1 5.0
Digital Advertising 26 5% 757.9 2% 14 626.2 1 - 11 131.7
Traditional Media 16 3% 570.0 1% 13 345.0 0 - 3 225.0
Information 10 2% 3,905.8 9% 8 3,292.8 0 - 2 613.0
Total 520 100% 44,550.4 100% 203 14,931.3 26 13,947.0 291 15,672.0
May 2017
BUYER/INVESTOR BREAKDOWN
Transactions Reported Value Strategic Buyout Venture/Growth Capital
4 | M&A and Investment Summary May 2017
$20.8
$33.7
$25.4$19.9
$24.1
$51.2
$42.6
$25.2
$73.1
$29.3
$44.7
$21.3$24.6
520432 491 427 473 463 449 419 415 457 449 545 471 $-
$100.0
$200.0
$300.0
$400.0
$500.0
$-
$10.0
$20.0
$30.0
$40.0
$50.0
$60.0
$70.0
$80.0
$90.0
$100.0
May-16 Jun-16 Jul-16 Aug-16 Sep-16 Oct-16 Nov-16 Dec-16 Jan-17 Feb-17 Mar-17 Apr-17 May-17
Transaction Distribution
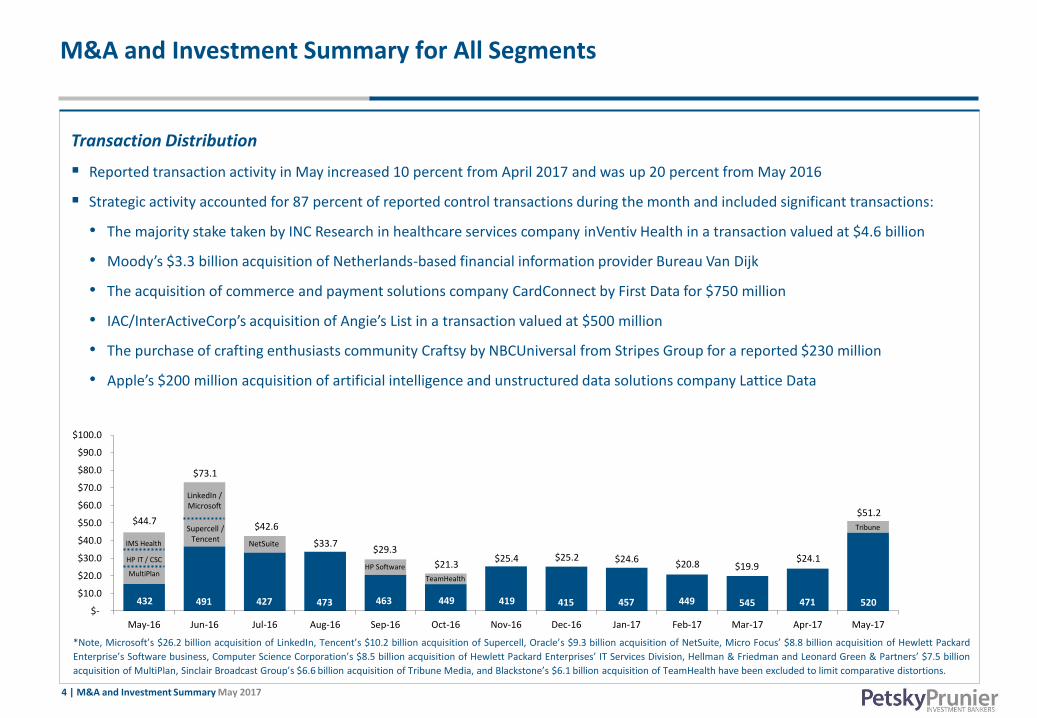
Reported transaction activity in May increased 10 percent from April 2017 and was up 20 percent from May 2016
Strategic activity accounted for 87 percent of reported control transactions during the month and included significant transactions:
• The majority stake taken by INC Research in healthcare services company inVentiv Health in a transaction valued at $4.6 billion
• Moody’s $3.3 billion acquisition of Netherlands-based financial information provider Bureau Van Dijk
• The acquisition of commerce and payment solutions company CardConnect by First Data for $750 million
• IAC/InterActiveCorp’s acquisition of Angie’s List in a transaction valued at $500 million
• The purchase of crafting enthusiasts community Craftsy by NBCUniversal from Stripes Group for a reported $230 million
• Apple’s $200 million acquisition of artificial intelligence and unstructured data solutions company Lattice Data
Supercell / Tencent
LinkedIn / Microsoft
IMS Health
HP IT / CSC
MultiPlan
NetSuite
HP Software
*Note, Microsoft’s $26.2 billion acquisition of LinkedIn, Tencent’s $10.2 billion acquisition of Supercell, Oracle’s $9.3 billion acquisition of NetSuite, Micro Focus’ $8.8 billion acquisition of Hewlett Packard
Enterprise’s Software business, Computer Science Corporation’s $8.5 billion acquisition of Hewlett Packard Enterprises’ IT Services Division, Hellman & Friedman and Leonard Green & Partners’ $7.5 billion
acquisition of MultiPlan, Sinclair Broadcast Group’s $6.6 billion acquisition of Tribune Media, and Blackstone’s $6.1 billion acquisition of TeamHealth have been excluded to limit comparative distortions.
M&A and Investment Summary for All Segments
TeamHealth
Tribune
5 | M&A and Investment Summary May 2017
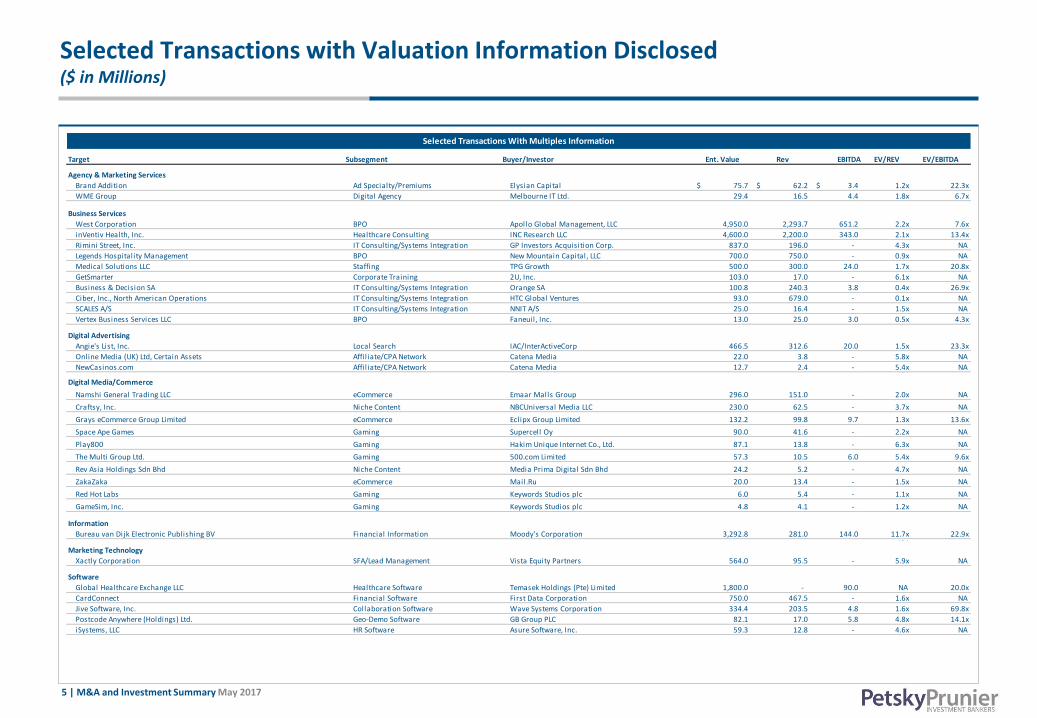
Selected Transactions with Valuation Information Disclosed ($ in Millions)
Target Subsegment Buyer/Investor Ent. Value Rev EBITDA EV/REV EV/EBITDA
Agency & Marketing Services
Brand Addition Ad Specialty/Premiums Elysian Capital 75.7$ 62.2$ 3.4$ 1.2x 22.3x
WME Group Digital Agency Melbourne IT Ltd. 29.4 16.5 4.4 1.8x 6.7x
Business Services
West Corporation BPO Apollo Global Management, LLC 4,950.0 2,293.7 651.2 2.2x 7.6x
inVentiv Health, Inc. Healthcare Consulting INC Research LLC 4,600.0 2,200.0 343.0 2.1x 13.4x
Rimini Street, Inc. IT Consulting/Systems Integration GP Investors Acquisition Corp. 837.0 196.0 - 4.3x NA
Legends Hospitality Management BPO New Mountain Capital, LLC 700.0 750.0 - 0.9x NA
Medical Solutions LLC Staffing TPG Growth 500.0 300.0 24.0 1.7x 20.8x
GetSmarter Corporate Training 2U, Inc. 103.0 17.0 - 6.1x NA
Business & Decision SA IT Consulting/Systems Integration Orange SA 100.8 240.3 3.8 0.4x 26.9x
Ciber, Inc., North American Operations IT Consulting/Systems Integration HTC Global Ventures 93.0 679.0 - 0.1x NA
SCALES A/S IT Consulting/Systems Integration NNIT A/S 25.0 16.4 - 1.5x NA
Vertex Business Services LLC BPO Faneuil, Inc. 13.0 25.0 3.0 0.5x 4.3x
Digital Advertising
Angie's List, Inc. Local Search IAC/InterActiveCorp 466.5 312.6 20.0 1.5x 23.3x
Online Media (UK) Ltd, Certain Assets Affil iate/CPA Network Catena Media 22.0 3.8 - 5.8x NA
NewCasinos.com Affil iate/CPA Network Catena Media 12.7 2.4 - 5.4x NA NA
Digital Media/Commerce
Namshi General Trading LLC eCommerce Emaar Malls Group 296.0 151.0 - 2.0x NA
Craftsy, Inc. Niche Content NBCUniversal Media LLC 230.0 62.5 - 3.7x NA
Grays eCommerce Group Limited eCommerce Eclipx Group Limited 132.2 99.8 9.7 1.3x 13.6x
Space Ape Games Gaming Supercell Oy 90.0 41.6 - 2.2x NA
Play800 Gaming Hakim Unique Internet Co., Ltd. 87.1 13.8 - 6.3x NA
The Multi Group Ltd. Gaming 500.com Limited 57.3 10.5 6.0 5.4x 9.6x
Rev Asia Holdings Sdn Bhd Niche Content Media Prima Digital Sdn Bhd 24.2 5.2 - 4.7x NA
ZakaZaka eCommerce Mail.Ru 20.0 13.4 - 1.5x NA
Red Hot Labs Gaming Keywords Studios plc 6.0 5.4 - 1.1x NA
GameSim, Inc. Gaming Keywords Studios plc 4.8 4.1 - 1.2x NA
Information
Bureau van Dijk Electronic Publishing BV Financial Information Moody's Corporation 3,292.8 281.0 144.0 11.7x 22.9xNA
Marketing Technology
Xactly Corporation SFA/Lead Management Vista Equity Partners 564.0 95.5 - 5.9x NA
Software
Global Healthcare Exchange LLC Healthcare Software Temasek Holdings (Pte) Limited 1,800.0 - 90.0 NA 20.0x
CardConnect Financial Software First Data Corporation 750.0 467.5 - 1.6x NA
Jive Software, Inc. Collaboration Software Wave Systems Corporation 334.4 203.5 4.8 1.6x 69.8x
Postcode Anywhere (Holdings) Ltd. Geo-Demo Software GB Group PLC 82.1 17.0 5.8 4.8x 14.1x
iSystems, LLC HR Software Asure Software, Inc. 59.3 12.8 - 4.6x NA
Selected Transactions With Multiples Information
6 | M&A and Investment Summary May 2017
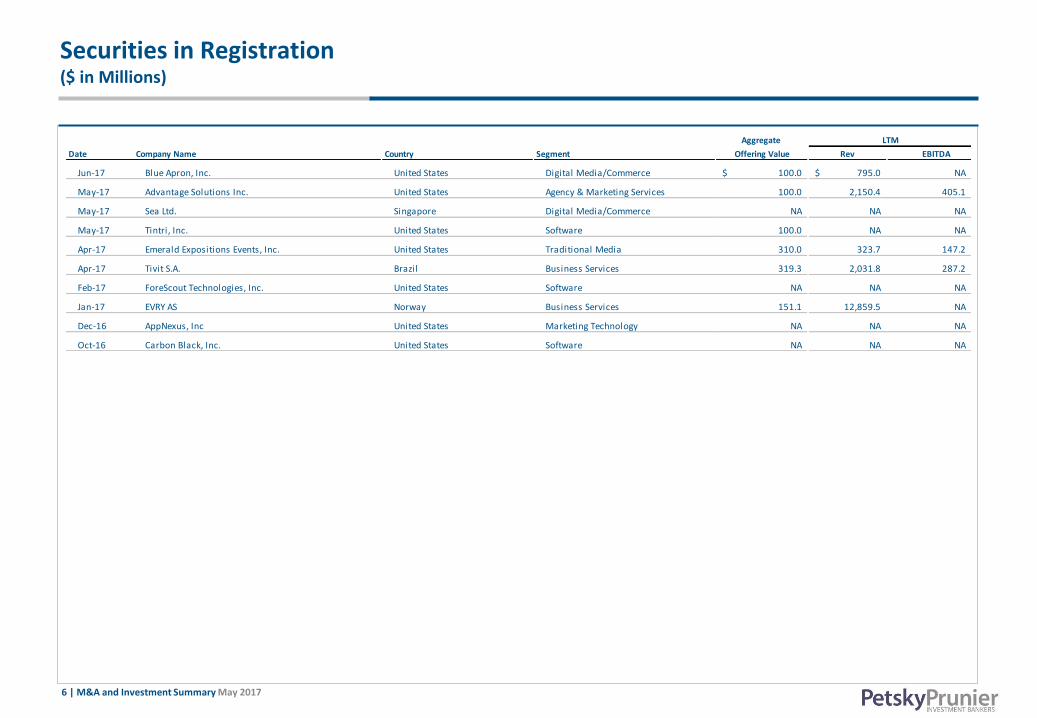
Securities in Registration ($ in Millions)
Aggregate
Date Company Name Country Segment Offering Value Rev EBITDA
Jun-17 Blue Apron, Inc. United States Digital Media/Commerce 100.0$ 795.0$ NA
May-17 Advantage Solutions Inc. United States Agency & Marketing Services 100.0 2,150.4 405.1
May-17 Sea Ltd. Singapore Digital Media/Commerce NA NA NA
May-17 Tintri, Inc. United States Software 100.0 NA NA
Apr-17 Emerald Expositions Events, Inc. United States Traditional Media 310.0 323.7 147.2
Apr-17 Tivit S.A. Brazil Business Services 319.3 2,031.8 287.2
Feb-17 ForeScout Technologies, Inc. United States Software NA NA NA
Jan-17 EVRY AS Norway Business Services 151.1 12,859.5 NA
Dec-16 AppNexus, Inc United States Marketing Technology NA NA NA
Oct-16 Carbon Black, Inc. United States Software NA NA NA
LTM
7 | M&A and Investment Summary May 2017
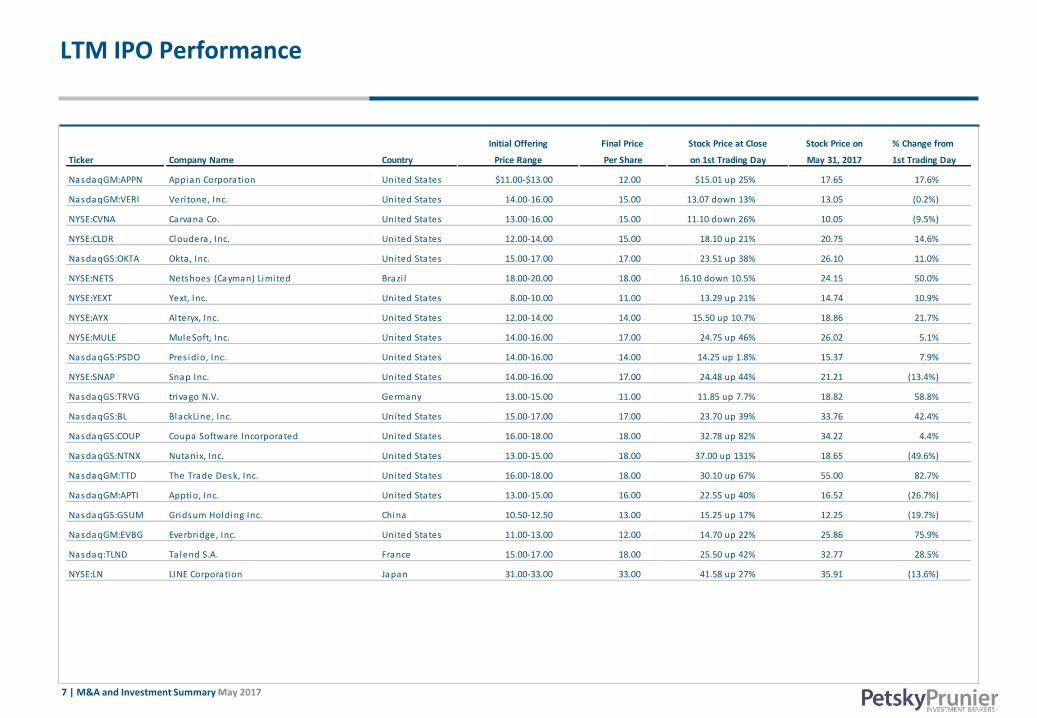
LTM IPO Performance
Initial Offering Final Price Stock Price at Close Stock Price on % Change from
Ticker Company Name Country Price Range Per Share on 1st Trading Day May 31, 2017 1st Trading Day
NasdaqGM:APPN Appian Corporation United States $11.00-$13.00 12.00 $15.01 up 25% 17.65 17.6%
NasdaqGM:VERI Veri tone, Inc. United States 14.00-16.00 15.00 13.07 down 13% 13.05 (0.2%)
NYSE:CVNA Carvana Co. United States 13.00-16.00 15.00 11.10 down 26% 10.05 (9.5%)
NYSE:CLDR Cloudera, Inc. United States 12.00-14.00 15.00 18.10 up 21% 20.75 14.6%
NasdaqGS:OKTA Okta, Inc. United States 15.00-17.00 17.00 23.51 up 38% 26.10 11.0%
NYSE:NETS Netshoes (Cayman) Limited Brazi l 18.00-20.00 18.00 16.10 down 10.5% 24.15 50.0%
NYSE:YEXT Yext, Inc. United States 8.00-10.00 11.00 13.29 up 21% 14.74 10.9%
NYSE:AYX Alteryx, Inc. United States 12.00-14.00 14.00 15.50 up 10.7% 18.86 21.7%
NYSE:MULE MuleSoft, Inc. United States 14.00-16.00 17.00 24.75 up 46% 26.02 5.1%
NasdaqGS:PSDO Pres idio, Inc. United States 14.00-16.00 14.00 14.25 up 1.8% 15.37 7.9%
NYSE:SNAP Snap Inc. United States 14.00-16.00 17.00 24.48 up 44% 21.21 (13.4%)
NasdaqGS:TRVG trivago N.V. Germany 13.00-15.00 11.00 11.85 up 7.7% 18.82 58.8%
NasdaqGS:BL BlackLine, Inc. United States 15.00-17.00 17.00 23.70 up 39% 33.76 42.4%
NasdaqGS:COUP Coupa Software Incorporated United States 16.00-18.00 18.00 32.78 up 82% 34.22 4.4%
NasdaqGS:NTNX Nutanix, Inc. United States 13.00-15.00 18.00 37.00 up 131% 18.65 (49.6%)
NasdaqGM:TTD The Trade Desk, Inc. United States 16.00-18.00 18.00 30.10 up 67% 55.00 82.7%
NasdaqGM:APTI Apptio, Inc. United States 13.00-15.00 16.00 22.55 up 40% 16.52 (26.7%)
NasdaqGS:GSUM Gridsum Holding Inc. China 10.50-12.50 13.00 15.25 up 17% 12.25 (19.7%)
NasdaqGM:EVBG Everbridge, Inc. United States 11.00-13.00 12.00 14.70 up 22% 25.86 75.9%
Nasdaq:TLND Talend S.A. France 15.00-17.00 18.00 25.50 up 42% 32.77 28.5%
NYSE:LN LINE Corporation Japan 31.00-33.00 33.00 41.58 up 27% 35.91 (13.6%)
8 | M&A and Investment Summary May 2017
Digital Media/Commerce
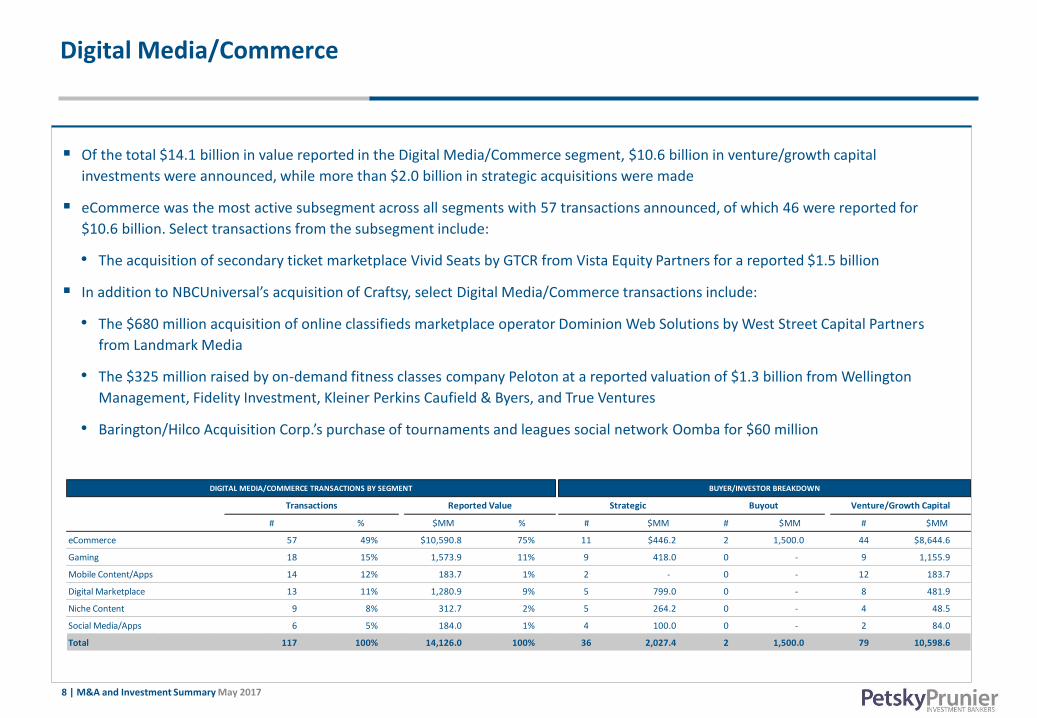
Of the total $14.1 billion in value reported in the Digital Media/Commerce segment, $10.6 billion in venture/growth capital
investments were announced, while more than $2.0 billion in strategic acquisitions were made
eCommerce was the most active subsegment across all segments with 57 transactions announced, of which 46 were reported for
$10.6 billion. Select transactions from the subsegment include:
• The acquisition of secondary ticket marketplace Vivid Seats by GTCR from Vista Equity Partners for a reported $1.5 billion
In addition to NBCUniversal’s acquisition of Craftsy, select Digital Media/Commerce transactions include:
• The $680 million acquisition of online classifieds marketplace operator Dominion Web Solutions by West Street Capital Partners
from Landmark Media
• The $325 million raised by on-demand fitness classes company Peloton at a reported valuation of $1.3 billion from Wellington
Management, Fidelity Investment, Kleiner Perkins Caufield & Byers, and True Ventures
• Barington/Hilco Acquisition Corp.’s purchase of tournaments and leagues social network Oomba for $60 million
* Microsoft’s $26.2 billion acquisition of LinkedIn and Tencent’s $10.2 billion acquisition of Supercell have been excluded to limit comparative distortions
# % $MM % # $MM # $MM # $MM
eCommerce 57 49% $10,590.8 75% 11 $446.2 2 1,500.0 44 $8,644.6
Gaming 18 15% 1,573.9 11% 9 418.0 0 - 9 1,155.9
Mobile Content/Apps 14 12% 183.7 1% 2 - 0 - 12 183.7
Digital Marketplace 13 11% 1,280.9 9% 5 799.0 0 - 8 481.9
Niche Content 9 8% 312.7 2% 5 264.2 0 - 4 48.5
Social Media/Apps 6 5% 184.0 1% 4 100.0 0 - 2 84.0
Total 117 100% 14,126.0 100% 36 2,027.4 2 1,500.0 79 10,598.6
BUYER/INVESTOR BREAKDOWN
Transactions Reported Value Strategic Buyout Venture/Growth Capital
DIGITAL MEDIA/COMMERCE TRANSACTIONS BY SEGMENT
9 | M&A and Investment Summary May 2017
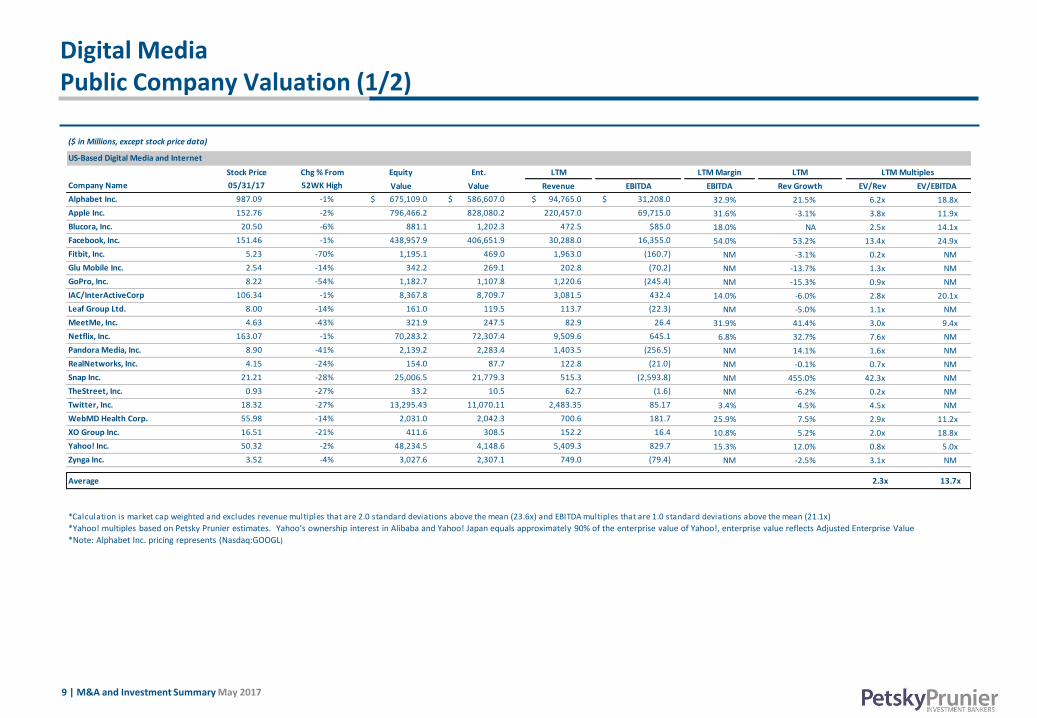
Digital Media Public Company Valuation (1/2)
*Note: Alphabet Inc. pricing represents (Nasdaq:GOOGL)
*Yahoo! multiples based on Petsky Prunier estimates. Yahoo’s ownership interest in Alibaba and Yahoo! Japan equals approximately 90% of the enterprise value of Yahoo!, enterprise value reflects Adjusted Enterprise Value
($ in Millions, except stock price data)
Stock Price Chg % From Equity Ent. LTM LTM Margin LTM LTM Multiples
Company Name 05/31/17 52WK High Value Value Revenue EBITDA EBITDA Rev Growth EV/Rev EV/EBITDA
Alphabet Inc. 987.09 -1% $ 675,109.0 $ 586,607.0 $ 94,765.0 $ 31,208.0 32.9% 21.5% 6.2x 18.8x
Apple Inc. 152.76 -2% 796,466.2 828,080.2 220,457.0 69,715.0 31.6% -3.1% 3.8x 11.9x
Blucora, Inc. 20.50 -6% 881.1 1,202.3 472.5 $85.0 18.0% NA 2.5x 14.1x
Facebook, Inc. 151.46 -1% 438,957.9 406,651.9 30,288.0 16,355.0 54.0% 53.2% 13.4x 24.9x
Fitbit, Inc. 5.23 -70% 1,195.1 469.0 1,963.0 (160.7) NM -3.1% 0.2x NM
Glu Mobile Inc. 2.54 -14% 342.2 269.1 202.8 (70.2) NM -13.7% 1.3x NM
GoPro, Inc. 8.22 -54% 1,182.7 1,107.8 1,220.6 (245.4) NM -15.3% 0.9x NM
IAC/InterActiveCorp 106.34 -1% 8,367.8 8,709.7 3,081.5 432.4 14.0% -6.0% 2.8x 20.1x
Leaf Group Ltd. 8.00 -14% 161.0 119.5 113.7 (22.3) NM -5.0% 1.1x NM
MeetMe, Inc. 4.63 -43% 321.9 247.5 82.9 26.4 31.9% 41.4% 3.0x 9.4x
Netflix, Inc. 163.07 -1% 70,283.2 72,307.4 9,509.6 645.1 6.8% 32.7% 7.6x NM
Pandora Media, Inc. 8.90 -41% 2,139.2 2,283.4 1,403.5 (256.5) NM 14.1% 1.6x NM
RealNetworks, Inc. 4.15 -24% 154.0 87.7 122.8 (21.0) NM -0.1% 0.7x NM
Snap Inc. 21.21 -28% 25,006.5 21,779.3 515.3 (2,593.8) NM 455.0% 42.3x NM
TheStreet, Inc. 0.93 -27% 33.2 10.5 62.7 (1.6) NM -6.2% 0.2x NM
Twitter, Inc. 18.32 -27% 13,295.43 11,070.11 2,483.35 85.17 3.4% 4.5% 4.5x NM
WebMD Health Corp. 55.98 -14% 2,031.0 2,042.3 700.6 181.7 25.9% 7.5% 2.9x 11.2x
XO Group Inc. 16.51 -21% 411.6 308.5 152.2 16.4 10.8% 5.2% 2.0x 18.8x
Yahoo! Inc. 50.32 -2% 48,234.5 4,148.6 5,409.3 829.7 15.3% 12.0% 0.8x 5.0x
Zynga Inc. 3.52 -4% 3,027.6 2,307.1 749.0 (79.4) NM -2.5% 3.1x NM
Average 2.3x 13.7x
*Calculation is market cap weighted and excludes revenue multiples that are 2.0 standard deviations above the mean (23.6x) and EBITDA multiples that are 1.0 standard deviations above the mean (21.1x)
US-Based Digital Media and Internet
10 | M&A and Investment Summary May 2017
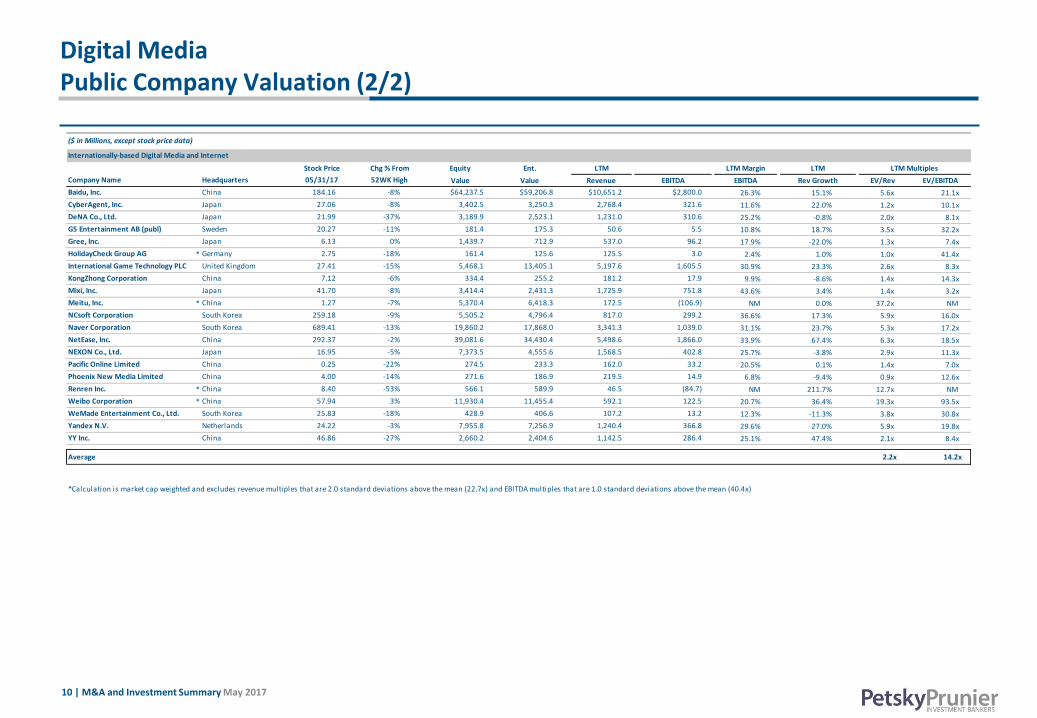
Digital Media Public Company Valuation (2/2)
($ in Millions, except stock price data)
Stock Price Chg % From Equity Ent. LTM LTM Margin LTM LTM Multiples
Company Name Headquarters 05/31/17 52WK High Value Value Revenue EBITDA EBITDA Rev Growth EV/Rev EV/EBITDA
Baidu, Inc. China 184.16 -8% $64,237.5 $59,206.8 $10,651.2 $2,800.0 26.3% 15.1% 5.6x 21.1x
CyberAgent, Inc. Japan 27.06 -8% 3,402.5 3,250.3 2,768.4 321.6 11.6% 22.0% 1.2x 10.1x
DeNA Co., Ltd. Japan 21.99 -37% 3,189.9 2,523.1 1,231.0 310.6 25.2% -0.8% 2.0x 8.1x
G5 Entertainment AB (publ) Sweden 20.27 -11% 181.4 175.3 50.6 5.5 10.8% 18.7% 3.5x 32.2x
Gree, Inc. Japan 6.13 0% 1,439.7 712.9 537.0 96.2 17.9% -22.0% 1.3x 7.4x
HolidayCheck Group AG * Germany 2.75 -18% 161.4 125.6 125.5 3.0 2.4% 1.0% 1.0x 41.4x
International Game Technology PLC United Kingdom 27.41 -15% 5,468.1 13,405.1 5,197.6 1,605.5 30.9% 23.3% 2.6x 8.3x
KongZhong Corporation China 7.12 -6% 334.4 255.2 181.2 17.9 9.9% -8.6% 1.4x 14.3x
Mixi, Inc. Japan 41.70 -8% 3,414.4 2,431.3 1,725.9 751.8 43.6% 3.4% 1.4x 3.2x
Meitu, Inc. * China 1.27 -7% 5,370.4 6,418.3 172.5 (106.9) NM 0.0% 37.2x NM
NCsoft Corporation South Korea 259.18 -9% 5,505.2 4,796.4 817.0 299.2 36.6% 17.3% 5.9x 16.0x
Naver Corporation South Korea 689.41 -13% 19,860.2 17,868.0 3,341.3 1,039.0 31.1% 23.7% 5.3x 17.2x
NetEase, Inc. China 292.37 -2% 39,081.6 34,430.4 5,498.6 1,866.0 33.9% 67.4% 6.3x 18.5x
NEXON Co., Ltd. Japan 16.95 -5% 7,373.5 4,555.6 1,568.5 402.8 25.7% -3.8% 2.9x 11.3x
Pacific Online Limited China 0.25 -22% 274.5 233.3 162.0 33.2 20.5% 0.1% 1.4x 7.0x
Phoenix New Media Limited China 4.00 -14% 271.6 186.9 219.5 14.9 6.8% -9.4% 0.9x 12.6x
Renren Inc. * China 8.40 -53% 566.1 589.9 46.5 (84.7) NM 211.7% 12.7x NM
Weibo Corporation * China 57.94 3% 11,930.4 11,455.4 592.1 122.5 20.7% 36.4% 19.3x 93.5x
WeMade Entertainment Co., Ltd. South Korea 25.83 -18% 428.9 406.6 107.2 13.2 12.3% -11.3% 3.8x 30.8x
Yandex N.V. Netherlands 24.22 -3% 7,955.8 7,256.9 1,240.4 366.8 29.6% 27.0% 5.9x 19.8x
YY Inc. China 46.86 -27% 2,660.2 2,404.6 1,142.5 286.4 25.1% 47.4% 2.1x 8.4x
Average 2.2x 14.2x
*Calculation is market cap weighted and excludes revenue multiples that are 2.0 standard deviations above the mean (22.7x) and EBITDA multiples that are 1.0 standard deviations above the mean (40.4x)
Internationally-based Digital Media and Internet
11 | M&A and Investment Summary May 2017
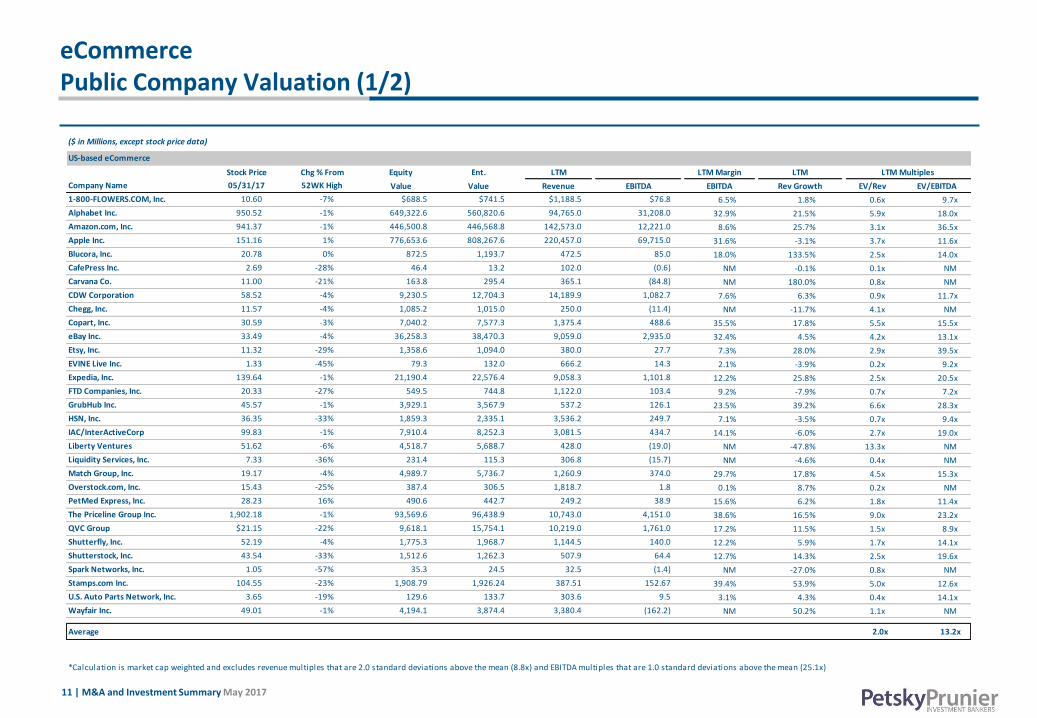
eCommerce Public Company Valuation (1/2)
($ in Millions, except stock price data)
Stock Price Chg % From Equity Ent. LTM LTM Margin LTM LTM Multiples
Company Name 05/31/17 52WK High Value Value Revenue EBITDA EBITDA Rev Growth EV/Rev EV/EBITDA
1-800-FLOWERS.COM, Inc. 10.60 -7% $688.5 $741.5 $1,188.5 $76.8 6.5% 1.8% 0.6x 9.7x
Alphabet Inc. 950.52 -1% 649,322.6 560,820.6 94,765.0 31,208.0 32.9% 21.5% 5.9x 18.0x
Amazon.com, Inc. 941.37 -1% 446,500.8 446,568.8 142,573.0 12,221.0 8.6% 25.7% 3.1x 36.5x
Apple Inc. 151.16 1% 776,653.6 808,267.6 220,457.0 69,715.0 31.6% -3.1% 3.7x 11.6x
Blucora, Inc. 20.78 0% 872.5 1,193.7 472.5 85.0 18.0% 133.5% 2.5x 14.0x
CafePress Inc. 2.69 -28% 46.4 13.2 102.0 (0.6) NM -0.1% 0.1x NM
Carvana Co. 11.00 -21% 163.8 295.4 365.1 (84.8) NM 180.0% 0.8x NM
CDW Corporation 58.52 -4% 9,230.5 12,704.3 14,189.9 1,082.7 7.6% 6.3% 0.9x 11.7x
Chegg, Inc. 11.57 -4% 1,085.2 1,015.0 250.0 (11.4) NM -11.7% 4.1x NM
Copart, Inc. 30.59 -3% 7,040.2 7,577.3 1,375.4 488.6 35.5% 17.8% 5.5x 15.5x
eBay Inc. 33.49 -4% 36,258.3 38,470.3 9,059.0 2,935.0 32.4% 4.5% 4.2x 13.1x
Etsy, Inc. 11.32 -29% 1,358.6 1,094.0 380.0 27.7 7.3% 28.0% 2.9x 39.5x
EVINE Live Inc. 1.33 -45% 79.3 132.0 666.2 14.3 2.1% -3.9% 0.2x 9.2x
Expedia, Inc. 139.64 -1% 21,190.4 22,576.4 9,058.3 1,101.8 12.2% 25.8% 2.5x 20.5x
FTD Companies, Inc. 20.33 -27% 549.5 744.8 1,122.0 103.4 9.2% -7.9% 0.7x 7.2x
GrubHub Inc. 45.57 -1% 3,929.1 3,567.9 537.2 126.1 23.5% 39.2% 6.6x 28.3x
HSN, Inc. 36.35 -33% 1,859.3 2,335.1 3,536.2 249.7 7.1% -3.5% 0.7x 9.4x
IAC/InterActiveCorp 99.83 -1% 7,910.4 8,252.3 3,081.5 434.7 14.1% -6.0% 2.7x 19.0x
Liberty Ventures 51.62 -6% 4,518.7 5,688.7 428.0 (19.0) NM -47.8% 13.3x NM
Liquidity Services, Inc. 7.33 -36% 231.4 115.3 306.8 (15.7) NM -4.6% 0.4x NM
Match Group, Inc. 19.17 -4% 4,989.7 5,736.7 1,260.9 374.0 29.7% 17.8% 4.5x 15.3x
Overstock.com, Inc. 15.43 -25% 387.4 306.5 1,818.7 1.8 0.1% 8.7% 0.2x NM
PetMed Express, Inc. 28.23 16% 490.6 442.7 249.2 38.9 15.6% 6.2% 1.8x 11.4x
The Priceline Group Inc. 1,902.18 -1% 93,569.6 96,438.9 10,743.0 4,151.0 38.6% 16.5% 9.0x 23.2x
QVC Group $21.15 -22% 9,618.1 15,754.1 10,219.0 1,761.0 17.2% 11.5% 1.5x 8.9x
Shutterfly, Inc. 52.19 -4% 1,775.3 1,968.7 1,144.5 140.0 12.2% 5.9% 1.7x 14.1x
Shutterstock, Inc. 43.54 -33% 1,512.6 1,262.3 507.9 64.4 12.7% 14.3% 2.5x 19.6x
Spark Networks, Inc. 1.05 -57% 35.3 24.5 32.5 (1.4) NM -27.0% 0.8x NM
Stamps.com Inc. 104.55 -23% 1,908.79 1,926.24 387.51 152.67 39.4% 53.9% 5.0x 12.6x
U.S. Auto Parts Network, Inc. 3.65 -19% 129.6 133.7 303.6 9.5 3.1% 4.3% 0.4x 14.1x
Wayfair Inc. 49.01 -1% 4,194.1 3,874.4 3,380.4 (162.2) NM 50.2% 1.1x NM
Average 2.0x 13.2x
*Calculation is market cap weighted and excludes revenue multiples that are 2.0 standard deviations above the mean (8.8x) and EBITDA multiples that are 1.0 standard deviations above the mean (25.1x)
US-based eCommerce
12 | M&A and Investment Summary May 2017
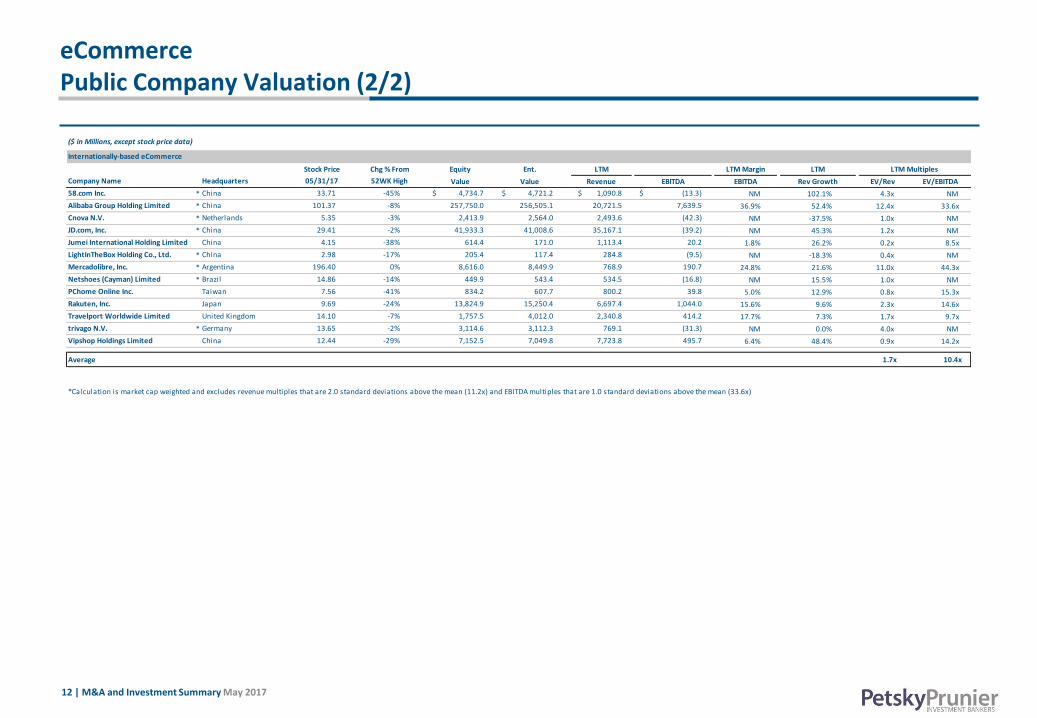
eCommerce Public Company Valuation (2/2)
($ in Millions, except stock price data)
Stock Price Chg % From Equity Ent. LTM LTM Margin LTM LTM Multiples
Company Name Headquarters 05/31/17 52WK High Value Value Revenue EBITDA EBITDA Rev Growth EV/Rev EV/EBITDA
58.com Inc. * China 33.71 -45% $ 4,734.7 $ 4,721.2 $ 1,090.8 $ (13.3) NM 102.1% 4.3x NM
Alibaba Group Holding Limited * China 101.37 -8% 257,750.0 256,505.1 20,721.5 7,639.5 36.9% 52.4% 12.4x 33.6x
Cnova N.V. * Netherlands 5.35 -3% 2,413.9 2,564.0 2,493.6 (42.3) NM -37.5% 1.0x NM
JD.com, Inc. * China 29.41 -2% 41,933.3 41,008.6 35,167.1 (39.2) NM 45.3% 1.2x NM
Jumei International Holding Limited China 4.15 -38% 614.4 171.0 1,113.4 20.2 1.8% 26.2% 0.2x 8.5x
LightInTheBox Holding Co., Ltd. * China 2.98 -17% 205.4 117.4 284.8 (9.5) NM -18.3% 0.4x NM
Mercadolibre, Inc. * Argentina 196.40 0% 8,616.0 8,449.9 768.9 190.7 24.8% 21.6% 11.0x 44.3x
Netshoes (Cayman) Limited * Brazil 14.86 -14% 449.9 543.4 534.5 (16.8) NM 15.5% 1.0x NM
PChome Online Inc. Taiwan 7.56 -41% 834.2 607.7 800.2 39.8 5.0% 12.9% 0.8x 15.3x
Rakuten, Inc. Japan 9.69 -24% 13,824.9 15,250.4 6,697.4 1,044.0 15.6% 9.6% 2.3x 14.6x
Travelport Worldwide Limited United Kingdom 14.10 -7% 1,757.5 4,012.0 2,340.8 414.2 17.7% 7.3% 1.7x 9.7x
trivago N.V. * Germany 13.65 -2% 3,114.6 3,112.3 769.1 (31.3) NM 0.0% 4.0x NM
Vipshop Holdings Limited China 12.44 -29% 7,152.5 7,049.8 7,723.8 495.7 6.4% 48.4% 0.9x 14.2x
Average 1.7x 10.4x
*Calculation is market cap weighted and excludes revenue multiples that are 2.0 standard deviations above the mean (11.2x) and EBITDA multiples that are 1.0 standard deviations above the mean (33.6x)
Internationally-based eCommerce
13 | M&A and Investment Summary May 2017
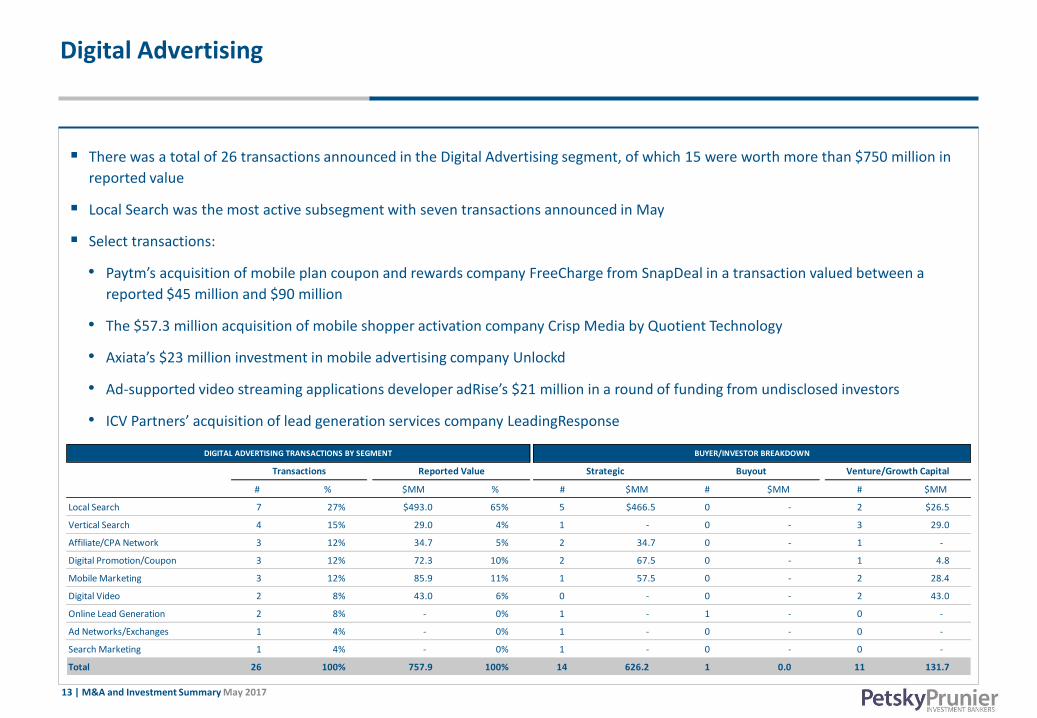
Digital Advertising
There was a total of 26 transactions announced in the Digital Advertising segment, of which 15 were worth more than $750 million in
reported value
Local Search was the most active subsegment with seven transactions announced in May
Select transactions:
• Paytm’s acquisition of mobile plan coupon and rewards company FreeCharge from SnapDeal in a transaction valued between a
reported $45 million and $90 million
• The $57.3 million acquisition of mobile shopper activation company Crisp Media by Quotient Technology
• Axiata’s $23 million investment in mobile advertising company Unlockd
• Ad-supported video streaming applications developer adRise’s $21 million in a round of funding from undisclosed investors
• ICV Partners’ acquisition of lead generation services company LeadingResponse
• J2 Global’s acquisition of email services company MailerMailer
# % $MM % # $MM # $MM # $MM
Local Search 7 27% $493.0 65% 5 $466.5 0 - 2 $26.5
Vertical Search 4 15% 29.0 4% 1 - 0 - 3 29.0
Affiliate/CPA Network 3 12% 34.7 5% 2 34.7 0 - 1 -
Digital Promotion/Coupon 3 12% 72.3 10% 2 67.5 0 - 1 4.8
Mobile Marketing 3 12% 85.9 11% 1 57.5 0 - 2 28.4
Digital Video 2 8% 43.0 6% 0 - 0 - 2 43.0
Online Lead Generation 2 8% - 0% 1 - 1 - 0 -
Ad Networks/Exchanges 1 4% - 0% 1 - 0 - 0 -
Search Marketing 1 4% - 0% 1 - 0 - 0 -
Total 26 100% 757.9 100% 14 626.2 1 0.0 11 131.7
DIGITAL ADVERTISING TRANSACTIONS BY SEGMENT BUYER/INVESTOR BREAKDOWN
Transactions Reported Value Strategic Buyout Venture/Growth Capital
14 | M&A and Investment Summary May 2017
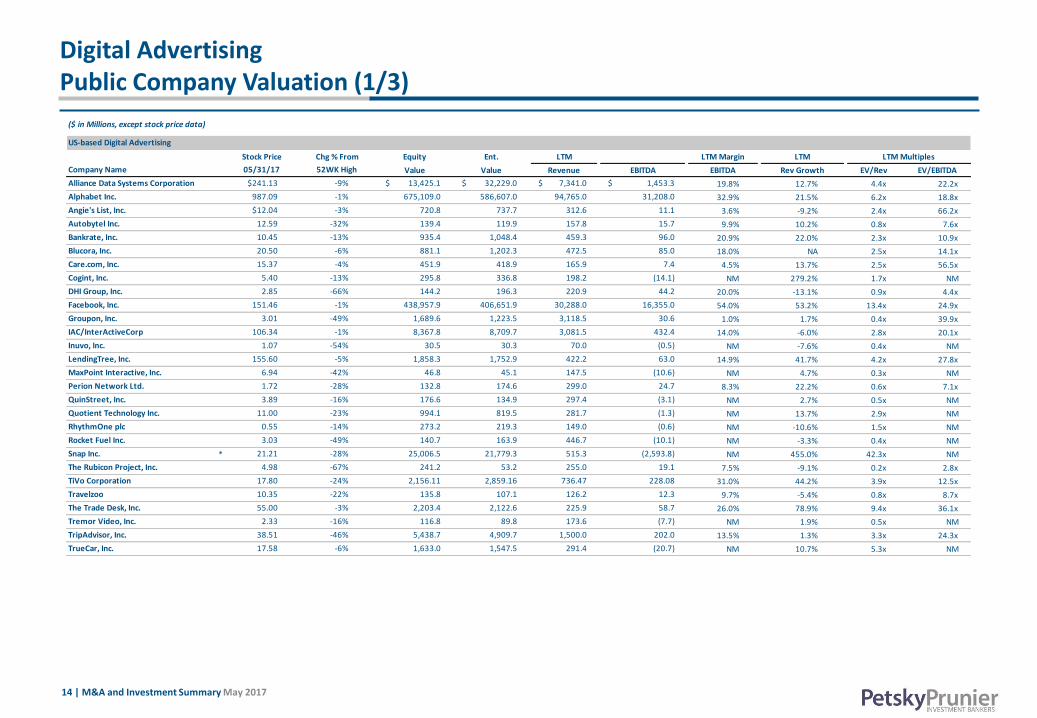
Digital Advertising Public Company Valuation (1/3)
($ in Millions, except stock price data)
US-based Digital Advertising
Stock Price Chg % From Equity Ent. LTM LTM Margin LTM LTM Multiples
Company Name 05/31/17 52WK High Value Value Revenue EBITDA EBITDA Rev Growth EV/Rev EV/EBITDA
Alliance Data Systems Corporation $241.13 -9% $ 13,425.1 $ 32,229.0 $ 7,341.0 $ 1,453.3 19.8% 12.7% 4.4x 22.2x
Alphabet Inc. 987.09 -1% 675,109.0 586,607.0 94,765.0 31,208.0 32.9% 21.5% 6.2x 18.8x
Angie's List, Inc. $12.04 -3% 720.8 737.7 312.6 11.1 3.6% -9.2% 2.4x 66.2x
Autobytel Inc. 12.59 -32% 139.4 119.9 157.8 15.7 9.9% 10.2% 0.8x 7.6x
Bankrate, Inc. 10.45 -13% 935.4 1,048.4 459.3 96.0 20.9% 22.0% 2.3x 10.9x
Blucora, Inc. 20.50 -6% 881.1 1,202.3 472.5 85.0 18.0% NA 2.5x 14.1x
Care.com, Inc. 15.37 -4% 451.9 418.9 165.9 7.4 4.5% 13.7% 2.5x 56.5x
Cogint, Inc. 5.40 -13% 295.8 336.8 198.2 (14.1) NM 279.2% 1.7x NM
DHI Group, Inc. 2.85 -66% 144.2 196.3 220.9 44.2 20.0% -13.1% 0.9x 4.4x
Facebook, Inc. 151.46 -1% 438,957.9 406,651.9 30,288.0 16,355.0 54.0% 53.2% 13.4x 24.9x
Groupon, Inc. 3.01 -49% 1,689.6 1,223.5 3,118.5 30.6 1.0% 1.7% 0.4x 39.9x
IAC/InterActiveCorp 106.34 -1% 8,367.8 8,709.7 3,081.5 432.4 14.0% -6.0% 2.8x 20.1x
Inuvo, Inc. 1.07 -54% 30.5 30.3 70.0 (0.5) NM -7.6% 0.4x NM
LendingTree, Inc. 155.60 -5% 1,858.3 1,752.9 422.2 63.0 14.9% 41.7% 4.2x 27.8x
MaxPoint Interactive, Inc. 6.94 -42% 46.8 45.1 147.5 (10.6) NM 4.7% 0.3x NM
Perion Network Ltd. 1.72 -28% 132.8 174.6 299.0 24.7 8.3% 22.2% 0.6x 7.1x
QuinStreet, Inc. 3.89 -16% 176.6 134.9 297.4 (3.1) NM 2.7% 0.5x NM
Quotient Technology Inc. 11.00 -23% 994.1 819.5 281.7 (1.3) NM 13.7% 2.9x NM
RhythmOne plc 0.55 -14% 273.2 219.3 149.0 (0.6) NM -10.6% 1.5x NM
Rocket Fuel Inc. 3.03 -49% 140.7 163.9 446.7 (10.1) NM -3.3% 0.4x NM
Snap Inc. * 21.21 -28% 25,006.5 21,779.3 515.3 (2,593.8) NM 455.0% 42.3x NM
The Rubicon Project, Inc. 4.98 -67% 241.2 53.2 255.0 19.1 7.5% -9.1% 0.2x 2.8x
TiVo Corporation 17.80 -24% 2,156.11 2,859.16 736.47 228.08 31.0% 44.2% 3.9x 12.5x
Travelzoo 10.35 -22% 135.8 107.1 126.2 12.3 9.7% -5.4% 0.8x 8.7x
The Trade Desk, Inc. 55.00 -3% 2,203.4 2,122.6 225.9 58.7 26.0% 78.9% 9.4x 36.1x
Tremor Video, Inc. 2.33 -16% 116.8 89.8 173.6 (7.7) NM 1.9% 0.5x NM
TripAdvisor, Inc. 38.51 -46% 5,438.7 4,909.7 1,500.0 202.0 13.5% 1.3% 3.3x 24.3x
TrueCar, Inc. 17.58 -6% 1,633.0 1,547.5 291.4 (20.7) NM 10.7% 5.3x NM
15 | M&A and Investment Summary May 2017
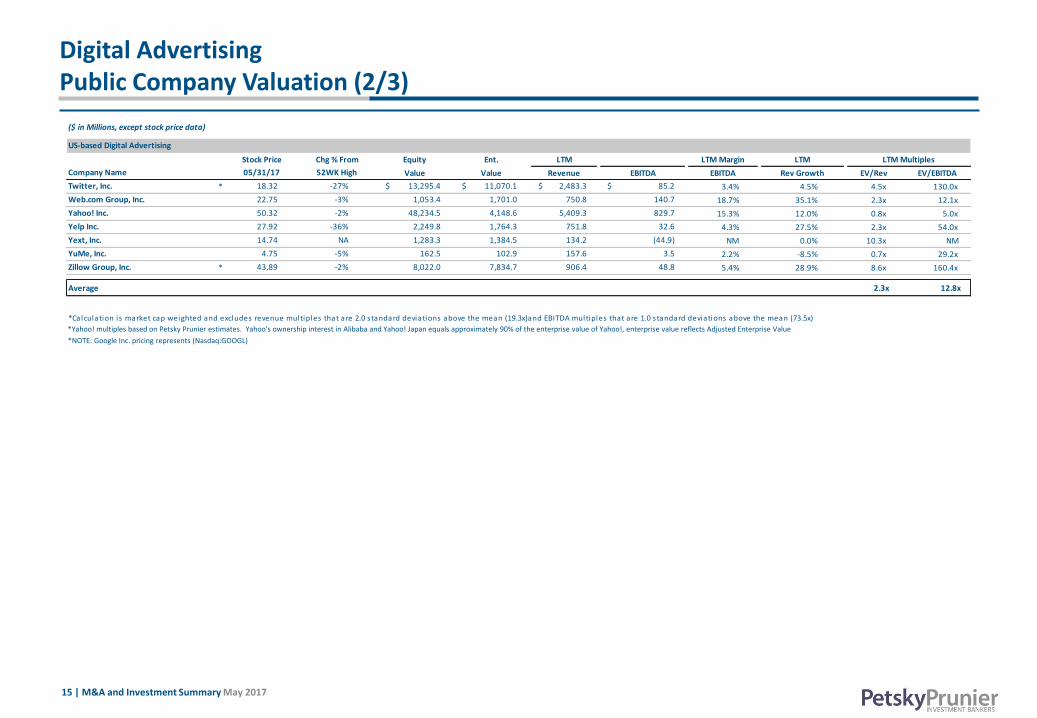
Digital Advertising Public Company Valuation (2/3)
*Yahoo! multiples based on Petsky Prunier estimates. Yahoo’s ownership interest in Alibaba and Yahoo! Japan equals approximately 90% of the enterprise value of Yahoo!, enterprise value reflects Adjusted Enterprise Value
*NOTE: Google Inc. pricing represents (Nasdaq:GOOGL)
($ in Millions, except stock price data)
US-based Digital Advertising
Stock Price Chg % From Equity Ent. LTM LTM Margin LTM LTM Multiples
Company Name 05/31/17 52WK High Value Value Revenue EBITDA EBITDA Rev Growth EV/Rev EV/EBITDA
Twitter, Inc. * 18.32 -27% $ 13,295.4 $ 11,070.1 $ 2,483.3 $ 85.2 3.4% 4.5% 4.5x 130.0x
Web.com Group, Inc. 22.75 -3% 1,053.4 1,701.0 750.8 140.7 18.7% 35.1% 2.3x 12.1x
Yahoo! Inc. 50.32 -2% 48,234.5 4,148.6 5,409.3 829.7 15.3% 12.0% 0.8x 5.0x
Yelp Inc. 27.92 -36% 2,249.8 1,764.3 751.8 32.6 4.3% 27.5% 2.3x 54.0x
Yext, Inc. 14.74 NA 1,283.3 1,384.5 134.2 (44.9) NM 0.0% 10.3x NM
YuMe, Inc. 4.75 -5% 162.5 102.9 157.6 3.5 2.2% -8.5% 0.7x 29.2x
Zillow Group, Inc. * 43.89 -2% 8,022.0 7,834.7 906.4 48.8 5.4% 28.9% 8.6x 160.4x
Average 2.3x 12.8x
*Calculation is market cap weighted and excludes revenue multiples that are 2.0 s tandard deviations above the mean (19.3x)and EBITDA multiples that are 1.0 s tandard deviations above the mean (73.5x)
16 | M&A and Investment Summary May 2017
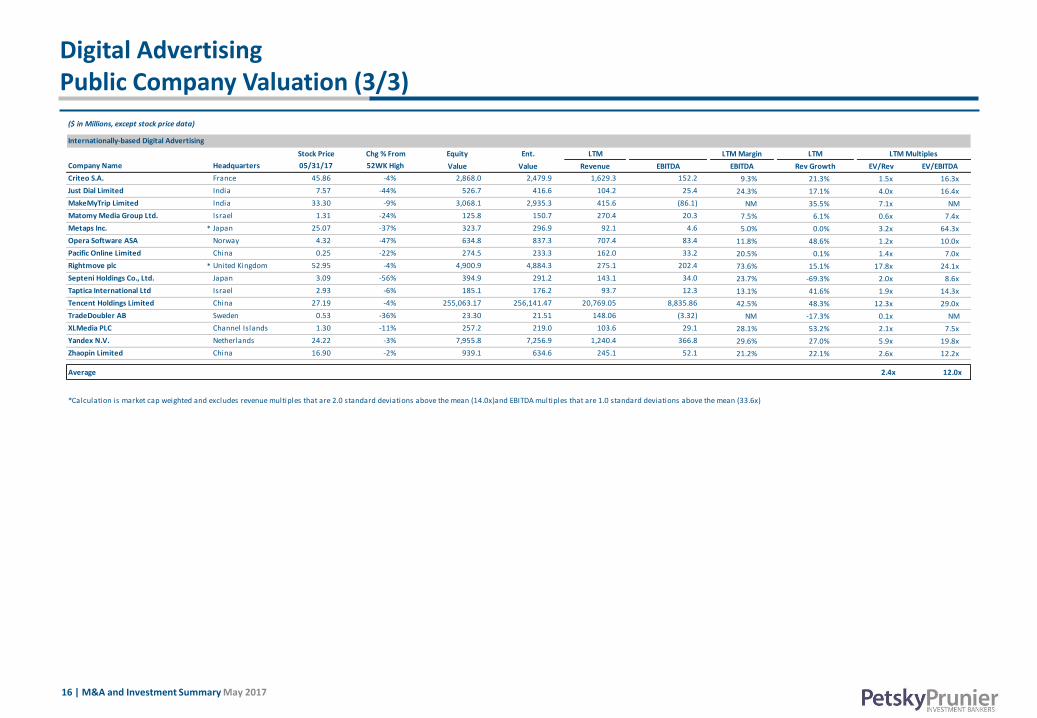
Digital Advertising Public Company Valuation (3/3)
($ in Millions, except stock price data)
Stock Price Chg % From Equity Ent. LTM LTM Margin LTM LTM Multiples
Company Name Headquarters 05/31/17 52WK High Value Value Revenue EBITDA EBITDA Rev Growth EV/Rev EV/EBITDA
Criteo S.A. France 45.86 -4% 2,868.0 2,479.9 1,629.3 152.2 9.3% 21.3% 1.5x 16.3x
Just Dial Limited India 7.57 -44% 526.7 416.6 104.2 25.4 24.3% 17.1% 4.0x 16.4x
MakeMyTrip Limited India 33.30 -9% 3,068.1 2,935.3 415.6 (86.1) NM 35.5% 7.1x NM
Matomy Media Group Ltd. Israel 1.31 -24% 125.8 150.7 270.4 20.3 7.5% 6.1% 0.6x 7.4x
Metaps Inc. * Japan 25.07 -37% 323.7 296.9 92.1 4.6 5.0% 0.0% 3.2x 64.3x
Opera Software ASA Norway 4.32 -47% 634.8 837.3 707.4 83.4 11.8% 48.6% 1.2x 10.0x
Pacific Online Limited China 0.25 -22% 274.5 233.3 162.0 33.2 20.5% 0.1% 1.4x 7.0x
Rightmove plc * United Kingdom 52.95 -4% 4,900.9 4,884.3 275.1 202.4 73.6% 15.1% 17.8x 24.1x
Septeni Holdings Co., Ltd. Japan 3.09 -56% 394.9 291.2 143.1 34.0 23.7% -69.3% 2.0x 8.6x
Taptica International Ltd Israel 2.93 -6% 185.1 176.2 93.7 12.3 13.1% 41.6% 1.9x 14.3x
Tencent Holdings Limited China 27.19 -4% 255,063.17 256,141.47 20,769.05 8,835.86 42.5% 48.3% 12.3x 29.0x
TradeDoubler AB Sweden 0.53 -36% 23.30 21.51 148.06 (3.32) NM -17.3% 0.1x NM
XLMedia PLC Channel Islands 1.30 -11% 257.2 219.0 103.6 29.1 28.1% 53.2% 2.1x 7.5x
Yandex N.V. Netherlands 24.22 -3% 7,955.8 7,256.9 1,240.4 366.8 29.6% 27.0% 5.9x 19.8x
Zhaopin Limited China 16.90 -2% 939.1 634.6 245.1 52.1 21.2% 22.1% 2.6x 12.2x
Average 2.4x 12.0x
Internationally-based Digital Advertising
*Calculation is market cap weighted and excludes revenue multiples that are 2.0 standard deviations above the mean (14.0x)and EBITDA multiples that are 1.0 standard deviations above the mean (33.6x)
17 | M&A and Investment Summary May 2017
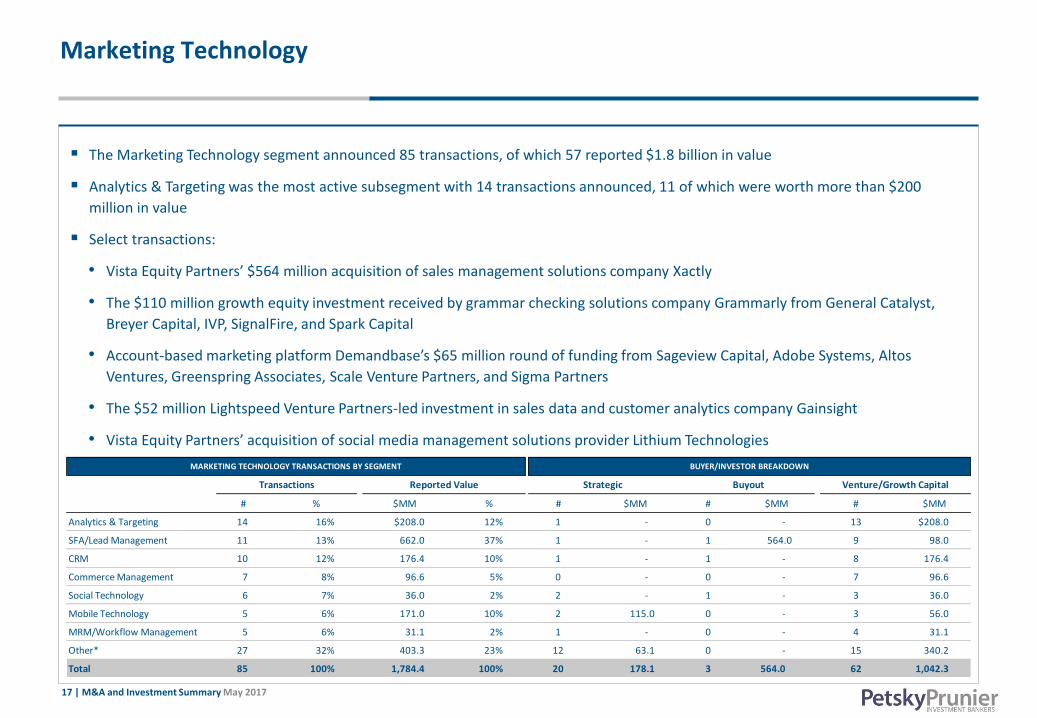
Marketing Technology
The Marketing Technology segment announced 85 transactions, of which 57 reported $1.8 billion in value
Analytics & Targeting was the most active subsegment with 14 transactions announced, 11 of which were worth more than $200
million in value
Select transactions:
• Vista Equity Partners’ $564 million acquisition of sales management solutions company Xactly
• The $110 million growth equity investment received by grammar checking solutions company Grammarly from General Catalyst,
Breyer Capital, IVP, SignalFire, and Spark Capital
• Account-based marketing platform Demandbase’s $65 million round of funding from Sageview Capital, Adobe Systems, Altos
Ventures, Greenspring Associates, Scale Venture Partners, and Sigma Partners
• The $52 million Lightspeed Venture Partners-led investment in sales data and customer analytics company Gainsight
• Vista Equity Partners’ acquisition of social media management solutions provider Lithium Technologies
# % $MM % # $MM # $MM # $MM
Analytics & Targeting 14 16% $208.0 12% 1 - 0 - 13 $208.0
SFA/Lead Management 11 13% 662.0 37% 1 - 1 564.0 9 98.0
CRM 10 12% 176.4 10% 1 - 1 - 8 176.4
Commerce Management 7 8% 96.6 5% 0 - 0 - 7 96.6
Social Technology 6 7% 36.0 2% 2 - 1 - 3 36.0
Mobile Technology 5 6% 171.0 10% 2 115.0 0 - 3 56.0
MRM/Workflow Management 5 6% 31.1 2% 1 - 0 - 4 31.1
Other* 27 32% 403.3 23% 12 63.1 0 - 15 340.2
Total 85 100% 1,784.4 100% 20 178.1 3 564.0 62 1,042.3
MARKETING TECHNOLOGY TRANSACTIONS BY SEGMENT BUYER/INVESTOR BREAKDOWN
Transactions Reported Value Strategic Buyout Venture/Growth Capital
18 | M&A and Investment Summary May 2017
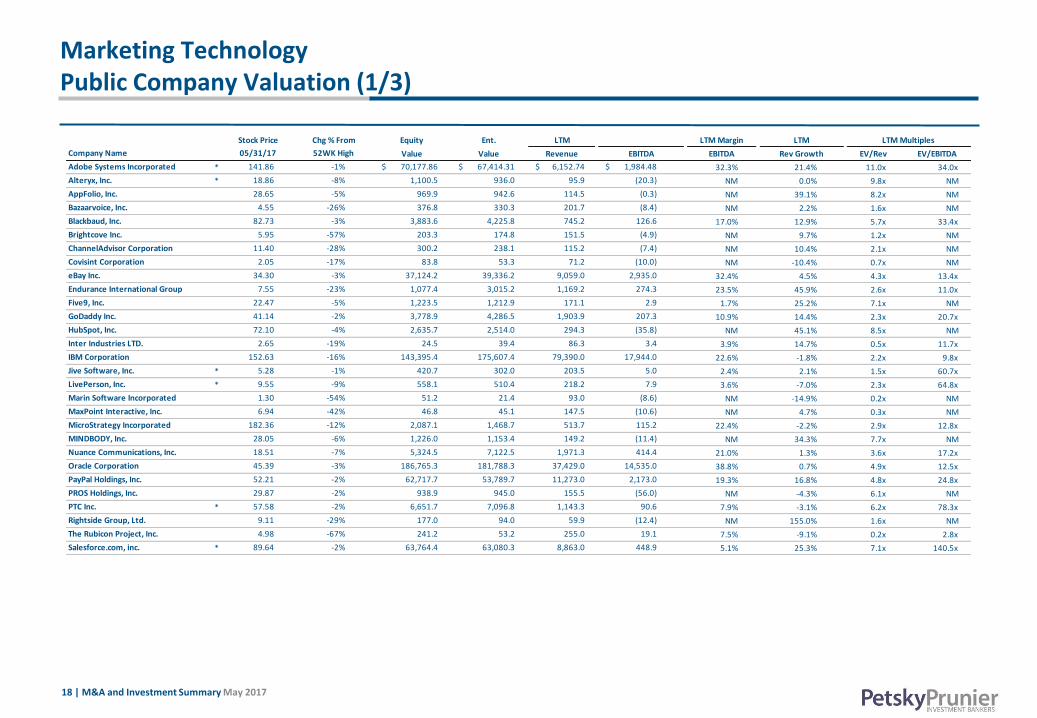
Marketing Technology Public Company Valuation (1/3)
Stock Price Chg % From Equity Ent. LTM LTM Margin LTM LTM Multiples
Company Name 05/31/17 52WK High Value Value Revenue EBITDA EBITDA Rev Growth EV/Rev EV/EBITDA
Adobe Systems Incorporated * 141.86 -1% $ 70,177.86 $ 67,414.31 $ 6,152.74 $ 1,984.48 32.3% 21.4% 11.0x 34.0x
Alteryx, Inc. * 18.86 -8% 1,100.5 936.0 95.9 (20.3) NM 0.0% 9.8x NM
AppFolio, Inc. 28.65 -5% 969.9 942.6 114.5 (0.3) NM 39.1% 8.2x NM
Bazaarvoice, Inc. 4.55 -26% 376.8 330.3 201.7 (8.4) NM 2.2% 1.6x NM
Blackbaud, Inc. 82.73 -3% 3,883.6 4,225.8 745.2 126.6 17.0% 12.9% 5.7x 33.4x
Brightcove Inc. 5.95 -57% 203.3 174.8 151.5 (4.9) NM 9.7% 1.2x NM
ChannelAdvisor Corporation 11.40 -28% 300.2 238.1 115.2 (7.4) NM 10.4% 2.1x NM
Covisint Corporation 2.05 -17% 83.8 53.3 71.2 (10.0) NM -10.4% 0.7x NM
eBay Inc. 34.30 -3% 37,124.2 39,336.2 9,059.0 2,935.0 32.4% 4.5% 4.3x 13.4x
Endurance International Group
Holdings, Inc. 7.55 -23% 1,077.4 3,015.2 1,169.2 274.3 23.5% 45.9% 2.6x 11.0x
Five9, Inc. 22.47 -5% 1,223.5 1,212.9 171.1 2.9 1.7% 25.2% 7.1x NM
GoDaddy Inc. 41.14 -2% 3,778.9 4,286.5 1,903.9 207.3 10.9% 14.4% 2.3x 20.7x
HubSpot, Inc. 72.10 -4% 2,635.7 2,514.0 294.3 (35.8) NM 45.1% 8.5x NM
Inter Industries LTD. 2.65 -19% 24.5 39.4 86.3 3.4 3.9% 14.7% 0.5x 11.7x
IBM Corporation 152.63 -16% 143,395.4 175,607.4 79,390.0 17,944.0 22.6% -1.8% 2.2x 9.8x
Jive Software, Inc. * 5.28 -1% 420.7 302.0 203.5 5.0 2.4% 2.1% 1.5x 60.7x
LivePerson, Inc. * 9.55 -9% 558.1 510.4 218.2 7.9 3.6% -7.0% 2.3x 64.8x
Marin Software Incorporated 1.30 -54% 51.2 21.4 93.0 (8.6) NM -14.9% 0.2x NM
MaxPoint Interactive, Inc. 6.94 -42% 46.8 45.1 147.5 (10.6) NM 4.7% 0.3x NM
MicroStrategy Incorporated 182.36 -12% 2,087.1 1,468.7 513.7 115.2 22.4% -2.2% 2.9x 12.8x
MINDBODY, Inc. 28.05 -6% 1,226.0 1,153.4 149.2 (11.4) NM 34.3% 7.7x NM
Nuance Communications, Inc. 18.51 -7% 5,324.5 7,122.5 1,971.3 414.4 21.0% 1.3% 3.6x 17.2x
Oracle Corporation 45.39 -3% 186,765.3 181,788.3 37,429.0 14,535.0 38.8% 0.7% 4.9x 12.5x
PayPal Holdings, Inc. 52.21 -2% 62,717.7 53,789.7 11,273.0 2,173.0 19.3% 16.8% 4.8x 24.8x
PROS Holdings, Inc. 29.87 -2% 938.9 945.0 155.5 (56.0) NM -4.3% 6.1x NM
PTC Inc. * 57.58 -2% 6,651.7 7,096.8 1,143.3 90.6 7.9% -3.1% 6.2x 78.3x
Rightside Group, Ltd. 9.11 -29% 177.0 94.0 59.9 (12.4) NM 155.0% 1.6x NM
The Rubicon Project, Inc. 4.98 -67% 241.2 53.2 255.0 19.1 7.5% -9.1% 0.2x 2.8x
Salesforce.com, inc. * 89.64 -2% 63,764.4 63,080.3 8,863.0 448.9 5.1% 25.3% 7.1x 140.5x
19 | M&A and Investment Summary May 2017
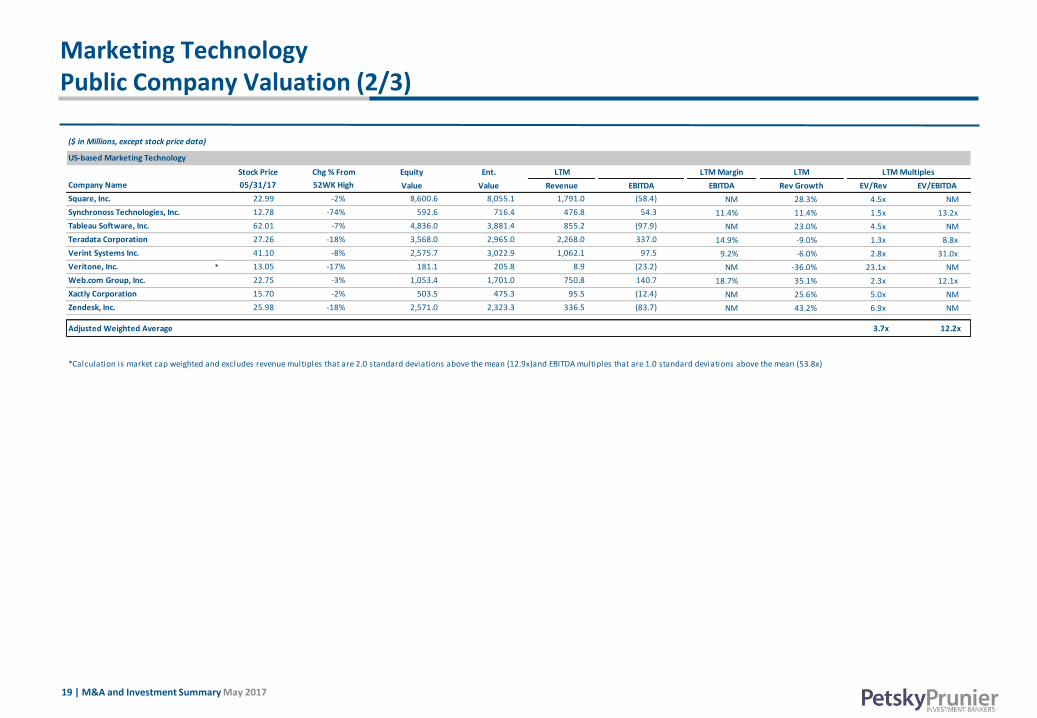
Marketing Technology Public Company Valuation (2/3)
($ in Millions, except stock price data)
Stock Price Chg % From Equity Ent. LTM LTM Margin LTM LTM Multiples
Company Name 05/31/17 52WK High Value Value Revenue EBITDA EBITDA Rev Growth EV/Rev EV/EBITDA
Square, Inc. 22.99 -2% 8,600.6 8,055.1 1,791.0 (58.4) NM 28.3% 4.5x NM
Synchronoss Technologies, Inc. 12.78 -74% 592.6 716.4 476.8 54.3 11.4% 11.4% 1.5x 13.2x
Tableau Software, Inc. 62.01 -7% 4,836.0 3,881.4 855.2 (97.9) NM 23.0% 4.5x NM
Teradata Corporation 27.26 -18% 3,568.0 2,965.0 2,268.0 337.0 14.9% -9.0% 1.3x 8.8x
Verint Systems Inc. 41.10 -8% 2,575.7 3,022.9 1,062.1 97.5 9.2% -6.0% 2.8x 31.0x
Veritone, Inc. * 13.05 -17% 181.1 205.8 8.9 (23.2) NM -36.0% 23.1x NM
Web.com Group, Inc. 22.75 -3% 1,053.4 1,701.0 750.8 140.7 18.7% 35.1% 2.3x 12.1x
Xactly Corporation 15.70 -2% 503.5 475.3 95.5 (12.4) NM 25.6% 5.0x NM
Zendesk, Inc. 25.98 -18% 2,571.0 2,323.3 336.5 (83.7) NM 43.2% 6.9x NM
Adjusted Weighted Average 3.7x 12.2x
*Calculation is market cap weighted and excludes revenue multiples that are 2.0 standard deviations above the mean (12.9x)and EBITDA multiples that are 1.0 standard deviations above the mean (53.8x)
US-based Marketing Technology
20 | M&A and Investment Summary May 2017
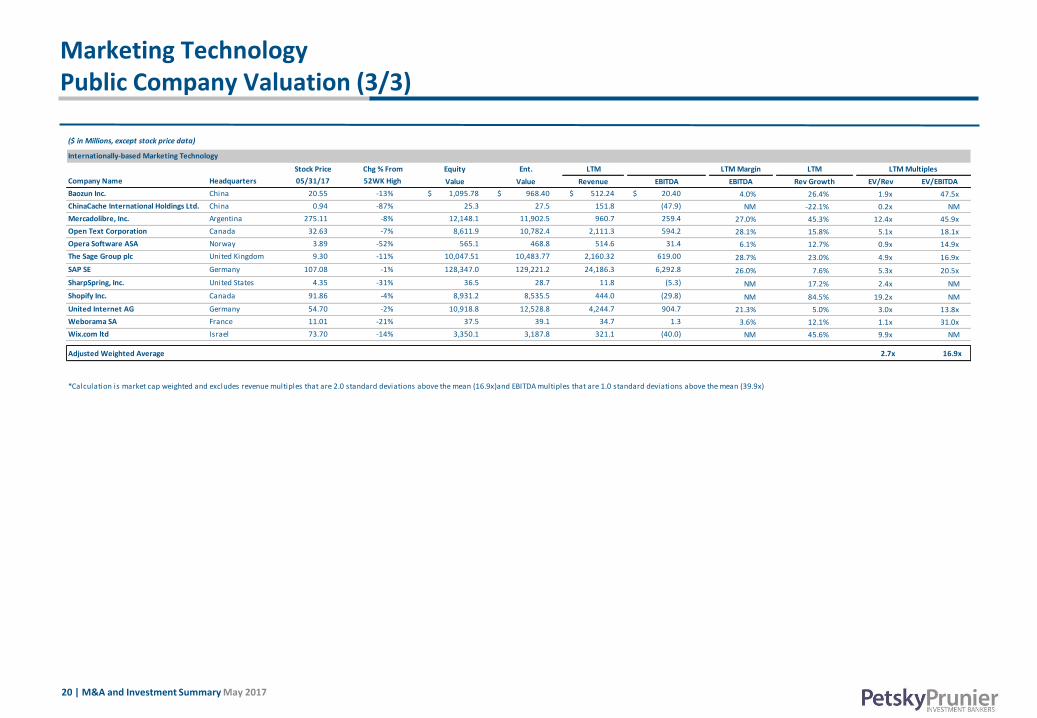
Marketing Technology Public Company Valuation (3/3)
($ in Millions, except stock price data)
Stock Price Chg % From Equity Ent. LTM LTM Margin LTM LTM Multiples
Company Name Headquarters 05/31/17 52WK High Value Value Revenue EBITDA EBITDA Rev Growth EV/Rev EV/EBITDA
Baozun Inc. China 20.55 -13% $ 1,095.78 $ 968.40 $ 512.24 $ 20.40 4.0% 26.4% 1.9x 47.5x
ChinaCache International Holdings Ltd. China 0.94 -87% 25.3 27.5 151.8 (47.9) NM -22.1% 0.2x NM
Mercadolibre, Inc. Argentina 275.11 -8% 12,148.1 11,902.5 960.7 259.4 27.0% 45.3% 12.4x 45.9x
Open Text Corporation Canada 32.63 -7% 8,611.9 10,782.4 2,111.3 594.2 28.1% 15.8% 5.1x 18.1x
Opera Software ASA Norway 3.89 -52% 565.1 468.8 514.6 31.4 6.1% 12.7% 0.9x 14.9x
The Sage Group plc United Kingdom 9.30 -11% 10,047.51 10,483.77 2,160.32 619.00 28.7% 23.0% 4.9x 16.9x
SAP SE Germany 107.08 -1% 128,347.0 129,221.2 24,186.3 6,292.8 26.0% 7.6% 5.3x 20.5x
SharpSpring, Inc. United States 4.35 -31% 36.5 28.7 11.8 (5.3) NM 17.2% 2.4x NM
Shopify Inc. Canada 91.86 -4% 8,931.2 8,535.5 444.0 (29.8) NM 84.5% 19.2x NM
United Internet AG Germany 54.70 -2% 10,918.8 12,528.8 4,244.7 904.7 21.3% 5.0% 3.0x 13.8x
Weborama SA France 11.01 -21% 37.5 39.1 34.7 1.3 3.6% 12.1% 1.1x 31.0x
Wix.com ltd Israel 73.70 -14% 3,350.1 3,187.8 321.1 (40.0) NM 45.6% 9.9x NM
Adjusted Weighted Average 2.7x 16.9x
*Calculation is market cap weighted and excludes revenue multiples that are 2.0 standard deviations above the mean (16.9x)and EBITDA multiples that are 1.0 standard deviations above the mean (39.9x)
Internationally-based Marketing Technology
21 | M&A and Investment Summary May 2017
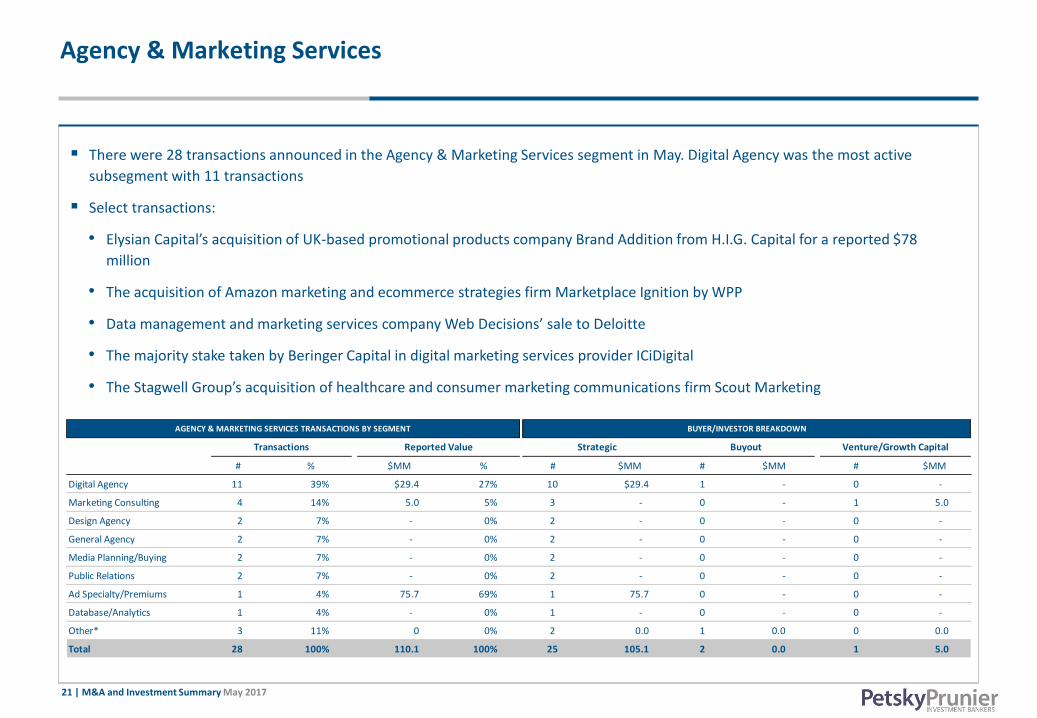
Agency & Marketing Services
There were 28 transactions announced in the Agency & Marketing Services segment in May. Digital Agency was the most active
subsegment with 11 transactions
Select transactions:
• Elysian Capital’s acquisition of UK-based promotional products company Brand Addition from H.I.G. Capital for a reported $78
million
• The acquisition of Amazon marketing and ecommerce strategies firm Marketplace Ignition by WPP
• Data management and marketing services company Web Decisions’ sale to Deloitte
• The majority stake taken by Beringer Capital in digital marketing services provider ICiDigital
• The Stagwell Group’s acquisition of healthcare and consumer marketing communications firm Scout Marketing
# % $MM % # $MM # $MM # $MM
Digital Agency 11 39% $29.4 27% 10 $29.4 1 - 0 -
Marketing Consulting 4 14% 5.0 5% 3 - 0 - 1 5.0
Design Agency 2 7% - 0% 2 - 0 - 0 -
General Agency 2 7% - 0% 2 - 0 - 0 -
Media Planning/Buying 2 7% - 0% 2 - 0 - 0 -
Public Relations 2 7% - 0% 2 - 0 - 0 -
Ad Specialty/Premiums 1 4% 75.7 69% 1 75.7 0 - 0 -
Database/Analytics 1 4% - 0% 1 - 0 - 0 -
Other* 3 11% 0 0% 2 0.0 1 0.0 0 0.0
Total 28 100% 110.1 100% 25 105.1 2 0.0 1 5.0
AGENCY & MARKETING SERVICES TRANSACTIONS BY SEGMENT BUYER/INVESTOR BREAKDOWN
Transactions Reported Value Strategic Buyout Venture/Growth Capital
22 | M&A and Investment Summary May 2017
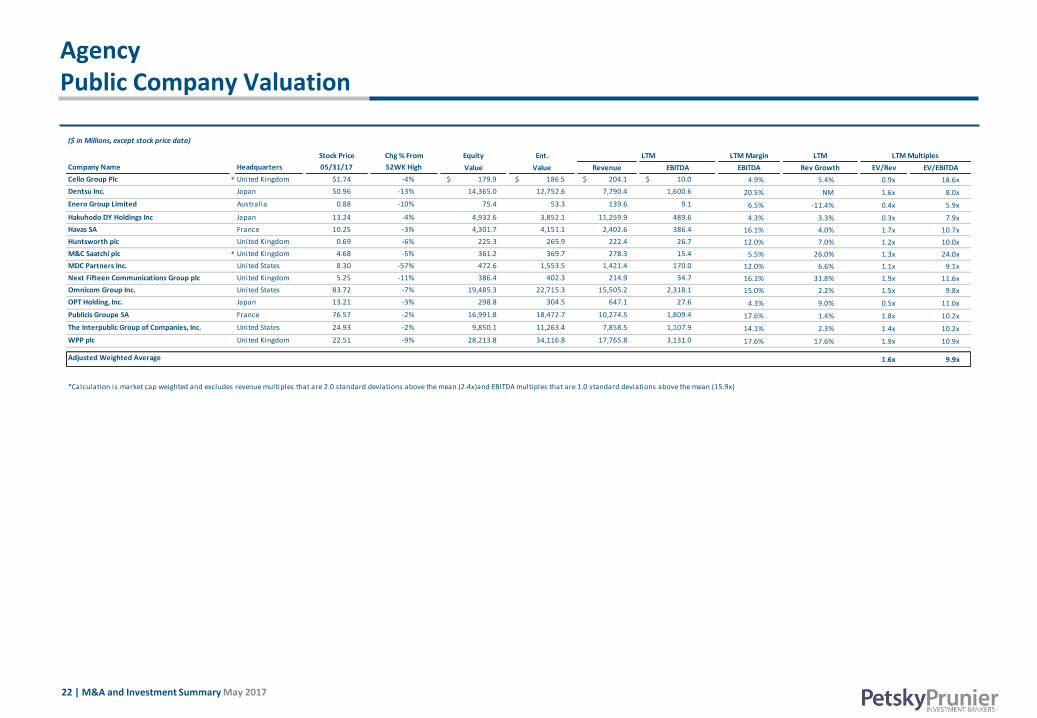
Agency Public Company Valuation
($ in Millions, except stock price data)
Stock Price Chg % From Equity Ent. LTM LTM Margin LTM LTM Multiples
Company Name Headquarters 05/31/17 52WK High Value Value Revenue EBITDA EBITDA Rev Growth EV/Rev EV/EBITDA
Cello Group Plc * United Kingdom $1.74 -4% $ 179.9 $ 186.5 $ 204.1 $ 10.0 4.9% 5.4% 0.9x 18.6x
Dentsu Inc. Japan 50.96 -13% 14,365.0 12,752.6 7,790.4 1,600.6 20.5% NM 1.6x 8.0x
Enero Group Limited Australia 0.88 -10% 75.4 53.3 139.6 9.1 6.5% -11.4% 0.4x 5.9x
Hakuhodo DY Holdings Inc Japan 13.24 -4% 4,932.6 3,852.1 11,259.9 489.6 4.3% 3.3% 0.3x 7.9x
Havas SA France 10.25 -3% 4,301.7 4,151.1 2,402.6 386.4 16.1% 4.0% 1.7x 10.7x
Huntsworth plc United Kingdom 0.69 -6% 225.3 265.9 222.4 26.7 12.0% 7.0% 1.2x 10.0x
M&C Saatchi plc * United Kingdom 4.68 -5% 361.2 369.7 278.3 15.4 5.5% 26.0% 1.3x 24.0x
MDC Partners Inc. United States 8.30 -57% 472.6 1,553.5 1,421.4 170.0 12.0% 6.6% 1.1x 9.1x
Next Fifteen Communications Group plc United Kingdom 5.25 -11% 386.4 402.3 214.9 34.7 16.1% 31.8% 1.9x 11.6x
Omnicom Group Inc. United States 83.72 -7% 19,485.3 22,715.3 15,505.2 2,318.1 15.0% 2.2% 1.5x 9.8x
OPT Holding, Inc. Japan 13.21 -3% 298.8 304.5 647.1 27.6 4.3% 9.0% 0.5x 11.0x
Publicis Groupe SA France 76.57 -2% 16,991.8 18,472.7 10,274.5 1,809.4 17.6% 1.4% 1.8x 10.2x
The Interpublic Group of Companies, Inc. United States 24.93 -2% 9,850.1 11,263.4 7,858.5 1,107.9 14.1% 2.3% 1.4x 10.2x
WPP plc United Kingdom 22.51 -9% 28,213.8 34,116.8 17,765.8 3,131.0 17.6% 17.6% 1.9x 10.9x
1.6x 9.9xAdjusted Weighted Average
*Calculation is market cap weighted and excludes revenue multiples that are 2.0 standard deviations above the mean (2.4x)and EBITDA multiples that are 1.0 standard deviations above the mean (15.9x)
23 | M&A and Investment Summary May 2017
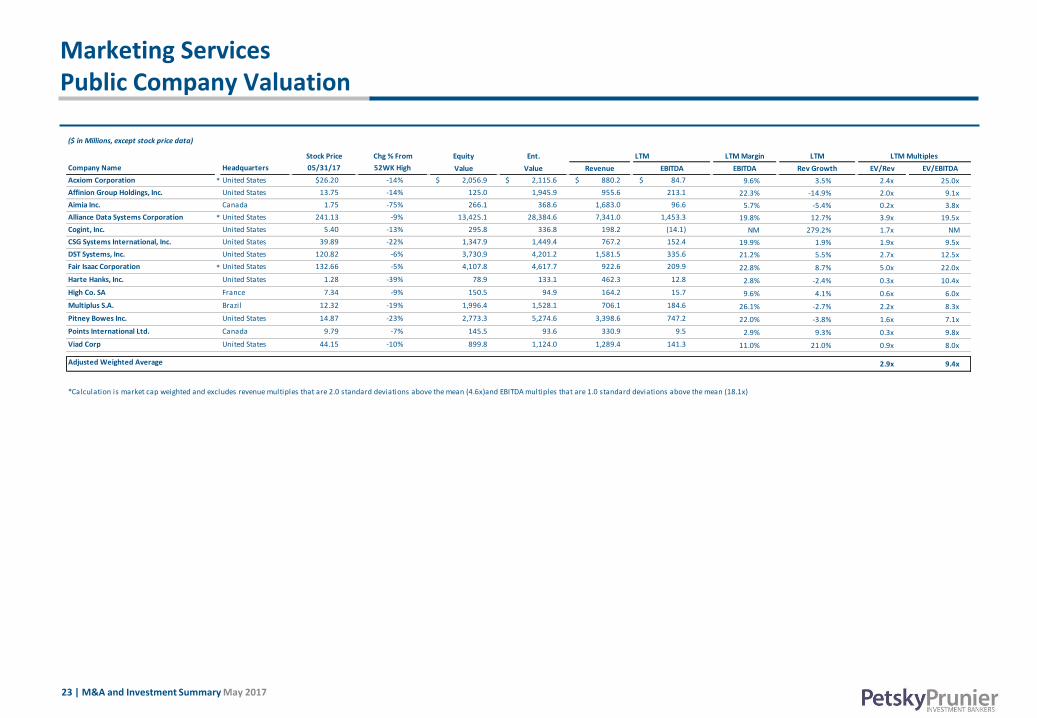
Marketing Services Public Company Valuation
($ in Millions, except stock price data)
Stock Price Chg % From Equity Ent. LTM LTM Margin LTM LTM Multiples
Company Name Headquarters 05/31/17 52WK High Value Value Revenue EBITDA EBITDA Rev Growth EV/Rev EV/EBITDA
Acxiom Corporation * United States $26.20 -14% $ 2,056.9 $ 2,115.6 $ 880.2 $ 84.7 9.6% 3.5% 2.4x 25.0x
Affinion Group Holdings, Inc. United States 13.75 -14% 125.0 1,945.9 955.6 213.1 22.3% -14.9% 2.0x 9.1x
Aimia Inc. Canada 1.75 -75% 266.1 368.6 1,683.0 96.6 5.7% -5.4% 0.2x 3.8x
Alliance Data Systems Corporation * United States 241.13 -9% 13,425.1 28,384.6 7,341.0 1,453.3 19.8% 12.7% 3.9x 19.5x
Cogint, Inc. United States 5.40 -13% 295.8 336.8 198.2 (14.1) NM 279.2% 1.7x NM
CSG Systems International, Inc. United States 39.89 -22% 1,347.9 1,449.4 767.2 152.4 19.9% 1.9% 1.9x 9.5x
DST Systems, Inc. United States 120.82 -6% 3,730.9 4,201.2 1,581.5 335.6 21.2% 5.5% 2.7x 12.5x
Fair Isaac Corporation * United States 132.66 -5% 4,107.8 4,617.7 922.6 209.9 22.8% 8.7% 5.0x 22.0x
Harte Hanks, Inc. United States 1.28 -39% 78.9 133.1 462.3 12.8 2.8% -2.4% 0.3x 10.4x
High Co. SA France 7.34 -9% 150.5 94.9 164.2 15.7 9.6% 4.1% 0.6x 6.0x
Multiplus S.A. Brazil 12.32 -19% 1,996.4 1,528.1 706.1 184.6 26.1% -2.7% 2.2x 8.3x
Pitney Bowes Inc. United States 14.87 -23% 2,773.3 5,274.6 3,398.6 747.2 22.0% -3.8% 1.6x 7.1x
Points International Ltd. Canada 9.79 -7% 145.5 93.6 330.9 9.5 2.9% 9.3% 0.3x 9.8x
Viad Corp United States 44.15 -10% 899.8 1,124.0 1,289.4 141.3 11.0% 21.0% 0.9x 8.0x
2.9x 9.4xAdjusted Weighted Average
*Calculation is market cap weighted and excludes revenue multiples that are 2.0 standard deviations above the mean (4.6x)and EBITDA multiples that are 1.0 standard deviations above the mean (18.1x)
24 | M&A and Investment Summary May 2017
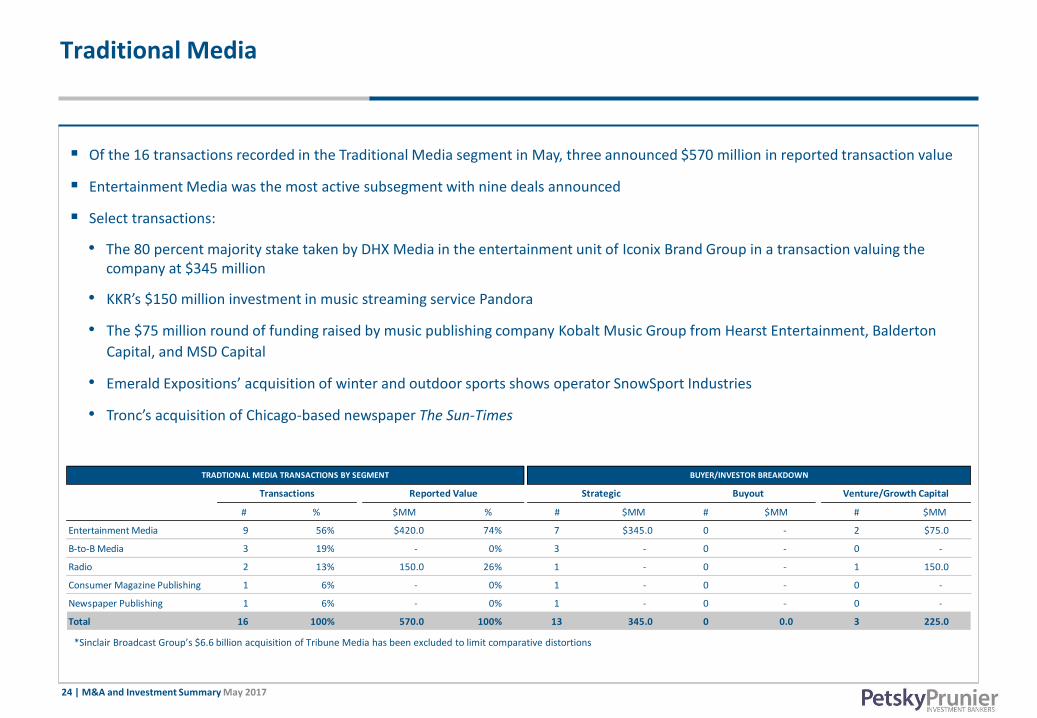
Traditional Media
Of the 16 transactions recorded in the Traditional Media segment in May, three announced $570 million in reported transaction value
Entertainment Media was the most active subsegment with nine deals announced
Select transactions:
• The 80 percent majority stake taken by DHX Media in the entertainment unit of Iconix Brand Group in a transaction valuing the company at $345 million
• KKR’s $150 million investment in music streaming service Pandora
• The $75 million round of funding raised by music publishing company Kobalt Music Group from Hearst Entertainment, Balderton
Capital, and MSD Capital
• Emerald Expositions’ acquisition of winter and outdoor sports shows operator SnowSport Industries
• Tronc’s acquisition of Chicago-based newspaper The Sun-Times
# % $MM % # $MM # $MM # $MM
Entertainment Media 9 56% $420.0 74% 7 $345.0 0 - 2 $75.0
B-to-B Media 3 19% - 0% 3 - 0 - 0 -
Radio 2 13% 150.0 26% 1 - 0 - 1 150.0
Consumer Magazine Publishing 1 6% - 0% 1 - 0 - 0 -
Newspaper Publishing 1 6% - 0% 1 - 0 - 0 -
Total 16 100% 570.0 100% 13 345.0 0 0.0 3 225.0
TRADTIONAL MEDIA TRANSACTIONS BY SEGMENT BUYER/INVESTOR BREAKDOWN
Transactions Reported Value Strategic Buyout Venture/Growth Capital
*Sinclair Broadcast Group’s $6.6 billion acquisition of Tribune Media has been excluded to limit comparative distortions
25 | M&A and Investment Summary May 2017
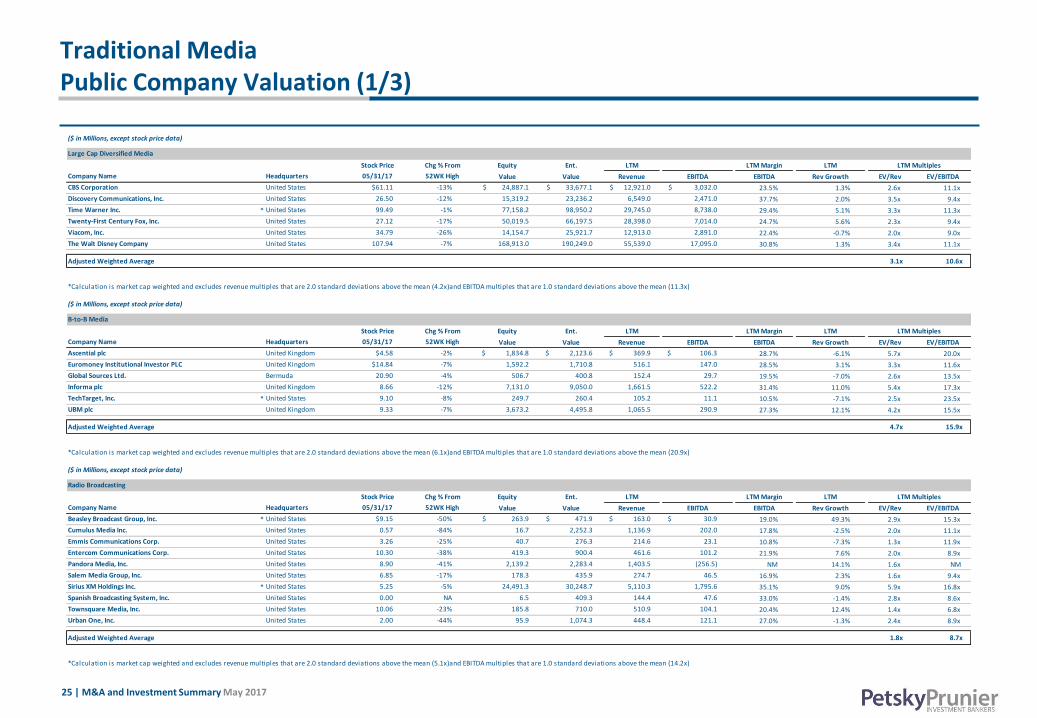
Traditional Media Public Company Valuation (1/3)
($ in Millions, except stock price data)
Stock Price Chg % From Equity Ent. LTM LTM Margin LTM LTM Multiples
Company Name Headquarters 05/31/17 52WK High Value Value Revenue EBITDA EBITDA Rev Growth EV/Rev EV/EBITDA
CBS Corporation United States $61.11 -13% $ 24,887.1 $ 33,677.1 $ 12,921.0 $ 3,032.0 23.5% 1.3% 2.6x 11.1x
Discovery Communications, Inc. United States 26.50 -12% 15,319.2 23,236.2 6,549.0 2,471.0 37.7% 2.0% 3.5x 9.4x
Time Warner Inc. * United States 99.49 -1% 77,158.2 98,950.2 29,745.0 8,738.0 29.4% 5.1% 3.3x 11.3x
Twenty-First Century Fox, Inc. United States 27.12 -17% 50,019.5 66,197.5 28,398.0 7,014.0 24.7% 5.6% 2.3x 9.4x
Viacom, Inc. United States 34.79 -26% 14,154.7 25,921.7 12,913.0 2,891.0 22.4% -0.7% 2.0x 9.0x
The Walt Disney Company United States 107.94 -7% 168,913.0 190,249.0 55,539.0 17,095.0 30.8% 1.3% 3.4x 11.1x
Adjusted Weighted Average 3.1x 10.6x
($ in Millions, except stock price data)
B-to-B Media
Stock Price Chg % From Equity Ent. LTM LTM Margin LTM LTM Multiples
Company Name Headquarters 05/31/17 52WK High Value Value Revenue EBITDA EBITDA Rev Growth EV/Rev EV/EBITDA
Ascential plc United Kingdom $4.58 -2% $ 1,834.8 $ 2,123.6 $ 369.9 $ 106.3 28.7% -6.1% 5.7x 20.0x
Euromoney Institutional Investor PLC United Kingdom $14.84 -7% 1,592.2 1,710.8 516.1 147.0 28.5% 3.1% 3.3x 11.6x
Global Sources Ltd. Bermuda 20.90 -4% 506.7 400.8 152.4 29.7 19.5% -7.0% 2.6x 13.5x
Informa plc United Kingdom 8.66 -12% 7,131.0 9,050.0 1,661.5 522.2 31.4% 11.0% 5.4x 17.3x
TechTarget, Inc. * United States 9.10 -8% 249.7 260.4 105.2 11.1 10.5% -7.1% 2.5x 23.5x
UBM plc United Kingdom 9.33 -7% 3,673.2 4,495.8 1,065.5 290.9 27.3% 12.1% 4.2x 15.5x
Adjusted Weighted Average 4.7x 15.9x
($ in Millions, except stock price data)
Radio Broadcasting
Stock Price Chg % From Equity Ent. LTM LTM Margin LTM LTM Multiples
Company Name Headquarters 05/31/17 52WK High Value Value Revenue EBITDA EBITDA Rev Growth EV/Rev EV/EBITDA
Beasley Broadcast Group, Inc. * United States $9.15 -50% $ 263.9 $ 471.9 $ 163.0 $ 30.9 19.0% 49.3% 2.9x 15.3x
Cumulus Media Inc. United States 0.57 -84% 16.7 2,252.3 1,136.9 202.0 17.8% -2.5% 2.0x 11.1x
Emmis Communications Corp. United States 3.26 -25% 40.7 276.3 214.6 23.1 10.8% -7.3% 1.3x 11.9x
Entercom Communications Corp. United States 10.30 -38% 419.3 900.4 461.6 101.2 21.9% 7.6% 2.0x 8.9x
Pandora Media, Inc. United States 8.90 -41% 2,139.2 2,283.4 1,403.5 (256.5) NM 14.1% 1.6x NM
Salem Media Group, Inc. United States 6.85 -17% 178.3 435.9 274.7 46.5 16.9% 2.3% 1.6x 9.4x
Sirius XM Holdings Inc. * United States 5.25 -5% 24,491.3 30,248.7 5,110.3 1,795.6 35.1% 9.0% 5.9x 16.8x
Spanish Broadcasting System, Inc. United States 0.00 NA 6.5 409.3 144.4 47.6 33.0% -1.4% 2.8x 8.6x
Townsquare Media, Inc. United States 10.06 -23% 185.8 710.0 510.9 104.1 20.4% 12.4% 1.4x 6.8x
Urban One, Inc. United States 2.00 -44% 95.9 1,074.3 448.4 121.1 27.0% -1.3% 2.4x 8.9x
Adjusted Weighted Average 1.8x 8.7x
*Calculation is market cap weighted and excludes revenue multiples that are 2.0 standard deviations above the mean (5.1x)and EBITDA multiples that are 1.0 standard deviations above the mean (14.2x)
Large Cap Diversified Media
*Calculation is market cap weighted and excludes revenue multiples that are 2.0 standard deviations above the mean (4.2x)and EBITDA multiples that are 1.0 standard deviations above the mean (11.3x)
*Calculation is market cap weighted and excludes revenue multiples that are 2.0 standard deviations above the mean (6.1x)and EBITDA multiples that are 1.0 standard deviations above the mean (20.9x)
26 | M&A and Investment Summary May 2017
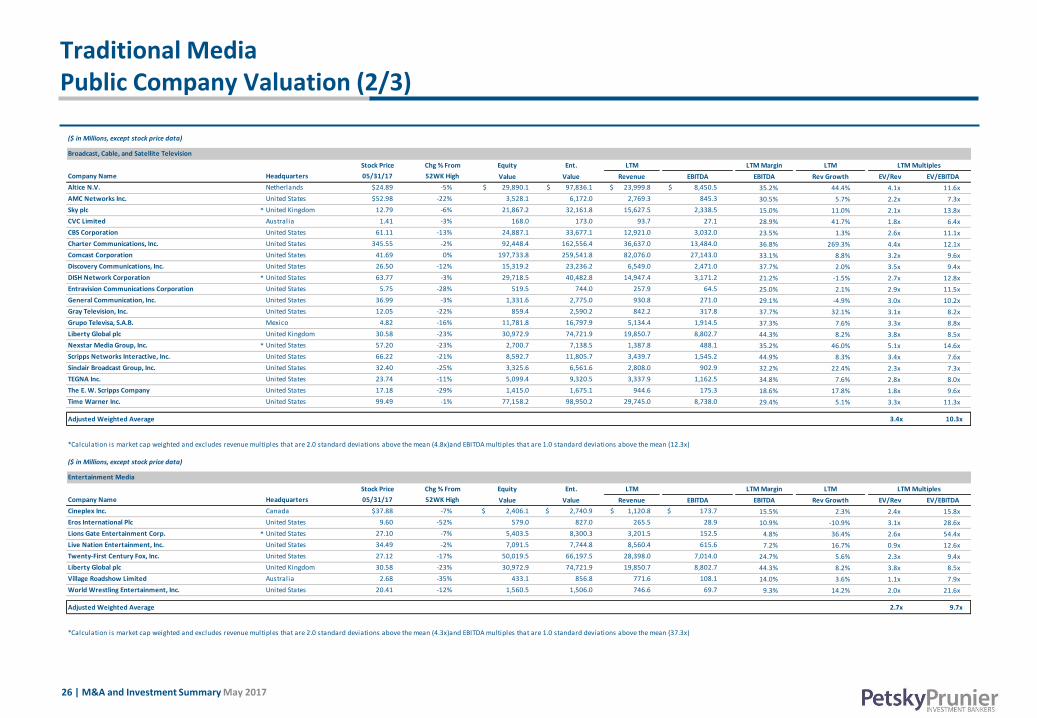
Traditional Media Public Company Valuation (2/3)
($ in Millions, except stock price data)
Broadcast, Cable, and Satellite Television
Stock Price Chg % From Equity Ent. LTM LTM Margin LTM
Company Name Headquarters 05/31/17 52WK High Value Value Revenue EBITDA EBITDA Rev Growth EV/Rev EV/EBITDA
Altice N.V. Netherlands $24.89 -5% $ 29,890.1 $ 97,836.1 $ 23,999.8 $ 8,450.5 35.2% 44.4% 4.1x 11.6x
AMC Networks Inc. United States $52.98 -22% 3,528.1 6,172.0 2,769.3 845.3 30.5% 5.7% 2.2x 7.3x
Sky plc * United Kingdom 12.79 -6% 21,867.2 32,161.8 15,627.5 2,338.5 15.0% 11.0% 2.1x 13.8x
CVC Limited Australia 1.41 -3% 168.0 173.0 93.7 27.1 28.9% 41.7% 1.8x 6.4x
CBS Corporation United States 61.11 -13% 24,887.1 33,677.1 12,921.0 3,032.0 23.5% 1.3% 2.6x 11.1x
Charter Communications, Inc. United States 345.55 -2% 92,448.4 162,556.4 36,637.0 13,484.0 36.8% 269.3% 4.4x 12.1x
Comcast Corporation United States 41.69 0% 197,733.8 259,541.8 82,076.0 27,143.0 33.1% 8.8% 3.2x 9.6x
Discovery Communications, Inc. United States 26.50 -12% 15,319.2 23,236.2 6,549.0 2,471.0 37.7% 2.0% 3.5x 9.4x
DISH Network Corporation * United States 63.77 -3% 29,718.5 40,482.8 14,947.4 3,171.2 21.2% -1.5% 2.7x 12.8x
Entravision Communications Corporation United States 5.75 -28% 519.5 744.0 257.9 64.5 25.0% 2.1% 2.9x 11.5x
General Communication, Inc. United States 36.99 -3% 1,331.6 2,775.0 930.8 271.0 29.1% -4.9% 3.0x 10.2x
Gray Television, Inc. United States 12.05 -22% 859.4 2,590.2 842.2 317.8 37.7% 32.1% 3.1x 8.2x
Grupo Televisa, S.A.B. Mexico 4.82 -16% 11,781.8 16,797.9 5,134.4 1,914.5 37.3% 7.6% 3.3x 8.8x
Liberty Global plc United Kingdom 30.58 -23% 30,972.9 74,721.9 19,850.7 8,802.7 44.3% 8.2% 3.8x 8.5x
Nexstar Media Group, Inc. * United States 57.20 -23% 2,700.7 7,138.5 1,387.8 488.1 35.2% 46.0% 5.1x 14.6x
Scripps Networks Interactive, Inc. United States 66.22 -21% 8,592.7 11,805.7 3,439.7 1,545.2 44.9% 8.3% 3.4x 7.6x
Sinclair Broadcast Group, Inc. United States 32.40 -25% 3,325.6 6,561.6 2,808.0 902.9 32.2% 22.4% 2.3x 7.3x
TEGNA Inc. United States 23.74 -11% 5,099.4 9,320.5 3,337.9 1,162.5 34.8% 7.6% 2.8x 8.0x
The E. W. Scripps Company United States 17.18 -29% 1,415.0 1,675.1 944.6 175.3 18.6% 17.8% 1.8x 9.6x
Time Warner Inc. United States 99.49 -1% 77,158.2 98,950.2 29,745.0 8,738.0 29.4% 5.1% 3.3x 11.3x
Adjusted Weighted Average 3.4x 10.3x
($ in Millions, except stock price data)
Entertainment Media
Stock Price Chg % From Equity Ent. LTM LTM Margin LTM
Company Name Headquarters 05/31/17 52WK High Value Value Revenue EBITDA EBITDA Rev Growth EV/Rev EV/EBITDA
Cineplex Inc. Canada $37.88 -7% $ 2,406.1 $ 2,740.9 $ 1,120.8 $ 173.7 15.5% 2.3% 2.4x 15.8x
Eros International Plc United States 9.60 -52% 579.0 827.0 265.5 28.9 10.9% -10.9% 3.1x 28.6x
Lions Gate Entertainment Corp. * United States 27.10 -7% 5,403.5 8,300.3 3,201.5 152.5 4.8% 36.4% 2.6x 54.4x
Live Nation Entertainment, Inc. United States 34.49 -2% 7,091.5 7,744.8 8,560.4 615.6 7.2% 16.7% 0.9x 12.6x
Twenty-First Century Fox, Inc. United States 27.12 -17% 50,019.5 66,197.5 28,398.0 7,014.0 24.7% 5.6% 2.3x 9.4x
Liberty Global plc United Kingdom 30.58 -23% 30,972.9 74,721.9 19,850.7 8,802.7 44.3% 8.2% 3.8x 8.5x
Village Roadshow Limited Australia 2.68 -35% 433.1 856.8 771.6 108.1 14.0% 3.6% 1.1x 7.9x
World Wrestling Entertainment, Inc. United States 20.41 -12% 1,560.5 1,506.0 746.6 69.7 9.3% 14.2% 2.0x 21.6x
Adjusted Weighted Average 2.7x 9.7x
LTM Multiples
LTM Multiples
*Calculation is market cap weighted and excludes revenue multiples that are 2.0 standard deviations above the mean (4.3x)and EBITDA multiples that are 1.0 standard deviations above the mean (37.3x)
*Calculation is market cap weighted and excludes revenue multiples that are 2.0 standard deviations above the mean (4.8x)and EBITDA multiples that are 1.0 standard deviations above the mean (12.3x)
27 | M&A and Investment Summary May 2017
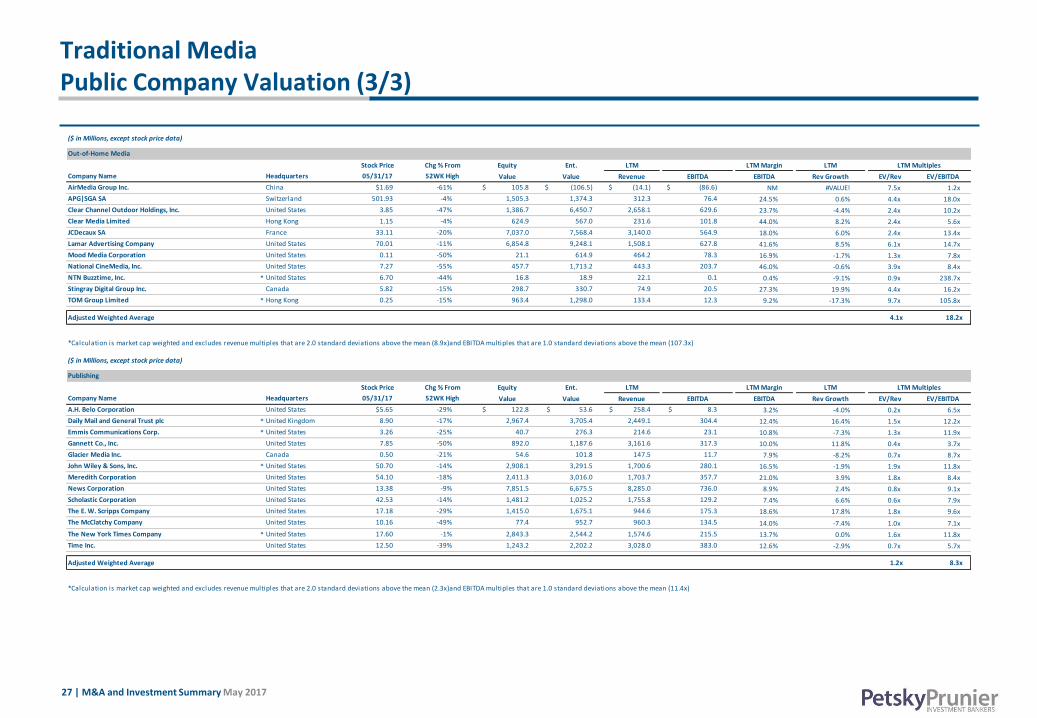
Traditional Media Public Company Valuation (3/3)
($ in Millions, except stock price data)
Out-of-Home Media
Stock Price Chg % From Equity Ent. LTM LTM Margin LTM LTM Multiples
Company Name Headquarters 05/31/17 52WK High Value Value Revenue EBITDA EBITDA Rev Growth EV/Rev EV/EBITDA
AirMedia Group Inc. China $1.69 -61% $ 105.8 $ (106.5) $ (14.1) $ (86.6) NM #VALUE! 7.5x 1.2x
APG|SGA SA Switzerland 501.93 -4% 1,505.3 1,374.3 312.3 76.4 24.5% 0.6% 4.4x 18.0x
Clear Channel Outdoor Holdings, Inc. United States 3.85 -47% 1,386.7 6,450.7 2,658.1 629.6 23.7% -4.4% 2.4x 10.2x
Clear Media Limited Hong Kong 1.15 -4% 624.9 567.0 231.6 101.8 44.0% 8.2% 2.4x 5.6x
JCDecaux SA France 33.11 -20% 7,037.0 7,568.4 3,140.0 564.9 18.0% 6.0% 2.4x 13.4x
Lamar Advertising Company United States 70.01 -11% 6,854.8 9,248.1 1,508.1 627.8 41.6% 8.5% 6.1x 14.7x
Mood Media Corporation United States 0.11 -50% 21.1 614.9 464.2 78.3 16.9% -1.7% 1.3x 7.8x
National CineMedia, Inc. United States 7.27 -55% 457.7 1,713.2 443.3 203.7 46.0% -0.6% 3.9x 8.4x
NTN Buzztime, Inc. * United States 6.70 -44% 16.8 18.9 22.1 0.1 0.4% -9.1% 0.9x 238.7x
Stingray Digital Group Inc. Canada 5.82 -15% 298.7 330.7 74.9 20.5 27.3% 19.9% 4.4x 16.2x
TOM Group Limited * Hong Kong 0.25 -15% 963.4 1,298.0 133.4 12.3 9.2% -17.3% 9.7x 105.8x
Adjusted Weighted Average 4.1x 18.2x
($ in Millions, except stock price data)
Publishing
Stock Price Chg % From Equity Ent. LTM LTM Margin LTM LTM Multiples
Company Name Headquarters 05/31/17 52WK High Value Value Revenue EBITDA EBITDA Rev Growth EV/Rev EV/EBITDA
A.H. Belo Corporation United States $5.65 -29% $ 122.8 $ 53.6 $ 258.4 $ 8.3 3.2% -4.0% 0.2x 6.5x
Daily Mail and General Trust plc * United Kingdom 8.90 -17% 2,967.4 3,705.4 2,449.1 304.4 12.4% 16.4% 1.5x 12.2x
Emmis Communications Corp. * United States 3.26 -25% 40.7 276.3 214.6 23.1 10.8% -7.3% 1.3x 11.9x
Gannett Co., Inc. United States 7.85 -50% 892.0 1,187.6 3,161.6 317.3 10.0% 11.8% 0.4x 3.7x
Glacier Media Inc. Canada 0.50 -21% 54.6 101.8 147.5 11.7 7.9% -8.2% 0.7x 8.7x
John Wiley & Sons, Inc. * United States 50.70 -14% 2,908.1 3,291.5 1,700.6 280.1 16.5% -1.9% 1.9x 11.8x
Meredith Corporation United States 54.10 -18% 2,411.3 3,016.0 1,703.7 357.7 21.0% 3.9% 1.8x 8.4x
News Corporation United States 13.38 -9% 7,851.5 6,675.5 8,285.0 736.0 8.9% 2.4% 0.8x 9.1x
Scholastic Corporation United States 42.53 -14% 1,481.2 1,025.2 1,755.8 129.2 7.4% 6.6% 0.6x 7.9x
The E. W. Scripps Company United States 17.18 -29% 1,415.0 1,675.1 944.6 175.3 18.6% 17.8% 1.8x 9.6x
The McClatchy Company United States 10.16 -49% 77.4 952.7 960.3 134.5 14.0% -7.4% 1.0x 7.1x
The New York Times Company * United States 17.60 -1% 2,843.3 2,544.2 1,574.6 215.5 13.7% 0.0% 1.6x 11.8x
Time Inc. United States 12.50 -39% 1,243.2 2,202.2 3,028.0 383.0 12.6% -2.9% 0.7x 5.7x
Adjusted Weighted Average 1.2x 8.3x
*Calculation is market cap weighted and excludes revenue multiples that are 2.0 standard deviations above the mean (2.3x)and EBITDA multiples that are 1.0 standard deviations above the mean (11.4x)
*Calculation is market cap weighted and excludes revenue multiples that are 2.0 standard deviations above the mean (8.9x)and EBITDA multiples that are 1.0 standard deviations above the mean (107.3x)
28 | M&A and Investment Summary May 2017
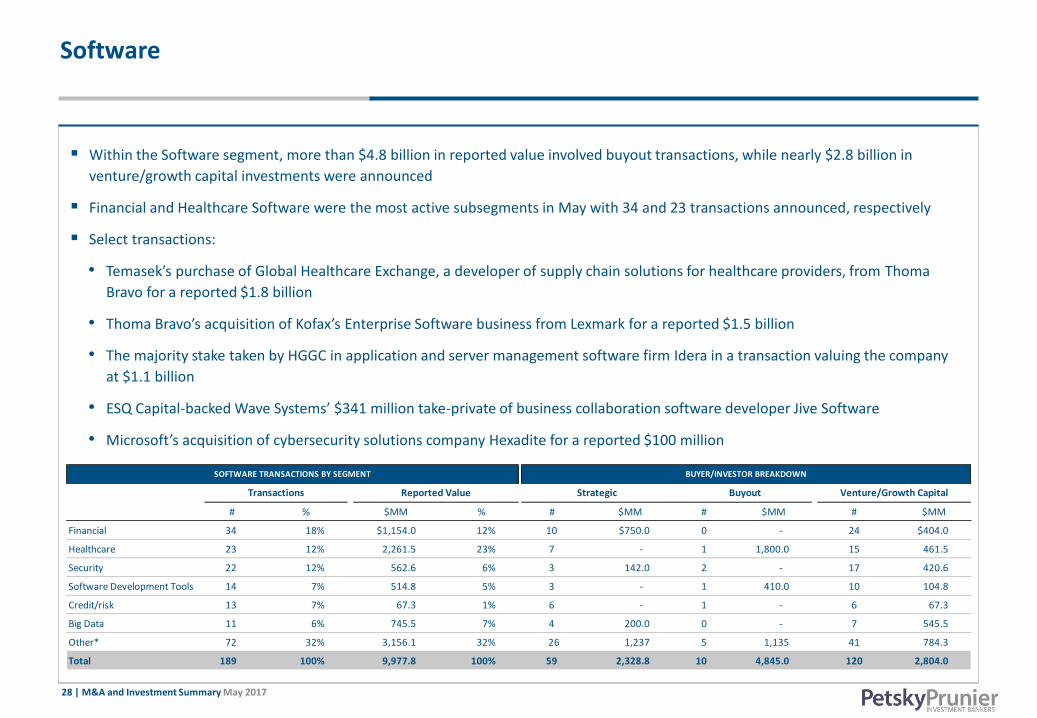
Software
Within the Software segment, more than $4.8 billion in reported value involved buyout transactions, while nearly $2.8 billion in
venture/growth capital investments were announced
Financial and Healthcare Software were the most active subsegments in May with 34 and 23 transactions announced, respectively
Select transactions:
• Temasek’s purchase of Global Healthcare Exchange, a developer of supply chain solutions for healthcare providers, from Thoma
Bravo for a reported $1.8 billion
• Thoma Bravo’s acquisition of Kofax’s Enterprise Software business from Lexmark for a reported $1.5 billion
• The majority stake taken by HGGC in application and server management software firm Idera in a transaction valuing the company
at $1.1 billion
• ESQ Capital-backed Wave Systems’ $341 million take-private of business collaboration software developer Jive Software
• Microsoft’s acquisition of cybersecurity solutions company Hexadite for a reported $100 million
*Micro Focus’ $8.8 billion acquisition of Hewlett Packard Enterprise’s Software business has been excluded to limit comparative distortions
# % $MM % # $MM # $MM # $MM
Financial 34 18% $1,154.0 12% 10 $750.0 0 - 24 $404.0
Healthcare 23 12% 2,261.5 23% 7 - 1 1,800.0 15 461.5
Security 22 12% 562.6 6% 3 142.0 2 - 17 420.6
Software Development Tools 14 7% 514.8 5% 3 - 1 410.0 10 104.8
Credit/risk 13 7% 67.3 1% 6 - 1 - 6 67.3
Big Data 11 6% 745.5 7% 4 200.0 0 - 7 545.5
Other* 72 32% 3,156.1 32% 26 1,237 5 1,135 41 784.3
Total 189 100% 9,977.8 100% 59 2,328.8 10 4,845.0 120 2,804.0
SOFTWARE TRANSACTIONS BY SEGMENT BUYER/INVESTOR BREAKDOWN
Transactions Reported Value Strategic Buyout Venture/Growth Capital
29 | M&A and Investment Summary May 2017
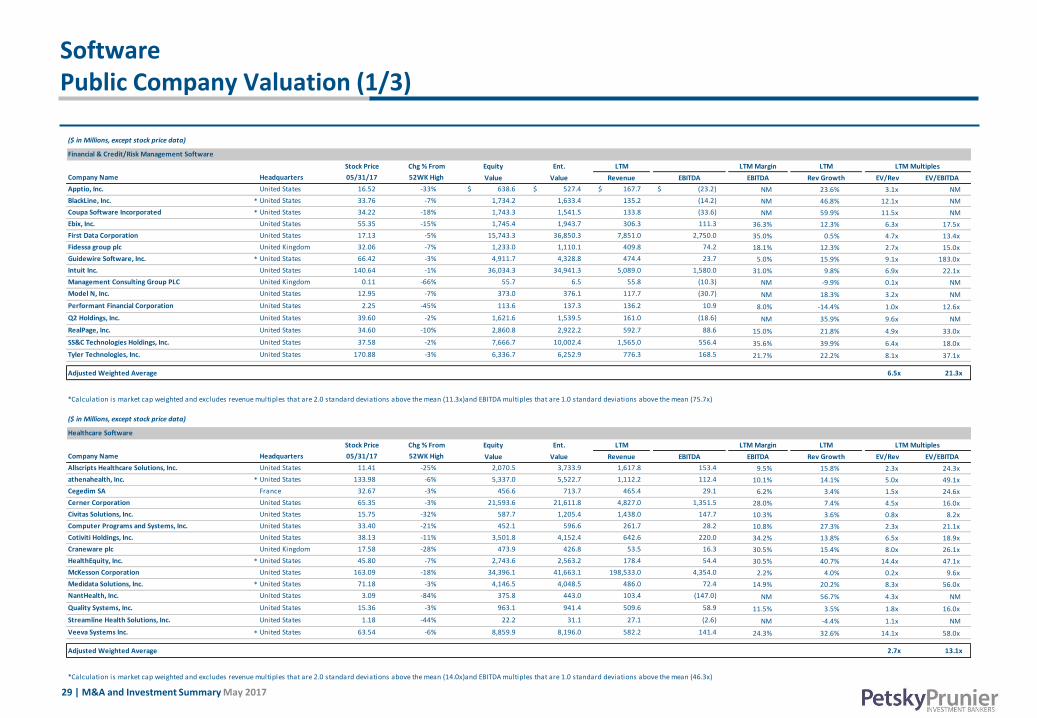
Software Public Company Valuation (1/3)
($ in Millions, except stock price data)
Stock Price Chg % From Equity Ent. LTM LTM Margin LTM LTM Multiples
Company Name Headquarters 05/31/17 52WK High Value Value Revenue EBITDA EBITDA Rev Growth EV/Rev EV/EBITDA
Apptio, Inc. United States 16.52 -33% $ 638.6 $ 527.4 $ 167.7 $ (23.2) NM 23.6% 3.1x NM
BlackLine, Inc. * United States 33.76 -7% 1,734.2 1,633.4 135.2 (14.2) NM 46.8% 12.1x NM
Coupa Software Incorporated * United States 34.22 -18% 1,743.3 1,541.5 133.8 (33.6) NM 59.9% 11.5x NM
Ebix, Inc. United States 55.35 -15% 1,745.4 1,943.7 306.3 111.3 36.3% 12.3% 6.3x 17.5x
First Data Corporation United States 17.13 -5% 15,743.3 36,850.3 7,851.0 2,750.0 35.0% 0.5% 4.7x 13.4x
Fidessa group plc United Kingdom 32.06 -7% 1,233.0 1,110.1 409.8 74.2 18.1% 12.3% 2.7x 15.0x
Guidewire Software, Inc. * United States 66.42 -3% 4,911.7 4,328.8 474.4 23.7 5.0% 15.9% 9.1x 183.0x
Intuit Inc. United States 140.64 -1% 36,034.3 34,941.3 5,089.0 1,580.0 31.0% 9.8% 6.9x 22.1x
Management Consulting Group PLC United Kingdom 0.11 -66% 55.7 6.5 55.8 (10.3) NM -9.9% 0.1x NM
Model N, Inc. United States 12.95 -7% 373.0 376.1 117.7 (30.7) NM 18.3% 3.2x NM
Performant Financial Corporation United States 2.25 -45% 113.6 137.3 136.2 10.9 8.0% -14.4% 1.0x 12.6x
Q2 Holdings, Inc. United States 39.60 -2% 1,621.6 1,539.5 161.0 (18.6) NM 35.9% 9.6x NM
RealPage, Inc. United States 34.60 -10% 2,860.8 2,922.2 592.7 88.6 15.0% 21.8% 4.9x 33.0x
SS&C Technologies Holdings, Inc. United States 37.58 -2% 7,666.7 10,002.4 1,565.0 556.4 35.6% 39.9% 6.4x 18.0x
Tyler Technologies, Inc. United States 170.88 -3% 6,336.7 6,252.9 776.3 168.5 21.7% 22.2% 8.1x 37.1x
Adjusted Weighted Average 6.5x 21.3x
($ in Millions, except stock price data)
Healthcare Software
Stock Price Chg % From Equity Ent. LTM LTM Margin LTM LTM Multiples
Company Name Headquarters 05/31/17 52WK High Value Value Revenue EBITDA EBITDA Rev Growth EV/Rev EV/EBITDA
Allscripts Healthcare Solutions, Inc. United States 11.41 -25% 2,070.5 3,733.9 1,617.8 153.4 9.5% 15.8% 2.3x 24.3x
athenahealth, Inc. * United States 133.98 -6% 5,337.0 5,522.7 1,112.2 112.4 10.1% 14.1% 5.0x 49.1x
Cegedim SA France 32.67 -3% 456.6 713.7 465.4 29.1 6.2% 3.4% 1.5x 24.6x
Cerner Corporation United States 65.35 -3% 21,593.6 21,611.8 4,827.0 1,351.5 28.0% 7.4% 4.5x 16.0x
Civitas Solutions, Inc. United States 15.75 -32% 587.7 1,205.4 1,438.0 147.7 10.3% 3.6% 0.8x 8.2x
Computer Programs and Systems, Inc. United States 33.40 -21% 452.1 596.6 261.7 28.2 10.8% 27.3% 2.3x 21.1x
Cotiviti Holdings, Inc. United States 38.13 -11% 3,501.8 4,152.4 642.6 220.0 34.2% 13.8% 6.5x 18.9x
Craneware plc United Kingdom 17.58 -28% 473.9 426.8 53.5 16.3 30.5% 15.4% 8.0x 26.1x
HealthEquity, Inc. * United States 45.80 -7% 2,743.6 2,563.2 178.4 54.4 30.5% 40.7% 14.4x 47.1x
McKesson Corporation United States 163.09 -18% 34,396.1 41,663.1 198,533.0 4,354.0 2.2% 4.0% 0.2x 9.6x
Medidata Solutions, Inc. * United States 71.18 -3% 4,146.5 4,048.5 486.0 72.4 14.9% 20.2% 8.3x 56.0x
NantHealth, Inc. United States 3.09 -84% 375.8 443.0 103.4 (147.0) NM 56.7% 4.3x NM
Quality Systems, Inc. United States 15.36 -3% 963.1 941.4 509.6 58.9 11.5% 3.5% 1.8x 16.0x
Streamline Health Solutions, Inc. United States 1.18 -44% 22.2 31.1 27.1 (2.6) NM -4.4% 1.1x NM
Veeva Systems Inc. * United States 63.54 -6% 8,859.9 8,196.0 582.2 141.4 24.3% 32.6% 14.1x 58.0x
Adjusted Weighted Average 2.7x 13.1x
*Calculation is market cap weighted and excludes revenue multiples that are 2.0 standard deviations above the mean (11.3x)and EBITDA multiples that are 1.0 standard deviations above the mean (75.7x)
Financial & Credit/Risk Management Software
*Calculation is market cap weighted and excludes revenue multiples that are 2.0 standard deviations above the mean (14.0x)and EBITDA multiples that are 1.0 standard deviations above the mean (46.3x)
30 | M&A and Investment Summary May 2017
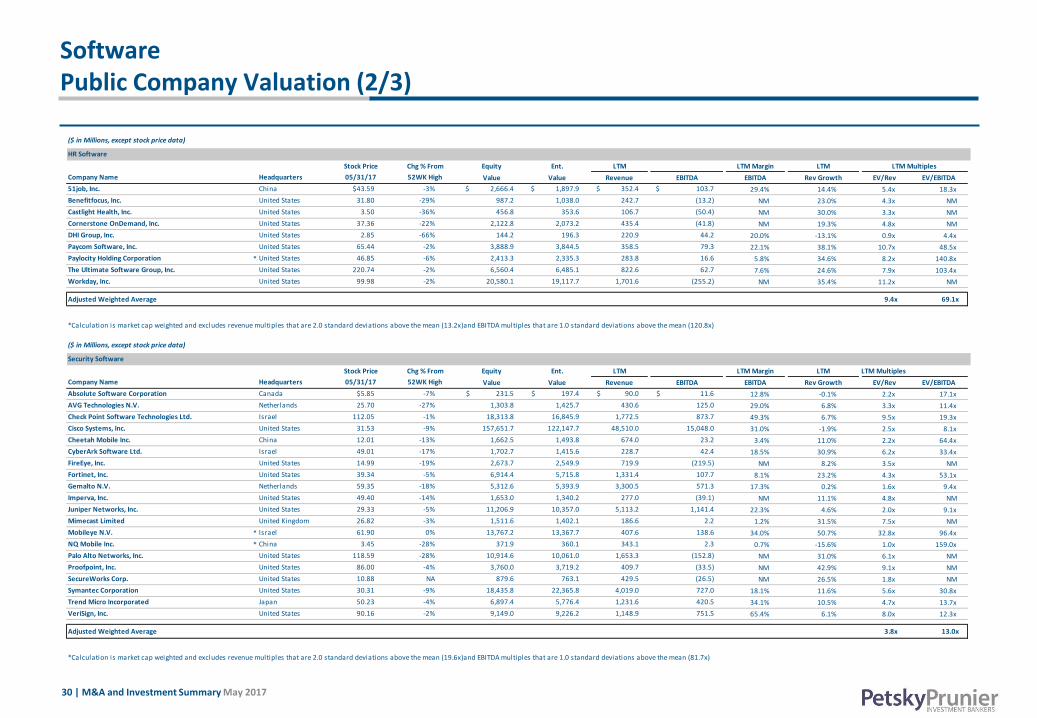
Software Public Company Valuation (2/3)
($ in Millions, except stock price data)
HR Software
Stock Price Chg % From Equity Ent. LTM LTM Margin LTM
Company Name Headquarters 05/31/17 52WK High Value Value Revenue EBITDA EBITDA Rev Growth EV/Rev EV/EBITDA
51job, Inc. China $43.59 -3% $ 2,666.4 $ 1,897.9 $ 352.4 $ 103.7 29.4% 14.4% 5.4x 18.3x
Benefitfocus, Inc. United States 31.80 -29% 987.2 1,038.0 242.7 (13.2) NM 23.0% 4.3x NM
Castlight Health, Inc. United States 3.50 -36% 456.8 353.6 106.7 (50.4) NM 30.0% 3.3x NM
Cornerstone OnDemand, Inc. United States 37.36 -22% 2,122.8 2,073.2 435.4 (41.8) NM 19.3% 4.8x NM
DHI Group, Inc. United States 2.85 -66% 144.2 196.3 220.9 44.2 20.0% -13.1% 0.9x 4.4x
Paycom Software, Inc. United States 65.44 -2% 3,888.9 3,844.5 358.5 79.3 22.1% 38.1% 10.7x 48.5x
Paylocity Holding Corporation * United States 46.85 -6% 2,413.3 2,335.3 283.8 16.6 5.8% 34.6% 8.2x 140.8x
The Ultimate Software Group, Inc. United States 220.74 -2% 6,560.4 6,485.1 822.6 62.7 7.6% 24.6% 7.9x 103.4x
Workday, Inc. United States 99.98 -2% 20,580.1 19,117.7 1,701.6 (255.2) NM 35.4% 11.2x NM
Adjusted Weighted Average 9.4x 69.1x
($ in Millions, except stock price data)
Security Software
Stock Price Chg % From Equity Ent. LTM LTM Margin LTM LTM Multiples
Company Name Headquarters 05/31/17 52WK High Value Value Revenue EBITDA EBITDA Rev Growth EV/Rev EV/EBITDA
Absolute Software Corporation Canada $5.85 -7% $ 231.5 $ 197.4 $ 90.0 $ 11.6 12.8% -0.1% 2.2x 17.1x
AVG Technologies N.V. Netherlands 25.70 -27% 1,303.8 1,425.7 430.6 125.0 29.0% 6.8% 3.3x 11.4x
Check Point Software Technologies Ltd. Israel 112.05 -1% 18,313.8 16,845.9 1,772.5 873.7 49.3% 6.7% 9.5x 19.3x
Cisco Systems, Inc. United States 31.53 -9% 157,651.7 122,147.7 48,510.0 15,048.0 31.0% -1.9% 2.5x 8.1x
Cheetah Mobile Inc. China 12.01 -13% 1,662.5 1,493.8 674.0 23.2 3.4% 11.0% 2.2x 64.4x
CyberArk Software Ltd. Israel 49.01 -17% 1,702.7 1,415.6 228.7 42.4 18.5% 30.9% 6.2x 33.4x
FireEye, Inc. United States 14.99 -19% 2,673.7 2,549.9 719.9 (219.5) NM 8.2% 3.5x NM
Fortinet, Inc. United States 39.34 -5% 6,914.4 5,715.8 1,331.4 107.7 8.1% 23.2% 4.3x 53.1x
Gemalto N.V. Netherlands 59.35 -18% 5,312.6 5,393.9 3,300.5 571.3 17.3% 0.2% 1.6x 9.4x
Imperva, Inc. United States 49.40 -14% 1,653.0 1,340.2 277.0 (39.1) NM 11.1% 4.8x NM
Juniper Networks, Inc. United States 29.33 -5% 11,206.9 10,357.0 5,113.2 1,141.4 22.3% 4.6% 2.0x 9.1x
Mimecast Limited United Kingdom 26.82 -3% 1,511.6 1,402.1 186.6 2.2 1.2% 31.5% 7.5x NM
Mobileye N.V. * Israel 61.90 0% 13,767.2 13,367.7 407.6 138.6 34.0% 50.7% 32.8x 96.4x
NQ Mobile Inc. * China 3.45 -28% 371.9 360.1 343.1 2.3 0.7% -15.6% 1.0x 159.0x
Palo Alto Networks, Inc. United States 118.59 -28% 10,914.6 10,061.0 1,653.3 (152.8) NM 31.0% 6.1x NM
Proofpoint, Inc. United States 86.00 -4% 3,760.0 3,719.2 409.7 (33.5) NM 42.9% 9.1x NM
SecureWorks Corp. United States 10.88 NA 879.6 763.1 429.5 (26.5) NM 26.5% 1.8x NM
Symantec Corporation United States 30.31 -9% 18,435.8 22,365.8 4,019.0 727.0 18.1% 11.6% 5.6x 30.8x
Trend Micro Incorporated Japan 50.23 -4% 6,897.4 5,776.4 1,231.6 420.5 34.1% 10.5% 4.7x 13.7x
VeriSign, Inc. United States 90.16 -2% 9,149.0 9,226.2 1,148.9 751.5 65.4% 6.1% 8.0x 12.3x
Adjusted Weighted Average 3.8x 13.0x
LTM Multiples
*Calculation is market cap weighted and excludes revenue multiples that are 2.0 standard deviations above the mean (13.2x)and EBITDA multiples that are 1.0 standard deviations above the mean (120.8x)
*Calculation is market cap weighted and excludes revenue multiples that are 2.0 standard deviations above the mean (19.6x)and EBITDA multiples that are 1.0 standard deviations above the mean (81.7x)
31 | M&A and Investment Summary May 2017
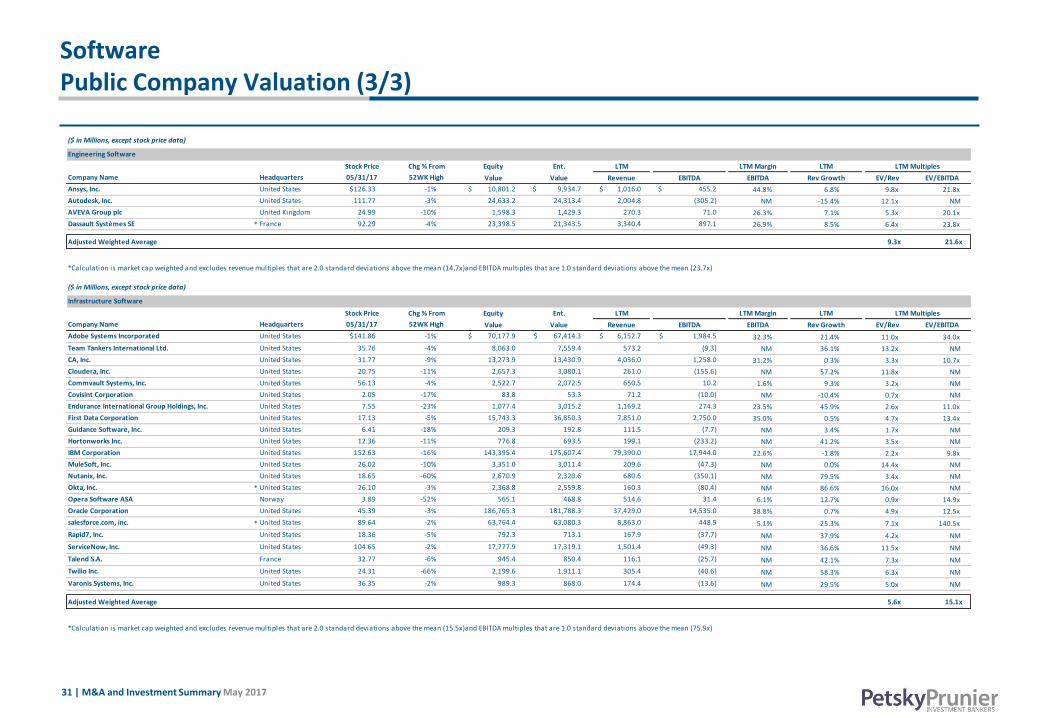
Software Public Company Valuation (3/3)
($ in Millions, except stock price data)
Engineering Software
Stock Price Chg % From Equity Ent. LTM LTM Margin LTM LTM Multiples
Company Name Headquarters 05/31/17 52WK High Value Value Revenue EBITDA EBITDA Rev Growth EV/Rev EV/EBITDA
Ansys, Inc. United States $126.33 -1% $ 10,801.2 $ 9,934.7 $ 1,016.0 $ 455.2 44.8% 6.8% 9.8x 21.8x
Autodesk, Inc. United States 111.77 -3% 24,633.2 24,313.4 2,004.8 (305.2) NM -15.4% 12.1x NM
AVEVA Group plc United Kingdom 24.99 -10% 1,598.3 1,429.3 270.3 71.0 26.3% 7.1% 5.3x 20.1x
Dassault Systèmes SE * France 92.29 -4% 23,398.5 21,343.5 3,340.4 897.1 26.9% 8.5% 6.4x 23.8x
Adjusted Weighted Average 9.3x 21.6x
($ in Millions, except stock price data)
Infrastructure Software
Stock Price Chg % From Equity Ent. LTM LTM Margin LTM LTM Multiples
Company Name Headquarters 05/31/17 52WK High Value Value Revenue EBITDA EBITDA Rev Growth EV/Rev EV/EBITDA
Adobe Systems Incorporated United States $141.86 -1% $ 70,177.9 $ 67,414.3 $ 6,152.7 $ 1,984.5 32.3% 21.4% 11.0x 34.0x
Team Tankers International Ltd. United States 35.76 -4% 8,063.0 7,559.4 573.2 (9.3) NM 36.1% 13.2x NM
CA, Inc. United States 31.77 -9% 13,273.9 13,430.9 4,036.0 1,258.0 31.2% 0.3% 3.3x 10.7x
Cloudera, Inc. United States 20.75 -11% 2,657.3 3,080.1 261.0 (155.6) NM 57.2% 11.8x NM
Commvault Systems, Inc. United States 56.13 -4% 2,522.7 2,072.5 650.5 10.2 1.6% 9.3% 3.2x NM
Covisint Corporation United States 2.05 -17% 83.8 53.3 71.2 (10.0) NM -10.4% 0.7x NM
Endurance International Group Holdings, Inc. United States 7.55 -23% 1,077.4 3,015.2 1,169.2 274.3 23.5% 45.9% 2.6x 11.0x
First Data Corporation United States 17.13 -5% 15,743.3 36,850.3 7,851.0 2,750.0 35.0% 0.5% 4.7x 13.4x
Guidance Software, Inc. United States 6.41 -18% 209.3 192.8 111.5 (7.7) NM 3.4% 1.7x NM
Hortonworks Inc. United States 12.36 -11% 776.8 693.5 199.1 (233.2) NM 41.2% 3.5x NM
IBM Corporation United States 152.63 -16% 143,395.4 175,607.4 79,390.0 17,944.0 22.6% -1.8% 2.2x 9.8x
MuleSoft, Inc. United States 26.02 -10% 3,351.0 3,011.4 209.6 (47.3) NM 0.0% 14.4x NM
Nutanix, Inc. United States 18.65 -60% 2,670.9 2,320.6 680.6 (350.1) NM 79.5% 3.4x NM
Okta, Inc. * United States 26.10 -3% 2,368.8 2,559.8 160.3 (80.4) NM 86.6% 16.0x NM
Opera Software ASA Norway 3.89 -52% 565.1 468.8 514.6 31.4 6.1% 12.7% 0.9x 14.9x
Oracle Corporation United States 45.39 -3% 186,765.3 181,788.3 37,429.0 14,535.0 38.8% 0.7% 4.9x 12.5x
salesforce.com, inc. * United States 89.64 -2% 63,764.4 63,080.3 8,863.0 448.9 5.1% 25.3% 7.1x 140.5x
Rapid7, Inc. United States 18.36 -5% 792.3 713.1 167.9 (37.7) NM 37.9% 4.2x NM
ServiceNow, Inc. United States 104.65 -2% 17,777.9 17,319.1 1,501.4 (49.3) NM 36.6% 11.5x NM
Talend S.A. France 32.77 -6% 945.4 850.4 116.1 (25.7) NM 42.1% 7.3x NM
Twilio Inc. United States 24.31 -66% 2,199.6 1,911.1 305.4 (40.6) NM 58.3% 6.3x NM
Varonis Systems, Inc. United States 36.35 -2% 989.3 868.0 174.4 (13.6) NM 29.5% 5.0x NM
Adjusted Weighted Average 5.6x 15.1x
*Calculation is market cap weighted and excludes revenue multiples that are 2.0 standard deviations above the mean (15.5x)and EBITDA multiples that are 1.0 standard deviations above the mean (75.9x)
*Calculation is market cap weighted and excludes revenue multiples that are 2.0 standard deviations above the mean (14.7x)and EBITDA multiples that are 1.0 standard deviations above the mean (23.7x)
32 | M&A and Investment Summary May 2017
Information
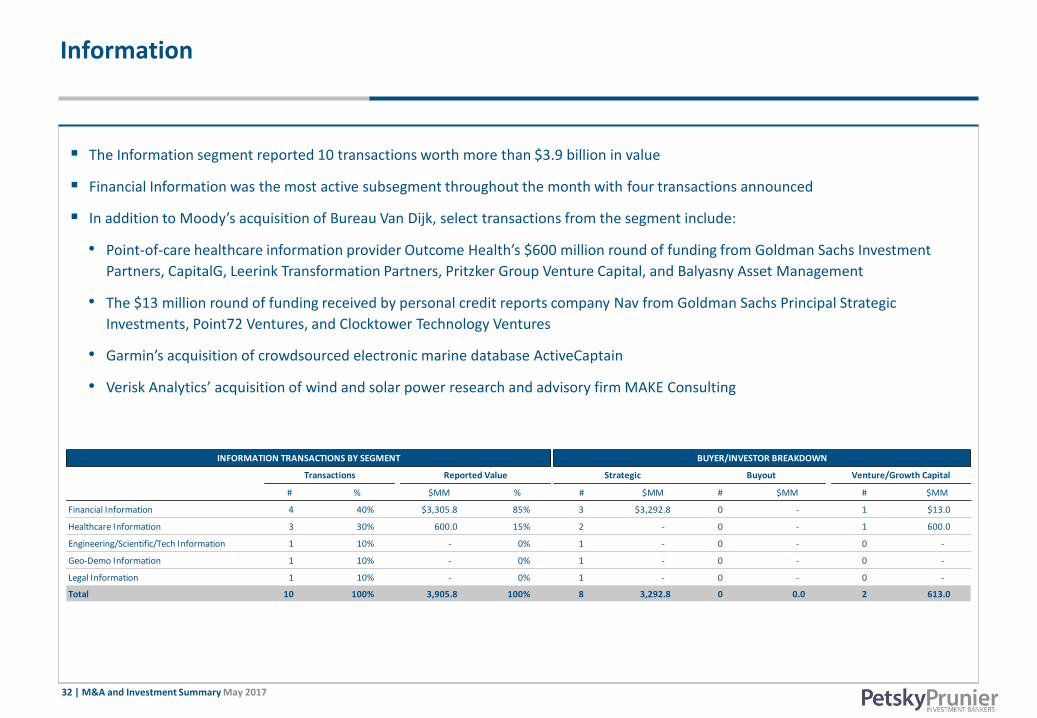
The Information segment reported 10 transactions worth more than $3.9 billion in value
Financial Information was the most active subsegment throughout the month with four transactions announced
In addition to Moody’s acquisition of Bureau Van Dijk, select transactions from the segment include:
• Point-of-care healthcare information provider Outcome Health’s $600 million round of funding from Goldman Sachs Investment
Partners, CapitalG, Leerink Transformation Partners, Pritzker Group Venture Capital, and Balyasny Asset Management
• The $13 million round of funding received by personal credit reports company Nav from Goldman Sachs Principal Strategic
Investments, Point72 Ventures, and Clocktower Technology Ventures
• Garmin’s acquisition of crowdsourced electronic marine database ActiveCaptain
• Verisk Analytics’ acquisition of wind and solar power research and advisory firm MAKE Consulting
*Intercontinental Exchange’s $7.4 billion acquisition of Interactive Data has been excluded to limit comparative distortions
# % $MM % # $MM # $MM # $MM
Financial Information 4 40% $3,305.8 85% 3 $3,292.8 0 - 1 $13.0
Healthcare Information 3 30% 600.0 15% 2 - 0 - 1 600.0
Engineering/Scientific/Tech Information 1 10% - 0% 1 - 0 - 0 -
Geo-Demo Information 1 10% - 0% 1 - 0 - 0 -
Legal Information 1 10% - 0% 1 - 0 - 0 -
Total 10 100% 3,905.8 100% 8 3,292.8 0 0.0 2 613.0
INFORMATION TRANSACTIONS BY SEGMENT BUYER/INVESTOR BREAKDOWN
Transactions Reported Value Strategic Buyout Venture/Growth Capital
33 | M&A and Investment Summary May 2017
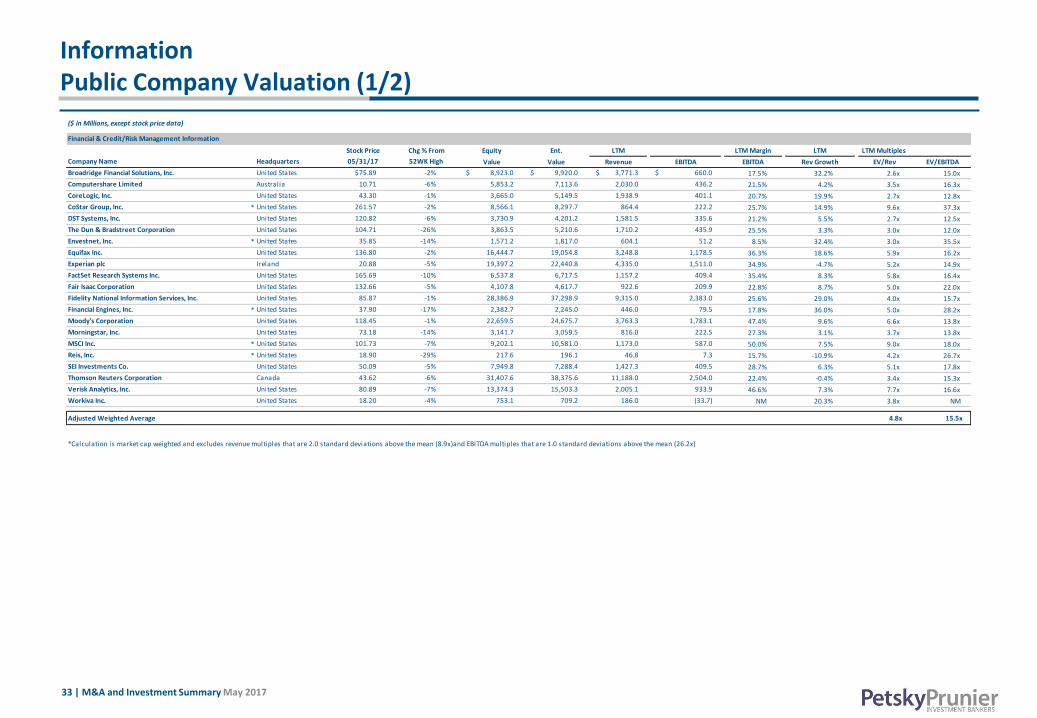
Information Public Company Valuation (1/2)
($ in Millions, except stock price data)
Financial & Credit/Risk Management Information
Stock Price Chg % From Equity Ent. LTM LTM Margin LTM LTM Multiples
Company Name Headquarters 05/31/17 52WK High Value Value Revenue EBITDA EBITDA Rev Growth EV/Rev EV/EBITDA
Broadridge Financial Solutions, Inc. United States $75.89 -2% $ 8,923.0 $ 9,920.0 $ 3,771.3 $ 660.0 17.5% 32.2% 2.6x 15.0x
Computershare Limited Australia 10.71 -6% 5,853.2 7,113.6 2,030.0 436.2 21.5% 4.2% 3.5x 16.3x
CoreLogic, Inc. United States 43.30 -1% 3,665.0 5,149.5 1,938.9 401.1 20.7% 19.9% 2.7x 12.8x
CoStar Group, Inc. * United States 261.57 -2% 8,566.1 8,297.7 864.4 222.2 25.7% 14.9% 9.6x 37.3x
DST Systems, Inc. United States 120.82 -6% 3,730.9 4,201.2 1,581.5 335.6 21.2% 5.5% 2.7x 12.5x
The Dun & Bradstreet Corporation United States 104.71 -26% 3,863.5 5,210.6 1,710.2 435.9 25.5% 3.3% 3.0x 12.0x
Envestnet, Inc. * United States 35.85 -14% 1,571.2 1,817.0 604.1 51.2 8.5% 32.4% 3.0x 35.5x
Equifax Inc. United States 136.80 -2% 16,444.7 19,054.8 3,248.8 1,178.5 36.3% 18.6% 5.9x 16.2x
Experian plc Ireland 20.88 -5% 19,397.2 22,440.8 4,335.0 1,511.0 34.9% -4.7% 5.2x 14.9x
FactSet Research Systems Inc. United States 165.69 -10% 6,537.8 6,717.5 1,157.2 409.4 35.4% 8.3% 5.8x 16.4x
Fair Isaac Corporation United States 132.66 -5% 4,107.8 4,617.7 922.6 209.9 22.8% 8.7% 5.0x 22.0x
Fidelity National Information Services, Inc. United States 85.87 -1% 28,386.9 37,298.9 9,315.0 2,383.0 25.6% 29.0% 4.0x 15.7x
Financial Engines, Inc. * United States 37.90 -17% 2,382.7 2,245.0 446.0 79.5 17.8% 36.0% 5.0x 28.2x
Moody's Corporation United States 118.45 -1% 22,659.5 24,675.7 3,763.3 1,783.1 47.4% 9.6% 6.6x 13.8x
Morningstar, Inc. United States 73.18 -14% 3,141.7 3,059.5 816.0 222.5 27.3% 3.1% 3.7x 13.8x
MSCI Inc. * United States 101.73 -7% 9,202.1 10,581.0 1,173.0 587.0 50.0% 7.5% 9.0x 18.0x
Reis, Inc. * United States 18.90 -29% 217.6 196.1 46.8 7.3 15.7% -10.9% 4.2x 26.7x
SEI Investments Co. United States 50.09 -5% 7,949.8 7,288.4 1,427.3 409.5 28.7% 6.3% 5.1x 17.8x
Thomson Reuters Corporation Canada 43.62 -6% 31,407.6 38,375.6 11,188.0 2,504.0 22.4% -0.4% 3.4x 15.3x
Verisk Analytics, Inc. United States 80.89 -7% 13,374.3 15,503.3 2,005.1 933.9 46.6% 7.3% 7.7x 16.6x
Workiva Inc. United States 18.20 -4% 753.1 709.2 186.0 (33.7) NM 20.3% 3.8x NM
Adjusted Weighted Average 4.8x 15.5x
*Calculation is market cap weighted and excludes revenue multiples that are 2.0 standard deviations above the mean (8.9x)and EBITDA multiples that are 1.0 standard deviations above the mean (26.2x)
34 | M&A and Investment Summary May 2017
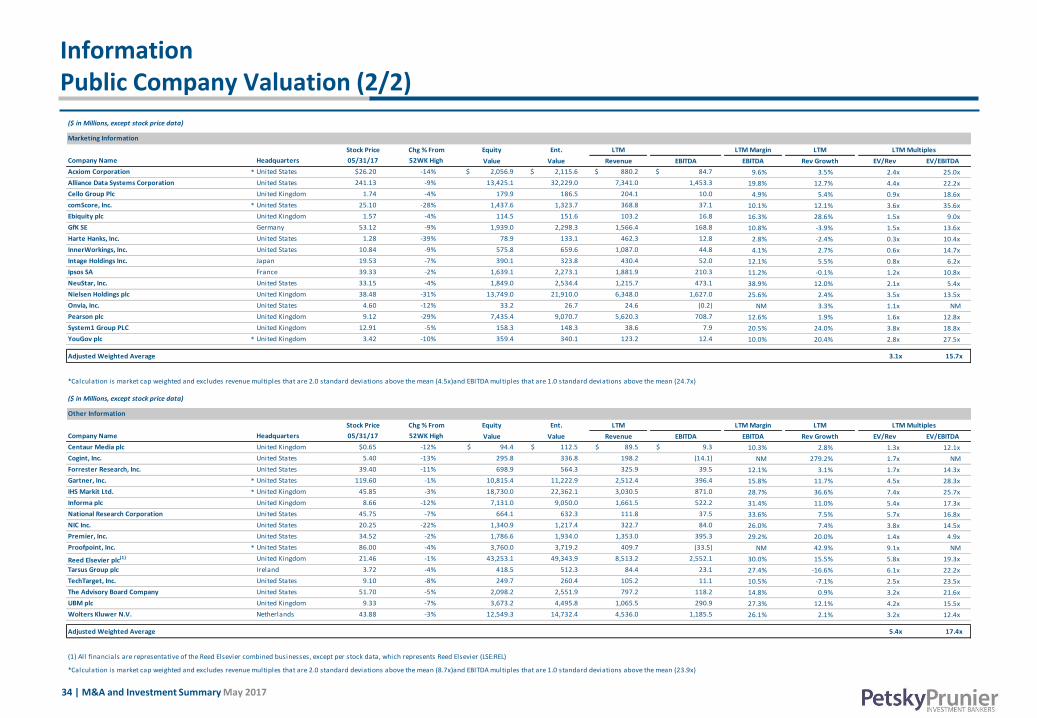
Information Public Company Valuation (2/2)
($ in Millions, except stock price data)
Marketing Information
Stock Price Chg % From Equity Ent. LTM LTM Margin LTM LTM Multiples
Company Name Headquarters 05/31/17 52WK High Value Value Revenue EBITDA EBITDA Rev Growth EV/Rev EV/EBITDA
Acxiom Corporation * United States $26.20 -14% $ 2,056.9 $ 2,115.6 $ 880.2 $ 84.7 9.6% 3.5% 2.4x 25.0x
Alliance Data Systems Corporation United States 241.13 -9% 13,425.1 32,229.0 7,341.0 1,453.3 19.8% 12.7% 4.4x 22.2x
Cello Group Plc United Kingdom 1.74 -4% 179.9 186.5 204.1 10.0 4.9% 5.4% 0.9x 18.6x
comScore, Inc. * United States 25.10 -28% 1,437.6 1,323.7 368.8 37.1 10.1% 12.1% 3.6x 35.6x
Ebiquity plc United Kingdom 1.57 -4% 114.5 151.6 103.2 16.8 16.3% 28.6% 1.5x 9.0x
GfK SE Germany 53.12 -9% 1,939.0 2,298.3 1,566.4 168.8 10.8% -3.9% 1.5x 13.6x
Harte Hanks, Inc. United States 1.28 -39% 78.9 133.1 462.3 12.8 2.8% -2.4% 0.3x 10.4x
InnerWorkings, Inc. United States 10.84 -9% 575.8 659.6 1,087.0 44.8 4.1% 2.7% 0.6x 14.7x
Intage Holdings Inc. Japan 19.53 -7% 390.1 323.8 430.4 52.0 12.1% 5.5% 0.8x 6.2x
Ipsos SA France 39.33 -2% 1,639.1 2,273.1 1,881.9 210.3 11.2% -0.1% 1.2x 10.8x
NeuStar, Inc. United States 33.15 -4% 1,849.0 2,534.4 1,215.7 473.1 38.9% 12.0% 2.1x 5.4x
Nielsen Holdings plc United Kingdom 38.48 -31% 13,749.0 21,910.0 6,348.0 1,627.0 25.6% 2.4% 3.5x 13.5x
Onvia, Inc. United States 4.60 -12% 33.2 26.7 24.6 (0.2) NM 3.3% 1.1x NM
Pearson plc United Kingdom 9.12 -29% 7,435.4 9,070.7 5,620.3 708.7 12.6% 1.9% 1.6x 12.8x
System1 Group PLC United Kingdom 12.91 -5% 158.3 148.3 38.6 7.9 20.5% 24.0% 3.8x 18.8x
YouGov plc * United Kingdom 3.42 -10% 359.4 340.1 123.2 12.4 10.0% 20.4% 2.8x 27.5x
Adjusted Weighted Average 3.1x 15.7x
($ in Millions, except stock price data)
Other Information
Stock Price Chg % From Equity Ent. LTM LTM Margin LTM LTM Multiples
Company Name Headquarters 05/31/17 52WK High Value Value Revenue EBITDA EBITDA Rev Growth EV/Rev EV/EBITDA
Centaur Media plc United Kingdom $0.65 -12% $ 94.4 $ 112.5 $ 89.5 $ 9.3 10.3% 2.8% 1.3x 12.1x
Cogint, Inc. United States 5.40 -13% 295.8 336.8 198.2 (14.1) NM 279.2% 1.7x NM
Forrester Research, Inc. United States 39.40 -11% 698.9 564.3 325.9 39.5 12.1% 3.1% 1.7x 14.3x
Gartner, Inc. * United States 119.60 -1% 10,815.4 11,222.9 2,512.4 396.4 15.8% 11.7% 4.5x 28.3x
IHS Markit Ltd. * United Kingdom 45.85 -3% 18,730.0 22,362.1 3,030.5 871.0 28.7% 36.6% 7.4x 25.7x
Informa plc United Kingdom 8.66 -12% 7,131.0 9,050.0 1,661.5 522.2 31.4% 11.0% 5.4x 17.3x
National Research Corporation United States 45.75 -7% 664.1 632.3 111.8 37.5 33.6% 7.5% 5.7x 16.8x
NIC Inc. United States 20.25 -22% 1,340.9 1,217.4 322.7 84.0 26.0% 7.4% 3.8x 14.5x
Premier, Inc. United States 34.52 -2% 1,786.6 1,934.0 1,353.0 395.3 29.2% 20.0% 1.4x 4.9x
Proofpoint, Inc. * United States 86.00 -4% 3,760.0 3,719.2 409.7 (33.5) NM 42.9% 9.1x NM
Reed Elsevier plc(1) United Kingdom 21.46 -1% 43,253.1 49,343.9 8,513.2 2,552.1 30.0% 15.5% 5.8x 19.3x
Tarsus Group plc Ireland 3.72 -4% 418.5 512.3 84.4 23.1 27.4% -16.6% 6.1x 22.2x
TechTarget, Inc. United States 9.10 -8% 249.7 260.4 105.2 11.1 10.5% -7.1% 2.5x 23.5x
The Advisory Board Company United States 51.70 -5% 2,098.2 2,551.9 797.2 118.2 14.8% 0.9% 3.2x 21.6x
UBM plc United Kingdom 9.33 -7% 3,673.2 4,495.8 1,065.5 290.9 27.3% 12.1% 4.2x 15.5x
Wolters Kluwer N.V. Netherlands 43.88 -3% 12,549.3 14,732.4 4,536.0 1,185.5 26.1% 2.1% 3.2x 12.4x
Adjusted Weighted Average 5.4x 17.4x
*Calculation is market cap weighted and excludes revenue multiples that are 2.0 standard deviations above the mean (4.5x)and EBITDA multiples that are 1.0 standard deviations above the mean (24.7x)
(1) All financials are representative of the Reed Elsevier combined businesses, except per stock data, which represents Reed Elsevier (LSE:REL)
*Calculation is market cap weighted and excludes revenue multiples that are 2.0 standard deviations above the mean (8.7x)and EBITDA multiples that are 1.0 standard deviations above the mean (23.9x)
35 | M&A and Investment Summary May 2017
Business Services
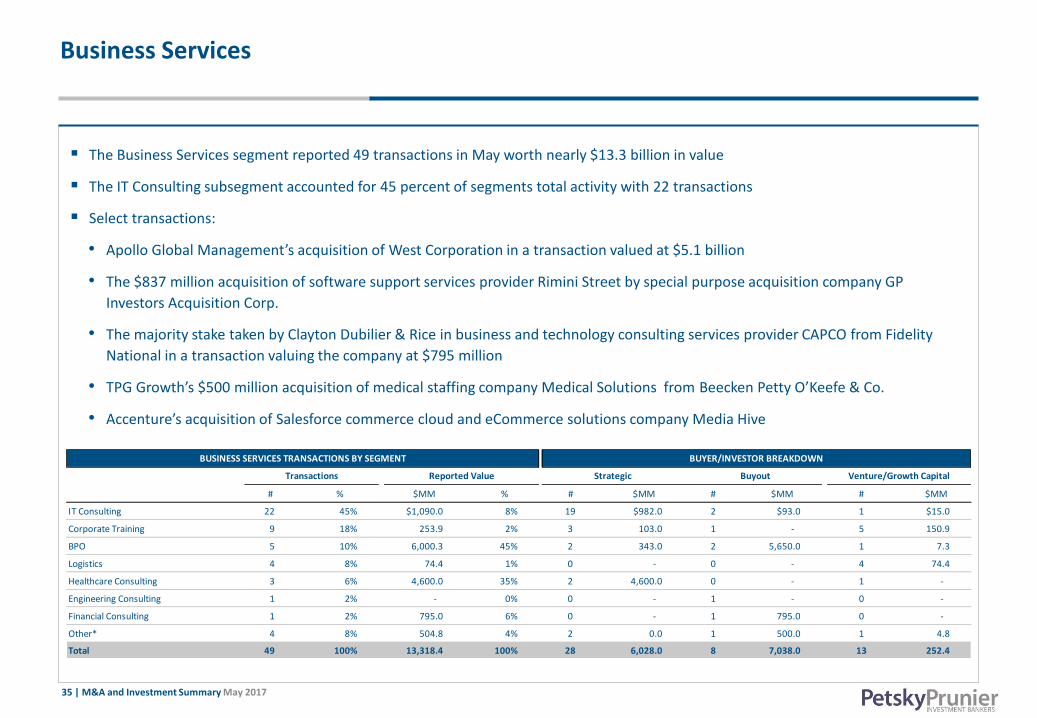
The Business Services segment reported 49 transactions in May worth nearly $13.3 billion in value
The IT Consulting subsegment accounted for 45 percent of segments total activity with 22 transactions
Select transactions:
• Apollo Global Management’s acquisition of West Corporation in a transaction valued at $5.1 billion
• The $837 million acquisition of software support services provider Rimini Street by special purpose acquisition company GP
Investors Acquisition Corp.
• The majority stake taken by Clayton Dubilier & Rice in business and technology consulting services provider CAPCO from Fidelity
National in a transaction valuing the company at $795 million
• TPG Growth’s $500 million acquisition of medical staffing company Medical Solutions from Beecken Petty O’Keefe & Co.
• Accenture’s acquisition of Salesforce commerce cloud and eCommerce solutions company Media Hive
# % $MM % # $MM # $MM # $MM
IT Consulting 22 45% $1,090.0 8% 19 $982.0 2 $93.0 1 $15.0
Corporate Training 9 18% 253.9 2% 3 103.0 1 - 5 150.9
BPO 5 10% 6,000.3 45% 2 343.0 2 5,650.0 1 7.3
Logistics 4 8% 74.4 1% 0 - 0 - 4 74.4
Healthcare Consulting 3 6% 4,600.0 35% 2 4,600.0 0 - 1 -
Engineering Consulting 1 2% - 0% 0 - 1 - 0 -
Financial Consulting 1 2% 795.0 6% 0 - 1 795.0 0 -
Other* 4 8% 504.8 4% 2 0.0 1 500.0 1 4.8
Total 49 100% 13,318.4 100% 28 6,028.0 8 7,038.0 13 252.4
BUSINESS SERVICES TRANSACTIONS BY SEGMENT BUYER/INVESTOR BREAKDOWN
Transactions Reported Value Strategic Buyout Venture/Growth Capital
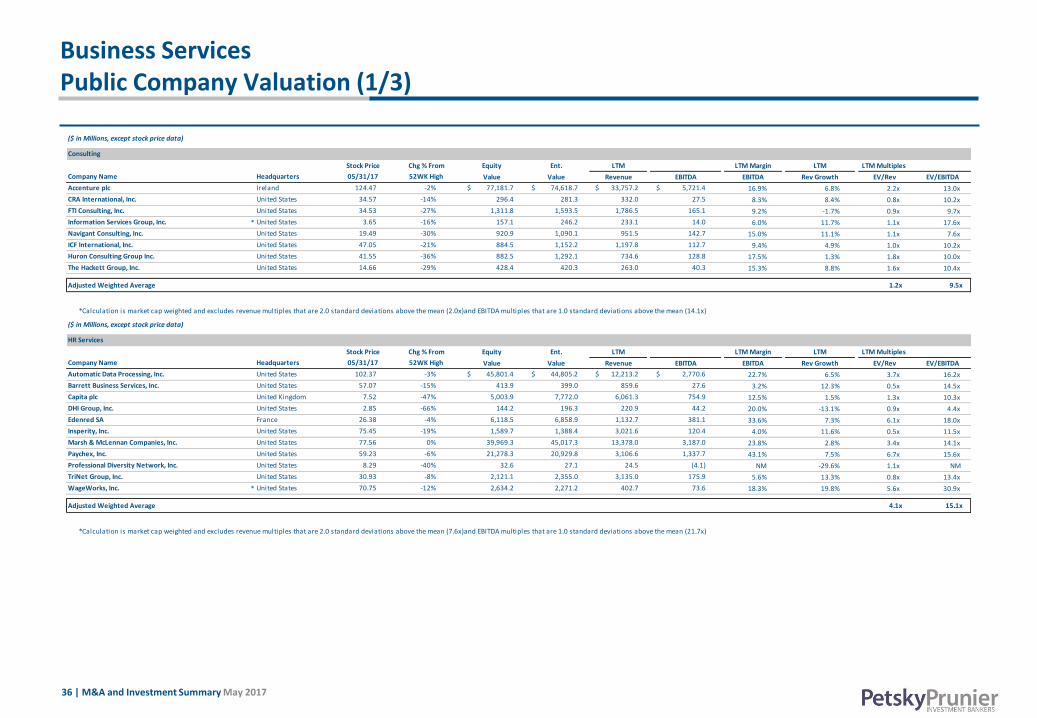
36 | M&A and Investment Summary May 2017
Business Services Public Company Valuation (1/3)
($ in Millions, except stock price data)
Consulting
Stock Price Chg % From Equity Ent. LTM LTM Margin LTM LTM Multiples
Company Name Headquarters 05/31/17 52WK High Value Value Revenue EBITDA EBITDA Rev Growth EV/Rev EV/EBITDA
Accenture plc Ireland 124.47 -2% $ 77,181.7 $ 74,618.7 $ 33,757.2 $ 5,721.4 16.9% 6.8% 2.2x 13.0x
CRA International, Inc. United States 34.57 -14% 296.4 281.3 332.0 27.5 8.3% 8.4% 0.8x 10.2x
FTI Consulting, Inc. United States 34.53 -27% 1,311.8 1,593.5 1,786.5 165.1 9.2% -1.7% 0.9x 9.7x
Information Services Group, Inc. * United States 3.65 -16% 157.1 246.2 233.1 14.0 6.0% 11.7% 1.1x 17.6x
Navigant Consulting, Inc. United States 19.49 -30% 920.9 1,090.1 951.5 142.7 15.0% 11.1% 1.1x 7.6x
ICF International, Inc. United States 47.05 -21% 884.5 1,152.2 1,197.8 112.7 9.4% 4.9% 1.0x 10.2x
Huron Consulting Group Inc. United States 41.55 -36% 882.5 1,292.1 734.6 128.8 17.5% 1.3% 1.8x 10.0x
The Hackett Group, Inc. United States 14.66 -29% 428.4 420.3 263.0 40.3 15.3% 8.8% 1.6x 10.4x
Adjusted Weighted Average 1.2x 9.5x
($ in Millions, except stock price data)
HR Services
Stock Price Chg % From Equity Ent. LTM LTM Margin LTM LTM Multiples
Company Name Headquarters 05/31/17 52WK High Value Value Revenue EBITDA EBITDA Rev Growth EV/Rev EV/EBITDA
Automatic Data Processing, Inc. United States 102.37 -3% $ 45,801.4 $ 44,805.2 $ 12,213.2 $ 2,770.6 22.7% 6.5% 3.7x 16.2x
Barrett Business Services, Inc. United States 57.07 -15% 413.9 399.0 859.6 27.6 3.2% 12.3% 0.5x 14.5x
Capita plc United Kingdom 7.52 -47% 5,003.9 7,772.0 6,061.3 754.9 12.5% 1.5% 1.3x 10.3x
DHI Group, Inc. United States 2.85 -66% 144.2 196.3 220.9 44.2 20.0% -13.1% 0.9x 4.4x
Edenred SA France 26.38 -4% 6,118.5 6,858.9 1,132.7 381.1 33.6% 7.3% 6.1x 18.0x
Insperity, Inc. United States 75.45 -19% 1,589.7 1,388.4 3,021.6 120.4 4.0% 11.6% 0.5x 11.5x
Marsh & McLennan Companies, Inc. United States 77.56 0% 39,969.3 45,017.3 13,378.0 3,187.0 23.8% 2.8% 3.4x 14.1x
Paychex, Inc. United States 59.23 -6% 21,278.3 20,929.8 3,106.6 1,337.7 43.1% 7.5% 6.7x 15.6x
Professional Diversity Network, Inc. United States 8.29 -40% 32.6 27.1 24.5 (4.1) NM -29.6% 1.1x NM
TriNet Group, Inc. United States 30.93 -8% 2,121.1 2,355.0 3,135.0 175.9 5.6% 13.3% 0.8x 13.4x
WageWorks, Inc. * United States 70.75 -12% 2,634.2 2,271.2 402.7 73.6 18.3% 19.8% 5.6x 30.9x
Adjusted Weighted Average 4.1x 15.1x
*Calculation is market cap weighted and excludes revenue multiples that are 2.0 standard deviations above the mean (2.0x)and EBITDA multiples that are 1.0 standard deviations above the mean (14.1x)
*Calculation is market cap weighted and excludes revenue multiples that are 2.0 standard deviations above the mean (7.6x)and EBITDA multiples that are 1.0 standard deviations above the mean (21.7x)

37 | M&A and Investment Summary May 2017
Business Services Public Company Valuation (2/3)
($ in Millions, except stock price data)
IT Consulting
Stock Price Chg % From Equity Ent. LTM LTM Margin LTM LTM Multiples
Company Name Headquarters 05/31/17 52WK High Value Value Revenue EBITDA EBITDA Rev Growth EV/Rev EV/EBITDA
Accenture plc Ireland 124.47 -2% $ 77,181.7 $ 74,618.7 $ 33,757.2 $ 5,721.4 16.9% 6.8% 2.2x 13.0x
Amdocs Limited United States 64.78 -2% 9,487.3 8,537.8 3,791.5 715.4 18.9% 3.0% 2.3x 11.9x
Bechtle AG Germany 128.37 -2% 2,695.8 2,625.1 3,413.0 184.7 5.4% 9.5% 0.8x 14.2x
Booz Allen Hamilton Holding Corporation United States 39.44 0% 5,834.0 7,279.9 5,804.3 547.6 9.4% 7.4% 1.3x 13.3x
Business & Decision SA * France 8.75 -6% 69.0 100.0 240.3 3.5 NA 1.5% 0.4x 28.3x
Cap Gemini S.A. France 103.55 -5% 16,968.3 18,747.0 13,236.6 1,670.0 12.6% 5.2% 1.4x 11.2x
Cerner Corporation * United States 65.35 -3% 21,593.6 21,611.8 4,827.0 1,351.5 28.0% 7.4% 4.5x 16.0x
CGI Group Inc. Canada 49.58 -2% 14,479.6 15,612.0 7,991.5 1,360.0 17.0% 0.7% 2.0x 11.5x
Cognizant Technology Solutions Corporation United States 66.91 -1% 39,409.8 36,344.8 13,831.0 2,714.0 19.6% 8.8% 2.6x 13.4x
Digi International Inc. United States 9.55 -33% 253.4 145.5 193.4 18.4 9.5% -6.4% 0.8x 7.9x
DXC Technology Company * United States 77.52 -4% 21,950.9 23,650.9 7,607.0 1,099.0 14.4% 7.1% 3.1x 21.5x
Globant S.A. * Luxembourg 39.16 -17% 1,359.9 1,318.0 338.3 56.6 16.7% 24.1% 3.9x 23.3x
International Business Machines Corporation United States 152.63 -16% 143,395.4 175,607.4 79,390.0 17,944.0 22.6% -1.8% 2.2x 9.8x
Infosys Limited India 15.14 -24% 34,604.5 29,557.2 10,208.0 2,774.0 27.2% 7.4% 2.9x 10.7x
ITS Group France 8.00 -6% 61.4 63.5 199.3 8.0 4.0% -1.7% 0.3x 7.9x
NCI, Inc. United States 19.10 -3% 258.8 259.0 317.5 28.2 8.9% -5.4% 0.8x 9.2x
NTT Data Corporation Japan 53.94 -2% 15,130.0 18,782.9 15,537.9 2,436.3 15.7% 7.3% 1.2x 7.7x
Perficient, Inc. United States 17.27 -24% 608.7 636.3 457.2 46.9 10.3% -2.8% 1.4x 13.6x
Presidio, Inc. United States 15.37 -6% 1,397.3 2,308.1 2,842.2 203.0 7.1% 0.0% 0.8x 11.4x
Reply S.p.A. Italy 197.75 -3% 1,849.4 1,817.6 844.8 107.9 12.8% 11.0% 2.2x 16.8x
SQLi France 50.34 -2% 185.9 191.8 201.5 16.2 8.0% 6.7% 1.0x 11.8x
Tata Consultancy Services Limited India 39.46 -7% 77,754.6 70,774.2 18,206.0 4,989.3 27.4% 8.6% 3.9x 14.2x
Wipro Limited India 8.32 -7% 20,137.2 17,039.0 8,494.5 1,684.2 19.8% 7.4% 2.0x 10.1x
Adjusted Weighted Average 2.5x 11.8x
*Calculation is market cap weighted and excludes revenue multiples that are 2.0 standard deviations above the mean (4.2x)and EBITDA multiples that are 1.0 standard deviations above the mean (18.5x)
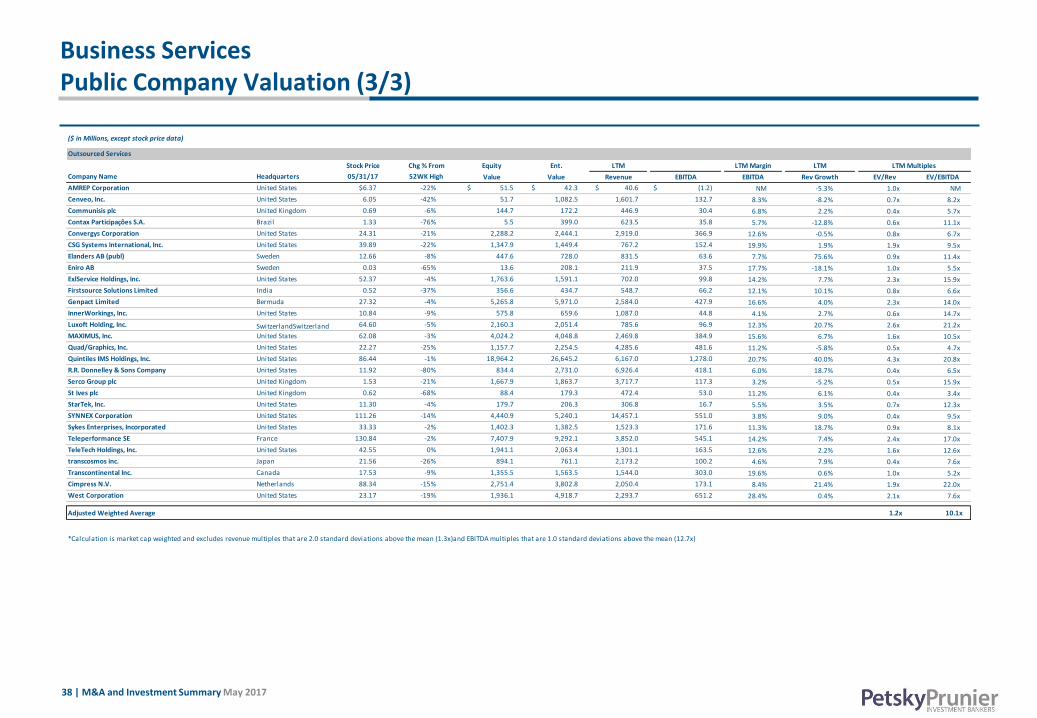
38 | M&A and Investment Summary May 2017
Business Services Public Company Valuation (3/3)
($ in Millions, except stock price data)
Outsourced Services
Stock Price Chg % From Equity Ent. LTM LTM Margin LTM LTM Multiples
Company Name Headquarters 05/31/17 52WK High Value Value Revenue EBITDA EBITDA Rev Growth EV/Rev EV/EBITDA
AMREP Corporation United States $6.37 -22% $ 51.5 $ 42.3 $ 40.6 $ (1.2) NM -5.3% 1.0x NM
Cenveo, Inc. United States 6.05 -42% 51.7 1,082.5 1,601.7 132.7 8.3% -8.2% 0.7x 8.2x
Communisis plc United Kingdom 0.69 -6% 144.7 172.2 446.9 30.4 6.8% 2.2% 0.4x 5.7x
Contax Participações S.A. Brazil 1.33 -76% 5.5 399.0 623.5 35.8 5.7% -12.8% 0.6x 11.1x
Convergys Corporation United States 24.31 -21% 2,288.2 2,444.1 2,919.0 366.9 12.6% -0.5% 0.8x 6.7x
CSG Systems International, Inc. United States 39.89 -22% 1,347.9 1,449.4 767.2 152.4 19.9% 1.9% 1.9x 9.5x
Elanders AB (publ) Sweden 12.66 -8% 447.6 728.0 831.5 63.6 7.7% 75.6% 0.9x 11.4x
Eniro AB Sweden 0.03 -65% 13.6 208.1 211.9 37.5 17.7% -18.1% 1.0x 5.5x
ExlService Holdings, Inc. United States 52.37 -4% 1,763.6 1,591.1 702.0 99.8 14.2% 7.7% 2.3x 15.9x
Firstsource Solutions Limited India 0.52 -37% 356.6 434.7 548.7 66.2 12.1% 10.1% 0.8x 6.6x
Genpact Limited Bermuda 27.32 -4% 5,265.8 5,971.0 2,584.0 427.9 16.6% 4.0% 2.3x 14.0x
InnerWorkings, Inc. United States 10.84 -9% 575.8 659.6 1,087.0 44.8 4.1% 2.7% 0.6x 14.7x
Luxoft Holding, Inc. SwitzerlandSwitzerland 64.60 -5% 2,160.3 2,051.4 785.6 96.9 12.3% 20.7% 2.6x 21.2x
MAXIMUS, Inc. United States 62.08 -3% 4,024.2 4,048.8 2,469.8 384.9 15.6% 6.7% 1.6x 10.5x
Quad/Graphics, Inc. United States 22.27 -25% 1,157.7 2,254.5 4,285.6 481.6 11.2% -5.8% 0.5x 4.7x
Quintiles IMS Holdings, Inc. United States 86.44 -1% 18,964.2 26,645.2 6,167.0 1,278.0 20.7% 40.0% 4.3x 20.8x
R.R. Donnelley & Sons Company United States 11.92 -80% 834.4 2,731.0 6,926.4 418.1 6.0% 18.7% 0.4x 6.5x
Serco Group plc United Kingdom 1.53 -21% 1,667.9 1,863.7 3,717.7 117.3 3.2% -5.2% 0.5x 15.9x
St Ives plc United Kingdom 0.62 -68% 88.4 179.3 472.4 53.0 11.2% 6.1% 0.4x 3.4x
StarTek, Inc. United States 11.30 -4% 179.7 206.3 306.8 16.7 5.5% 3.5% 0.7x 12.3x
SYNNEX Corporation United States 111.26 -14% 4,440.9 5,240.1 14,457.1 551.0 3.8% 9.0% 0.4x 9.5x
Sykes Enterprises, Incorporated United States 33.33 -2% 1,402.3 1,382.5 1,523.3 171.6 11.3% 18.7% 0.9x 8.1x
Teleperformance SE France 130.84 -2% 7,407.9 9,292.1 3,852.0 545.1 14.2% 7.4% 2.4x 17.0x
TeleTech Holdings, Inc. United States 42.55 0% 1,941.1 2,063.4 1,301.1 163.5 12.6% 2.2% 1.6x 12.6x
transcosmos inc. Japan 21.56 -26% 894.1 761.1 2,173.2 100.2 4.6% 7.9% 0.4x 7.6x
Transcontinental Inc. Canada 17.53 -9% 1,355.5 1,563.5 1,544.0 303.0 19.6% 0.6% 1.0x 5.2x
Cimpress N.V. Netherlands 88.34 -15% 2,751.4 3,802.8 2,050.4 173.1 8.4% 21.4% 1.9x 22.0x
West Corporation United States 23.17 -19% 1,936.1 4,918.7 2,293.7 651.2 28.4% 0.4% 2.1x 7.6x
Adjusted Weighted Average 1.2x 10.1x
*Calculation is market cap weighted and excludes revenue multiples that are 2.0 standard deviations above the mean (1.3x)and EBITDA multiples that are 1.0 standard deviations above the mean (12.7x)
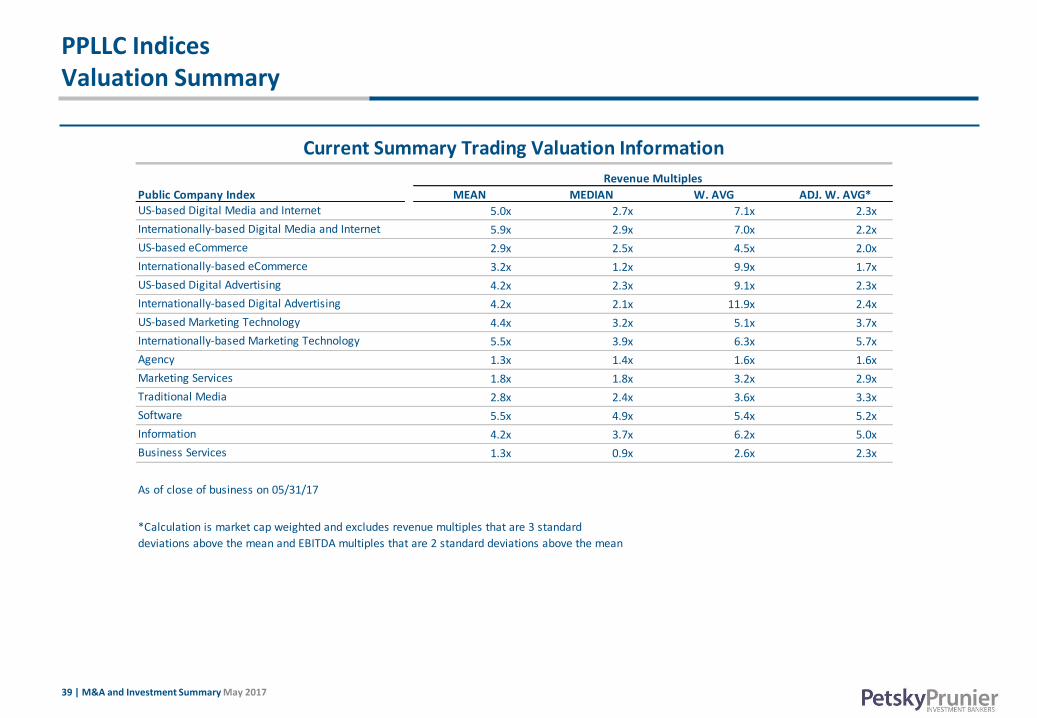
39 | M&A and Investment Summary May 2017
PPLLC Indices Valuation Summary
Public Company Index MEAN MEDIAN W. AVG ADJ. W. AVG*US-based Digital Media and Internet 5.0x 2.7x 7.1x 2.3x
Internationally-based Digital Media and Internet 5.9x 2.9x 7.0x 2.2x
US-based eCommerce 2.9x 2.5x 4.5x 2.0x
Internationally-based eCommerce 3.2x 1.2x 9.9x 1.7x
US-based Digital Advertising 4.2x 2.3x 9.1x 2.3x
Internationally-based Digital Advertising 4.2x 2.1x 11.9x 2.4x
US-based Marketing Technology 4.4x 3.2x 5.1x 3.7x
Internationally-based Marketing Technology 5.5x 3.9x 6.3x 5.7x
Agency 1.3x 1.4x 1.6x 1.6x
Marketing Services 1.8x 1.8x 3.2x 2.9x
Traditional Media 2.8x 2.4x 3.6x 3.3x
Software 5.5x 4.9x 5.4x 5.2x
Information 4.2x 3.7x 6.2x 5.0x
Business Services 1.3x 0.9x 2.6x 2.3x
deviations above the mean and EBITDA multiples that are 2 standard deviations above the mean
Current Summary Trading Valuation Information
Revenue Multiples
As of close of business on 05/31/17
*Calculation is market cap weighted and excludes revenue multiples that are 3 standard

40 | M&A and Investment Summary May 2017
PPLLC Indices Valuation Summary
Public Company Index MEAN MEDIAN W. AVG ADJ. W. AVG*US-based Digital Media and Internet 14.9x 14.1x 16.1x 13.7x
Internationally-based Digital Media and Internet 20.1x 14.3x 22.1x 14.2x
US-based eCommerce 16.6x 14.1x 19.6x 13.2x
Internationally-based eCommerce 20.0x 14.6x 27.3x 10.4x
US-based Digital Advertising 33.2x 21.2x 22.2x 12.8x
Internationally-based Digital Advertising 18.2x 14.3x 28.3x 12.0x
US-based Marketing Technology 20.7x 15.3x 29.2x 12.2x
Internationally-based Marketing Technology 26.1x 19.3x 20.3x 19.7x
Agency 11.3x 10.2x 10.0x 9.9x
Marketing Services 11.6x 9.5x 16.3x 9.4x
Traditional Media 16.8x 9.9x 12.1x 11.8x
Software 37.6x 20.1x 24.0x 16.0x
Information 18.7x 16.3x 23.5x 16.4x
Business Services 11.5x 10.4x 13.5x 12.6x
deviations above the mean and EBITDA multiples that are 2 standard deviations above the mean
Current Summary Trading Valuation Information
EBITDA Multiples
As of close of business on 05/31/17
*Calculation is market cap weighted and excludes revenue multiples that are 3 standard
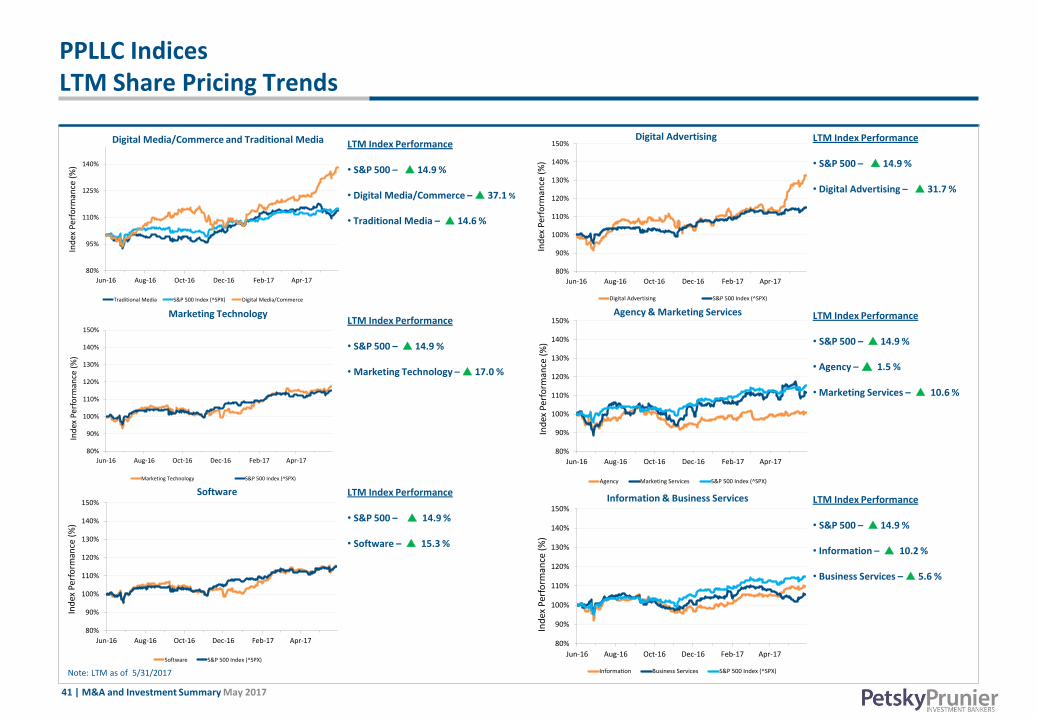
41 | M&A and Investment Summary May 2017
Digital Advertising
PPLLC Indices LTM Share Pricing Trends
Note: LTM as of 5/31/2017
LTM Index Performance • S&P 500 – 14.9 % • Digital Media/Commerce – 37.1 %
• Traditional Media – 14.6 %
LTM Index Performance • S&P 500 – 14.9 %
• Marketing Technology – 17.0 %
LTM Index Performance • S&P 500 – 14.9 % • Digital Advertising – 31.7 %
LTM Index Performance • S&P 500 – 14.9 %
• Agency – 1.5 %
• Marketing Services – 10.6 %
Digital Media/Commerce and Traditional Media
Software
Marketing Technology
LTM Index Performance • S&P 500 – 14.9 %
• Software – 15.3 %
Agency & Marketing Services
Information & Business Services LTM Index Performance • S&P 500 – 14.9 %
• Information – 10.2 %
• Business Services – 5.6 %
80%
95%
110%
125%
140%
Jun-16 Aug-16 Oct-16 Dec-16 Feb-17 Apr-17
Ind
ex P
erfo
rman
ce (
%)
Traditional Media S&P 500 Index (^SPX) Digital Media/Commerce
80%
90%
100%
110%
120%
130%
140%
150%
Jun-16 Aug-16 Oct-16 Dec-16 Feb-17 Apr-17
Ind
ex P
erfo
rman
ce (
%)
Digital Advertising S&P 500 Index (^SPX)
80%
90%
100%
110%
120%
130%
140%
150%
Jun-16 Aug-16 Oct-16 Dec-16 Feb-17 Apr-17
Ind
ex P
erfo
rman
ce (
%)
Marketing Technology S&P 500 Index (^SPX)
80%
90%
100%
110%
120%
130%
140%
150%
Jun-16 Aug-16 Oct-16 Dec-16 Feb-17 Apr-17
Ind
ex P
erfo
rman
ce (
%)
Agency Marketing Services S&P 500 Index (^SPX)
80%
90%
100%
110%
120%
130%
140%
150%
Jun-16 Aug-16 Oct-16 Dec-16 Feb-17 Apr-17
Ind
ex P
erfo
rman
ce (
%)
Software S&P 500 Index (^SPX)
80%
90%
100%
110%
120%
130%
140%
150%
Jun-16 Aug-16 Oct-16 Dec-16 Feb-17 Apr-17
Ind
ex P
erfo
rman
ce (
%)
Information Business Services S&P 500 Index (^SPX)
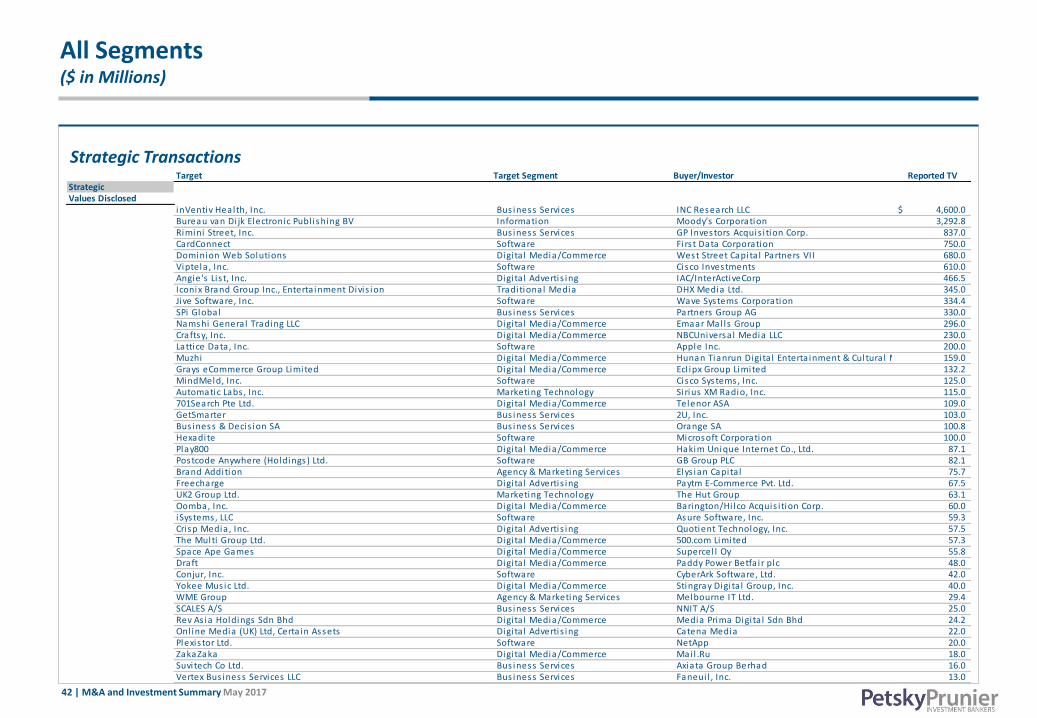
42 | M&A and Investment Summary May 2017
All Segments ($ in Millions)
Strategic Transactions Target Target Segment Buyer/Investor Reported TV
StrategicValues Disclosed
inVentiv Health, Inc. Bus iness Services INC Research LLC 4,600.0$ Bureau van Di jk Electronic Publ ishing BV Information Moody's Corporation 3,292.8 Rimini Street, Inc. Bus iness Services GP Investors Acquis i tion Corp. 837.0 CardConnect Software Firs t Data Corporation 750.0 Dominion Web Solutions Digi ta l Media/Commerce West Street Capita l Partners VII 680.0 Viptela , Inc. Software Cisco Investments 610.0 Angie's Lis t, Inc. Digi ta l Advertis ing IAC/InterActiveCorp 466.5 Iconix Brand Group Inc., Enterta inment Divis ion Traditional Media DHX Media Ltd. 345.0 Jive Software, Inc. Software Wave Systems Corporation 334.4 SPi Global Bus iness Services Partners Group AG 330.0 Namshi General Trading LLC Digi ta l Media/Commerce Emaar Mal ls Group 296.0 Craftsy, Inc. Digi ta l Media/Commerce NBCUniversa l Media LLC 230.0 Lattice Data, Inc. Software Apple Inc. 200.0 Muzhi Digi ta l Media/Commerce Hunan Tianrun Digi ta l Enterta inment & Cultura l Media 159.0 Grays eCommerce Group Limited Digi ta l Media/Commerce Ecl ipx Group Limited 132.2 MindMeld, Inc. Software Cisco Systems, Inc. 125.0 Automatic Labs , Inc. Marketing Technology Sirius XM Radio, Inc. 115.0 701Search Pte Ltd. Digi ta l Media/Commerce Telenor ASA 109.0 GetSmarter Bus iness Services 2U, Inc. 103.0 Bus iness & Decis ion SA Bus iness Services Orange SA 100.8 Hexadite Software Microsoft Corporation 100.0 Play800 Digi ta l Media/Commerce Hakim Unique Internet Co., Ltd. 87.1 Postcode Anywhere (Holdings) Ltd. Software GB Group PLC 82.1 Brand Addition Agency & Marketing Services Elys ian Capita l 75.7 Freecharge Digi ta l Advertis ing Paytm E-Commerce Pvt. Ltd. 67.5 UK2 Group Ltd. Marketing Technology The Hut Group 63.1 Oomba, Inc. Digi ta l Media/Commerce Barington/Hi lco Acquis i tion Corp. 60.0 iSystems, LLC Software Asure Software, Inc. 59.3 Crisp Media, Inc. Digi ta l Advertis ing Quotient Technology, Inc. 57.5 The Multi Group Ltd. Digi ta l Media/Commerce 500.com Limited 57.3 Space Ape Games Digi ta l Media/Commerce Supercel l Oy 55.8 Draft Digi ta l Media/Commerce Paddy Power Betfa i r plc 48.0 Conjur, Inc. Software CyberArk Software, Ltd. 42.0 Yokee Mus ic Ltd. Digi ta l Media/Commerce Stingray Digi ta l Group, Inc. 40.0 WME Group Agency & Marketing Services Melbourne IT Ltd. 29.4 SCALES A/S Bus iness Services NNIT A/S 25.0 Rev As ia Holdings Sdn Bhd Digi ta l Media/Commerce Media Prima Digi ta l Sdn Bhd 24.2 Onl ine Media (UK) Ltd, Certa in Assets Digi ta l Advertis ing Catena Media 22.0 Plexis tor Ltd. Software NetApp 20.0 ZakaZaka Digi ta l Media/Commerce Mai l .Ru 18.0 Suvi tech Co Ltd. Bus iness Services Axiata Group Berhad 16.0 Vertex Bus iness Services LLC Bus iness Services Faneui l , Inc. 13.0
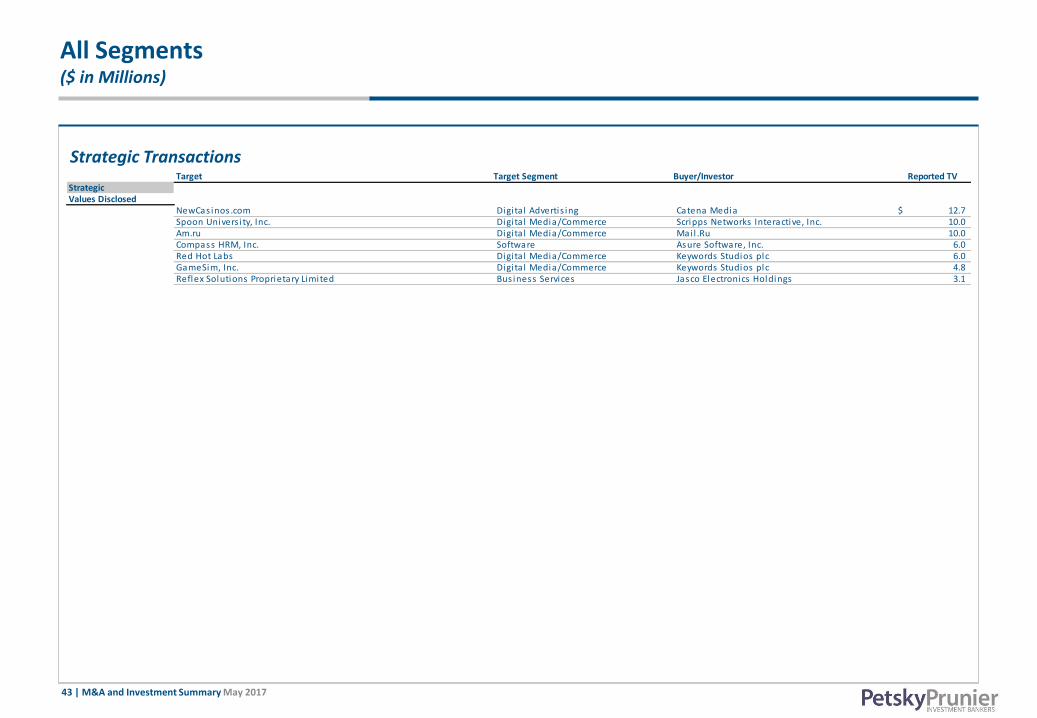
43 | M&A and Investment Summary May 2017
All Segments ($ in Millions)
Strategic Transactions Target Target Segment Buyer/Investor Reported TV
StrategicValues Disclosed
NewCas inos .com Digita l Advertis ing Catena Media 12.7$ Spoon Univers i ty, Inc. Digi ta l Media/Commerce Scripps Networks Interactive, Inc. 10.0 Am.ru Digi ta l Media/Commerce Mai l .Ru 10.0 Compass HRM, Inc. Software Asure Software, Inc. 6.0 Red Hot Labs Digi ta l Media/Commerce Keywords Studios plc 6.0 GameSim, Inc. Digi ta l Media/Commerce Keywords Studios plc 4.8 Reflex Solutions Proprietary Limited Bus iness Services Jasco Electronics Holdings 3.1
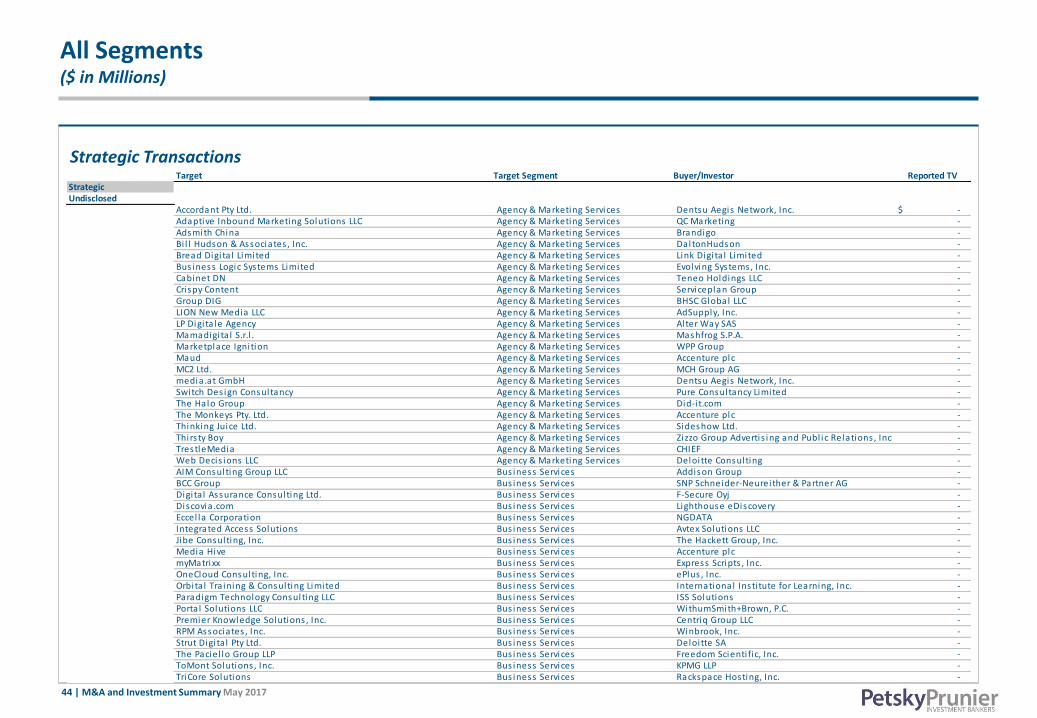
44 | M&A and Investment Summary May 2017
All Segments ($ in Millions)
Strategic Transactions Target Target Segment Buyer/Investor Reported TV
StrategicUndisclosed
Accordant Pty Ltd. Agency & Marketing Services Dentsu Aegis Network, Inc. -$ Adaptive Inbound Marketing Solutions LLC Agency & Marketing Services QC Marketing - Adsmith China Agency & Marketing Services Brandigo - Bi l l Hudson & Associates , Inc. Agency & Marketing Services DaltonHudson - Bread Digi ta l Limited Agency & Marketing Services Link Digi ta l Limited - Bus iness Logic Systems Limited Agency & Marketing Services Evolving Systems, Inc. - Cabinet DN Agency & Marketing Services Teneo Holdings LLC - Crispy Content Agency & Marketing Services Serviceplan Group - Group DIG Agency & Marketing Services BHSC Global LLC - LION New Media LLC Agency & Marketing Services AdSupply, Inc. - LP Digi ta le Agency Agency & Marketing Services Alter Way SAS - Mamadigi ta l S.r.l . Agency & Marketing Services Mashfrog S.P.A. - Marketplace Ignition Agency & Marketing Services WPP Group - Maud Agency & Marketing Services Accenture plc - MC2 Ltd. Agency & Marketing Services MCH Group AG - media .at GmbH Agency & Marketing Services Dentsu Aegis Network, Inc. - Switch Des ign Consultancy Agency & Marketing Services Pure Consultancy Limited - The Halo Group Agency & Marketing Services Did-i t.com - The Monkeys Pty. Ltd. Agency & Marketing Services Accenture plc - Thinking Juice Ltd. Agency & Marketing Services Sideshow Ltd. - Thirs ty Boy Agency & Marketing Services Zizzo Group Advertis ing and Publ ic Relations , Inc. - TrestleMedia Agency & Marketing Services CHIEF - Web Decis ions LLC Agency & Marketing Services Deloitte Consulting - AIM Consulting Group LLC Bus iness Services Addison Group - BCC Group Bus iness Services SNP Schneider-Neureither & Partner AG - Digi ta l Assurance Consulting Ltd. Bus iness Services F-Secure Oyj - Discovia .com Bus iness Services Lighthouse eDiscovery - Eccel la Corporation Bus iness Services NGDATA - Integrated Access Solutions Bus iness Services Avtex Solutions LLC - Jibe Consulting, Inc. Bus iness Services The Hackett Group, Inc. - Media Hive Bus iness Services Accenture plc - myMatrixx Bus iness Services Express Scripts , Inc. - OneCloud Consulting, Inc. Bus iness Services ePlus , Inc. - Orbita l Tra ining & Consulting Limited Bus iness Services International Insti tute for Learning, Inc. - Paradigm Technology Consulting LLC Bus iness Services ISS Solutions - Porta l Solutions LLC Bus iness Services WithumSmith+Brown, P.C. - Premier Knowledge Solutions , Inc. Bus iness Services Centriq Group LLC - RPM Associates , Inc. Bus iness Services Winbrook, Inc. - Strut Digi ta l Pty Ltd. Bus iness Services Deloitte SA - The Paciel lo Group LLP Bus iness Services Freedom Scienti fic, Inc. - ToMont Solutions , Inc. Bus iness Services KPMG LLP - TriCore Solutions Bus iness Services Rackspace Hosting, Inc. -
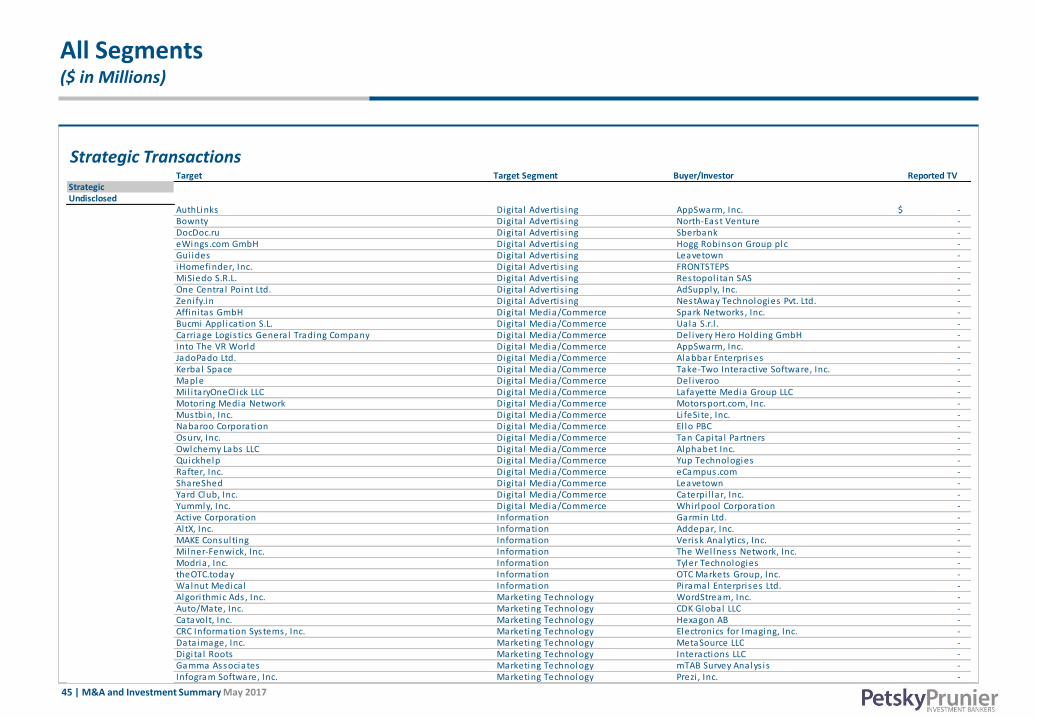
45 | M&A and Investment Summary May 2017
All Segments ($ in Millions)
Strategic Transactions Target Target Segment Buyer/Investor Reported TV
StrategicUndisclosed
AuthLinks Digi ta l Advertis ing AppSwarm, Inc. -$ Bownty Digi ta l Advertis ing North-East Venture - DocDoc.ru Digi ta l Advertis ing Sberbank - eWings .com GmbH Digi ta l Advertis ing Hogg Robinson Group plc - Gui ides Digi ta l Advertis ing Leavetown - iHomefinder, Inc. Digi ta l Advertis ing FRONTSTEPS - MiSiedo S.R.L. Digi ta l Advertis ing Restopol i tan SAS - One Centra l Point Ltd. Digi ta l Advertis ing AdSupply, Inc. - Zeni fy.in Digi ta l Advertis ing NestAway Technologies Pvt. Ltd. - Affini tas GmbH Digi ta l Media/Commerce Spark Networks , Inc. - Bucmi Appl ication S.L. Digi ta l Media/Commerce Uala S.r.l . - Carriage Logis tics General Trading Company Digi ta l Media/Commerce Del ivery Hero Holding GmbH - Into The VR World Digi ta l Media/Commerce AppSwarm, Inc. - JadoPado Ltd. Digi ta l Media/Commerce Alabbar Enterprises - Kerbal Space Digi ta l Media/Commerce Take-Two Interactive Software, Inc. - Maple Digi ta l Media/Commerce Del iveroo - Mi l i taryOneCl ick LLC Digi ta l Media/Commerce Lafayette Media Group LLC - Motoring Media Network Digi ta l Media/Commerce Motorsport.com, Inc. - Mustbin, Inc. Digi ta l Media/Commerce Li feSi te, Inc. - Nabaroo Corporation Digi ta l Media/Commerce El lo PBC - Osurv, Inc. Digi ta l Media/Commerce Tan Capita l Partners - Owlchemy Labs LLC Digi ta l Media/Commerce Alphabet Inc. - Quickhelp Digi ta l Media/Commerce Yup Technologies - Rafter, Inc. Digi ta l Media/Commerce eCampus.com - ShareShed Digi ta l Media/Commerce Leavetown - Yard Club, Inc. Digi ta l Media/Commerce Caterpi l lar, Inc. - Yummly, Inc. Digi ta l Media/Commerce Whirlpool Corporation - Active Corporation Information Garmin Ltd. - Al tX, Inc. Information Addepar, Inc. - MAKE Consulting Information Verisk Analytics , Inc. - Mi lner-Fenwick, Inc. Information The Wel lness Network, Inc. - Modria , Inc. Information Tyler Technologies - theOTC.today Information OTC Markets Group, Inc. - Walnut Medica l Information Piramal Enterprises Ltd. - Algori thmic Ads , Inc. Marketing Technology WordStream, Inc. - Auto/Mate, Inc. Marketing Technology CDK Global LLC - Catavolt, Inc. Marketing Technology Hexagon AB - CRC Information Systems, Inc. Marketing Technology Electronics for Imaging, Inc. - Dataimage, Inc. Marketing Technology MetaSource LLC - Digi ta l Roots Marketing Technology Interactions LLC - Gamma Associates Marketing Technology mTAB Survey Analys is - Infogram Software, Inc. Marketing Technology Prezi , Inc. -
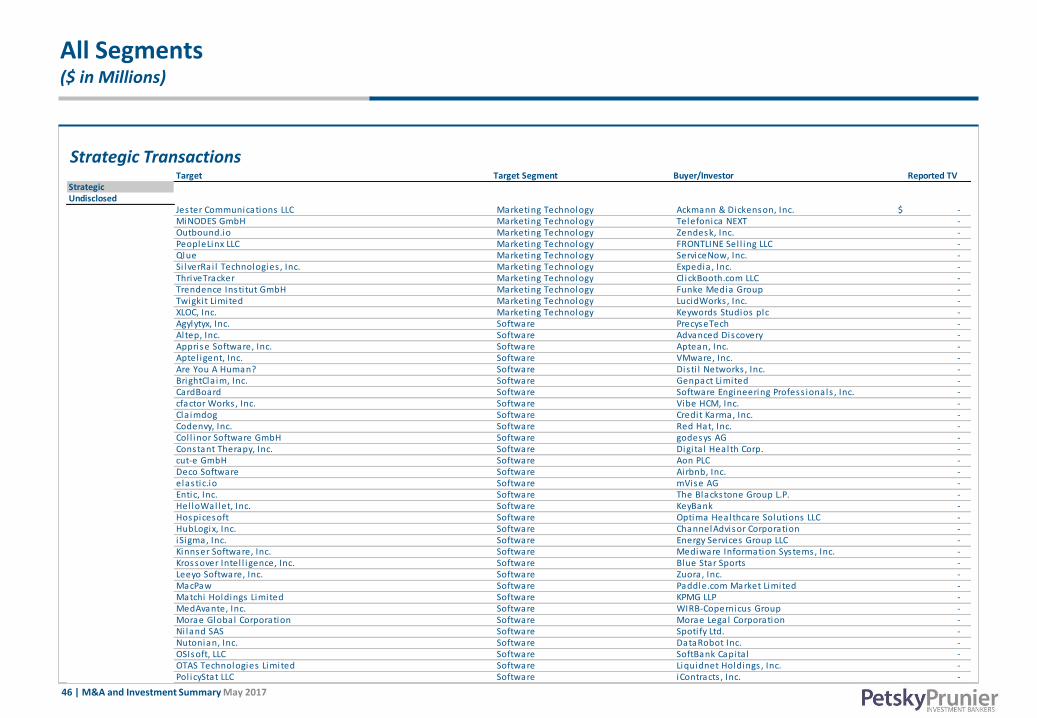
46 | M&A and Investment Summary May 2017
All Segments ($ in Millions)
Strategic Transactions Target Target Segment Buyer/Investor Reported TV
StrategicUndisclosed
Jester Communications LLC Marketing Technology Ackmann & Dickenson, Inc. -$ MiNODES GmbH Marketing Technology Telefonica NEXT - Outbound.io Marketing Technology Zendesk, Inc. - PeopleLinx LLC Marketing Technology FRONTLINE Sel l ing LLC - Qlue Marketing Technology ServiceNow, Inc. - Si lverRai l Technologies , Inc. Marketing Technology Expedia , Inc. - ThriveTracker Marketing Technology Cl ickBooth.com LLC - Trendence Insti tut GmbH Marketing Technology Funke Media Group - Twigki t Limited Marketing Technology LucidWorks , Inc. - XLOC, Inc. Marketing Technology Keywords Studios plc - Agylytyx, Inc. Software PrecyseTech - Al tep, Inc. Software Advanced Discovery - Apprise Software, Inc. Software Aptean, Inc. - Aptel igent, Inc. Software VMware, Inc. - Are You A Human? Software Disti l Networks , Inc. - BrightCla im, Inc. Software Genpact Limited - CardBoard Software Software Engineering Profess ionals , Inc. - cfactor Works , Inc. Software Vibe HCM, Inc. - Cla imdog Software Credit Karma, Inc. - Codenvy, Inc. Software Red Hat, Inc. - Col l inor Software GmbH Software godesys AG - Constant Therapy, Inc. Software Digi ta l Health Corp. - cut-e GmbH Software Aon PLC - Deco Software Software Airbnb, Inc. - elastic.io Software mVise AG - Entic, Inc. Software The Blackstone Group L.P. - Hel loWal let, Inc. Software KeyBank - Hospicesoft Software Optima Healthcare Solutions LLC - HubLogix, Inc. Software ChannelAdvisor Corporation - iSigma, Inc. Software Energy Services Group LLC - Kinnser Software, Inc. Software Mediware Information Systems, Inc. - Krossover Intel l igence, Inc. Software Blue Star Sports - Leeyo Software, Inc. Software Zuora, Inc. - MacPaw Software Paddle.com Market Limited - Matchi Holdings Limited Software KPMG LLP - MedAvante, Inc. Software WIRB-Copernicus Group - Morae Global Corporation Software Morae Legal Corporation - Ni land SAS Software Spoti fy Ltd. - Nutonian, Inc. Software DataRobot Inc. - OSIsoft, LLC Software SoftBank Capita l - OTAS Technologies Limited Software Liquidnet Holdings , Inc. - Pol icyStat LLC Software iContracts , Inc. -
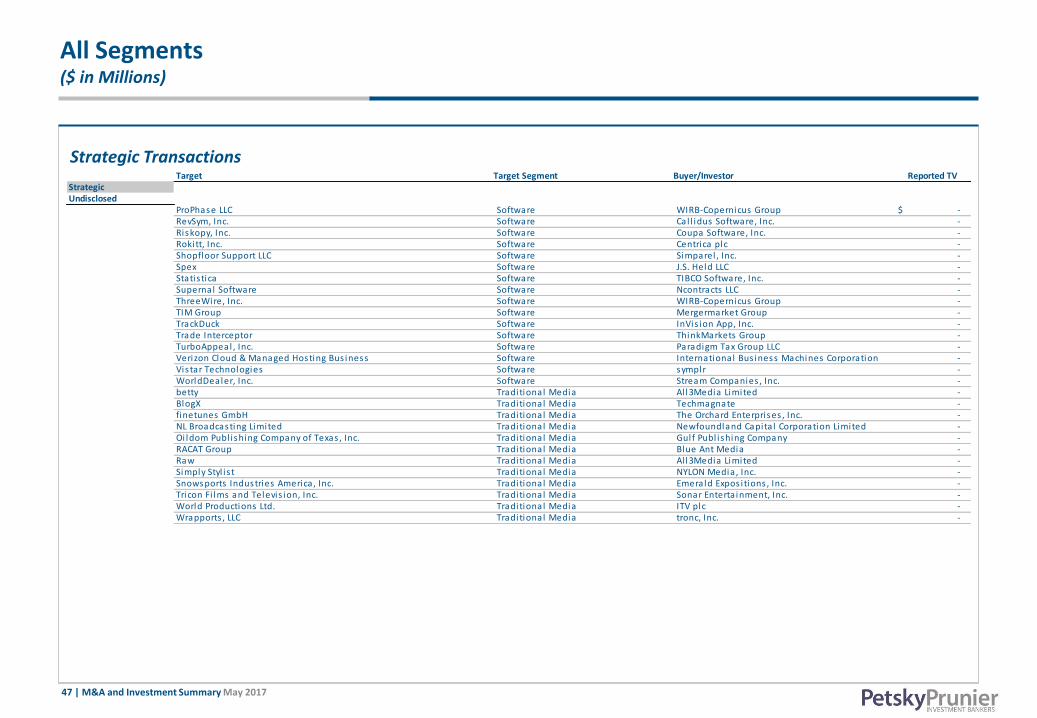
47 | M&A and Investment Summary May 2017
All Segments ($ in Millions)
Strategic Transactions Target Target Segment Buyer/Investor Reported TV
StrategicUndisclosed
ProPhase LLC Software WIRB-Copernicus Group -$ RevSym, Inc. Software Cal l idus Software, Inc. - Riskopy, Inc. Software Coupa Software, Inc. - Rokitt, Inc. Software Centrica plc - Shopfloor Support LLC Software Simparel , Inc. - Spex Software J.S. Held LLC - Statis tica Software TIBCO Software, Inc. - Supernal Software Software Ncontracts LLC - ThreeWire, Inc. Software WIRB-Copernicus Group - TIM Group Software Mergermarket Group - TrackDuck Software InVis ion App, Inc. - Trade Interceptor Software ThinkMarkets Group - TurboAppeal , Inc. Software Paradigm Tax Group LLC - Verizon Cloud & Managed Hosting Bus iness Software International Bus iness Machines Corporation - Vis tar Technologies Software symplr - WorldDealer, Inc. Software Stream Companies , Inc. - betty Traditional Media Al l3Media Limited - BlogX Traditional Media Techmagnate - finetunes GmbH Traditional Media The Orchard Enterprises , Inc. - NL Broadcasting Limited Traditional Media Newfoundland Capita l Corporation Limited - Oi ldom Publ ishing Company of Texas , Inc. Traditional Media Gulf Publ ishing Company - RACAT Group Traditional Media Blue Ant Media - Raw Traditional Media Al l3Media Limited - Simply Styl i s t Traditional Media NYLON Media, Inc. - Snowsports Industries America, Inc. Traditional Media Emerald Expos i tions , Inc. - Tricon Fi lms and Televis ion, Inc. Traditional Media Sonar Enterta inment, Inc. - World Productions Ltd. Traditional Media ITV plc - Wrapports , LLC Traditional Media tronc, Inc. -
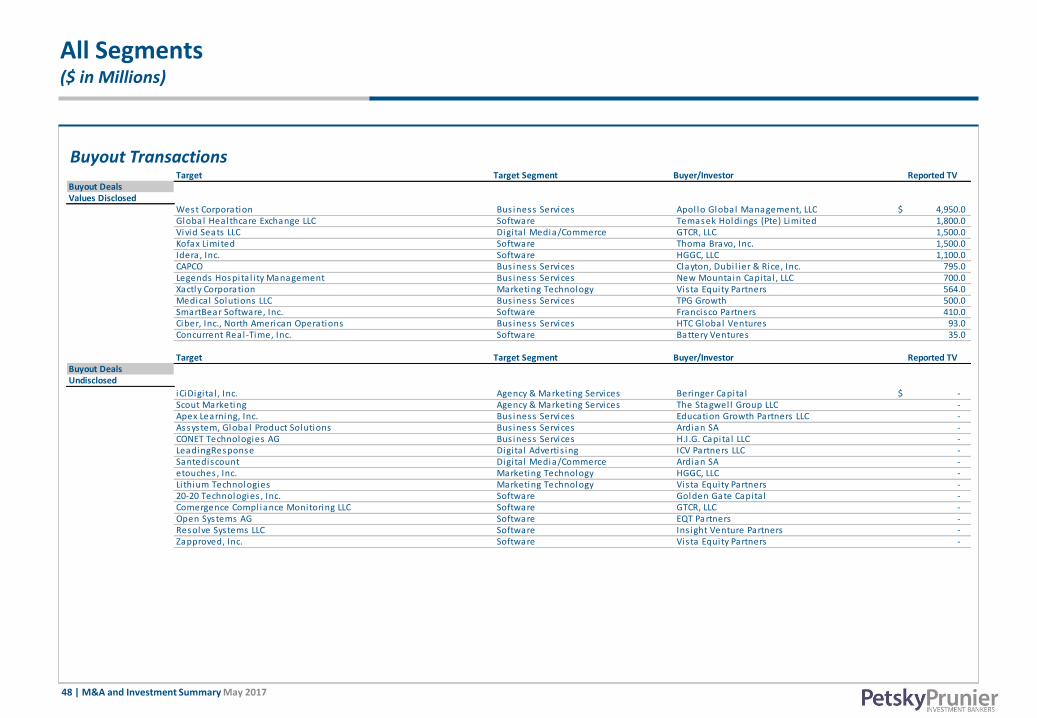
48 | M&A and Investment Summary May 2017
All Segments ($ in Millions)
Buyout Transactions
Target Target Segment Buyer/Investor Reported TV Buyout DealsValues Disclosed
West Corporation Bus iness Services Apol lo Global Management, LLC 4,950.0$ Global Healthcare Exchange LLC Software Temasek Holdings (Pte) Limited 1,800.0 Vivid Seats LLC Digi ta l Media/Commerce GTCR, LLC 1,500.0 Kofax Limited Software Thoma Bravo, Inc. 1,500.0 Idera, Inc. Software HGGC, LLC 1,100.0 CAPCO Bus iness Services Clayton, Dubi l ier & Rice, Inc. 795.0 Legends Hospita l i ty Management Bus iness Services New Mountain Capita l , LLC 700.0 Xactly Corporation Marketing Technology Vista Equity Partners 564.0 Medica l Solutions LLC Bus iness Services TPG Growth 500.0 SmartBear Software, Inc. Software Francisco Partners 410.0 Ciber, Inc., North American Operations Bus iness Services HTC Global Ventures 93.0 Concurrent Real -Time, Inc. Software Battery Ventures 35.0
Target Target Segment Buyer/Investor Reported TV Buyout DealsUndisclosed
iCiDigi ta l , Inc. Agency & Marketing Services Beringer Capita l -$ Scout Marketing Agency & Marketing Services The Stagwel l Group LLC - Apex Learning, Inc. Bus iness Services Education Growth Partners LLC - Assystem, Global Product Solutions Bus iness Services Ardian SA - CONET Technologies AG Bus iness Services H.I.G. Capita l LLC - LeadingResponse Digi ta l Advertis ing ICV Partners LLC - Santediscount Digi ta l Media/Commerce Ardian SA - etouches , Inc. Marketing Technology HGGC, LLC - Li thium Technologies Marketing Technology Vista Equity Partners - 20-20 Technologies , Inc. Software Golden Gate Capita l - Comergence Compl iance Monitoring LLC Software GTCR, LLC - Open Systems AG Software EQT Partners - Resolve Systems LLC Software Ins ight Venture Partners - Zapproved, Inc. Software Vista Equity Partners -
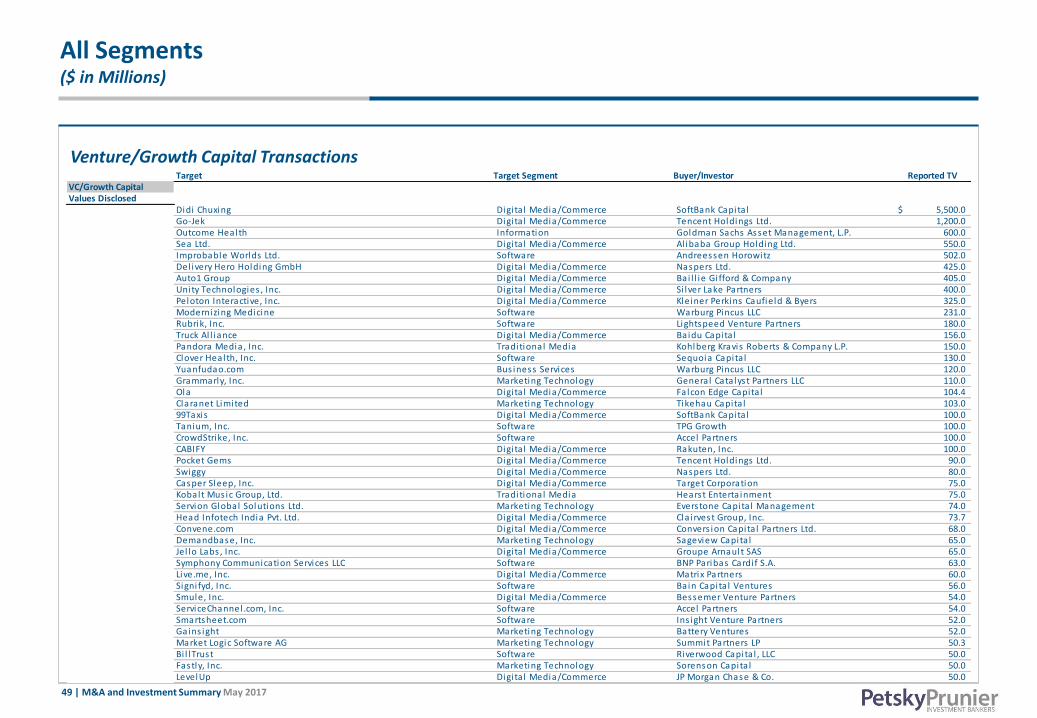
49 | M&A and Investment Summary May 2017
All Segments ($ in Millions)
Venture/Growth Capital Transactions Target Target Segment Buyer/Investor Reported TV VC/Growth CapitalValues Disclosed
Didi Chuxing Digi ta l Media/Commerce SoftBank Capita l 5,500.0$ Go-Jek Digi ta l Media/Commerce Tencent Holdings Ltd. 1,200.0 Outcome Health Information Goldman Sachs Asset Management, L.P. 600.0 Sea Ltd. Digi ta l Media/Commerce Al ibaba Group Holding Ltd. 550.0 Improbable Worlds Ltd. Software Andreessen Horowitz 502.0 Del ivery Hero Holding GmbH Digi ta l Media/Commerce Naspers Ltd. 425.0 Auto1 Group Digi ta l Media/Commerce Bai l l ie Gi fford & Company 405.0 Unity Technologies , Inc. Digi ta l Media/Commerce Si lver Lake Partners 400.0 Peloton Interactive, Inc. Digi ta l Media/Commerce Kleiner Perkins Caufield & Byers 325.0 Modernizing Medicine Software Warburg Pincus LLC 231.0 Rubrik, Inc. Software Lightspeed Venture Partners 180.0 Truck Al l iance Digi ta l Media/Commerce Baidu Capita l 156.0 Pandora Media, Inc. Traditional Media Kohlberg Kravis Roberts & Company L.P. 150.0 Clover Health, Inc. Software Sequoia Capita l 130.0 Yuanfudao.com Bus iness Services Warburg Pincus LLC 120.0 Grammarly, Inc. Marketing Technology General Catalyst Partners LLC 110.0 Ola Digi ta l Media/Commerce Falcon Edge Capita l 104.4 Claranet Limited Marketing Technology Tikehau Capita l 103.0 99Taxis Digi ta l Media/Commerce SoftBank Capita l 100.0 Tanium, Inc. Software TPG Growth 100.0 CrowdStrike, Inc. Software Accel Partners 100.0 CABIFY Digi ta l Media/Commerce Rakuten, Inc. 100.0 Pocket Gems Digi ta l Media/Commerce Tencent Holdings Ltd. 90.0 Swiggy Digi ta l Media/Commerce Naspers Ltd. 80.0 Casper Sleep, Inc. Digi ta l Media/Commerce Target Corporation 75.0 Kobalt Mus ic Group, Ltd. Traditional Media Hearst Enterta inment 75.0 Servion Global Solutions Ltd. Marketing Technology Everstone Capita l Management 74.0 Head Infotech India Pvt. Ltd. Digi ta l Media/Commerce Cla irvest Group, Inc. 73.7 Convene.com Digita l Media/Commerce Convers ion Capita l Partners Ltd. 68.0 Demandbase, Inc. Marketing Technology Sageview Capita l 65.0 Jel lo Labs , Inc. Digi ta l Media/Commerce Groupe Arnault SAS 65.0 Symphony Communication Services LLC Software BNP Paribas Cardi f S.A. 63.0 Live.me, Inc. Digi ta l Media/Commerce Matrix Partners 60.0 Signi fyd, Inc. Software Bain Capita l Ventures 56.0 Smule, Inc. Digi ta l Media/Commerce Bessemer Venture Partners 54.0 ServiceChannel .com, Inc. Software Accel Partners 54.0 Smartsheet.com Software Ins ight Venture Partners 52.0 Gains ight Marketing Technology Battery Ventures 52.0 Market Logic Software AG Marketing Technology Summit Partners LP 50.3 Bi l lTrust Software Riverwood Capita l , LLC 50.0 Fastly, Inc. Marketing Technology Sorenson Capita l 50.0 LevelUp Digi ta l Media/Commerce JP Morgan Chase & Co. 50.0
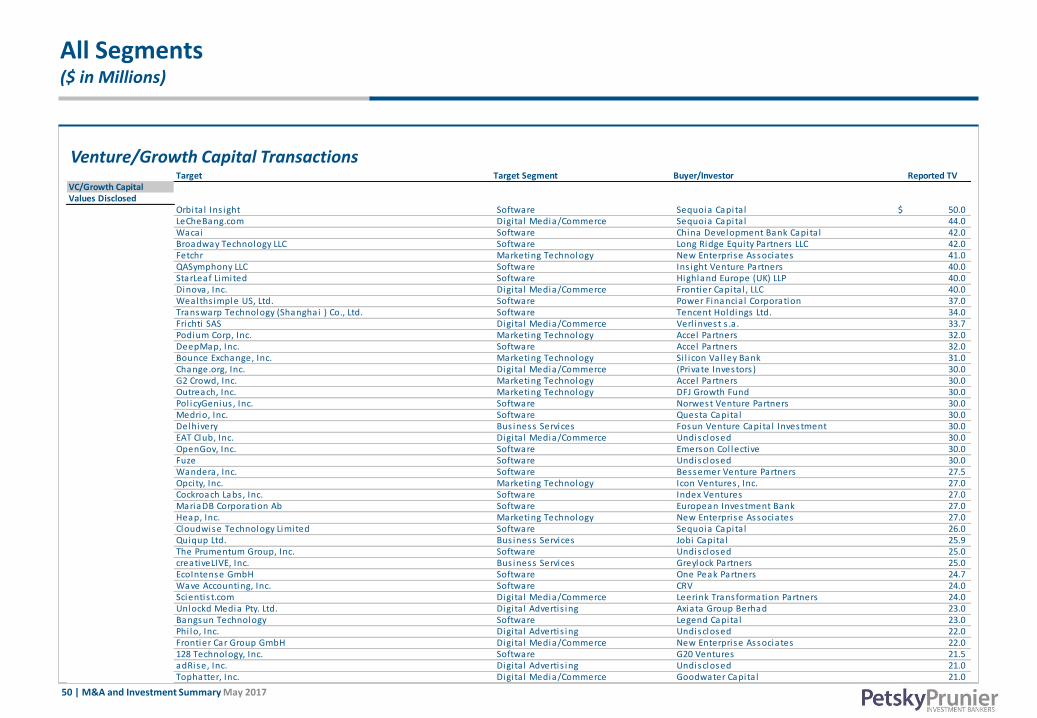
50 | M&A and Investment Summary May 2017
All Segments ($ in Millions)
Venture/Growth Capital Transactions Target Target Segment Buyer/Investor Reported TV VC/Growth CapitalValues Disclosed
Orbita l Ins ight Software Sequoia Capita l 50.0$ LeCheBang.com Digita l Media/Commerce Sequoia Capita l 44.0 Wacai Software China Development Bank Capita l 42.0 Broadway Technology LLC Software Long Ridge Equity Partners LLC 42.0 Fetchr Marketing Technology New Enterprise Associates 41.0 QASymphony LLC Software Ins ight Venture Partners 40.0 StarLeaf Limited Software Highland Europe (UK) LLP 40.0 Dinova, Inc. Digi ta l Media/Commerce Frontier Capita l , LLC 40.0 Wealths imple US, Ltd. Software Power Financia l Corporation 37.0 Transwarp Technology (Shanghai ) Co., Ltd. Software Tencent Holdings Ltd. 34.0 Frichti SAS Digi ta l Media/Commerce Verl invest s .a . 33.7 Podium Corp, Inc. Marketing Technology Accel Partners 32.0 DeepMap, Inc. Software Accel Partners 32.0 Bounce Exchange, Inc. Marketing Technology Si l icon Val ley Bank 31.0 Change.org, Inc. Digi ta l Media/Commerce (Private Investors ) 30.0 G2 Crowd, Inc. Marketing Technology Accel Partners 30.0 Outreach, Inc. Marketing Technology DFJ Growth Fund 30.0 Pol icyGenius , Inc. Software Norwest Venture Partners 30.0 Medrio, Inc. Software Questa Capita l 30.0 Delhivery Bus iness Services Fosun Venture Capita l Investment 30.0 EAT Club, Inc. Digi ta l Media/Commerce Undisclosed 30.0 OpenGov, Inc. Software Emerson Col lective 30.0 Fuze Software Undisclosed 30.0 Wandera, Inc. Software Bessemer Venture Partners 27.5 Opcity, Inc. Marketing Technology Icon Ventures , Inc. 27.0 Cockroach Labs , Inc. Software Index Ventures 27.0 MariaDB Corporation Ab Software European Investment Bank 27.0 Heap, Inc. Marketing Technology New Enterprise Associates 27.0 Cloudwise Technology Limited Software Sequoia Capita l 26.0 Quiqup Ltd. Bus iness Services Jobi Capita l 25.9 The Prumentum Group, Inc. Software Undisclosed 25.0 creativeLIVE, Inc. Bus iness Services Greylock Partners 25.0 EcoIntense GmbH Software One Peak Partners 24.7 Wave Accounting, Inc. Software CRV 24.0 Scientis t.com Digita l Media/Commerce Leerink Transformation Partners 24.0 Unlockd Media Pty. Ltd. Digi ta l Advertis ing Axiata Group Berhad 23.0 Bangsun Technology Software Legend Capita l 23.0 Phi lo, Inc. Digi ta l Advertis ing Undisclosed 22.0 Frontier Car Group GmbH Digi ta l Media/Commerce New Enterprise Associates 22.0 128 Technology, Inc. Software G20 Ventures 21.5 adRise, Inc. Digi ta l Advertis ing Undisclosed 21.0 Tophatter, Inc. Digi ta l Media/Commerce Goodwater Capita l 21.0

51 | M&A and Investment Summary May 2017
All Segments ($ in Millions)
Venture/Growth Capital Transactions Target Target Segment Buyer/Investor Reported TV VC/Growth CapitalValues Disclosed
Cornershop Digi ta l Media/Commerce Accel Partners 21.0$ StreamSets , Inc. Software Accel Partners 20.0 Lob.com, Inc. Software Firs t Round Capita l 20.0 GameMine, Inc. Digi ta l Media/Commerce Pal isades Ventures Management 20.0 CounterTack, Inc. Software Singtel Innov8 Ventures Pte. Ltd. 20.0 Away Digi ta l Media/Commerce Comcast Ventures 20.0 Capsule Corporation Digi ta l Media/Commerce Thrive Capita l 20.0 Verse Technologies , Inc. Digi ta l Media/Commerce Spark Capita l 20.0 Tubi TV Digi ta l Media/Commerce Jump Capita l 20.0 YOPA Property Limited Digi ta l Advertis ing Dai ly Mai l 19.5 Cheddar, Inc. Digi ta l Media/Commerce Lightspeed Venture Partners 19.0 CornerJob Digi ta l Advertis ing Northzone 19.0 KeepTruckin, Inc. Digi ta l Media/Commerce Index Ventures 18.0 Snapdeal .com Digita l Media/Commerce Nexus Venture Partners 17.0 AB Tasty Software Korelya Capita l 17.0 Tiqets Digi ta l Media/Commerce HPE Growth Capita l 17.0 Miva, Inc. Marketing Technology Bison Capita l Asset Management, LLC 17.0 Lighthouse AI, Inc. Software Fel icis Ventures 17.0 Fornova Ltd. Marketing Technology Deutsche Telekom AG 17.0 DocPlanner.com Marketing Technology Enern Investments 16.8 JobTeaser SARL Software Alven Capita l Partners 16.7 Mainframe2, Inc. Software Bain Capita l Ventures 16.0 One, Inc. Software Centana Growth Partners 15.5 Satispay Limited Software Iccrea Banca 15.3 PandaDoc Marketing Technology Rembrandt Venture Partners 15.0 Bri t + Co. Digi ta l Media/Commerce Verizon Ventures 15.0 Ful lStory Marketing Technology Sales force Ventures 15.0 MyPizza Technologies , Inc. Digi ta l Media/Commerce GGV Capita l 15.0 FogHorn Systems, Inc. Software Del l Technologies Capita l 15.0 Karamba Securi ty Software Fontinal is Partners , LLC 15.0 Twiggle Marketing Technology MizMaa Ventures 15.0 Signal Sciences Corporation Software Index Ventures 15.0 Vera Securi ty, Inc. Software Battery Ventures 15.0 Speramus, Inc. Marketing Technology Greylock Partners 15.0 MPP Global Solutions Ltd. Marketing Technology Albion Ventures LLP 15.0 Pythian Bus iness Services Bus iness Development Bank of Canada 15.0 Readly AB Digi ta l Media/Commerce Zouk Capita l 14.5 Aporeto, Inc. Software Norwest Venture Partners 14.5 Move24 Group GmbH Digi ta l Media/Commerce Holtzbrinck Ventures 14.2 Ruigu Shop Digi ta l Media/Commerce Chengwei Capita l 14.0 Project Affini ty, Inc. Marketing Technology Great Oaks Venture Capita l 13.5 SimpleReach Marketing Technology Spring Mountain Capita l , LP 13.3
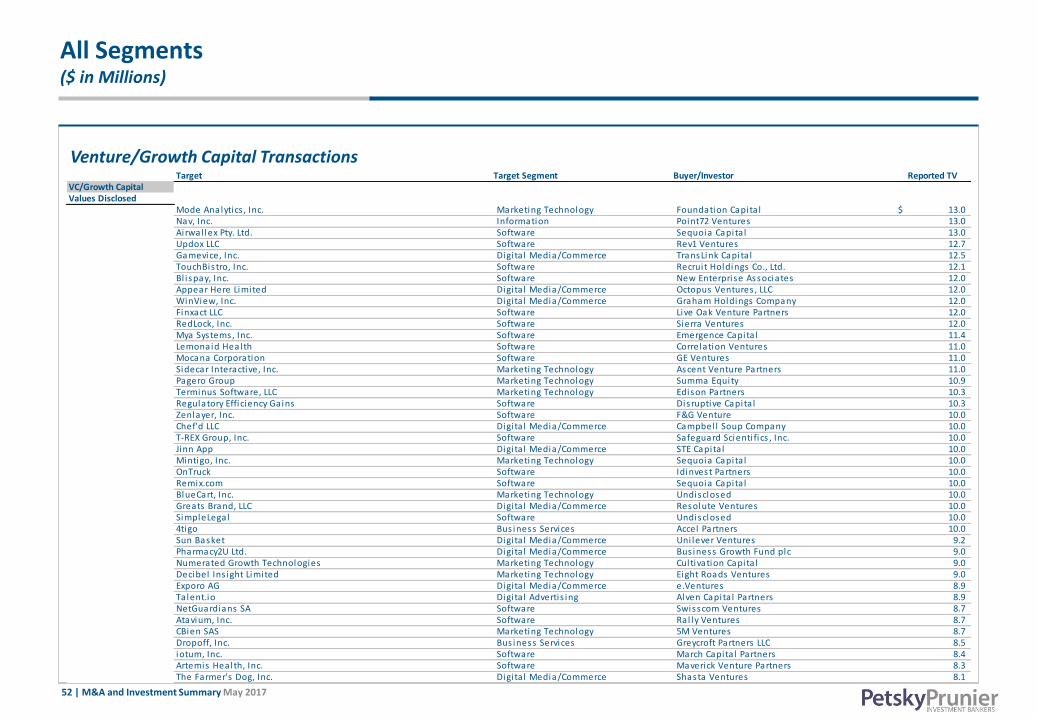
52 | M&A and Investment Summary May 2017
All Segments ($ in Millions)
Venture/Growth Capital Transactions Target Target Segment Buyer/Investor Reported TV VC/Growth CapitalValues Disclosed
Mode Analytics , Inc. Marketing Technology Foundation Capita l 13.0$ Nav, Inc. Information Point72 Ventures 13.0 Ai rwal lex Pty. Ltd. Software Sequoia Capita l 13.0 Updox LLC Software Rev1 Ventures 12.7 Gamevice, Inc. Digi ta l Media/Commerce TransLink Capita l 12.5 TouchBistro, Inc. Software Recruit Holdings Co., Ltd. 12.1 Bl i spay, Inc. Software New Enterprise Associates 12.0 Appear Here Limited Digi ta l Media/Commerce Octopus Ventures , LLC 12.0 WinView, Inc. Digi ta l Media/Commerce Graham Holdings Company 12.0 Finxact LLC Software Live Oak Venture Partners 12.0 RedLock, Inc. Software Sierra Ventures 12.0 Mya Systems, Inc. Software Emergence Capita l 11.4 Lemonaid Health Software Correlation Ventures 11.0 Mocana Corporation Software GE Ventures 11.0 Sidecar Interactive, Inc. Marketing Technology Ascent Venture Partners 11.0 Pagero Group Marketing Technology Summa Equity 10.9 Terminus Software, LLC Marketing Technology Edison Partners 10.3 Regulatory Efficiency Gains Software Disruptive Capita l 10.3 Zenlayer, Inc. Software F&G Venture 10.0 Chef'd LLC Digi ta l Media/Commerce Campbel l Soup Company 10.0 T-REX Group, Inc. Software Safeguard Scienti fics , Inc. 10.0 Jinn App Digi ta l Media/Commerce STE Capita l 10.0 Mintigo, Inc. Marketing Technology Sequoia Capita l 10.0 OnTruck Software Idinvest Partners 10.0 Remix.com Software Sequoia Capita l 10.0 BlueCart, Inc. Marketing Technology Undisclosed 10.0 Greats Brand, LLC Digi ta l Media/Commerce Resolute Ventures 10.0 SimpleLegal Software Undisclosed 10.0 4tigo Bus iness Services Accel Partners 10.0 Sun Basket Digi ta l Media/Commerce Uni lever Ventures 9.2 Pharmacy2U Ltd. Digi ta l Media/Commerce Bus iness Growth Fund plc 9.0 Numerated Growth Technologies Marketing Technology Cultivation Capita l 9.0 Decibel Ins ight Limited Marketing Technology Eight Roads Ventures 9.0 Exporo AG Digi ta l Media/Commerce e.Ventures 8.9 Ta lent.io Digi ta l Advertis ing Alven Capita l Partners 8.9 NetGuardians SA Software Swisscom Ventures 8.7 Atavium, Inc. Software Ral ly Ventures 8.7 CBien SAS Marketing Technology 5M Ventures 8.7 Dropoff, Inc. Bus iness Services Greycroft Partners LLC 8.5 iotum, Inc. Software March Capita l Partners 8.4 Artemis Health, Inc. Software Maverick Venture Partners 8.3 The Farmer's Dog, Inc. Digi ta l Media/Commerce Shasta Ventures 8.1
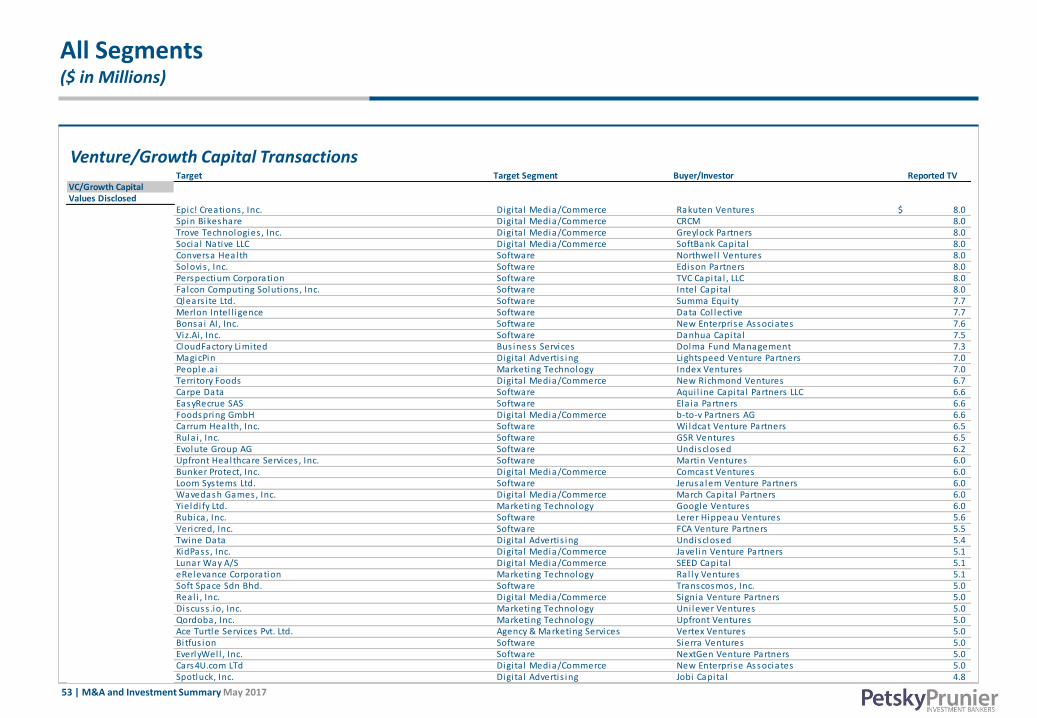
53 | M&A and Investment Summary May 2017
All Segments ($ in Millions)
Venture/Growth Capital Transactions Target Target Segment Buyer/Investor Reported TV VC/Growth CapitalValues Disclosed
Epic! Creations , Inc. Digi ta l Media/Commerce Rakuten Ventures 8.0$ Spin Bikeshare Digi ta l Media/Commerce CRCM 8.0 Trove Technologies , Inc. Digi ta l Media/Commerce Greylock Partners 8.0 Socia l Native LLC Digi ta l Media/Commerce SoftBank Capita l 8.0 Conversa Health Software Northwel l Ventures 8.0 Solovis , Inc. Software Edison Partners 8.0 Perspectium Corporation Software TVC Capita l , LLC 8.0 Fa lcon Computing Solutions , Inc. Software Intel Capita l 8.0 Qlears i te Ltd. Software Summa Equity 7.7 Merlon Intel l igence Software Data Col lective 7.7 Bonsai AI, Inc. Software New Enterprise Associates 7.6 Viz.Ai , Inc. Software Danhua Capita l 7.5 CloudFactory Limited Bus iness Services Dolma Fund Management 7.3 MagicPin Digi ta l Advertis ing Lightspeed Venture Partners 7.0 People.a i Marketing Technology Index Ventures 7.0 Terri tory Foods Digi ta l Media/Commerce New Richmond Ventures 6.7 Carpe Data Software Aqui l ine Capita l Partners LLC 6.6 EasyRecrue SAS Software Ela ia Partners 6.6 Foodspring GmbH Digi ta l Media/Commerce b-to-v Partners AG 6.6 Carrum Health, Inc. Software Wildcat Venture Partners 6.5 Rula i , Inc. Software GSR Ventures 6.5 Evolute Group AG Software Undisclosed 6.2 Upfront Healthcare Services , Inc. Software Martin Ventures 6.0 Bunker Protect, Inc. Digi ta l Media/Commerce Comcast Ventures 6.0 Loom Systems Ltd. Software Jerusalem Venture Partners 6.0 Wavedash Games, Inc. Digi ta l Media/Commerce March Capita l Partners 6.0 Yieldi fy Ltd. Marketing Technology Google Ventures 6.0 Rubica, Inc. Software Lerer Hippeau Ventures 5.6 Vericred, Inc. Software FCA Venture Partners 5.5 Twine Data Digi ta l Advertis ing Undisclosed 5.4 KidPass , Inc. Digi ta l Media/Commerce Javel in Venture Partners 5.1 Lunar Way A/S Digi ta l Media/Commerce SEED Capita l 5.1 eRelevance Corporation Marketing Technology Ral ly Ventures 5.1 Soft Space Sdn Bhd. Software Transcosmos, Inc. 5.0 Real i , Inc. Digi ta l Media/Commerce Signia Venture Partners 5.0 Discuss .io, Inc. Marketing Technology Uni lever Ventures 5.0 Qordoba, Inc. Marketing Technology Upfront Ventures 5.0 Ace Turtle Services Pvt. Ltd. Agency & Marketing Services Vertex Ventures 5.0 Bi tfus ion Software Sierra Ventures 5.0 EverlyWel l , Inc. Software NextGen Venture Partners 5.0 Cars4U.com LTd Digi ta l Media/Commerce New Enterprise Associates 5.0 Spotluck, Inc. Digi ta l Advertis ing Jobi Capita l 4.8

54 | M&A and Investment Summary May 2017
All Segments ($ in Millions)
Venture/Growth Capital Transactions Target Target Segment Buyer/Investor Reported TV VC/Growth CapitalValues Disclosed
GrandCanals , Inc. Bus iness Services Cloud Apps Capita l Partners 4.8$ Quitoque SA Digi ta l Media/Commerce 360 Capita l Partners 4.4 Iconixx Software Corporation Software Bal last Point Ventures 4.2 Spruce Holdings , Inc. Software Bessemer Venture Partners 4.0 Long Game Savings , Inc. Digi ta l Media/Commerce Col laborative Fund 4.0 Takumi Interactive Marketing Technology (Private Investors ) 4.0 AppOnboard, Inc. Software 500 Startups 4.0 Revolution Prep Bus iness Services Kennet Partners 4.0 PreparedHealth, Inc. Software Chicago Ventures 4.0 Inked Brands Marketing Technology BIP Capita l 4.0 OnePulse Marketing Technology Beacon Capita l 3.9 Dor Technologies , Inc. Marketing Technology Vertex Ventures 3.8 Concord Worldwide, Inc. Marketing Technology Alven Capita l Partners 3.7 GiXo Ltd. Digi ta l Media/Commerce Greylock Partners 3.7 Cl ippings Limited Marketing Technology C4 Ventures 3.6 Inflowz Ltd. Marketing Technology Gl i lot Capita l Partners 3.5 Nexla , Inc. Software Blumberg Capita l 3.5 AKUA LLC Software Cross l ink Capita l 3.5 Agolo Marketing Technology CRV 3.5 Acast AB Digi ta l Media/Commerce MOOR 3.4 OpenInvest Software Andreessen Horowitz 3.3 Intel ledox Pty Ltd. Software El lerston Ventures 3.0 Mavin, Inc. Marketing Technology Mousse Partners 3.0 Guesty, Inc. Marketing Technology Magma Venture Partners 3.0 Morty, Inc. Digi ta l Media/Commerce Thrive Capita l 3.0 Adext Corporation Marketing Technology Credito Real 3.0 MortgageGym Limited Software (Private Investors ) 2.6 Simplaex GmbH Marketing Technology Target Partners 2.6 Hadean Supercomputing Ltd. Software White Cloud Capita l 2.6 Embrace.io Software Eniac Ventures 2.5 Shipamax Ltd. Software AME Cloud Ventures 2.5 Codeta Digi ta l Media/Commerce Trention AB 2.5 Simple Habit, Inc. Digi ta l Media/Commerce New Enterprise Associates 2.5 Catal ia Health, Inc. Software Khos la Ventures 2.5 Freska Finland Oy Digi ta l Media/Commerce Spintop Ventures 2.2 CrowdJustice Digi ta l Media/Commerce Bessemer Venture Partners 2.0 Rentulations , Inc. Marketing Technology Cultivation Capita l 2.0 MoBerries GmbH Software High-Tech Gründerfonds 2.0 Axoni Software Citi Ventures 2.0 Polyverse Corporation Software Undisclosed 2.0 Paragon One Insta l lers , Inc. Bus iness Services Y Combinator 1.9 Replex GmbH Software High-Tech Gründerfonds 1.6
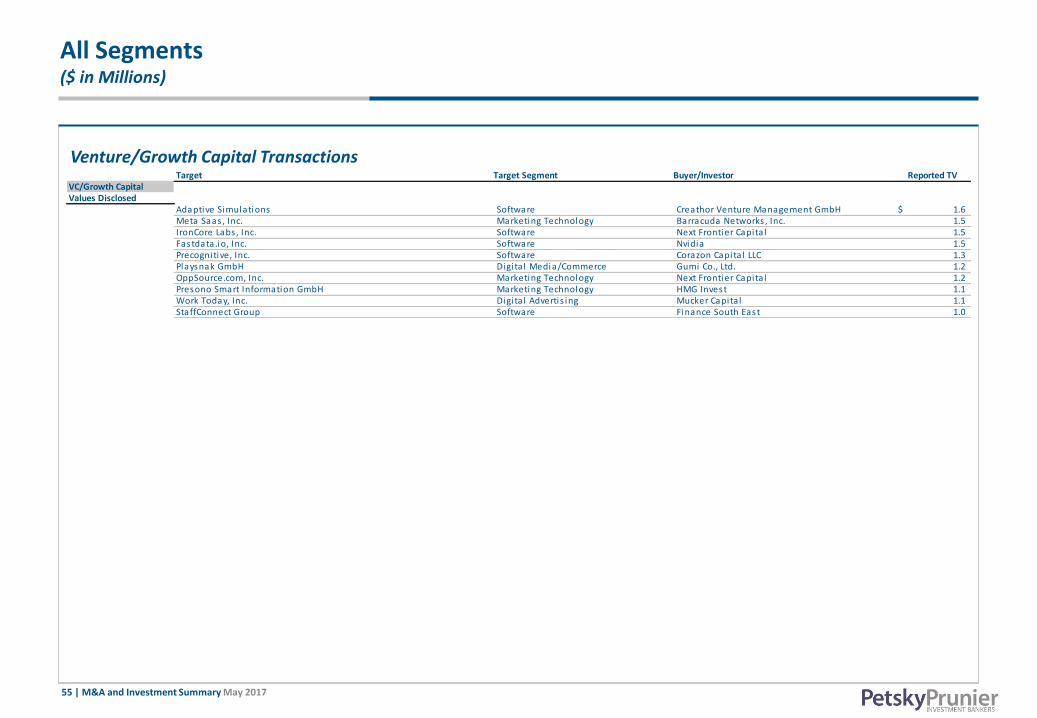
55 | M&A and Investment Summary May 2017
All Segments ($ in Millions)
Venture/Growth Capital Transactions Target Target Segment Buyer/Investor Reported TV VC/Growth CapitalValues Disclosed
Adaptive Simulations Software Creathor Venture Management GmbH 1.6$ Meta Saas , Inc. Marketing Technology Barracuda Networks , Inc. 1.5 IronCore Labs , Inc. Software Next Frontier Capita l 1.5 Fastdata.io, Inc. Software Nvidia 1.5 Precognitive, Inc. Software Corazon Capita l LLC 1.3 Playsnak GmbH Digita l Media/Commerce Gumi Co., Ltd. 1.2 OppSource.com, Inc. Marketing Technology Next Frontier Capita l 1.2 Presono Smart Information GmbH Marketing Technology HMG Invest 1.1 Work Today, Inc. Digi ta l Advertis ing Mucker Capita l 1.1 StaffConnect Group Software Finance South East 1.0
56 | M&A and Investment Summary May 2017
Petsky Prunier: Maximizing Shareholder Value
M&A Advisory and Sell-Side Representation
Privately-Owned Companies
Entrepreneur-Led Businesses
Private Equity Portfolio Companies
VC-Backed Companies
Corporate Divestitures
Selected Buy-Side Engagements
Capital Raising and Private Placements
Advertising & Marketing
eCommerce
Digital Media
Technology
Information
Business Services
Healthcare Services
Business Current Situation Assessment and
Profit Improvement Planning
Opportunity Mapping: Strategic Planning & Development
Competitive Landscape Analysis
M&A Transaction Due Diligence Support
Buy-Side Targeting Criteria & Integration Strategy
Custom Market Research
Publishing, Speaking, and Thought Leadership
Top-ranked, global investment bank dedicated to digital advertising and marketing, eCommerce, digital media, technology, information,
business services, and healthcare services industries
Extensive sell-side M&A and capital raise expertise, with a transaction closing rate unmatched at our level of deal volume
Founded in 1999
More than 50 focused professionals; growth of 40% since 2011
New York, Las Vegas, Chicago, Boston, Charlotte
Deep relationships across a broad spectrum of strategic buyers, as well as private equity, growth equity, and VC groups and lenders
Strategic consulting firm Winterberry Group – one of the largest industry-specific advisors providing strategic and transactional services
Global reach enhanced through our partnerships in China and India
Securities transactions are processed through Petsky Prunier Securities LLC, a member of FINRA and an affiliated entity
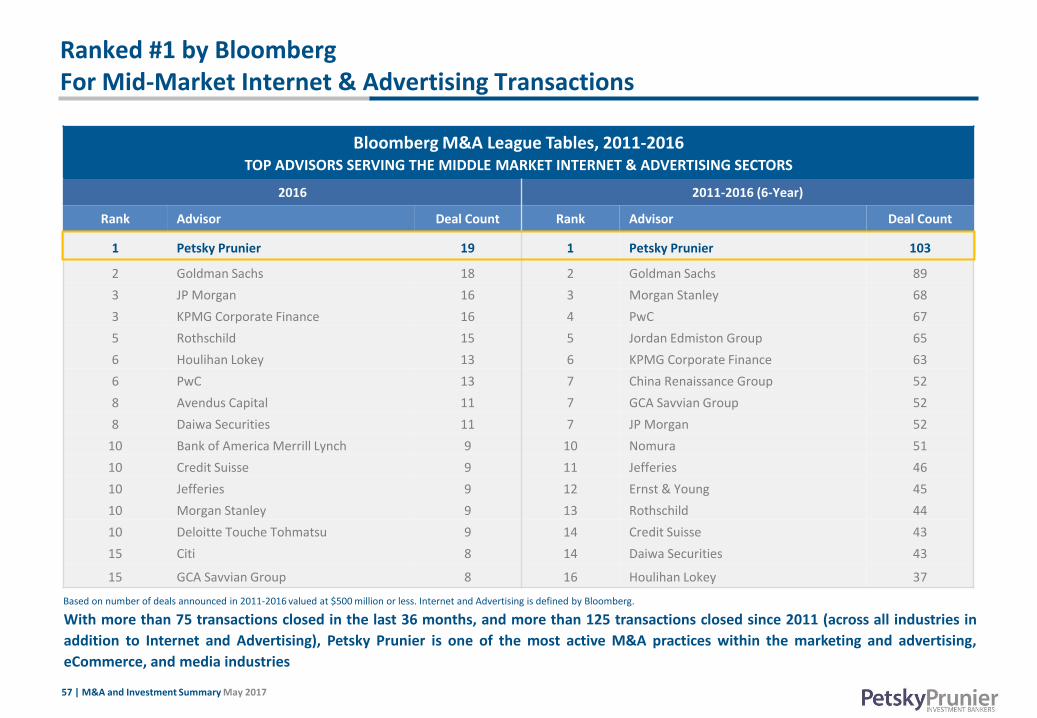
57 | M&A and Investment Summary May 2017
Ranked #1 by Bloomberg For Mid-Market Internet & Advertising Transactions
Bloomberg M&A League Tables, 2011-2016
TOP ADVISORS SERVING THE MIDDLE MARKET INTERNET & ADVERTISING SECTORS
2016 2011-2016 (6-Year)
Rank Advisor Deal Count Rank Advisor Deal Count
1 Petsky Prunier 19 1 Petsky Prunier 103
2 Goldman Sachs 18 2 Goldman Sachs 89
3 JP Morgan 16 3 Morgan Stanley 68
3 KPMG Corporate Finance 16 4 PwC 67
5 Rothschild 15 5 Jordan Edmiston Group 65
6 Houlihan Lokey 13 6 KPMG Corporate Finance 63
6 PwC 13 7 China Renaissance Group 52
8 Avendus Capital 11 7 GCA Savvian Group 52
8 Daiwa Securities 11 7 JP Morgan 52
10 Bank of America Merrill Lynch 9 10 Nomura 51
10 Credit Suisse 9 11 Jefferies 46
10 Jefferies 9 12 Ernst & Young 45
10 Morgan Stanley 9 13 Rothschild 44
10 Deloitte Touche Tohmatsu 9 14 Credit Suisse 43
15 Citi 8 14 Daiwa Securities 43
15 GCA Savvian Group 8 16 Houlihan Lokey 37
Based on number of deals announced in 2011‐2016 valued at $500 million or less. Internet and Advertising is defined by Bloomberg.
With more than 75 transactions closed in the last 36 months, and more than 125 transactions closed since 2011 (across all industries in
addition to Internet and Advertising), Petsky Prunier is one of the most active M&A practices within the marketing and advertising,
eCommerce, and media industries
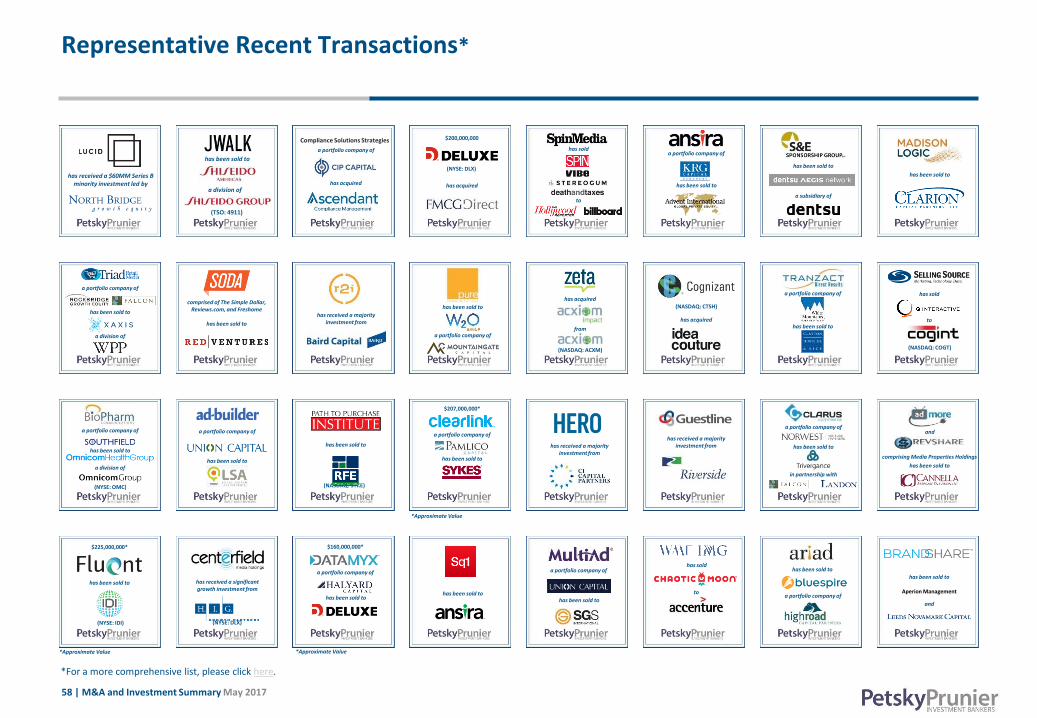
58 | M&A and Investment Summary May 2017
Representative Recent Transactions*
*For a more comprehensive list, please click here.
(NYSE: DLX) (NYSE: ACN)
(NASDAQ: SYKE)
*Approximate Value
*Approximate Value
$225,000,000*
(NYSE: IDI)
has been sold to has received a significant growth investment from
$160,000,000*
has been sold to
a portfolio company of
has been sold to
a portfolio company of
has been sold to
*Approximate Value
a portfolio company of
has been sold to
a division of
a portfolio company of
has been sold to
has been sold to
$207,000,000*
has been sold to
a portfolio company of
has received a majority investment from
has received a majority investment from has been sold to
a portfolio company of
in partnership with
(NYSE: OMC)
and
comprising Media Properties Holdings
has been sold to
a portfolio company of
has been sold to has acquired
(NASDAQ: CTSH) has acquired
(NASDAQ: ACXM)
from
Aperion Management
has been sold to
and
has sold
to
has been sold to
a portfolio company of
has received a majority investment from
a portfolio company of
has been sold to
has been sold to
comprised of The Simple Dollar, Reviews.com, and Freshome
a portfolio company of
has been sold to
a division of
has been sold to
a portfolio company of
has been sold to
has been sold to
a subsidiary of
(NASDAQ: COGT)
has sold
to
to
has sold
has acquired
$200,000,000
(NYSE: DLX)
has acquired
a portfolio company of
Compliance Solutions Strategies
has been sold to
a division of
(TSO: 4911)
has received a $60MM Series B minority investment led by