Embed Size (px)
Citation preview

January Jobs Report: Economy Added 49,000 Payrolls As Unemployment Rate Dropped To 6.3%—The U.S. economy resumed adding back more jobs than it lost in January, as easing stay-in-place restrictions and fiscal stimulus measures out of Washington alleviated some of the pressure on the labor market. However, the number of jobs regained fell short of expectations.
• Non-farm payrolls: +49,000 vs. +105,000 expected and a revised -227,000 in December
• Unemployment rate: 6.3% vs. 6.7% expected and 6.7% in December
• Average hourly earnings, month-over-month: 0.2% vs. 0.3% expected and a revised 1.0% in December
• Average hourly earnings, year-over-year: 5.4% vs. 5.0% expected, 5.1% in December
Other measures in the December jobs report had hinted at a tentative firming in labor market conditions. The number of so-called permanent job losers decreased by 348,000 to 3.4 million at the end of last year, albeit while still holding 2.3 million higher than from February 2019.
Full Story Source: YahooFinance, 02.05.2021
U.S. Industrial Production Slightly Below Pre-Pandemic Levels—According to the Federal Reserve, industrial production in the U.S. rose 1.6% in December, with gains of 0.9% for manufacturing, 1.6% for mining, and 6.2% for utilities. Total industrial production in December was 3.6% lower than it was in December 2019 and 3.3% below its pre-COVID-19 pandemic February reading. Click here to read the full report.
The Federal Reserve Bank of Philadelphia reported that the manufacturing sector strengthened in its region in January as indexes for current shipments and new orders moved higher. Additionally, the indexes for unfilled orders and delivery times changed from positive to negative readings this month, suggesting decreased unfilled orders and shorter delivery times. Click here to read the full report. Meanwhile, the Federal Reserve Bank of New York said manufacturing activity in its region was little changed this month. New orders and shipments edged higher. Unfilled orders continued to move lower, delivery times continued to lengthen somewhat, and employment levels increased modestly. Click here to read the New York report.
The U.S. labor market is softening. According to the U.S. Department of Labor, during the week that ended January 9, 965,000 individuals filed for federal unemployment benefits for the first time, an increase of 181,000 from the previous week’s level. The four-week moving average of first-time claims also rose. The number of individuals who continued to receive benefits increased as well, to 5.271 million during week that ended January 2 from less than 5.1 million the week before. Some good news: the four-week rolling average of continuing claims declined.
Statistics Canada reported week of February 15 that the country’s energy sector declined by 3% in the third quarter after posting losses in the previous two quarters as well.
In other economic news: U.S. import prices rose 0.9% in December while export prices increased 1.1%; the U.S. Consumer Price Index increased 0.4% from November 2020 to December 2020 and 1.4% from December 2019 to December 2020; and real average hourly earnings for all U.S. employees increased 0.4% from November to December. Source: MSCI, 01.18.2021
U.S. economic growth will recover “rapidly” and the labor market will return to full strength quicker than expected thanks to the vaccine rollout and a barrage of legislation enacted in 2020, according to a government forecast published February 1. Gross domestic product, or GDP, is expected to return to its pre-pandemic size by mid-2021 and the labor force is forecast to rebound to its pre-pandemic level in 2022, the nonpartisan Congressional Budget Office said. Importantly, the CBO said its rosier projections do not assume any new stimulus, including President Joe Biden’s $1.9 trillion plan.
Here’s what the CBO sees for the U.S. economy:
• Real GDP to grow 3.7% in 2021
• GDP growth to average 2.6% over the next five years
• The unemployment rate to fall to 5.3% in 2021, and further to 4% between 2024 and 2025
• Inflation to rise to 2% after 2023
• The Federal Reserve to start hiking the federal funds rate in mid-2024
• Upgraded economic outlook through 2025
These projections are a stronger outlook than the budget office’s prior forecast from summer 2020, when the CBO said it expected the coronavirus to sap about $7.9 trillion of economic activity over the next decade-plus.
The CBO said it upgraded its estimates “because the downturn was not as severe as expected and because the first stage of the recovery took place sooner and was stronger than expected.” CBO staff added that businesses proved more able to adapt to government-imposed restrictions, but that certain industries—such as hospitality and food services—are still struggling. Full Story Source: CNBC, 02.01.2021
CBO Sees Rapid Growth Recovery, Labor Force Returning To Pre-Pandemic Level By 2022
U . S . E C O N O M I C N E W S
Economic News
Key Economic Indicators
Industry Articles
Trade News
onealsteel.com
February 2021
Monthly Market Intelligence for Customers of O’Neal Steel

0.2 percentage point lower than the seasonally adjusted December reading of 51%. The Prices Index registered 82.1%, up 4.5 percentage points compared to the December reading of 77.6%. The New Export Orders Index registered 54.9%, a decrease of 2.6 percentage points compared to the December reading of 57.5%. The Imports Index registered 56.8%, a 2.2 percentage point increase from the December reading of 54.6%.
Of the 18 manufacturing industries, 16 reported growth in January, in the following order: Electrical Equipment, Appliances & Components; Machinery; Primary Metals; Chemical Products; Fabricated Metal Products; Plastics & Rubber Products; Transportation Equipment; Apparel, Leather & Allied Products; Paper Products; Wood Products; Food, Beverage & Tobacco Products; Nonmetallic Mineral Products; Furniture & Related Products; Miscellaneous Manufacturing; Textile Mills; and Computer & Electronic Products. The two industries reporting contraction in January are: Printing & Related Support Activities; and Petroleum & Coal Products. Source: Institute for Supply Management, 02.01.2021
In the week ending on January 30, 2021, domestic raw steel production was 1,725,000 net tons while the capability utilization rate was 76.1%. Production was 1,906,000 net tons in the week ending January 30, 2020 while the capability utilization then was 82.4%. The current week production represents a 9.5% decrease from the same period in the previous year. Production for the week ending January 30, 2021 is up 0.5% from the previous week ending January 23, 2021 when production was 1,717,000 net tons and the rate of capability utilization was 75.7%.
Adjusted year-to-date production through January 30, 2021 was 7,360,000 net tons, at a capability utilization rate of 75.9%. That is down 9.7% from the 8,149,000 net tons during the same period last year, when the capability utilization rate was 82.4%.
Steel Capability Utilization is a domestic report based on estimates from companies representing approximately 90% of the Industry’s Raw Steel Capability as compiled by the American Iron and Steel Institute. Source: AISI, 01.30.2021
Demand for design services from U.S. architecture firms took a pointed dip last month, according to a new report from the American Institute of Architects (AIA).
The pace of decline during December accelerated from November, posting an Architecture Billings Index (ABI) score of 42.6 from 46.3 (any score below 50 indicates a decline in firm billings). Meanwhile, the pace of growth of inquiries into new projects remained flat from November to December with a score of 52.4, though the value of new design contracts stayed in negative territory with a score of 48.5.
The Architecture Billings Index (ABI) is a diffusion index derived from the monthly Work-on-the-Boards survey, conducted by the AIA Economics & Market Research Group. The ABI serves as a leading economic indicator that leads nonresidential construction activity by approximately 9-12 months. An index score of 50 represents no change in firm billings from the previous month, a score above 50 indicates an increase in firm billings from the previous month, and a score below 50 indicates a decline in firm billings from the previous month. Source: American Institute for Architects, 01.20.2021
Purchasing Managers Index (PMI)®
Architecture Billings Index (ABI) Steel Capability Utilization
The January Manufacturing PMI® registered 58.7%, down 1.8 percentage points from the seasonally adjusted December reading of 60.5%. This figure indicates expansion in the overall economy for the eighth month in a row after contraction in March, April, and May. The New Orders Index registered 61.1%, down 6.4 percentage points from the seasonally adjusted December reading of 67.5%. The Production Index registered 60.7%, a decrease of 4 percentage points compared to the seasonally adjusted December reading of 64.7%. The Backlog of Orders Index registered 59.7%, 0.6 percentage point above the December reading of 59.1%. The Employment Index registered 52.6%, 0.9 percentage point higher from the seasonally adjusted December reading of 51.7%. The Supplier Deliveries Index registered 68.2%, up 0.5 percentage point from the December figure of 67.7%. The Inventories Index registered 50.8%,
K E Y E C O N O M I C I N D I C AT O R S
The Changing Landscape Of Steel U.S. steelmaking has been a hotbed of activity in recent months and years. In December 2019, for example, iron ore producer Cleveland-Cliffs Inc. announced it would acquire AK Steel in a $1.1 billion deal. The purchase of the West Chester, Ohio-based steel maker, which produces flat-rolled carbon, stainless and electrical steel products, instantly transformed Cleveland-Cliffs into a vertically integrated producer of iron ore and steel. Just ten months later the Cleveland-based manufacturers was at it again, this time buying up most of ArcelorMittal USA and its subsidiaries for approximately $1.4 billion, again catapulting it up the list of U.S. steel producers.
Then there is US Steel Corp. Earlier this month the Pittsburgh-based steelmaker completed its acquisition of the remaining equity of Arkansas-based Big River Steel for approximately $774 million. Big River Steel operates what US Steel calls the most advanced flat-rolled mill in North America. In 2017, that electric arc furnace-oriented mill became the only LEED-certified steel production site. And in October 2020, US Steel reported a successful startup in October 2020 of what it describes as a “technologically advanced” electric arc furnace steelmaking facility at its Fairfield, Alabama, operations. These announcements barely scratch the surface of what’s going on in U.S. steel manufacturing, as well as in worldwide steelmaking. In addition to mergers and acquisitions and new facilities coming online, the steel industry is facing opportunities and challenges from tariffs, technology, material science, COVID-19, and likely from quarters not yet considered.
Of course, it’s not just the steel industry that faces these challenges. Few other industries, however, intersect with so many other industries as does steel—it underpins everything from automotive to infrastructure, from making machines to constructing high-rise buildings. As a result, impacts on the steel industry have a wide and long ripple effect.
Mergers and Acquisitions—We’ve just touched on the biggest recent moves by U.S. steelmakers, and they beg the question: What’s behind the decisions to gobble up bigger pieces of the pie? And are we likely to see more of it? Vertical integration seems to be a theme, says Jeff Larsen, vice president of natural resources, chemicals and agriculture at Capgemini North America. “Generally, having greater control within an entity across that broader value chain gives an organization greater flexibility,” he says. “I would expect that to continue.”
Indeed, Cleveland-Cliffs, as an iron ore mining company, had been a major supplier to the steel industry. With its purchase of AK Steel and ArcelorMittal USA, Cleveland-Cliffs snapped up a significant piece of the supply chain it previously fed.
Of course, there’s rarely a single driver of transactions the size of those undertaken by Cleveland-Cliffs and US Steel. “Steelmaking is a business where production volume, operational diversification, dilution of fixed costs and technical expertise matter above all else,” noted Cleveland-Cliffs President and CEO Lourenco Goncalves in a company announcement of the ArcelorMittal USA transaction. Steelmaking is also a global business. U.S. companies do not own a top spot in terms of production. In 2019, the top steel-producing company, based on crude steel production, was ArcelorMittal with 97.31 million metric tons, according to the World Steel Association. Nucor Corp. led among U.S. steelmakers with output of 23.09 million metric tons.
Which steelmakers will wax or wane in the coming years?
An Excess of Capacity—Here’s how serious the problem of excess steel capacity is—there’s a global forum to address it, and it’s called, quite literally, the Global Forum on Steel Excess Capacity. Membership is open to all countries that make up the G20, a forum for international economic
cooperation. Its stated purpose is to discuss and find collective solutions to the global issue of steel overcapacity.
Of course, the top steel-making country in terms of sheer output is missing from the global forum. That would be China, which in 2019 produced 996.3 metric million tons of crude steel, according to the World Steel Organization. Its influence on all things steel is immense. India, which holds the No. 2 spot, produced 111.2 million metric tons. The U.S., No. 4 after Japan, produced 87.8 million metric tons.
Not three months ago, a host of steel associations from around the world, including the American Iron and Steel Institute and the Japan Iron and Steel Federation, called on the governments of steel-producing countries to double-down their efforts in the Global Forum on Steel Excess Capacity to address what they called a “growing steel crisis.” The associations have renewed their appeal for the forum to develop stronger measures regarding subsides and other support measures, uphold trade remedies, and take measures to increase transparency.
The overcapacity issue is a long-standing one. However, after gradual decreases in overcapacity in the past few years, data from the Organization for Economic Co-operation and Development forecast that steel overcapacity could increase to 700 million metric tons in 2020, driven both by COVID-19 production decreases and increases in capacity, most notably in the Middle East and Asia.
Tariffs—In 2018 the Trump administration enacted steel tariffs on imports of foreign raw steel and aluminum, with some exceptions or quotas, under Section 232 of the Trade Expansion Act of 1962. The influx of steel imports threatened domestic industries and therefore constituted a threat to U.S. national security, the administration said. The torrent of production by China is of particular concern. In a November 2020 (continued…)
I N D U S T R Y N E W S

U.S. Durable Goods Orders Show Modest 0.2% December Gain Orders to U.S. factories for big-ticket manufactured goods rose a modest 0.2% in December, held back by a big drop in the volatile aircraft sector. A key category that tracks business investment decisions slowed. The rise in orders for durable goods, items expected to last at least three years, followed much stronger increases of 1.2% November and 1.8% in October, the Commerce Department reported January 27.
Orders for commercial aircraft, hard hit because of the sharp drop in air travel during the pandemic fell 51.8% in December. Separately, Boeing reported January 27 that it lost $8.4 billion in the fourth quarter, capping a record loss for all of 2020.
A category that covers business investment plans rose 0.6% following bigger gains of 1% in November and 1.7% in December.
Economists had expected total orders would post a stronger advance of around 1% in December but noted that the overall gain was held back by the big drop in aircraft orders. Excluding transportation orders, total orders rose 0.7% in December, and that followed a 0.8% rise in November. Even with the slowdown, total orders are close to their pre-pandemic levels. Orders for motor vehicles rose 1.4% in December while demand for defense aircraft jumped 5%.
“The manufacturing sector is fairing fairly well even as virus cases have surged,” said Rubeela Farooqi, chief U.S. economist at High Frequency Economics. “The December data are signaling still strong but slower growth in both business investment and equipment spending.” Source: AP, 01.27.2021
op-ed in The Wall Street Journal, American Iron and Steel Institute CEO Kevin Dempsey (he was interim at the time of the op-ed) said the tariffs have helped, boosting domestic capacity utilization rates, growing U.S. investment and lowering imports.
All eyes are now on the Biden administration and its stance on the steel tariffs. The U.S. steel industry is urging the new administration to keep them in place. In a January 11 letter to then-President-elect Biden, four steel organizations, including the AISI and Steel Manufacturers Association, and the United Steelworkers union wrote, “Continuation of the [steel] tariffs and quotas is essential to ensuring the viability of the domestic steel industry in the face of this massive and growing excess steel capacity. Removing or weakening of these measures before major steel producing countries eliminate their overcapacity—and the subsidies and other trade distorting policies that have fueled the steel crisis—will only invite a new surge in imports with devastating effects to domestic steel producers and their workers.”
COVID-19, Infrastructure and More—What else can or will or is changing the steel landscape? One answer is infrastructure, depending on how the Biden administration addresses it. Prior to the election, Biden made promises of large-
scale investments in U.S. infrastructure. Should it come to pass, “that’s generally good news for steel,” Capgemini’s Larsen notes.
Larsen also predicts that sustainability will be an increasing theme for steel manufacturers, as well as all industrial producers. Not only is sustainability a growing social objective for companies, but there are financial benefits around energy efficiency and optimization, and life-cycle management. In addition to driving technological changes, sustainability may also be a driver of the greater vertical integration mentioned earlier in this article. “[Vertical integration] is a means to control the supply chain,” Larsen notes. By definition, that creates opportunities to optimize processes on a greater scale.
And finally, an overview of any industry can’t conclude without reflecting on COVID-19. Like nearly every industry, the pandemic dampened demand for steel as much of the world came to a standstill. Through November 2020, U.S. steel mill shipments were down approximately 16% compared with the previous year’s numbers, AISI data show. Capacity utilization has slowly climbed, however. For example, utilization for the week ending January 16 reached 76.7%; for the week ending June 13 it was 54%. What remains a question and will for some
time, is COVID-19’s lasting impact on the world of work, and what that could mean for steel. As Larsen noted, COVID-19 unintentionally “became a giant world experiment” on how people work. Will the virtual work environment move from a pandemic-inspired trend to a permanent measure? And how might that change impact vehicle production, a significant end-user of steel, if it comes to pass?
“There’s no doubt that [corporations] are really looking at and considering how virtual working might have some long-term, lasting benefit,” Larsen says. “If a material part of the workforce isn’t commuting to work and therefore not driving, that’s the macro impact.”
COVID-19 raises a number of interesting questions, and the answers may be a long way away. The concluding article in this steel series, in which we speak to thought leaders about steel’s future, may be the perfect place to raise those questions further. In the meantime, keep your eyes open for the next part in our steel series. It’s an industry that deserves close attention, and IndustryWeek is determined to cover it from all angles. Source: Industry Week, 01.25.2021
The Changing Landscape Of Steel (continued)
I N D U S T R Y N E W S
ISM Report Points To Manufacturing And Services Sector Growth In 2021
Coming off of 2020, which saw myriad ebbs and flows related to the ongoing COVID-19 pandemic, 2021 is expected to point in the direction of economic improvement, for both the manufacturing and services sectors, according to the new edition of the Institute for Supply Management’s (ISM) Semiannual Economic Forecast, which was issued on January 19. Data for this report is based on feedback from U.S.-based purchasing and supply chain executives in manufacturing and non-manufacturing sectors.
For manufacturing, ISM is estimating a 6.9% annual increase in 2021 revenue, which trailed the 10.3% prediction made in the May 2020 edition of the report and topped the 1.3% annual decline for 2020. And 59% of the report’s manufacturing survey respondents are calling for revenues to be up annually in 2021, with 15 of the 18 manufacturing sectors tracked by ISM pegged for revenue growth. The sector has been on an upswing going back to June 2020, and its December PMI®, the reading used by ISM to measure growth, coming in at its highest level since August 2018.
Manufacturing capital expenses (capex) are expected to see a 2.4% annual increase, which would counter the 2.4% decline, from 2019 to 2020. The 2.4% 2020 capex decline was considerably better than the projected 19.1% decrease in the May 2020 edition of the report. And the 29% of respondents indicating capex will rise in 2021 pointed to an expected average increase of 26.4%, with the 16% expecting capex declines predicting an average decrease of 32.7%, and 55% expecting capex levels to remain the same from 2020 to 2021.
Manufacturing capacity utilization, or operating rate, which came in at 85.7% of normal capacity, is up 9.8% compared to the 75.9% reading in May and also ahead of December 2019’s 83.7% reading. Production capacity is pegged to see a 5.3% annual increase, which would outpace 2020’s 0.5% annual increase.
Raw material prices are expected to be up 2.9% in 2021, topping the May 2020 forecast of a 1.6% decline. Manufacturing employment is expected to be up 2.5 in 2021, ahead of the May 2020 projection of a 5.3% decline, for 2020.
“The [manufacturing] revenue projection of nearly 7% is the highest one recorded since December 2016,” said Tim Fiore, chair of the ISM’s Manufacturing Business Survey Committee. “And the diffusion index [the 12-month outlook for manufacturing], at 77.8, is really strong compared to 2020’s 59.1 and is the highest number since December 2017. Everything is looking very strong right now. There is optimism that profit margins will be better for the first half of the year compared to the second half of 2020, which indicates that demand has to be pretty good and people will be buying things.” Fiore added that improved profit margins are anticipated in 2021, as well as gains for wages and employment, and also for exports and imports.
Services production capacity, or the capacity to produce products or provide services in this sector, eked out a 0.1% annual gain, from 2019 to 2020, and is expected to rise 3.2% in 2021. And services capex dropped 4%, from 2019 to 2020, with a major swing expected in 2021, in the form of a projected 12.7% increase, also well ahead of May 2020’s projected 13.4% decline. Prices paid for raw materials in the services sector are expected to rise 3.5% for all of 2020, topping 2020’s 2.3% tally. Services sector capacity utilization, or the operating rate, is now at 86.6%, topping the May 2020 reading of 73.3 and the December 2019 reading of 86.
“It looks like 2021 will be the start of another strong growth cycle for the services sector,” said Tony Nieves, chair of ISM’s Non-Manufacturing Business Survey Committee. “Overall, 2020 was bad, and back in May the respondents said it would be worse than compared to where it ended up based on the responses from December 2019. And going forward they are more optimistic…and are looking at 2021 being much better than anticipated, with the majority of that happening in the second half of the year.”
Nieves pointed to the high 2021 capex projection—at 12.7%—which suggests there is strong confidence in the business community, from their respective industries. Source: Modern Materials Handling, 01.19.2021
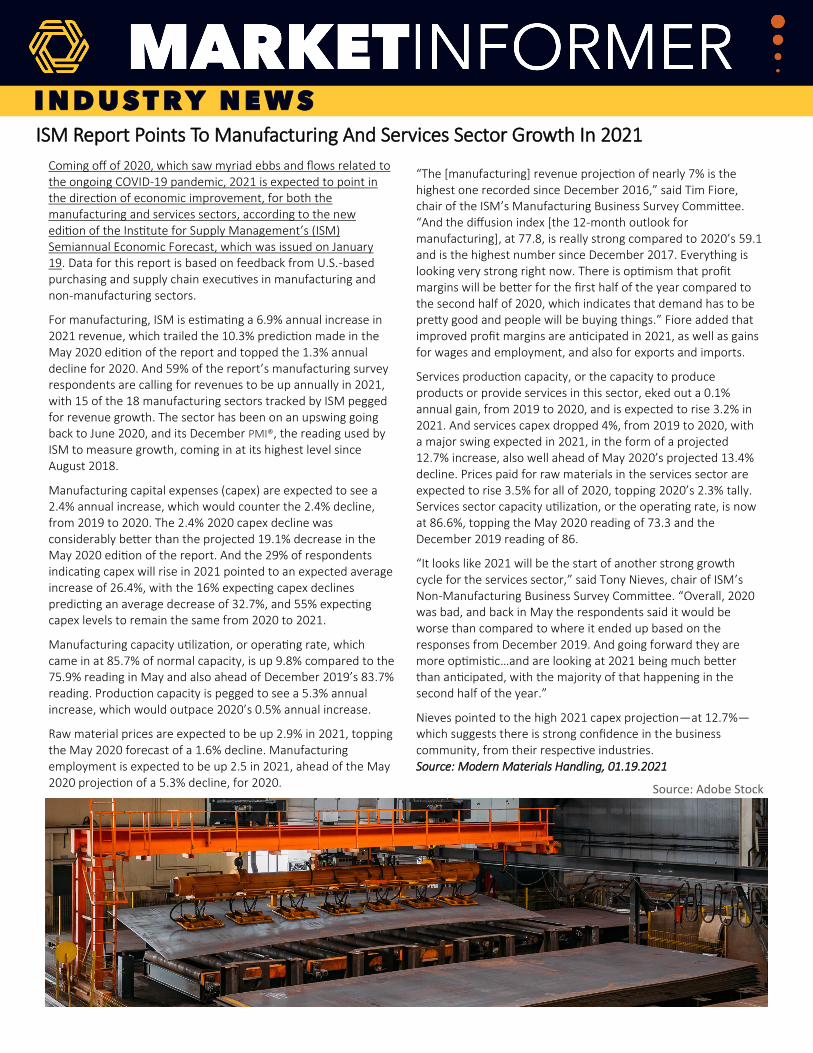
Source: Adobe Stock
I N D U S T R Y N E W S

2021 will likely be a transition year for U.S. trade policy, rather than a year of abrupt shifts. Then President-Elect Biden recently announced that he will nominate Katherine Tai as the U.S. Trade Representative; she is currently the chief trade lawyer for the House Ways and Means Committee. Many trade experts view her nomination as an indication that the Biden Administration’s trade policy will remain focused on China-enforcement issues.
Trade policy during a global pandemic involves the balancing of complex foreign policy with competing domestic interests. While it is impossible to predict exactly what will happen with tariffs, trade policy, export controls and trade sanctions, we anticipate some combination of the following developments will take place in 2021.
Tariffs—For the past several years, the Trump Administration has made particularly aggressive use of legal provisions in the Trade Expansion Act to justify the imposition of tariffs. Section 301 tariffs have been used against numerous products from China to offset Chinese government actions regarding intellectual property issues. Section 232 has been used to increase tariffs on major steel and aluminum products from many countries, centered on the premise that these imports pose a national security threat to the U.S. The use of both types of tariffs is currently being challenged in the U.S. Court of International Trade (CIT).
The Biden transition team has been clear that it will take a multilateral approach to addressing trade issues associated with China. We anticipate that any de-escalation and/or removal of Section 301 or Section 232 tariffs will be implemented in phases.
It seems unlikely that Section 301 tariffs will be removed quickly, as there is widespread support in the business community for maintaining an aggressive stance against China on intellectual
property, technology and investment issues. On the other hand, there have been numerous complaints from a wide spectrum of U.S. businesses that the tariffs on covered products from China are injuring them and that the exclusion process has been less than opaque. Thus, there seems to be a real possibility of reopening the product exclusion process in a more transparent manner, which could result in granting additional exclusions.
In addition, pending cases before the Court of International Trade (CIT) are challenging a large percentage of the Section 301 tariffs. The ongoing litigation may provide a pathway to scale back or eliminate some or all of these tariffs, but even without litigation, there could be changes to current policies and existing tariffs.
Section 232 tariffs may be easier to change in order to deescalate the tensions between the U.S. and the rest of the world. If the Biden Administration pursues a multilateral approach and seeks cooperation with traditional allies of the U.S., as expected, then an easing of such tariffs may be in the works. In addition, if the U.S. government loses the pending CIT cases challenging the modifications to the list of covered products, this defeat could pave the way for importers to negotiate an easing of at least some of the steel and aluminum tariffs.
Antidumping/Countervailing Duties (AD/CVD)—2021 will likely bring a continued uptick in enforcement actions for evading or circumventing antidumping/countervailing duties. Coupled with new actions, Customs continues to focus on enforcement by issuing an increasing number of Requests for Information and Notices of Action to importers alleging that entries should have been declared as subject to these duties. The Biden Administration may be inclined to more traditional trade remedies such as AD/CVD to protect U.S. industry, rather than
pursuing the more controversial remedies the Trump Administration relied on.
In 2021, we expect to see significantly more AD/CVD cases filed, including more petitions against China and products such as steel and aluminum, especially if Section 232 and Section 301 tariffs are removed. In addition, we anticipate more petitions against products from countries and regions such as India, Vietnam, Southeast Asia and Eastern Europe---places where importers switched sourcing because of Section 301 tariffs or existing AD/CVD orders on China.
We also expect an increased number of allegations that products should be subject to countervailing duties due to currency manipulation by the government of the exporting country. On November 4, 2020, the U.S. Department of Commerce announced that it was preliminarily imposing countervailing duties on imports of passenger vehicles and light truck tires from Vietnam and on twist ties from China due to alleged currency manipulation by those countries.
Trade Litigation—As more companies prioritize the protection of their intellectual property—and with increasing awareness of how International Trade Commission (ITC) remedies provide enormous competitive leverage—Section 337 filings may increase again.
Relatedly, the trend of more non-patent cases is expected to continue. While approximately 90% of Section 337 cases used to involve assertion of a patent, there is increasing diversity in the caseload, with more complaints alleging misappropriation of trade secrets, trademark infringement, or other “unfair acts” related to the importation of products. The ITC will remain a crucial venue for high-stakes litigation at the intersection of trade and intellectual property.
Export Controls and Trade Sanctions (continued…)
What’s Ahead For U.S. Trade Policy In 2021?
S P E C I A L S E C T I O N : T R A D E N E W S

Former President Trump left office with several export controls and trade sanctions initiatives in flux, and it is unclear whether the Biden Administration will continue those initiatives, modify them, or reverse course completely. Even though President Biden will generally enjoy authority to repeal many of Trump’s export regulation policies, those legacy policies will likely still complicate the early stages of Biden’s presidency.
China - The Trump Administration is leaving President Biden with a convoluted collection of China-focused export regulatory policies. In 2020, President Trump imposed enhanced export controls on Chinese “military end users,” issued an executive order to prohibit U.S. persons from transacting in publicly traded securities issued by Chinese companies owned or controlled by the Chinese military; imposed an expanded new “foreign-produced direct product rule” related to Huawei; and added China’s largest semiconductor manufacturer, Semiconductor Manufacturing International Corporation (SMIC), to the Entity List. We expect the Biden Administration to continue these policies in some fashion because many of them are tied to national security. However, Biden could soften some of these restrictions by establishing alternative licensing programs for low-technology items or by otherwise limiting or better
defining the specific types of transactions that are subject to these export restrictions.
Iran - On the campaign trail, President-Elect Biden voiced support for a U.S. reentry into the Joint Comprehensive Plan of Action (JCPOA)—a.k.a. the “Iran nuclear deal”—if Iran would recommit to its terms. Since then, the remaining JCPOA member countries have alleged that Iran has exceeded the JCPOA’s enriched uranium limits and the Iranian government’s leading nuclear scientist was killed in an apparent assassination on November 27, 2020, thereby complicating potential U.S. efforts to reenter the JCPOA, likely to be very difficult.
Russia - Russia will present a host of sanctions challenges to the Biden Administration, which will likely take early action to impose additional sanctions on Russia in response to its cyberattacks against various U.S. government agencies. Additionally, in enacting the National Defense Authorization Act for Fiscal Year 2021 (2021 NDAA), Congress has required the president to impose additional sanctions to continue blocking Russia’s completion of the Nord Stream 2 and TurkStream pipelines. We should receive an early indication of the Biden Administration’s Russian sanctions strategy based on how it responds to the aforementioned cyberattacks and how it
balances competing interests in enforcing the 2021 NDAA sanctions against the Nord Stream 2 and TurkStream pipelines.
Cuba - The Trump Administration moved to severely restrict preexisting Cuba travel authorizations under the Cuban Assets Control Regulations (CACR) and generally adopted a negative view towards U.S.-Cuba relations, but did not go so far as to entirely eliminate the CACR’s various licensing programs. Because those licensing programs remain in place, it would be possible for the Biden Administration to use those existing authorizations to more actively issue licenses to allow U.S. persons to transact with Cuba, thereby establishing friendlier U.S.-Cuba relations without directly repealing any current policies.
Emerging and Foundational Technologies—The Export Control Reform Act of 2018 (ECRA) authorized the Commerce Department to adopt new regulations to restrict exports of certain “emerging and foundational technologies.” This process is still underway, and the incoming Biden Administration will enjoy a fairly wide latitude in determining if or how to regulate exports of “emerging and foundational technologies” as required under ECRA. Source: IndustryWeek, 01.25.2021
What’s Ahead For U.S. Trade Policy In 2021? (continued)
Trade Groups, Labor Urge Biden To Keep Tariffs
Four domestic steel industry associations and the United Steelworkers urged Joe Biden to keep steel tariffs in place in advance of his inauguration. The American Iron and Steel Institute, Steel Manufacturers Association, Committee on Pipe and Tube Imports and American Institute of Steel Construction joined the labor union in the plea to the new president.
“Continuation of the tariffs and quotas is essential to ensuring the viability of the domestic steel industry in the face of this massive and growing excess steel capacity. Removing or weakening of these measures before major steel producing countries eliminate their overcapacity—and the subsidies and other trade-distorting policies that have fueled the steel crisis—
will only invite a new surge in imports with devastating effects to domestic steel producers and their workers.”
The letter states the OECD last year projected that steel overcapacity would grow to 700 million metric tons in 2020–eight times the total steel output of the U.S.. China, Vietnam and Turkey, among others, continue to increase their steel production even as the pandemic has caused demand for steel to drop around the world. Korea, Russia, Ukraine, Indonesia and others continue to export large shares of their steel production to other markets, the letter claims. Full Story Source: MetalCenterNews, 01.12.2021
S P E C I A L S E C T I O N : T R A D E N E W S

S P E C I A L S E C T I O N : T R A D E N E W S