Embed Size (px)
Citation preview
City Council Don Tatzin, Mayor Brandt Andersson, Vice Mayor Mike Anderson, Council Member Mark Mitchell, Council Member Traci Reilly, Council Member
February 3, 2014
Bruce H. Wolfe, Executive Officer California Regional Water Quality Control Board San Francisco Bay Region 1515 Clay Street, Suite 1400 Oakland, CA 94612 Dear Mr. Wolfe: Enclosed is the February 2014 Long-Term Trash Load Reduction Plan for the City of Lafayette, which is required by and in accordance with Provision C.10.c in National Pollutant Discharge Elimination System (NPDES) Permit Number CAS612008 issued by the San Francisco Bay Regional Water Quality Control Board Control Board. I certify under penalty of law that this document and all attachments were prepared under my direction or supervision in accordance with a system designed to assure that qualified personnel properly gathered and evaluated the information submitted. Based on my inquiry of the person or persons who manage the system, or those persons directly responsible for gathering the information, the information submitted is, to the best of my knowledge and belief, true, accurate, and complete. I am aware that there are significant penalties for submitting false information, including the possibility of fine and imprisonment for knowing violations.
Very truly yours,
Ron Lefler Public Works Director
3675 Mount Diablo Boulevard, Suite 210, Lafayette, CA 94549 Phone: 925.284.1968 Fax: 925.284.3169 www.ci.lafayette.ca.us
City of Lafayette
Trash Management Plan
2014-2022
Submitted to the California Regional Water Quality Control Board for the San Francisco Bay Region February 1, 2014 in compliance with Provision C.10 of the Municipal Regional Stormwater Permit
Contents
1. Introduction by the Contra Costa Clean Water Program (CCCWP) ........................................ 6
A. Trash Sources, Pathways, and Loadings ........................................................................................... 6
B. Background for this Plan................................................................................................................... 6
C. Framework for Long-Term Trash Management ............................................................................... 7
D. Identifying High-Trash Areas ........................................................................................................... 7
E. Trash Management Strategy ............................................................................................................. 7
F. Assessing Effectiveness .................................................................................................................... 8
2. City of Lafayette Trash Management Overview ..................................................................... 9
A. Characteristics Affecting Trash Generation and Management ......................................................... 9
B. Drainage System and Water Resources Affected by Trash .............................................................. 9
C. Trash Problems and Priorities ......................................................................................................... 10
3. City of Lafayette Trash Management Strategy .................................................................... 11
A. Delineation of Trash Management Areas ....................................................................................... 11
B. Area-Specific Control Measures, Implementation Schedules, and Effectiveness Assessment ...... 12
C. Creek and Shoreline Cleanups ........................................................................................................ 13
D. Trash Reduction Policies ................................................................................................................ 13
E. Public Education, Outreach, and Community Involvement ............................................................ 13
F. Jurisdiction-wide Progress Assessment and Continuous Improvement .......................................... 14
4. Trash Management Area Plans ............................................................................................. 14
A. TMA-Specific Plans ........................................................................................................................ 14
5. References............................................................................................................................. 14
Figures
1-1 Trash Sources and Transport Pathways
Tables
2-1 2010 Census Data
2-2 2005 Land Uses (ABAG)
2-3 Trash Generation Category Percentages by Land Use
3-1 Trash Generation Categories by Trash Management Area
3-2 Creek Hot Spot Cleanups
Attachments
k!j
k!jLAF1A 150ft
LAF1B 150ft
Reliez Creek
Las
Tram
pas
Cree
k
Lafayette Creek
Trib of Reliez
Happy Valley Creek
Grizzly Creek
Lagu
na C
reek
Bear Creek
Trib
of M
urde
rers
Cascade Creek
Mur
dere
rs C
reek
Trib of Lafayette
Trib of Laguna
Old
Jon
as C
reek
Trib
of L
as T
ram
pas
Trib of Moraga
Trib of Cascade
Hidden Valley Creek
Russel Creek
Moraga Creek
Rose C
reek
Trib of Grizzly
San Pablo Creek Rheem
Trib of Tice
Trib of Happy Valley
Trib of Bear
San
Pabl
o Cr
eek
Trib of San Pablo Rheem
Trib of Laguna
Lafayette Creek
Trib of Laguna
Trib
of H
appy
Vall
ey
Trib o
f Bea
r
Trib
of R
elie
z
Trib of H
appy Valley
Trib
of G
rizzl
y
Trib
of H
appy
Val
ley
Trib of Moraga
Trib of ReliezTrib of M
urderers
Trib of Las Trampas
Trib of Cascade
Trib of Las Trampas
Trib of Grizzly
Trib of R
eliez
Trib of Las Trampas
Trib of Lafayette
Trib of Murderers
Trib of Moraga
Trib of Cascade
Trib
of H
appy
Val
ley
Trib of Las Trampas
Trib of Cascade
Trib of Las Trampas
Trib
of M
orag
a
Trib of Grizzly
Trib
of La
fayet
te
Trib
of Hap
py V
alley
24
Rheem Blvd
Donald Dr
Mt Diablo Blvd
Mor
aga
Rd
Sain
t Mar
ys R
d
Pleasant Hill Rd
Brione
s Rd
Happy Valley Rd
Diablo
Hal
l Dr
Deer Hill Rd
Tayl
or B
lvd
Rel
iez
Valle
y R
d
Ivy Dr
Rohrer Dr
Glo
rietta
Blv
d
Rob
le
Moraga Way
Sweet Dr
Ascot D
r
Verd
e
Lucas Dr
Silverado Dr
Withers Ave
Grande
Moraga Blvd
El Nido Ranch Rd
Juan
ita D
r
Campolindo Dr
Los Arabis Dr
Canyon Rd
Car
ol L
n
Glen R
d
Geary Rd
Acalanes Rd
Brook St
Lela
nd D
rGlenside Dr
Ardi
th D
r
Brown Ave
Mallard Dr
Alice Ln
Oak H
ill Rd
Taho
s R
d
El C
urto
la B
lvd
Springhill R
d
Bear Creek R
d
Lucile Ln
Huston R
d
Springbrook Rd
Scofield Dr
Quandt Rd
Oak Dr
Toyon Rd
Martino Rd
Diablo View Rd
Hillcrest Dr
Los Palos D
r
Oakmont Dr
Del
Rio
Kinn
ey D
r
Saranap Ave
Calvin D
r
Reliez Station R
d
Hamlin Rd
Mildred Ln
Woodview Dr
La Mesa
Boulevard Way
Goodfellow Dr
Stanley Blvd
Upp
er H
appy
Val
ley
Rd
Rose
Ln
Betty Ln
Devin Dr
Hidden Valley Rd
La Cresta R
d
Cre
stvi
ew D
r
Overhill Rd
Draeger Dr
Zand
er D
r
1St S
tWellesley Dr
Baja
Cam
elia
Ln
Alfred Ave
Coral Dr
Natalie Dr
Valley View D
r
Mountain View Dr
Birchwood Dr
Moraga Via
Holland Dr
Leroy Ln
School St
Valle
y Dr
Ricardo
Dolores Dr
Laur
el D
r
Old Tunnel Rd
Walnut Ln
Flor
ence
Dr
Burton Dr
Alta
Oak S
t
2Nd S
t
Condit Rd
Ross Pl
Hamilton Dr
Michael Ln
Lost Valley Dr
Media
Dew
ing Ave
Martha Rd
Rancho View Dr
Mur
ray
Ln
Lana Ln
Lark
ey L
n
Golden Rain Rd
Freeman Rd
La M
onta
na
Park St
Read Dr
Skycrest Dr
Granada
Quail Ridge Rd
Windsor D
r
Solana Dr
Pine
Ln
Fran
klin
Ln
Keith Dr
Thom
pson
Rd
Warfield Dr
Vess
ing
Rd
Acacia Rd
Shangri La Rd
Beechwood Dr
Somerset Pl
Sundale Rd
1St Ave
Summit Rd
Stage C
oach
Dr
My Rd
Silver Dell Rd
San Luis Rd
Sessio
ns R
d
Lesl
yn L
n
Surmon
t Dr
Oak Park Blvd
Highland Rd
Mosswood Dr
Sky Hwy
Conejo Way
Olympic Blvd
Oneg
Pied
ra D
r
Huntleigh D
r
Fies
ta C
ir
Helen Ln
Bonn
ie L
n
La Caminita
Pano
ram
a D
r
Heather Ln
Elvia St
Spruce Ln
Mcgraw
Ln
Hamlin Dr
Orchard R
d
Chapel Dr
Janet Ln
Lucy Ln
Castello R
d
Del R
io Dr
Tilden Ln Dyer Dr
Teigland Rd
Greenvalley Dr
Laird Dr
Bacon Way
Gloria Ter
Mcbride D
r
Hills
dale
Dr
Ardor Dr
Crest Rd
Black Haw
k Rd
Hawt
horn
e Dr
Charlton Dr
Stevenson Dr
Stow
Ln
Toledo Dr
Buckingham Dr
Pine Knoll DrNobi Ln
Kim Rd
Powell Dr
Elliot Dr
Woodford Dr
Valle
cito
Ivanhoe Ave
Newell Ave
Rockledge Ln
Gre
enhi
lls D
r
Valo
ry L
n
Nordstrom Ln
Palo Alto Dr
Dor
othy
Dr
Del R
ey St
Golden Gate Way
Padre StPea
rdale
DrBelle Ave
Ashbrook Pl
Oakvue R
d
Indian Way
Bria Ct
Warren Rd
Cen
ter S
t
Deer T
rl
Las Trampas R
d
Merriewood Dr
Lind Ct
Hills
ide
Ter
Dary
l Dr
Andreasen Dr
Ascot Ct
Rahara D
r
Johnson Rd
Topp
er L
n
Risa Rd
Luca
s Ct
Claudia Ct
Mountain Springs Rd
Nog
ales
St
Terrace Rd
Pleasant View D
r
Greenwood Ct
Melillo Dr
Timothy Ln
Stan
ley
Dolla
r Dr
Knox Dr
Suns
et L
oop
Morecroft Rd
Broa
dmoo
r Ct
Sky Ln
Echo Springs Rd
Fernwood Dr
La Salle Dr
Buchan Dr
Orinda View Rd
Shulgin Rd
Purson Ln
Hop
e Ln
La Playa Dr
Mon
ticel
lo R
d
Foye
Dr
Main Ave
Meadow Ln
Rancho Rd
Villa Ct
Judy Ln
Rachele Rd
Oconner Dr
Ameno Dr
Lucas Cir
Ridge Rd
Aval
on A
ve
Gabarda
Valley View R
d
Judi
th L
n
Vicki Ln
Silver Springs Rd
Beacon Ridge Ln
Sierra Vista Way
Boyer Cir
Adak Ct
Bel Air Dr
Loma Linda Ct
Joseph Dr
Monro
e Ave
Cum
berland Dr
Oak P
ark Ln
Hoover Ave
Tiburon Ct
Lowell Ln
Coralie D
r
Risa Ct
Carlyle Ter
Middle Rd
Attri Ct
Loma Vis
Encanto Pl
Charles H
ill Rd
Cedar Ln
Iris Ln
Bickerstaff Rd
Sousa Dr
Vaca
tion
Dr
Lois LnH
arold Dr
Mar
sha
Pl
Crestview Ct
Dou
glas
Ln
2Nd Ave
West Rd
Bacon Ct
Williams Dr
Rancho View Rd
Ramsay Cir
Las Huertas Rd
Valente Dr
How
ard
Hills
Rd
Estates Dr
Folin Ln
Tanglewood Dr
David Dr
Robert R
d
3Rd Ave
Goyak Dr
Garden Ln
Sunnybrook Dr
Rimrock Rd
Virginia Dr
Bell
View
Lizann Dr
Elizabeth St
Saint Francis Dr
Barnett Cir
Silver Springs Ct
Barn LnBo
dega
Pl
Lavina Ct
Dunsyre Dr
Miller Dr
Cricket Hill Rd
Diab
lo C
ir
Laurel Ln
Nue
va
Gable Ln
Haslem
ere Dr
Parklane Dr
Wendell Ln
Springside Rd
Meadow Park Ct
Walnut St
Rainbow
Ln
Sharon Ct
Cuesta Way
Cro
ssbr
ook
Dr
Hele
n Av
e
Barcelona
Hou
gh A
ve
Rancho Del Hambre
Eagle Point R
d
Arroyo Ct
Monroe Ct
Dal
e C
t
Silv
er O
ak T
er
Woodborough Rd
Essenay Ave
Lancaster Dr
Kelley Ct
Dos Palos Dr
Random Way
Vals Ln
Leroy Way
Sally Ann Rd
Hanson Ct
Blackthorn Rd
Oak
Ct
Greenbank Dr
Corona Pl
Tara Rd
Barnett Ter
Henri Hill Ln
Augustine Ln
Windtree Ct
Quintas
Ln
King Dr
Circle Creek Dr
Hillview Ln
Mountain View Ln
La Fond Ln
Campo Calle
Cannon Dr
Hillcroft Way
Derby Ln
Woodcrest Rd
Cattle Chute Rd
Hilltop Cres
East St
Aleman Ct
Hilld
ale
Rd
Rosemont Ct
Echo Hill
Driftwood Dr
Meek Pl
Solana Ct
Plato Ct
Nausin Ln
Carlos Ct
James Pl
Butle
r Dr
Ronino Way
Lynwood Pl
Glen O
ak Ct
Car
olyn
Ct
Ros
edal
e Av
e
Pidgeon Ct
Edwards Ct
Service Rd
Bavarian Ln
Sprin
ghill
Ln
Madrone Dr
Cha
lda
Way
Cabernet Ct
Herman Dr
Phillips Rd
Woo
dsid
e C
t
Lucinda Ln
Dover C
t
Sout
hwai
te C
t
Billingto
n Ct
Zander Ct
Stuart St
Marion Ct
Chapparal Ln
Valley High
Mariposa Rd
Wilderness Ln
Fleetwood Ct
Vaughn Rd
Vanc
e Ln
Northr
idge L
n
White Pine Ln
Crestm
ont Dr
Glenside Cir
Sweetbrier Cir
Scen
ic Dr
Caro Ln
Baker Ln
Brown Dr
Patrick Ln
3Rd S
t
Ferrari
Soares Ln
Hann
ibal
Dr
Kincheloe Ct
Richard Ln
Oram Ln
Hilton Rd
Blac
kwoo
d Ln
Castle Ct
Peac
ock
Blv
d
Jennie Ct
Tera
Ct
Mario Way
Plymouth Rd
Dolores Ct
Ponderosa Ln
Hastings Ct
Der
by C
t
Quail View Cir
Corale
e Ln
Greenhills C
t
Hawks Hill Ct
Reliez C
t
Carmen Ct
Los
Ara
bis
Cir
Avis Ct
Lost Valley Ct
War
ner C
t
Sprin
ghill
Ct
Mon
tcla
ir C
ir
Darnby Ct
Monarch R
idge Dr
Moss Ln
Tice
Cre
ek D
r
Arbor Way
Perales St
Pauli P
l
Huston
Ct
Belle Ln
Loveland Dr
Mountain View Pl
Men
dota
Way
Ackl
ey C
t
Pico Ct
Min
ton
Ct
Wendy Ln
Vianne Ct
Hester Ln
Linda Vista Ln
Mt D
iablo Ct
Charlton Cir
Tiana Ter
El P
arai
so C
t
Bonnie Pl
Linares
El C
ajon
Wim
pole
St
Osw
ego
Ct
Beacon Ridge Ct
Baro
tt R
d
Isola
Way
Woodview Ct
Elk
Ct
Meadow View Rd
San R
eliez
Ct
Woodm
inster Dr
Den
eb C
t
Josefa Pl
Ruth C
tGlen Ct
Southampton Pl
Harmony Ln
Medfield Rd
La Cumbre
Camino Ct
Williams Ct
Cerrito C
t
Benthill Ct
Sweet Rd
Turk
Dr
Foothill Park Cir
Sharon Cir
Idyll Ct
Center Ct
Ascot Pl
Sky Ranch Ct
Hall Ln
Oak
Rid
ge L
n
Abbott Ct
Placer Ridge Rd
Corte Rinaldo
Buckeye Ct
Park Gate
Ford Ln
Promint
ory L
n
Sunset Ter
Songbird Ct
West Ter
Raintree Pl
1St S
t
Silverado Dr
Taylor Blvd
24
Orchard Rd
Lucile Ln
Lucas Dr
Donald Dr
Dale C
t
Del
Rio
Diablo Cir
Mea
dow
Ln
Happy Valley Rd
Sources: Esri, DeLorme, NAVTEQ, TomTom, Intermap, increment P Corp., GEBCO, USGS, FAO, NPS, NRCAN, GeoBase, IGN, Kadaster NL, Ordnance Survey, Esri Japan, METI, Esri China (Hong Kong), swisstopo, and the GIS UserCommunity
±0 0.5 10.25 Miles
Data Sources: Roads: Tele Atlas City Boundaries: Contra Costa County Background: ESRI World Topographic Map
Map Created By: EOA, Inc. Date: November 26th, 2013
City of Lafayette Trash Generation Map
Trash Generation Category
Legend
LowLow/MediumMediumMedium/HighHighHigh/Very HighVery High
Non-Jurisdictional (Dot color = Generation Category)
Full-Capture Location")
k!j Creek/Shoreline Hotspot
Full Trash Capture
StreetsAgency BoundaryCreeksParcel Boundary
Trash Generation Category
Legend
LowLow/MediumMediumMedium/HighHighHigh/Very HighVery High
Non-Jurisdictional (Dot color = Generation Category)
k!j Creek/Shoreline Hotspot StreetsAgency BoundaryCreeksParcel Boundary
Introduction by the Contra Costa Clean Water Program (CCCWP)
Contra Costa municipalities have prepared Long-Term Trash Reduction Plans (Plans) in compliance with Provision C.10.c. of the Municipal Regional Stormwater Permit1 (MRP). Each municipal plan describes control measures and best management practices (BMPs) designed to attain a 70% trash load reduction by July 1, 2017 and a 100% reduction by July 1, 2022.
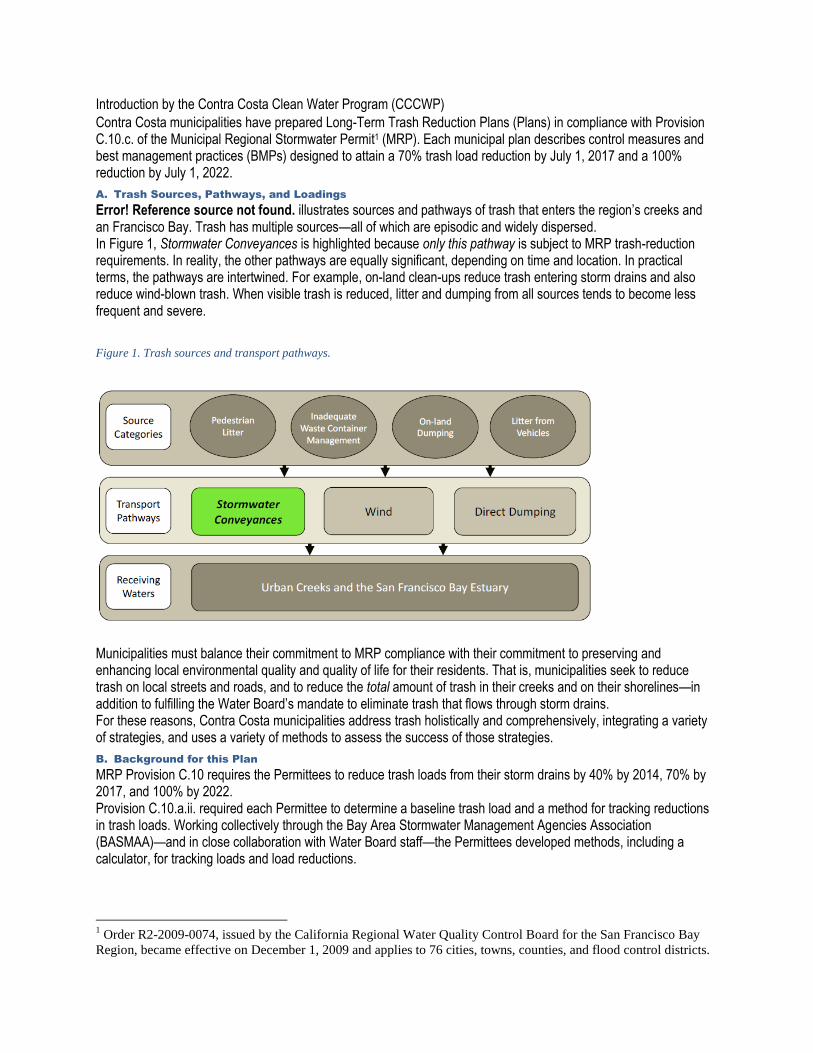
A. Trash Sources, Pathways, and Loadings
Error! Reference source not found. illustrates sources and pathways of trash that enters the region’s creeks and an Francisco Bay. Trash has multiple sources—all of which are episodic and widely dispersed. In Figure 1, Stormwater Conveyances is highlighted because only this pathway is subject to MRP trash-reduction requirements. In reality, the other pathways are equally significant, depending on time and location. In practical terms, the pathways are intertwined. For example, on-land clean-ups reduce trash entering storm drains and also reduce wind-blown trash. When visible trash is reduced, litter and dumping from all sources tends to become less frequent and severe.
Figure 1. Trash sources and transport pathways.
Municipalities must balance their commitment to MRP compliance with their commitment to preserving and enhancing local environmental quality and quality of life for their residents. That is, municipalities seek to reduce trash on local streets and roads, and to reduce the total amount of trash in their creeks and on their shorelines—in addition to fulfilling the Water Board’s mandate to eliminate trash that flows through storm drains. For these reasons, Contra Costa municipalities address trash holistically and comprehensively, integrating a variety of strategies, and uses a variety of methods to assess the success of those strategies.
B. Background for this Plan
MRP Provision C.10 requires the Permittees to reduce trash loads from their storm drains by 40% by 2014, 70% by 2017, and 100% by 2022. Provision C.10.a.ii. required each Permittee to determine a baseline trash load and a method for tracking reductions in trash loads. Working collectively through the Bay Area Stormwater Management Agencies Association (BASMAA)—and in close collaboration with Water Board staff—the Permittees developed methods, including a calculator, for tracking loads and load reductions.
1 Order R2-2009-0074, issued by the California Regional Water Quality Control Board for the San Francisco Bay
Region, became effective on December 1, 2009 and applies to 76 cities, towns, counties, and flood control districts.
The Permittees used these methods to develop Short-Term Trash Load Reduction Plans by February 1, 2012, and are implementing those plans through July 1, 2014 to achieve the 40% reduction. Progress has been documented in the Permittees’ 2012 and 2013 Annual Reports. Following their review of the Short-Term Plans, Water Board staff requested Permittees change the methods used to evaluate trash load reductions. Working collectively through BASMAA—and again in close collaboration with Water Board staff—the Permittees developed the framework and planning tools to be used in the Permittees Long-Term Plans.
C. Framework for Long-Term Trash Management
The following 8-step framework was developed2:
1. Identify high, medium, and low trash generation areas, based on land use and other geographic
data, local knowledge, and field verification.
2. Attempt to identify sources in high and medium trash generation areas to assist in focusing
control measures.
3. Prioritize areas and problems/types.
4. Identify options (tools) for dealing with prioritized areas/problems.
5. Define success/goals and measurement type.
6. Select and implement tools.
7. Evaluate success.
8. Modify as needed.
Steps 5 and 7 of this framework acknowledge fundamental challenges presented by Provision C.10—how to define and evaluate success.
D. Identifying High-Trash Areas
To implement the first step of the framework—to identify high, medium, and low trash-generation areas—the Permittees collectively, through BASMAA, developed and calibrated a predictive model of trash generation.3 Model variables are designated land use and 2010 median household income; the model was calibrated based on trash collected in full-trash-capture devices (BASMAA, 2012a, BASMAA, 2012b). The Permittees applied the model as follows: The model was used to generate a preliminary map designating very high, high, moderate, and low trash generation areas. Local municipal staff reviewed the preliminary map and identified areas that had incorrect designations based on local knowledge of actual land uses and of trash generation rates (CCCWP, 2013). Specific methods used to verify local trash generation rates are documented in Section 2 below and may include queries of municipal staff or members of the public, reviews of municipal operations data, viewing areas using Google Maps and Street View, application of BASMAA’s On-Land Visual Trash Assessment Protocol (BASMAA, 2013), or other methods.
E. Trash Management Strategy
Municipalities delineated Trash Management Areas (TMAs) within their jurisdictions. TMA boundaries are based on land uses, drainage areas, management areas, and/or geographic considerations, and are drawn to facilitate focused and efficient efforts to reduce trash in areas with very high, high, and medium trash generation rates. The rationale for delineating TMAs in the specific municipality, an overview of the municipality’s trash management approach, and a description of activities that apply throughout the municipality (including hot spot cleanups, jurisdiction-wide policies, and jurisdiction-wide public outreach) is in Section 3. Section 4 consists of individual summary plans for each municipal TMA. Each TMA plan describes the key TMA characteristics, summarizes control measures, and describes methods for evaluating effectiveness of efforts with in the TMA.
2 The framework was developed in a November 1, 2012 meeting at Water Board staff offices and was refined in
subsequent meetings with Water Board staff. 3 “Generation” is understood to be the volume of trash potentially available to be transported from the urban
watershed (per acre, per year) into the storm drains in the absence of any control measures and BMPs.
F. Assessing Effectiveness
Each TMA summary plan includes methods to evaluate effectiveness. As indicated in the framework, the primary purpose of these evaluations is to facilitate continuous improvement of control measures within the TMA. Continuous improvement requires TMA-specific interpretation of results, including consideration of factors that may have contributed to success, or lack of success, at that locale during the evaluation period. Evaluations of effectiveness and adjustments to the TMA summary plans will be included in each annual report. A secondary purpose of the evaluation methods is to contribute evidence toward an annual general evaluation of progress toward MRP goals. Such an evaluation will be based on weight-of-evidence, using the results from TMA-level evaluations of the effectiveness of specific actions within the TMA, and of the total of TMA-level actions, during the reporting period. A jurisdiction-wide assessment of progress will be compiled by combining this TMA-level evidence with the results of hot spot cleanups, visual assessments of creeks and shorelines, and observations by local residents and cleanup participants. As additional outcome-based assessment methods are devised and pilot tested—regionally and statewide—information derived from these methods will be incorporated into annual progress assessments.
2. City of Lafayette Trash Management Overview
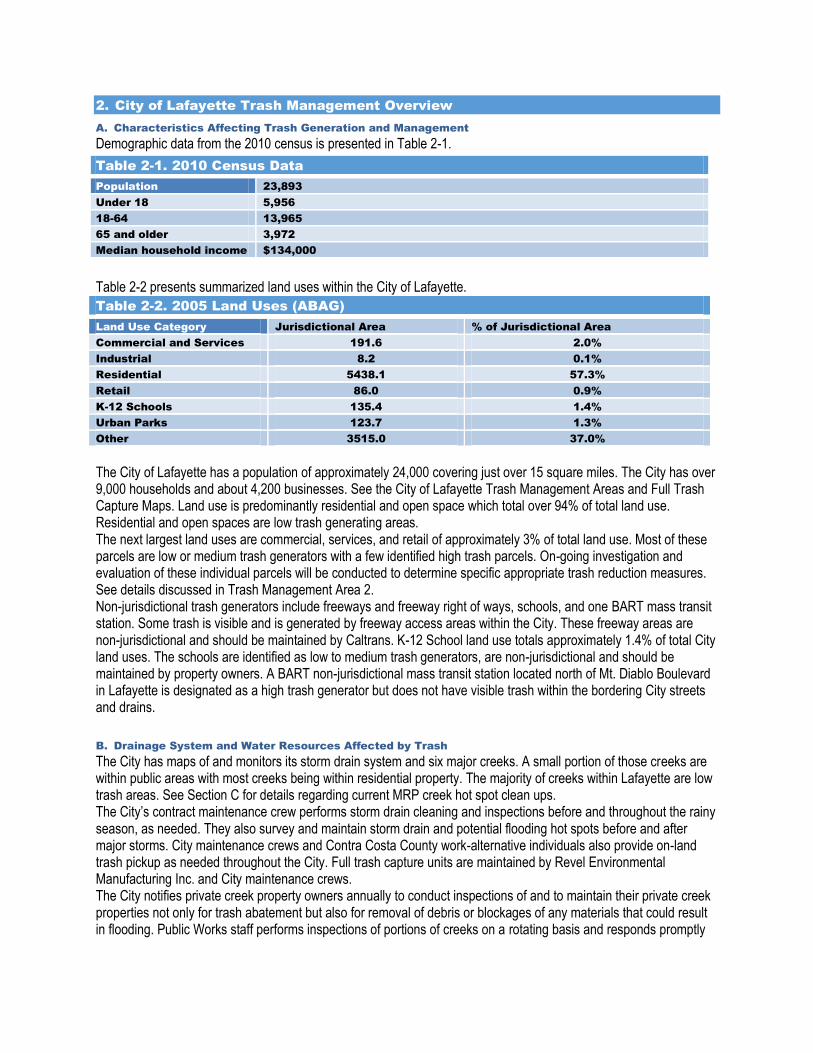
A. Characteristics Affecting Trash Generation and Management
Demographic data from the 2010 census is presented in Table 2-1.
Table 2-1. 2010 Census Data
Population 23,893
Under 18 5,956
18-64 13,965
65 and older 3,972
Median household income $134,000
Table 2-2 presents summarized land uses within the City of Lafayette.
Table 2-2. 2005 Land Uses (ABAG)
Land Use Category Jurisdictional Area % of Jurisdictional Area
Commercial and Services 191.6 2.0%
Industrial 8.2 0.1%
Residential 5438.1 57.3%
Retail 86.0 0.9%
K-12 Schools 135.4 1.4%
Urban Parks 123.7 1.3%
Other 3515.0 37.0%
The City of Lafayette has a population of approximately 24,000 covering just over 15 square miles. The City has over 9,000 households and about 4,200 businesses. See the City of Lafayette Trash Management Areas and Full Trash Capture Maps. Land use is predominantly residential and open space which total over 94% of total land use. Residential and open spaces are low trash generating areas. The next largest land uses are commercial, services, and retail of approximately 3% of total land use. Most of these parcels are low or medium trash generators with a few identified high trash parcels. On-going investigation and evaluation of these individual parcels will be conducted to determine specific appropriate trash reduction measures. See details discussed in Trash Management Area 2. Non-jurisdictional trash generators include freeways and freeway right of ways, schools, and one BART mass transit station. Some trash is visible and is generated by freeway access areas within the City. These freeway areas are non-jurisdictional and should be maintained by Caltrans. K-12 School land use totals approximately 1.4% of total City land uses. The schools are identified as low to medium trash generators, are non-jurisdictional and should be maintained by property owners. A BART non-jurisdictional mass transit station located north of Mt. Diablo Boulevard in Lafayette is designated as a high trash generator but does not have visible trash within the bordering City streets and drains.
B. Drainage System and Water Resources Affected by Trash
The City has maps of and monitors its storm drain system and six major creeks. A small portion of those creeks are within public areas with most creeks being within residential property. The majority of creeks within Lafayette are low trash areas. See Section C for details regarding current MRP creek hot spot clean ups. The City’s contract maintenance crew performs storm drain cleaning and inspections before and throughout the rainy season, as needed. They also survey and maintain storm drain and potential flooding hot spots before and after major storms. City maintenance crews and Contra Costa County work-alternative individuals also provide on-land trash pickup as needed throughout the City. Full trash capture units are maintained by Revel Environmental Manufacturing Inc. and City maintenance crews. The City notifies private creek property owners annually to conduct inspections of and to maintain their private creek properties not only for trash abatement but also for removal of debris or blockages of any materials that could result in flooding. Public Works staff performs inspections of portions of creeks on a rotating basis and responds promptly
to other calls throughout the year regarding reports of creek blockages, dumping, debris, etc. within creeks and storm drains.
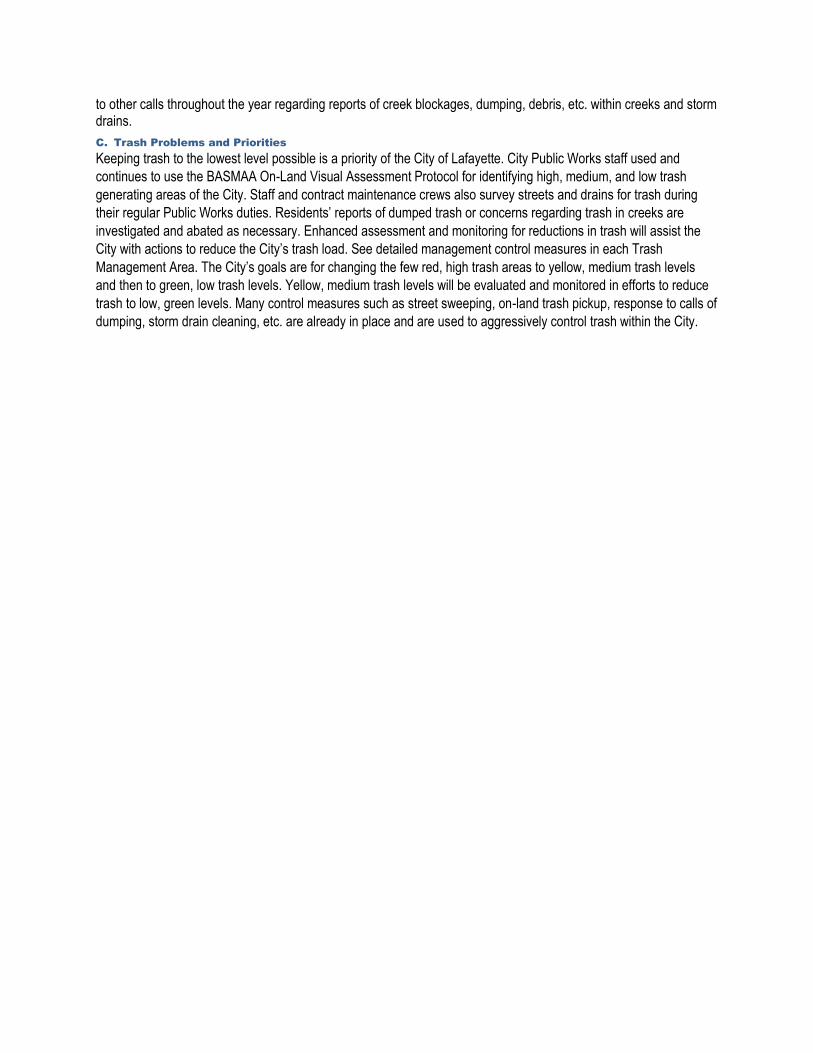
C. Trash Problems and Priorities
Keeping trash to the lowest level possible is a priority of the City of Lafayette. City Public Works staff used and
continues to use the BASMAA On-Land Visual Assessment Protocol for identifying high, medium, and low trash
generating areas of the City. Staff and contract maintenance crews also survey streets and drains for trash during
their regular Public Works duties. Residents’ reports of dumped trash or concerns regarding trash in creeks are
investigated and abated as necessary. Enhanced assessment and monitoring for reductions in trash will assist the
City with actions to reduce the City’s trash load. See detailed management control measures in each Trash
Management Area. The City’s goals are for changing the few red, high trash areas to yellow, medium trash levels
and then to green, low trash levels. Yellow, medium trash levels will be evaluated and monitored in efforts to reduce
trash to low, green levels. Many control measures such as street sweeping, on-land trash pickup, response to calls of
dumping, storm drain cleaning, etc. are already in place and are used to aggressively control trash within the City.
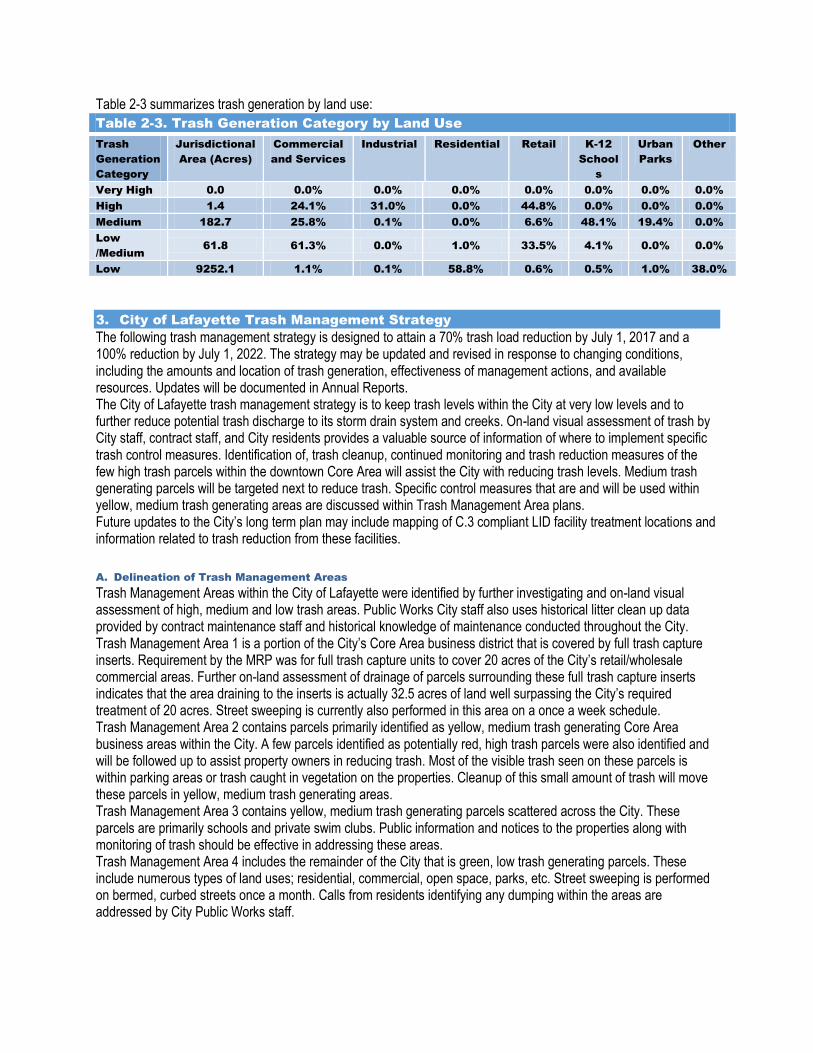
Table 2-3 summarizes trash generation by land use:
Table 2-3. Trash Generation Category by Land Use
Trash
Generation
Category
Jurisdictional
Area (Acres)
Commercial
and Services
Industrial Residential Retail K-12
School
s
Urban
Parks
Other
Very High 0.0 0.0% 0.0% 0.0% 0.0% 0.0% 0.0% 0.0% High 1.4 24.1% 31.0% 0.0% 44.8% 0.0% 0.0% 0.0% Medium 182.7 25.8% 0.1% 0.0% 6.6% 48.1% 19.4% 0.0% Low
/Medium
61.8 61.3% 0.0% 1.0% 33.5% 4.1% 0.0% 0.0%
Low 9252.1 1.1% 0.1% 58.8% 0.6% 0.5% 1.0% 38.0%
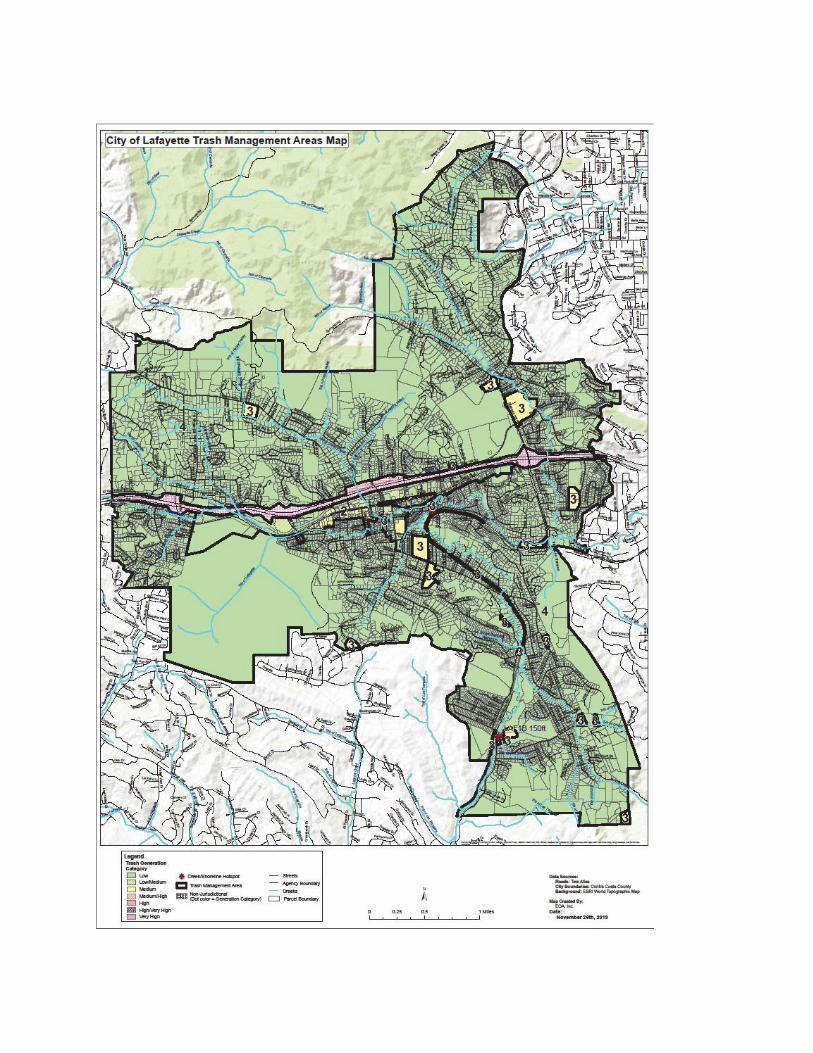
3. City of Lafayette Trash Management Strategy
The following trash management strategy is designed to attain a 70% trash load reduction by July 1, 2017 and a 100% reduction by July 1, 2022. The strategy may be updated and revised in response to changing conditions, including the amounts and location of trash generation, effectiveness of management actions, and available resources. Updates will be documented in Annual Reports. The City of Lafayette trash management strategy is to keep trash levels within the City at very low levels and to further reduce potential trash discharge to its storm drain system and creeks. On-land visual assessment of trash by City staff, contract staff, and City residents provides a valuable source of information of where to implement specific trash control measures. Identification of, trash cleanup, continued monitoring and trash reduction measures of the few high trash parcels within the downtown Core Area will assist the City with reducing trash levels. Medium trash generating parcels will be targeted next to reduce trash. Specific control measures that are and will be used within yellow, medium trash generating areas are discussed within Trash Management Area plans. Future updates to the City’s long term plan may include mapping of C.3 compliant LID facility treatment locations and information related to trash reduction from these facilities.
A. Delineation of Trash Management Areas
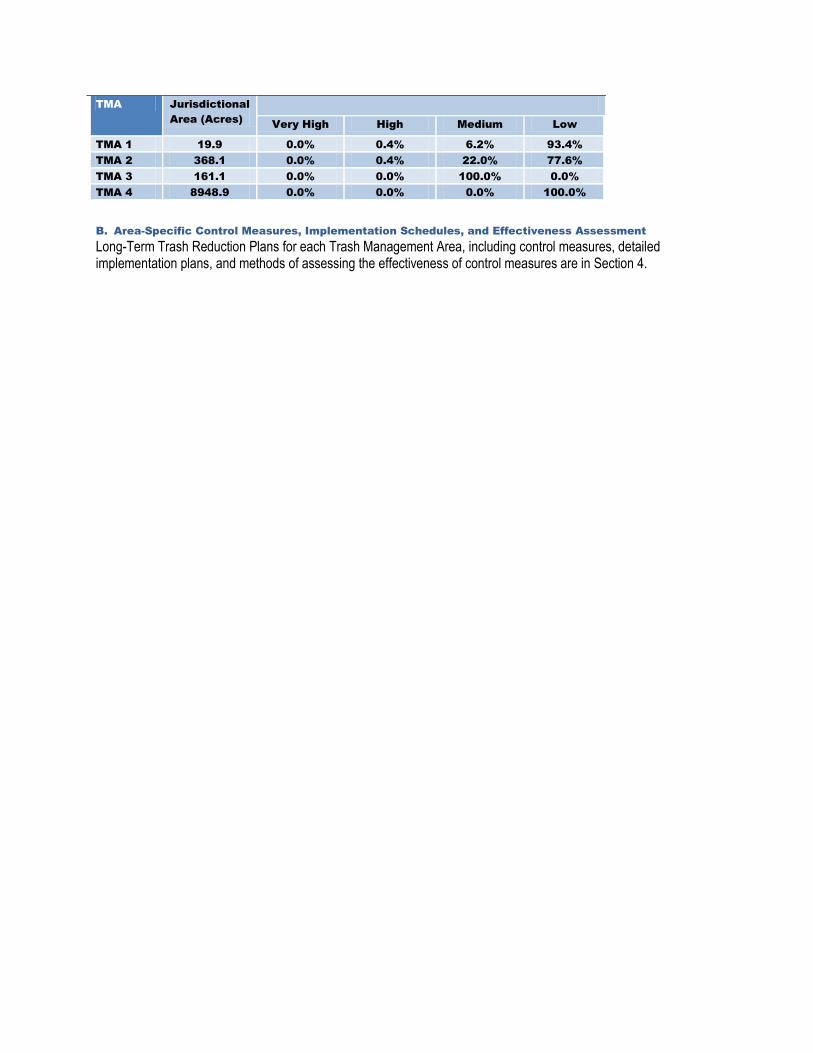
Trash Management Areas within the City of Lafayette were identified by further investigating and on-land visual assessment of high, medium and low trash areas. Public Works City staff also uses historical litter clean up data provided by contract maintenance staff and historical knowledge of maintenance conducted throughout the City. Trash Management Area 1 is a portion of the City’s Core Area business district that is covered by full trash capture inserts. Requirement by the MRP was for full trash capture units to cover 20 acres of the City’s retail/wholesale commercial areas. Further on-land assessment of drainage of parcels surrounding these full trash capture inserts indicates that the area draining to the inserts is actually 32.5 acres of land well surpassing the City’s required treatment of 20 acres. Street sweeping is currently also performed in this area on a once a week schedule. Trash Management Area 2 contains parcels primarily identified as yellow, medium trash generating Core Area business areas within the City. A few parcels identified as potentially red, high trash parcels were also identified and will be followed up to assist property owners in reducing trash. Most of the visible trash seen on these parcels is within parking areas or trash caught in vegetation on the properties. Cleanup of this small amount of trash will move these parcels in yellow, medium trash generating areas. Trash Management Area 3 contains yellow, medium trash generating parcels scattered across the City. These parcels are primarily schools and private swim clubs. Public information and notices to the properties along with monitoring of trash should be effective in addressing these areas. Trash Management Area 4 includes the remainder of the City that is green, low trash generating parcels. These include numerous types of land uses; residential, commercial, open space, parks, etc. Street sweeping is performed on bermed, curbed streets once a month. Calls from residents identifying any dumping within the areas are addressed by City Public Works staff.
TMA Jurisdictional
Area (Acres)
Very High High Medium Low
TMA 1 19.9 0.0% 0.4% 6.2% 93.4% TMA 2 368.1 0.0% 0.4% 22.0% 77.6% TMA 3 161.1 0.0% 0.0% 100.0% 0.0% TMA 4 8948.9 0.0% 0.0% 0.0% 100.0%
B. Area-Specific Control Measures, Implementation Schedules, and Effectiveness Assessment
Long-Term Trash Reduction Plans for each Trash Management Area, including control measures, detailed implementation plans, and methods of assessing the effectiveness of control measures are in Section 4.
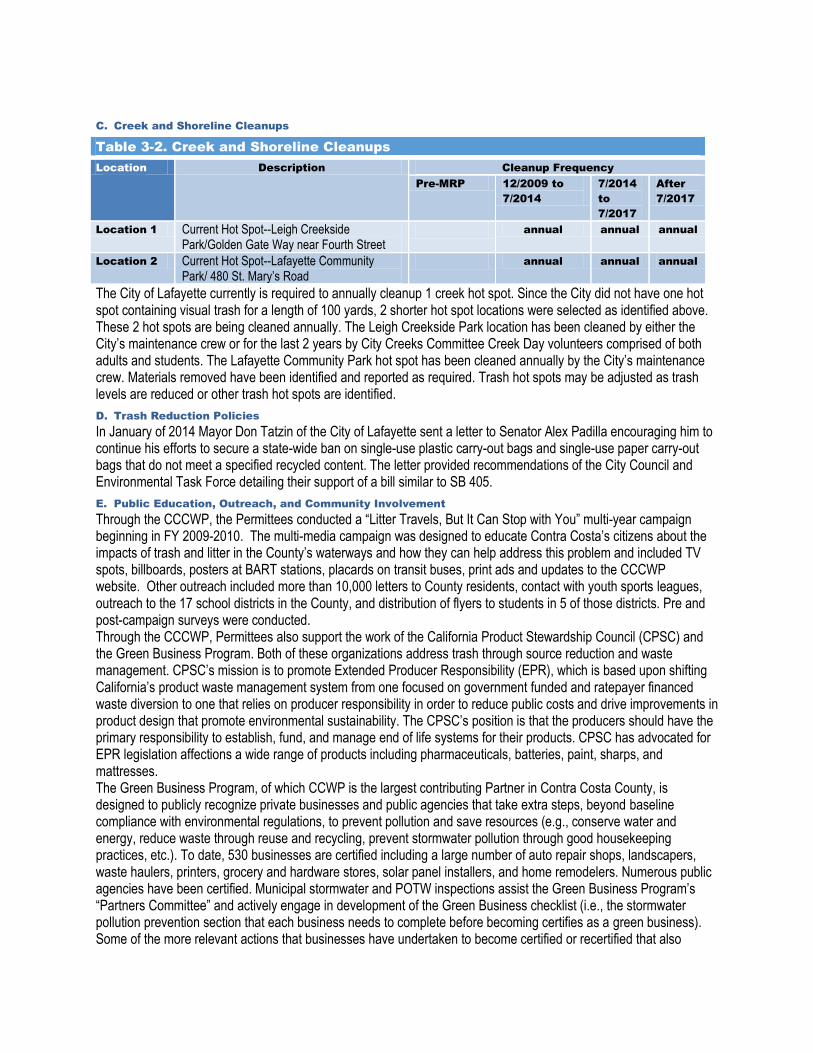
C. Creek and Shoreline Cleanups
Table 3-2. Creek and Shoreline Cleanups
Location Description Cleanup Frequency
Pre-MRP 12/2009 to
7/2014
7/2014
to
7/2017
After
7/2017
Location 1 Current Hot Spot--Leigh Creekside Park/Golden Gate Way near Fourth Street
annual annual annual
Location 2 Current Hot Spot--Lafayette Community Park/ 480 St. Mary’s Road
annual annual annual
The City of Lafayette currently is required to annually cleanup 1 creek hot spot. Since the City did not have one hot spot containing visual trash for a length of 100 yards, 2 shorter hot spot locations were selected as identified above. These 2 hot spots are being cleaned annually. The Leigh Creekside Park location has been cleaned by either the City’s maintenance crew or for the last 2 years by City Creeks Committee Creek Day volunteers comprised of both adults and students. The Lafayette Community Park hot spot has been cleaned annually by the City’s maintenance crew. Materials removed have been identified and reported as required. Trash hot spots may be adjusted as trash levels are reduced or other trash hot spots are identified.
D. Trash Reduction Policies
In January of 2014 Mayor Don Tatzin of the City of Lafayette sent a letter to Senator Alex Padilla encouraging him to continue his efforts to secure a state-wide ban on single-use plastic carry-out bags and single-use paper carry-out bags that do not meet a specified recycled content. The letter provided recommendations of the City Council and Environmental Task Force detailing their support of a bill similar to SB 405.
E. Public Education, Outreach, and Community Involvement
Through the CCCWP, the Permittees conducted a “Litter Travels, But It Can Stop with You” multi-year campaign beginning in FY 2009-2010. The multi-media campaign was designed to educate Contra Costa’s citizens about the impacts of trash and litter in the County’s waterways and how they can help address this problem and included TV spots, billboards, posters at BART stations, placards on transit buses, print ads and updates to the CCCWP website. Other outreach included more than 10,000 letters to County residents, contact with youth sports leagues, outreach to the 17 school districts in the County, and distribution of flyers to students in 5 of those districts. Pre and post-campaign surveys were conducted. Through the CCCWP, Permittees also support the work of the California Product Stewardship Council (CPSC) and the Green Business Program. Both of these organizations address trash through source reduction and waste management. CPSC’s mission is to promote Extended Producer Responsibility (EPR), which is based upon shifting California’s product waste management system from one focused on government funded and ratepayer financed waste diversion to one that relies on producer responsibility in order to reduce public costs and drive improvements in product design that promote environmental sustainability. The CPSC’s position is that the producers should have the primary responsibility to establish, fund, and manage end of life systems for their products. CPSC has advocated for EPR legislation affections a wide range of products including pharmaceuticals, batteries, paint, sharps, and mattresses. The Green Business Program, of which CCWP is the largest contributing Partner in Contra Costa County, is designed to publicly recognize private businesses and public agencies that take extra steps, beyond baseline compliance with environmental regulations, to prevent pollution and save resources (e.g., conserve water and energy, reduce waste through reuse and recycling, prevent stormwater pollution through good housekeeping practices, etc.). To date, 530 businesses are certified including a large number of auto repair shops, landscapers, waste haulers, printers, grocery and hardware stores, solar panel installers, and home remodelers. Numerous public agencies have been certified. Municipal stormwater and POTW inspections assist the Green Business Program’s “Partners Committee” and actively engage in development of the Green Business checklist (i.e., the stormwater pollution prevention section that each business needs to complete before becoming certifies as a green business). Some of the more relevant actions that businesses have undertaken to become certified or recertified that also
reduce trash loads include the following: commit to reduce waste in a minimum of five ways, maintain parking areas free of litter, keep dumpsters covered when not in use, ensure tarps for covering loads are in good conditions and used correctly, and purchase a minimum of three recycled-content products. To address trash from illegal dumping, the CCCWP operates a 1-800-No-Dumping hotline. The hotline is used by both businesses and the public to report potentially illegal dumping activities. All hotline calls are referred to the appropriate municipality for follow-up and, if necessary, enforcement. Calls have been logged since fiscal year 2004-2005. Calls to the hotline are combined with calls that come directly to municipalities and Contra Costa County Hazardous Materials (Hazmat) Division and are tracked and documented annually in municipal annual reports. The CCWP will continue to identify new partners and areas of outreach for source reduction and measures to reduce trash in the environment. CCCWP is currently in contact with California Department of Transportation (Office of Stormwater Program Development) and hopes to identify trash load reduction projects in Contra Costa County that would be financially and strategically feasible for all involved parties. CCCWP has also made contact with the California Highway Patrol, Contra Costa County Solid Waste Authority, and a number of transfer stations to potentially develop additional outreach materials to reduce litter from uncovered loads. The City of Lafayette Creeks Committee provides information and volunteer activities for community members to participate in efforts to reduce trash and pollutants. The City provides informational items to residents upon request and at City events such as the annual Art & Wine Festival and Earth Day as well as on the City’s website and in City Vistas newsletters. Information items include trash reduction, creek maintenance, Clean Water Program activities and resources.
F. Jurisdiction-wide Progress Assessment and Continuous Improvement
Progress and assessment of trash reduction methods will be conducted by the City’s Public Works staff. Further on-land visual follow-up will be performed identifying additional ways to reduce trash on the few red, high generating parcels within the City. Yellow, medium trash generating parcels will also be monitored for reductions in trash from trash control measures. Additional trash reduction measures will be identified and implemented as needed to provide continuous improvement toward trash reduction.
4. Trash Management Area Plans
A. TMA-Specific Plans
TMA-specific plans for 4 areas are attached.
5. References
BASMAA 2012a. Bay Area Stormwater Management Agencies Association. Trash Generation Rates for San Francisco Bay Area MS4s (Draft Final). Presentation to the BASMAA Trash Committee, August 2012. Prepared by EOA, Inc. BASMAA 2012b. Baseline Trash Generation Rates, Preliminary Calibration of Modeled Results, Presentation to BASMAA Trash Committee, September, 2012. Prepared by EOA, Inc. BASMAA 2013a. Visual On-Land Trash Assessment Protocol for Stormwater, Version 1.0 (Draft). April 30, 2013. Prepared by EOA, Inc. CCCWP, 2013. Contra Costa Clean Water Program. Long-Term Trash Load Reduction Plan Development—Trash Generation Map Refinements. Technical Memorandum, May 20, 2013. Prepared by EOA, Inc.
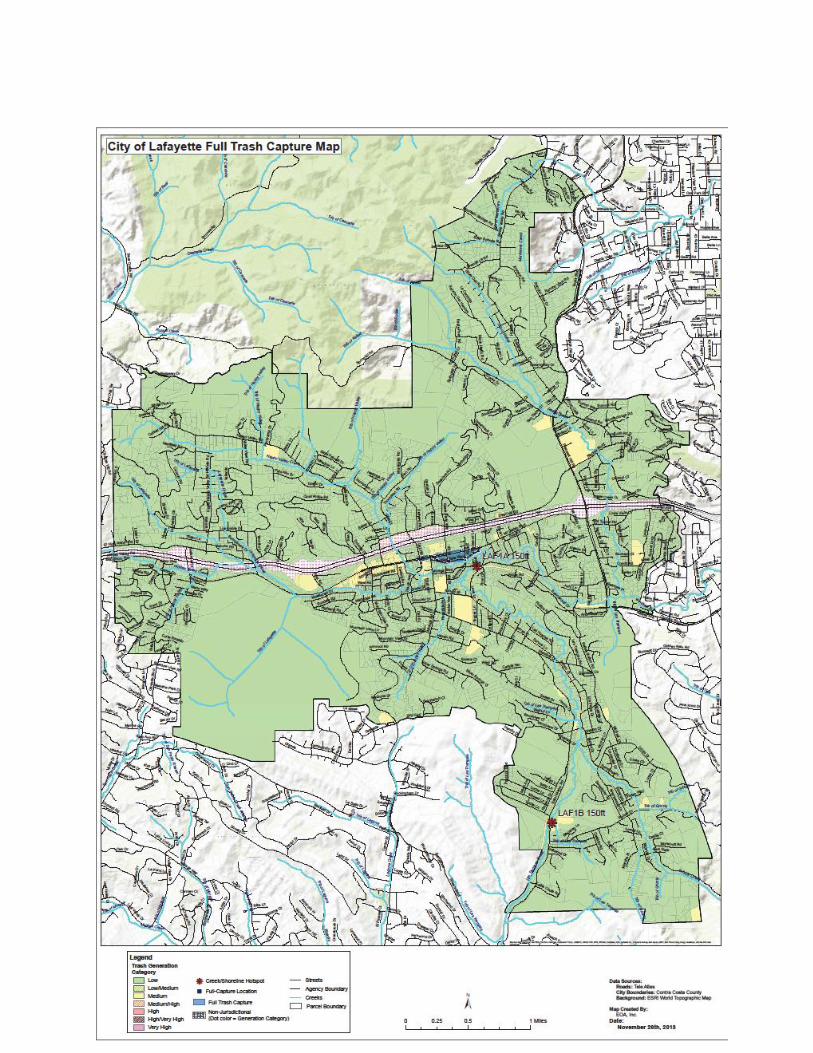
Trash Management Area 1 is within the City’s Core Area business area and is located primarily along Mt. Diablo Boulevard and Golden Gate Way. The area’s dominant land uses are commercial and retail with a few residential parcels. This part of the City’s commercial area was chosen for installation of required MRP full trash capture units to capture trash and receive runoff from streets near a number of automobile repair service businesses. The MRP required installation of full trash capture units covering 30% or approximately 20 acres of the City’s retail commercial area. In 2011 the City had 3 full trash capture units installed for a test scenario. An additional 35 units were installed in April of 2012 as part of a grant process. On land trash assessment and inspection of parcels near the full trash capture units revealed that actual drainage to the 38 total units is approximately 32.5 acres covering well over the required area required to be covered by full trash capture units. Full trash capture units are maintained 3 times a year by contract with REM.
Approximately 32.5 acres are treated by 38 full trash capture units. This is adequate to reduce trash from the less than 1% of high trash generation land and approximately 6% of medium trash generating areas. In addition, at this time the City provides street sweeping once a week to this area and on-land trash cleanup in street right of ways as needed.
Summary of Control Measures and Implementation Schedule for Trash Management Area [1]
Control Measure Control Measure Details
Pre-
MRP
12/2009
to 7/2014
7/2014 to
7/2017
After
7/2017
Full Capture Treatment
Devices
38 full trash capture devices X X X
Street Sweeping
Street sweeping within Trash Management Area 1 is currently performed at one time per week and will be continued as needed and as financially viable.
X X X X
On-land Trash Cleanups
On-land trash cleanups are performed in addition to full trash capture devices and street sweeping when needed to clean up unexpected trash.
X X X X
Storm Drain Inlet
Maintenance
Storm drain inlet maintenance is performed regularly by the City’s maintenance contractor. More frequent inlet maintenance is performed as necessary or in response to calls for additional cleaning needs.
X X X
X
Anti-littering and Illegal
Dumping Enforcement
All reports of illegal dumping are followed up on by City Public Works. Efforts to determine the source of dumping of trash are investigated and all trash is cleaned up as soon as possible.
X X X
X
Improved Trash
Bins/Container
Management
Additional trash cans were located outside the new Lafayette Library and Learning Center in 2009 in order to provide adequate trash containment in this high pedestrian traffic area.
X X
X
Goals are to keep trash cleaned up from Trash Management Area 1 and control measures and implementation schedules are achieving this goal.
Key Characteristics of Trash Management Area [1]
Total
Jurisdictional
Area (Acres)
Percent in Trash Generation Category
Dominant Land Uses
Dominant Types and
Sources of Trash
Very
High High Medium Low
19.9 0 0.4 6.2 93.4 Commercial and retail Business and pedestrian-generated litter
TRASH MANAGEMENT AREA
[1] City of Lafayette Long-Term Trash Reduction Plan
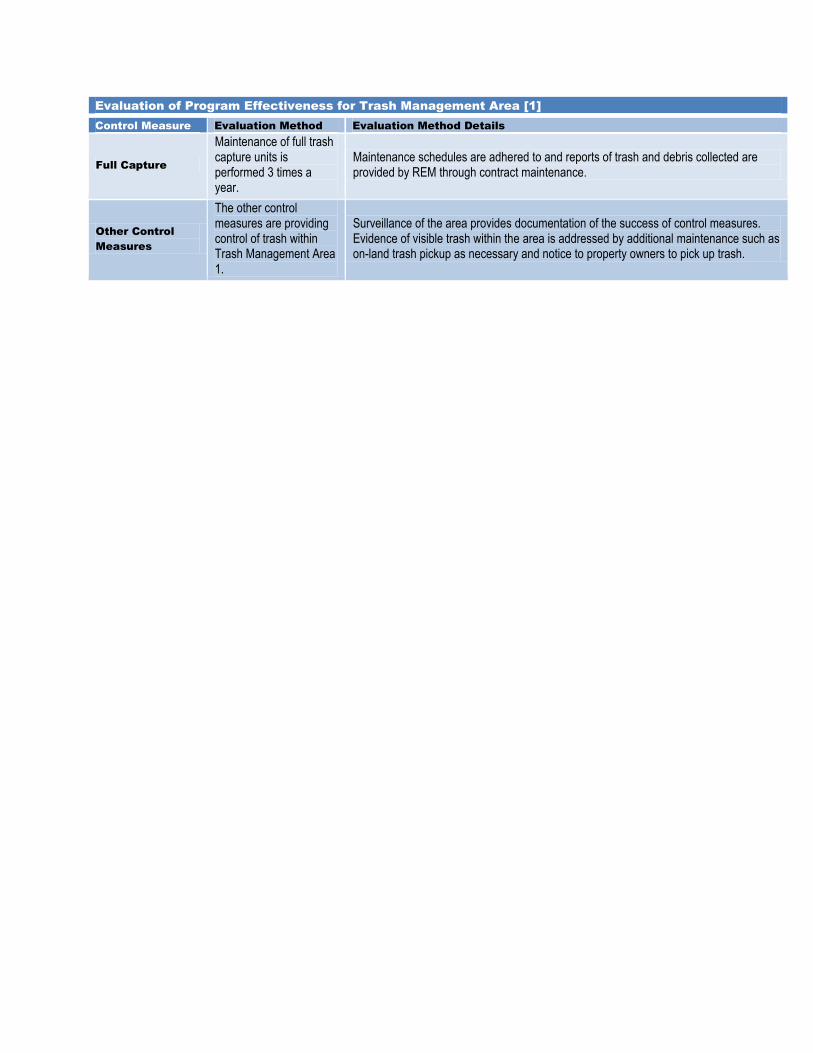
Evaluation of Program Effectiveness for Trash Management Area [1]
Control Measure Evaluation Method Evaluation Method Details
Full Capture
Maintenance of full trash capture units is performed 3 times a year.
Maintenance schedules are adhered to and reports of trash and debris collected are provided by REM through contract maintenance.
Other Control
Measures
The other control measures are providing control of trash within Trash Management Area 1.
Surveillance of the area provides documentation of the success of control measures. Evidence of visible trash within the area is addressed by additional maintenance such as on-land trash pickup as necessary and notice to property owners to pick up trash.
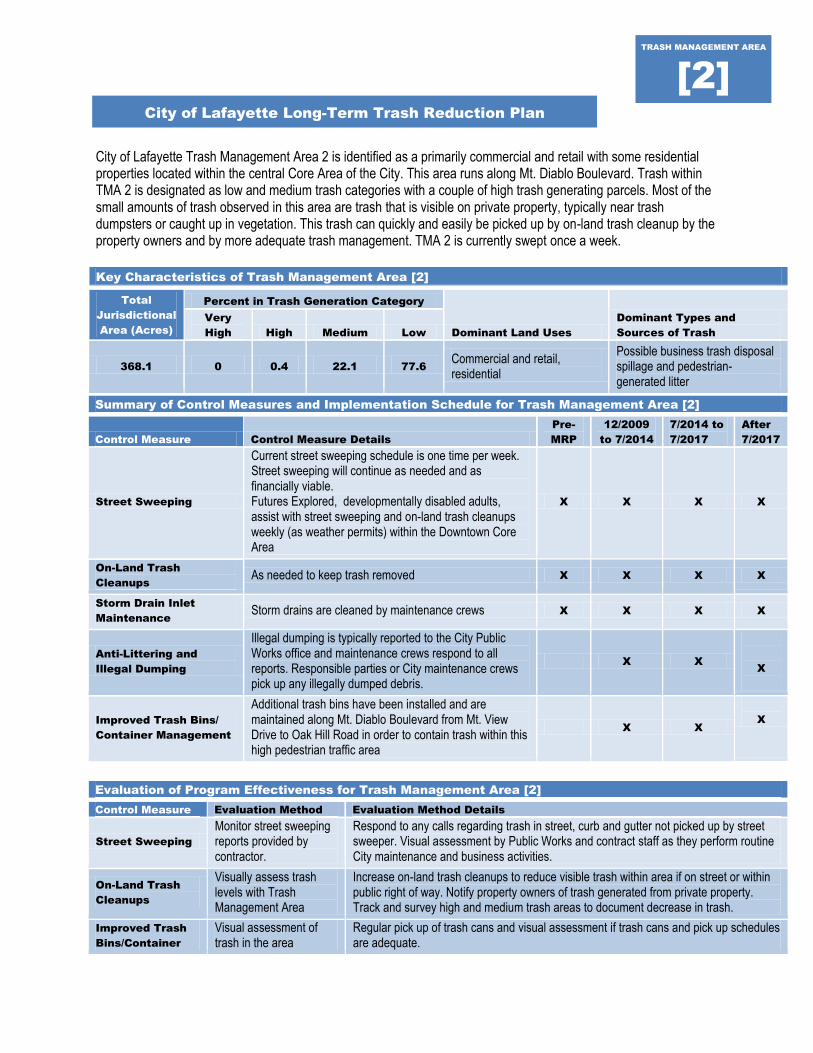
City of Lafayette Trash Management Area 2 is identified as a primarily commercial and retail with some residential properties located within the central Core Area of the City. This area runs along Mt. Diablo Boulevard. Trash within TMA 2 is designated as low and medium trash categories with a couple of high trash generating parcels. Most of the small amounts of trash observed in this area are trash that is visible on private property, typically near trash dumpsters or caught up in vegetation. This trash can quickly and easily be picked up by on-land trash cleanup by the property owners and by more adequate trash management. TMA 2 is currently swept once a week.
Summary of Control Measures and Implementation Schedule for Trash Management Area [2]
Control Measure Control Measure Details
Pre-
MRP
12/2009
to 7/2014
7/2014 to
7/2017
After
7/2017
Street Sweeping
Current street sweeping schedule is one time per week. Street sweeping will continue as needed and as financially viable. Futures Explored, developmentally disabled adults, assist with street sweeping and on-land trash cleanups weekly (as weather permits) within the Downtown Core Area
X X X X
On-Land Trash
Cleanups
As needed to keep trash removed X X X X
Storm Drain Inlet
Maintenance
Storm drains are cleaned by maintenance crews X X X X
Anti-Littering and
Illegal Dumping
Illegal dumping is typically reported to the City Public Works office and maintenance crews respond to all reports. Responsible parties or City maintenance crews pick up any illegally dumped debris.
X X
X
Improved Trash Bins/
Container Management
Additional trash bins have been installed and are maintained along Mt. Diablo Boulevard from Mt. View Drive to Oak Hill Road in order to contain trash within this high pedestrian traffic area
X X
X
Evaluation of Program Effectiveness for Trash Management Area [2]
Control Measure Evaluation Method Evaluation Method Details
Street Sweeping
Monitor street sweeping reports provided by contractor.
Respond to any calls regarding trash in street, curb and gutter not picked up by street sweeper. Visual assessment by Public Works and contract staff as they perform routine City maintenance and business activities.
On-Land Trash
Cleanups
Visually assess trash levels with Trash Management Area
Increase on-land trash cleanups to reduce visible trash within area if on street or within public right of way. Notify property owners of trash generated from private property. Track and survey high and medium trash areas to document decrease in trash.
Improved Trash
Bins/Container
Visual assessment of trash in the area
Regular pick up of trash cans and visual assessment if trash cans and pick up schedules are adequate.
Key Characteristics of Trash Management Area [2]
Total
Jurisdictional
Area (Acres)
Percent in Trash Generation Category
Dominant Land Uses
Dominant Types and
Sources of Trash
Very
High High Medium Low
368.1 0 0.4 22.1 77.6
Commercial and retail, residential
Possible business trash disposal spillage and pedestrian-generated litter
TRASH MANAGEMENT AREA
[2]
City of Lafayette Long-Term Trash Reduction Plan
Management
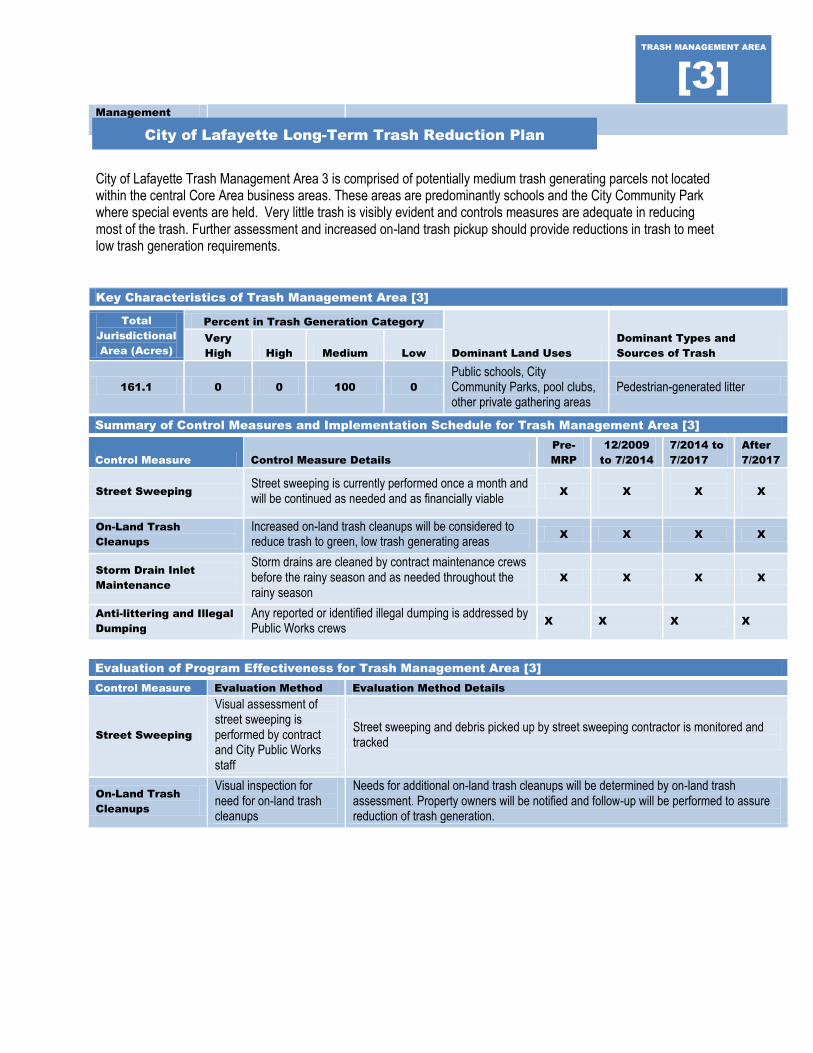
City of Lafayette Trash Management Area 3 is comprised of potentially medium trash generating parcels not located within the central Core Area business areas. These areas are predominantly schools and the City Community Park where special events are held. Very little trash is visibly evident and controls measures are adequate in reducing most of the trash. Further assessment and increased on-land trash pickup should provide reductions in trash to meet low trash generation requirements.
Summary of Control Measures and Implementation Schedule for Trash Management Area [3]
Control Measure Control Measure Details
Pre-
MRP
12/2009
to 7/2014
7/2014 to
7/2017
After
7/2017
Street Sweeping
Street sweeping is currently performed once a month and will be continued as needed and as financially viable
X
X
X
X
On-Land Trash
Cleanups
Increased on-land trash cleanups will be considered to reduce trash to green, low trash generating areas
X X X X
Storm Drain Inlet
Maintenance
Storm drains are cleaned by contract maintenance crews before the rainy season and as needed throughout the rainy season
X X X X
Anti-littering and Illegal
Dumping
Any reported or identified illegal dumping is addressed by Public Works crews
X X X X
Evaluation of Program Effectiveness for Trash Management Area [3]
Control Measure Evaluation Method Evaluation Method Details
Street Sweeping
Visual assessment of street sweeping is performed by contract and City Public Works staff
Street sweeping and debris picked up by street sweeping contractor is monitored and tracked
On-Land Trash
Cleanups
Visual inspection for need for on-land trash cleanups
Needs for additional on-land trash cleanups will be determined by on-land trash assessment. Property owners will be notified and follow-up will be performed to assure reduction of trash generation.
Key Characteristics of Trash Management Area [3]
Total
Jurisdictional
Area (Acres)
Percent in Trash Generation Category
Dominant Land Uses
Dominant Types and
Sources of Trash
Very
High High Medium Low
161.1 0 0 100 0
Public schools, City Community Parks, pool clubs, other private gathering areas
Pedestrian-generated litter
TRASH MANAGEMENT AREA
[3]
City of Lafayette Long-Term Trash Reduction Plan
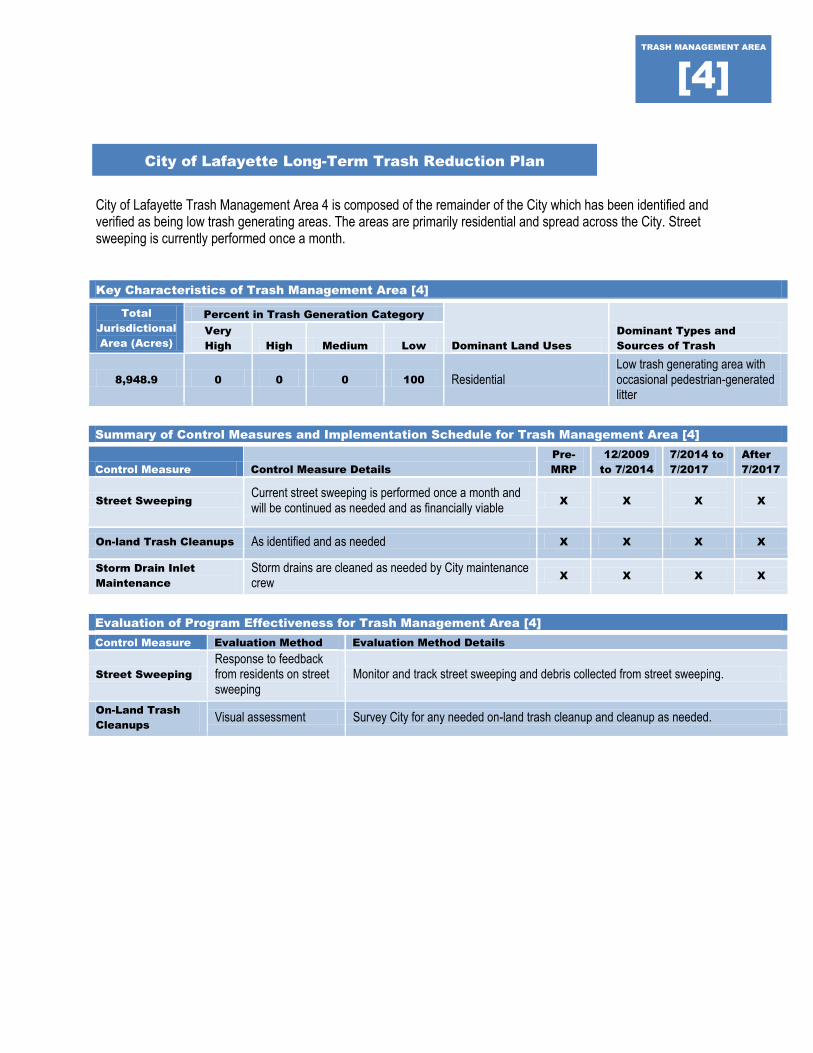
City of Lafayette Trash Management Area 4 is composed of the remainder of the City which has been identified and verified as being low trash generating areas. The areas are primarily residential and spread across the City. Street sweeping is currently performed once a month.
Summary of Control Measures and Implementation Schedule for Trash Management Area [4]
Control Measure Control Measure Details
Pre-
MRP
12/2009
to 7/2014
7/2014 to
7/2017
After
7/2017
Street Sweeping
Current street sweeping is performed once a month and will be continued as needed and as financially viable
X
X
X
X
On-land Trash Cleanups As identified and as needed X X X X
Storm Drain Inlet
Maintenance
Storm drains are cleaned as needed by City maintenance crew
X X X X
Evaluation of Program Effectiveness for Trash Management Area [4]
Control Measure Evaluation Method Evaluation Method Details
Street Sweeping
Response to feedback from residents on street sweeping
Monitor and track street sweeping and debris collected from street sweeping.
On-Land Trash
Cleanups
Visual assessment Survey City for any needed on-land trash cleanup and cleanup as needed.
Key Characteristics of Trash Management Area [4]
Total
Jurisdictional
Area (Acres)
Percent in Trash Generation Category
Dominant Land Uses
Dominant Types and
Sources of Trash
Very
High High Medium Low
8,948.9 0 0 0 100 Residential Low trash generating area with occasional pedestrian-generated litter
TRASH MANAGEMENT AREA
[4]
City of Lafayette Long-Term Trash Reduction Plan