Embed Size (px)
Citation preview
Field and farm mapping
Gatekeeper mapping module
2
Crops | Livestock | Business & Accounts | Support | Training | Hardware
Contents Introduction to mapping 4
Field maps and farm maps 5
The mapping window 6
Layers 7
Cursor options 9
Saving, printing, and sending maps 12
Field boundaries 14
Adding field boundaries manually 14
Adding field boundaries based on a previous boundary 16
Importing field boundaries 17
Editing field boundaries 21
Split field boundaries 18
Field regions 22
Cartographic layers 24
Setting up cartographic layers 24
Drawing onto cartographic layers 25
Reporting from cartographic layers 26
Importing information 27
Exporting information 27
Displaying cartographic maps on a job sheet 28
Field zone layers 29
Setting up field zone layers 29
Drawing onto field zone layers 30
Importing data onto field zones layers 31
Displaying field zone maps on a job sheet 32
3
Crops | Livestock | Business & Accounts | Support | Training | Hardware
Image layers 34
To import a background image 34
To reposition an image 35
Backing up imported background images 35
Geoanalysis layers 36
Geoanalysis layer ground rules 36
Viewing a geoanalysis auto layer 36
Creating a geoanalysis user defined layer 36
Appendix 1 – The mapping menus 39
Active tools menu 39
Layers menu 40
Field group menu (farm map) 40
Job data menu (field map) 40
Geoanalysis menu 41
Appendix 2 – universal mapping tools 42
Appendix 3 – cartographic layer tools 44
Appendix 4 – field zone layer tools 47
Appendix 5 – geoanalysis query parameters 49
4
Crops | Livestock | Business & Accounts | Support | Training | Hardware
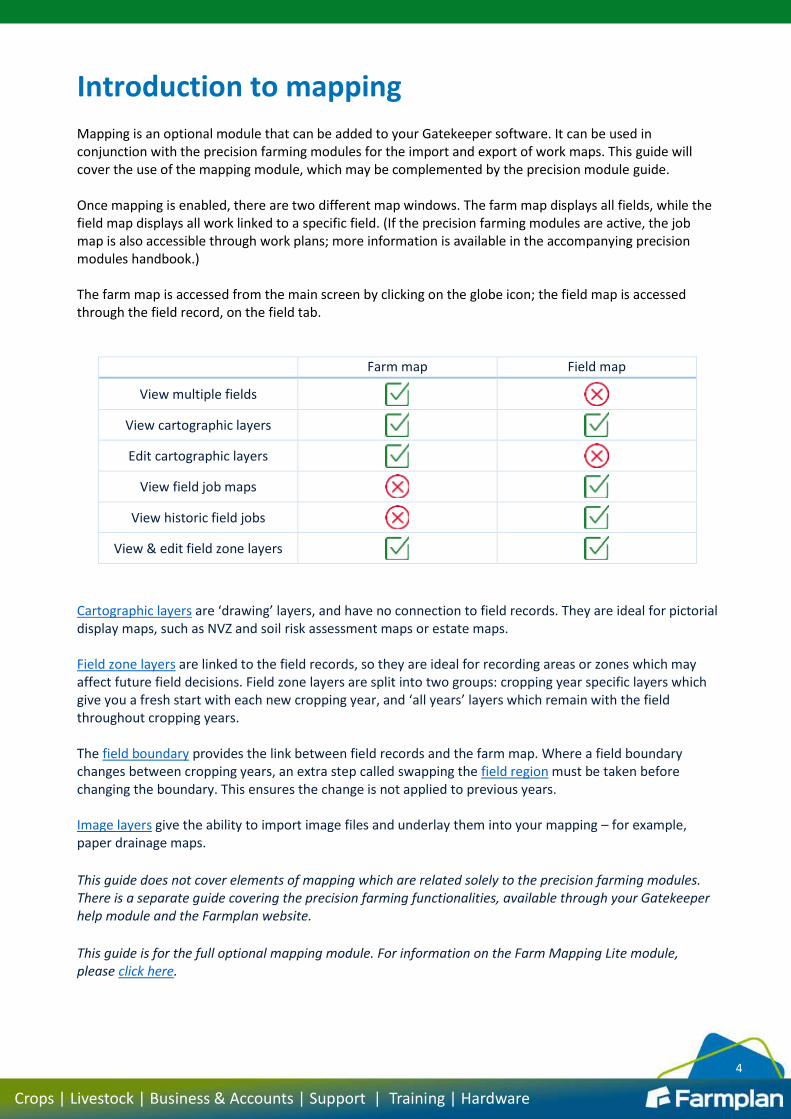
Introduction to mapping Mapping is an optional module that can be added to your Gatekeeper software. It can be used in conjunction with the precision farming modules for the import and export of work maps. This guide will cover the use of the mapping module, which may be complemented by the precision module guide. Once mapping is enabled, there are two different map windows. The farm map displays all fields, while the field map displays all work linked to a specific field. (If the precision farming modules are active, the job map is also accessible through work plans; more information is available in the accompanying precision modules handbook.) The farm map is accessed from the main screen by clicking on the globe icon; the field map is accessed through the field record, on the field tab.
Farm map Field map
View multiple fields
View cartographic layers
Edit cartographic layers
View field job maps
View historic field jobs
View & edit field zone layers Cartographic layers are ‘drawing’ layers, and have no connection to field records. They are ideal for pictorial display maps, such as NVZ and soil risk assessment maps or estate maps. Field zone layers are linked to the field records, so they are ideal for recording areas or zones which may affect future field decisions. Field zone layers are split into two groups: cropping year specific layers which give you a fresh start with each new cropping year, and ‘all years’ layers which remain with the field throughout cropping years. The field boundary provides the link between field records and the farm map. Where a field boundary changes between cropping years, an extra step called swapping the field region must be taken before changing the boundary. This ensures the change is not applied to previous years. Image layers give the ability to import image files and underlay them into your mapping – for example, paper drainage maps.
This guide does not cover elements of mapping which are related solely to the precision farming modules. There is a separate guide covering the precision farming functionalities, available through your Gatekeeper help module and the Farmplan website.
This guide is for the full optional mapping module. For information on the Farm Mapping Lite module, please click here.
5
Crops | Livestock | Business & Accounts | Support | Training | Hardware
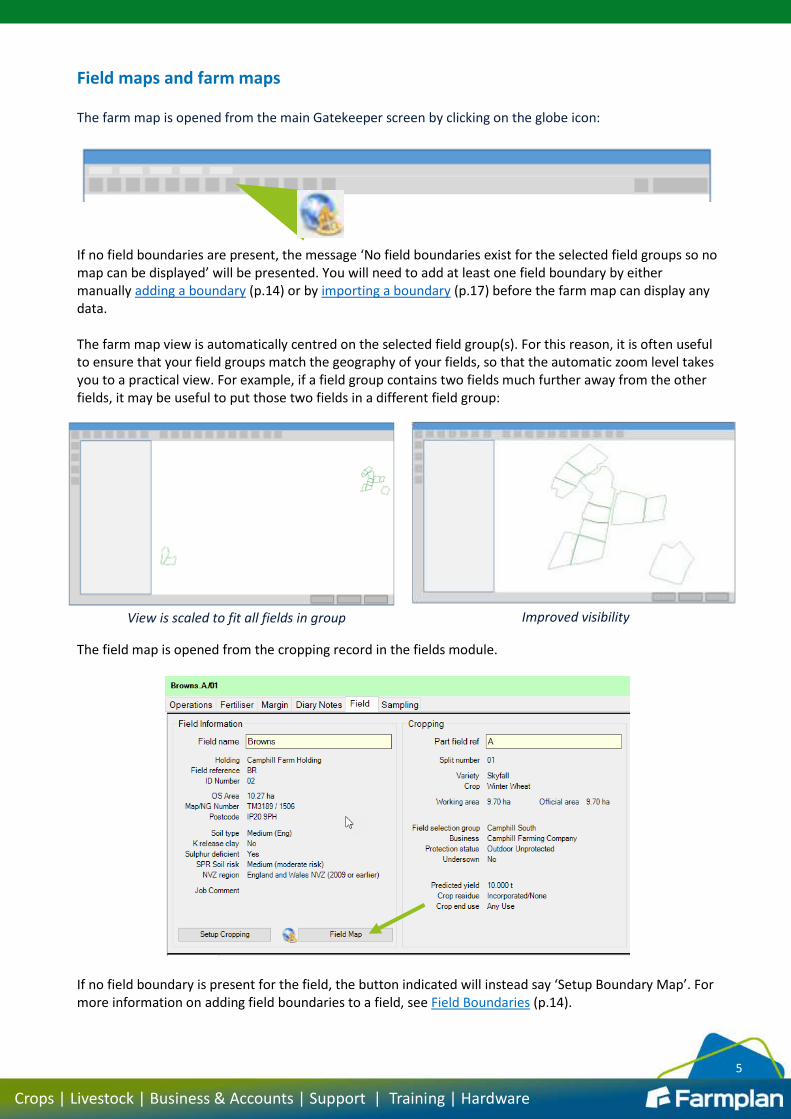
Field maps and farm maps The farm map is opened from the main Gatekeeper screen by clicking on the globe icon:
If no field boundaries are present, the message ‘No field boundaries exist for the selected field groups so no map can be displayed’ will be presented. You will need to add at least one field boundary by either manually adding a boundary (p.14) or by importing a boundary (p.17) before the farm map can display any data. The farm map view is automatically centred on the selected field group(s). For this reason, it is often useful to ensure that your field groups match the geography of your fields, so that the automatic zoom level takes you to a practical view. For example, if a field group contains two fields much further away from the other fields, it may be useful to put those two fields in a different field group:
The field map is opened from the cropping record in the fields module.
If no field boundary is present for the field, the button indicated will instead say ‘Setup Boundary Map’. For more information on adding field boundaries to a field, see Field Boundaries (p.14).
View is scaled to fit all fields in group Improved visibility
6
Crops | Livestock | Business & Accounts | Support | Training | Hardware
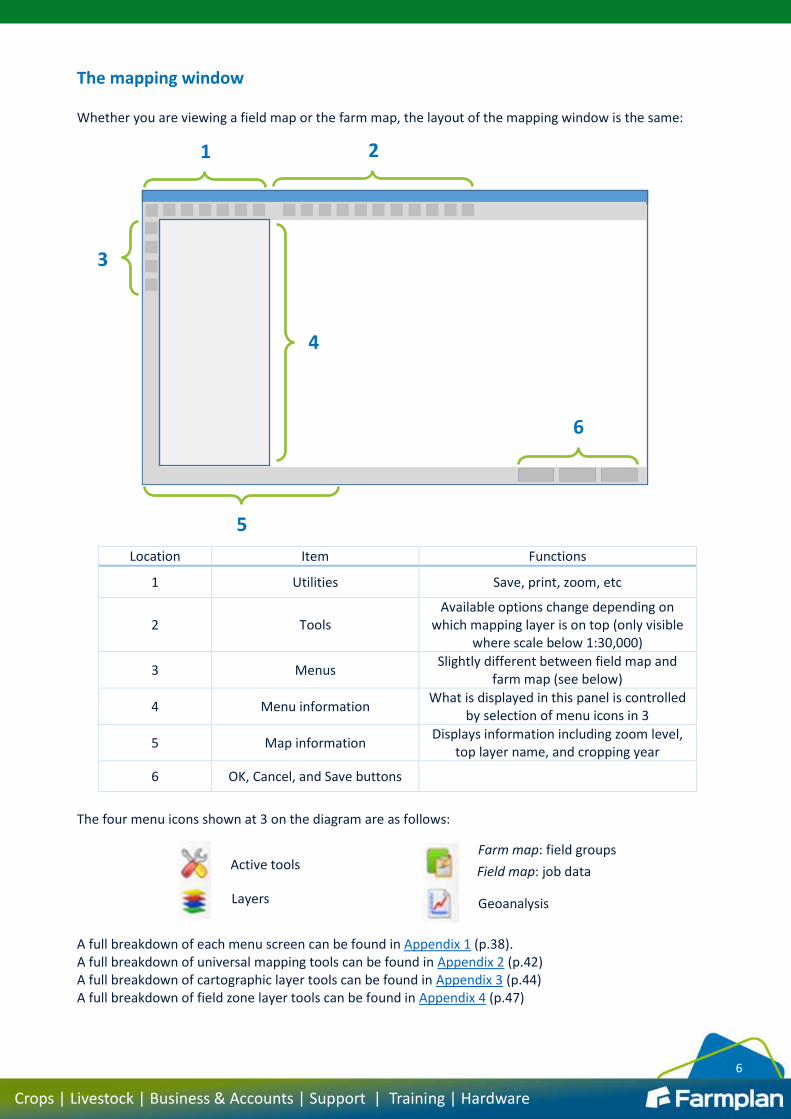
The mapping window Whether you are viewing a field map or the farm map, the layout of the mapping window is the same:
Location Item Functions
1 Utilities Save, print, zoom, etc
2 Tools Available options change depending on
which mapping layer is on top (only visible where scale below 1:30,000)
3 Menus Slightly different between field map and
farm map (see below)
4 Menu information What is displayed in this panel is controlled
by selection of menu icons in 3
5 Map information Displays information including zoom level,
top layer name, and cropping year
6 OK, Cancel, and Save buttons
The four menu icons shown at 3 on the diagram are as follows: A full breakdown of each menu screen can be found in Appendix 1 (p.38). A full breakdown of universal mapping tools can be found in Appendix 2 (p.42) A full breakdown of cartographic layer tools can be found in Appendix 3 (p.44) A full breakdown of field zone layer tools can be found in Appendix 4 (p.47)
1 2
3
4
5
6
Active tools
Layers
Farm map: field groups
Field map: job data
Geoanalysis
7
Crops | Livestock | Business & Accounts | Support | Training | Hardware
Layers Layers is the term used throughout Gatekeeper mapping to describe the different ‘sheets’ of information.
Multiple layers may be switched on and stacked underneath each other to display different sets of
information. Therefore any information you wish to display on its own should be added to its own layer.
There are two ways to view multiple layers in Gatekeeper, and these may be combined.
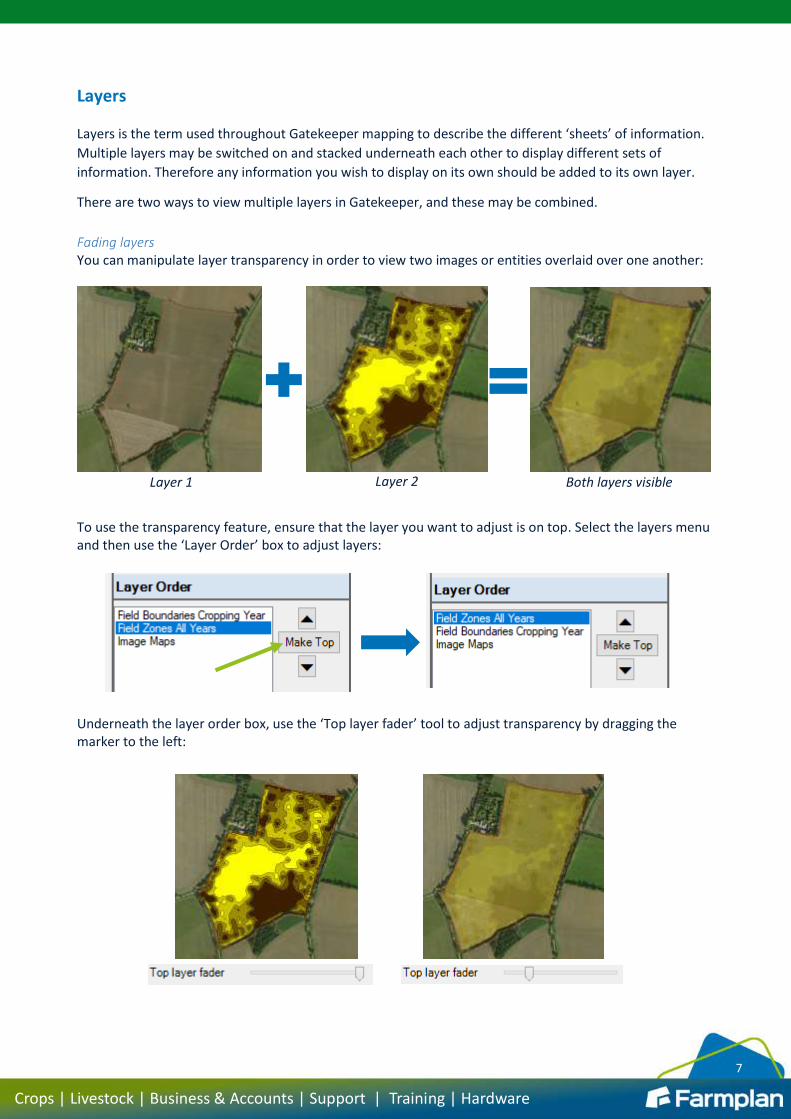
Fading layers You can manipulate layer transparency in order to view two images or entities overlaid over one another:
To use the transparency feature, ensure that the layer you want to adjust is on top. Select the layers menu and then use the ‘Layer Order’ box to adjust layers:
Underneath the layer order box, use the ‘Top layer fader’ tool to adjust transparency by dragging the marker to the left:
Layer 1 Layer 2 Both layers visible
8
Crops | Livestock | Business & Accounts | Support | Training | Hardware
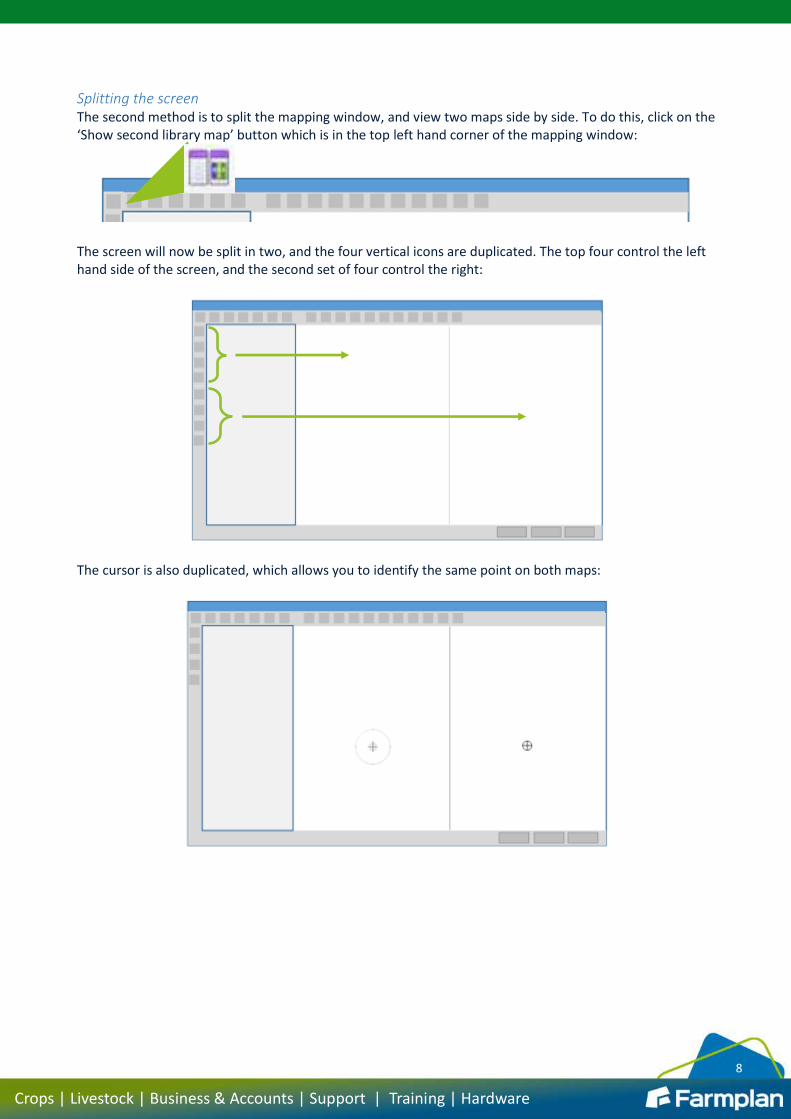
Splitting the screen The second method is to split the mapping window, and view two maps side by side. To do this, click on the ‘Show second library map’ button which is in the top left hand corner of the mapping window:
The screen will now be split in two, and the four vertical icons are duplicated. The top four control the left hand side of the screen, and the second set of four control the right:
The cursor is also duplicated, which allows you to identify the same point on both maps:
9
Crops | Livestock | Business & Accounts | Support | Training | Hardware
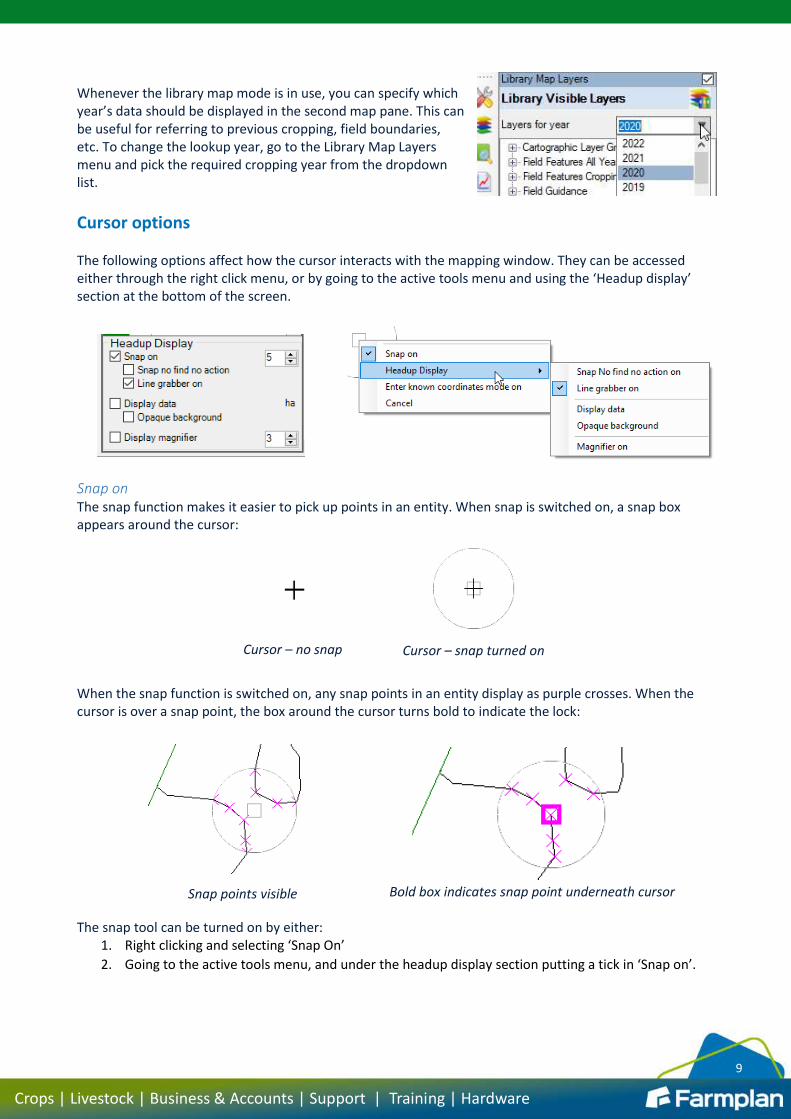
Whenever the library map mode is in use, you can specify which year’s data should be displayed in the second map pane. This can be useful for referring to previous cropping, field boundaries, etc. To change the lookup year, go to the Library Map Layers menu and pick the required cropping year from the dropdown list.
Cursor options The following options affect how the cursor interacts with the mapping window. They can be accessed either through the right click menu, or by going to the active tools menu and using the ‘Headup display’ section at the bottom of the screen.
Snap on The snap function makes it easier to pick up points in an entity. When snap is switched on, a snap box appears around the cursor:
When the snap function is switched on, any snap points in an entity display as purple crosses. When the cursor is over a snap point, the box around the cursor turns bold to indicate the lock:
The snap tool can be turned on by either:
1. Right clicking and selecting ‘Snap On’
2. Going to the active tools menu, and under the headup display section putting a tick in ‘Snap on’.
Cursor – no snap Cursor – snap turned on
Snap points visible Bold box indicates snap point underneath cursor
10
Crops | Livestock | Business & Accounts | Support | Training | Hardware
Adjusting the number next to the snap option changes how far away from the cursor the snap function will work. The smaller the number, the more sensitive the snap box.
Snap no find no action When this option is selected, the cursor will not interact with the mapping window unless it is over a snap point. If you are trying to use a tool in the mapping window but nothing happens when you click, check this option has not been turned on.
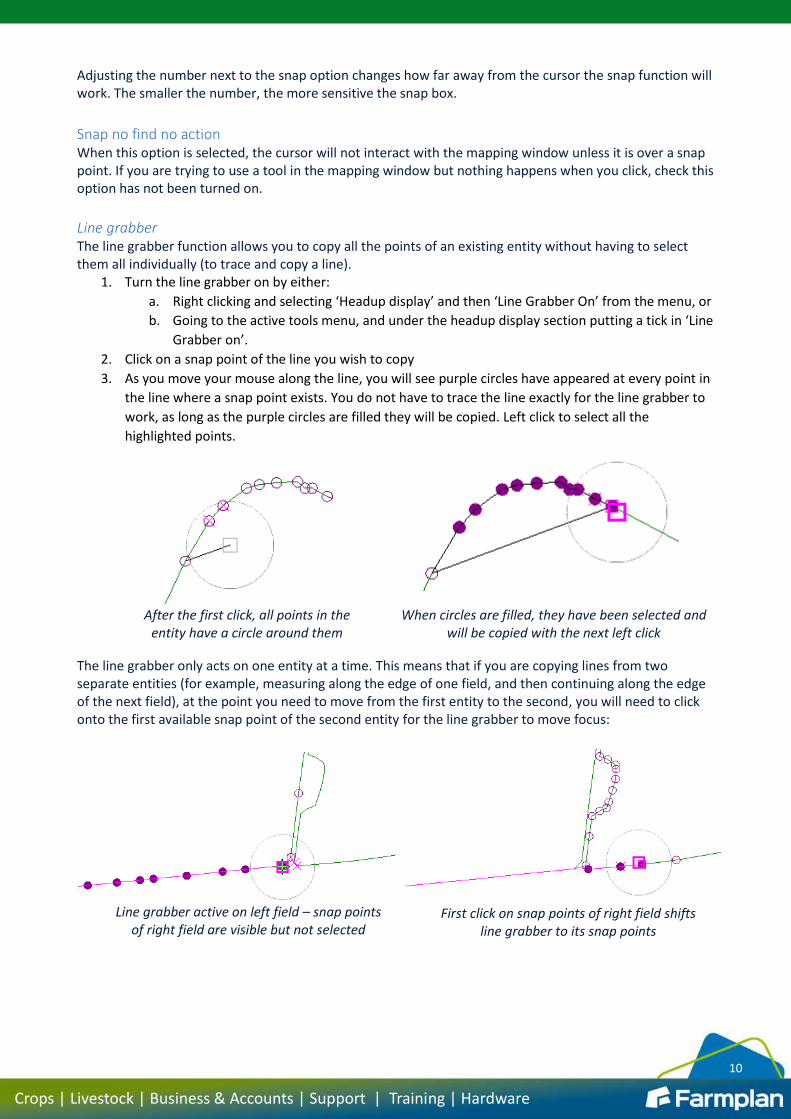
Line grabber The line grabber function allows you to copy all the points of an existing entity without having to select them all individually (to trace and copy a line).
1. Turn the line grabber on by either:
a. Right clicking and selecting ‘Headup display’ and then ‘Line Grabber On’ from the menu, or
b. Going to the active tools menu, and under the headup display section putting a tick in ‘Line
Grabber on’.
2. Click on a snap point of the line you wish to copy
3. As you move your mouse along the line, you will see purple circles have appeared at every point in
the line where a snap point exists. You do not have to trace the line exactly for the line grabber to
work, as long as the purple circles are filled they will be copied. Left click to select all the
highlighted points.
The line grabber only acts on one entity at a time. This means that if you are copying lines from two separate entities (for example, measuring along the edge of one field, and then continuing along the edge of the next field), at the point you need to move from the first entity to the second, you will need to click onto the first available snap point of the second entity for the line grabber to move focus:
After the first click, all points in the entity have a circle around them
When circles are filled, they have been selected and will be copied with the next left click
Line grabber active on left field – snap points of right field are visible but not selected
First click on snap points of right field shifts line grabber to its snap points
11
Crops | Livestock | Business & Accounts | Support | Training | Hardware
Display data With this option selected, map information is displayed around the cursor. The exact information varies depending on the top layer and what kind of entity is under the cursor. Putting a tick in ‘Opaque background’ puts a white square behind the display data to make it easier to read. Turn on display data by either:
1. Right clicking and selecting Headup Display and then Display data, or
2. Going to the active tools menu, and under the headup display section putting a tick in ‘Display data’
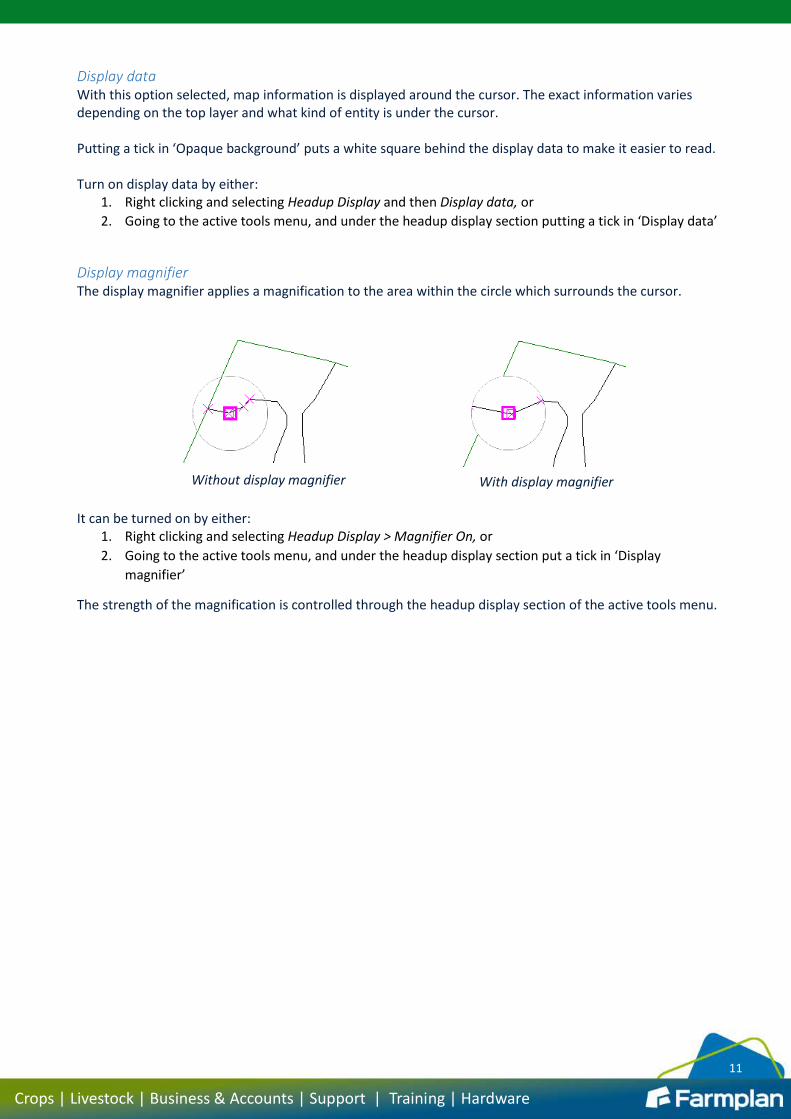
Display magnifier The display magnifier applies a magnification to the area within the circle which surrounds the cursor.
It can be turned on by either:
1. Right clicking and selecting Headup Display > Magnifier On, or
2. Going to the active tools menu, and under the headup display section put a tick in ‘Display
magnifier’
The strength of the magnification is controlled through the headup display section of the active tools menu.
Without display magnifier With display magnifier
12
Crops | Livestock | Business & Accounts | Support | Training | Hardware
Saving, printing, and sending maps There are two ways to create a map document from the Gatekeeper mapping module, which can then be saved or printed as required. Alternatively, it is also possible to run a map report from the fields module, which can then be saved, printed, or exported as required.
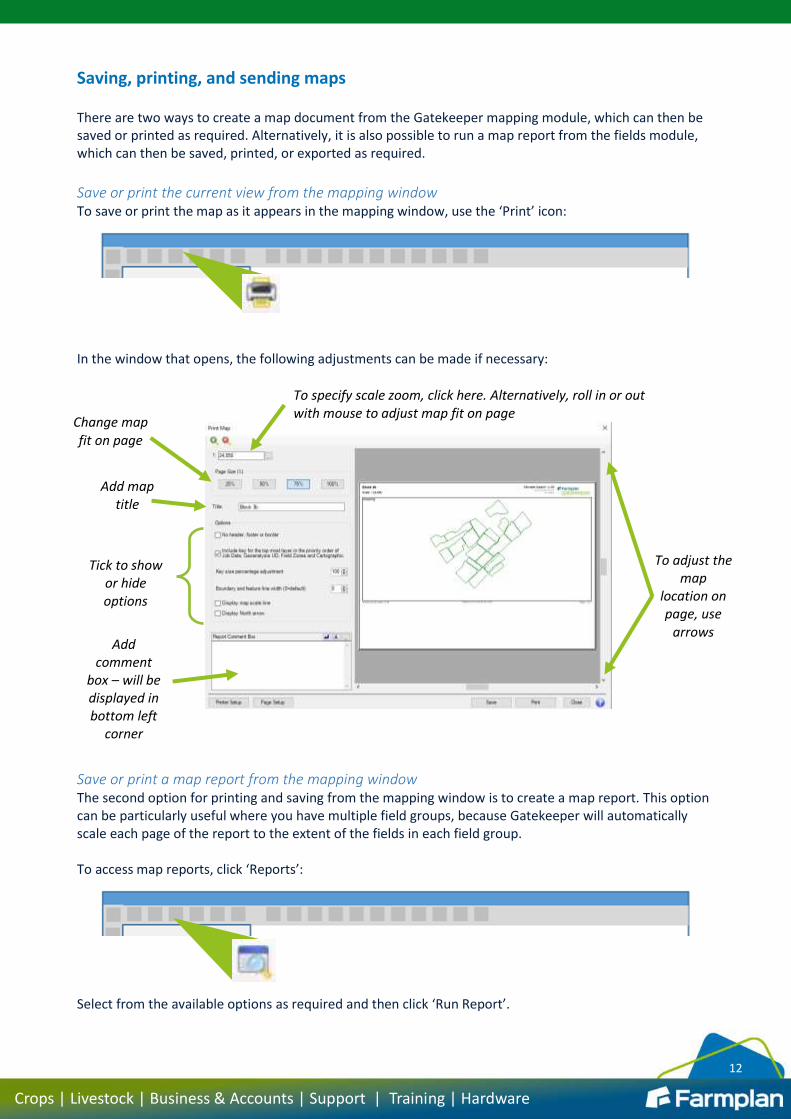
Save or print the current view from the mapping window To save or print the map as it appears in the mapping window, use the ‘Print’ icon:
In the window that opens, the following adjustments can be made if necessary:
Save or print a map report from the mapping window The second option for printing and saving from the mapping window is to create a map report. This option can be particularly useful where you have multiple field groups, because Gatekeeper will automatically scale each page of the report to the extent of the fields in each field group. To access map reports, click ‘Reports’:
Select from the available options as required and then click ‘Run Report’.
To specify scale zoom, click here. Alternatively, roll in or out with mouse to adjust map fit on page
Change map fit on page
Add map title
Tick to show or hide options
Add comment
box – will be displayed in bottom left
corner
To adjust the map
location on page, use
arrows
13
Crops | Livestock | Business & Accounts | Support | Training | Hardware
Save or print a map report from the fields module If you would prefer to view maps on a field by field basis, the selection of ‘Field Map’ type reports available in the field module may be more useful. If you wish to create a map report that displays cartographic layers, you will need to ensure these layers are visible in the map window before following the steps below. Cartographic layer contents are not clipped to the field boundary, so any entity outside a field boundary but in close proximity will still be visible. To run a field map report:
1. Go to the fields module
2. Click Reports
3. Select a ‘Field Maps’ report from the list – e.g., ‘Field Maps (Full)’
4. To determine which mapping data should be displayed, click on the ‘Mapping’ subtab and:
a. Select tick box options as required to show or hide map scale, north arrow, Bing backdrops,
etc
b. Tick ‘Show cartographic layers’ if you wish to display cartographic layer data
c. If data from field zone layers is to be displayed, scroll the grid at the bottom of the page
until the columns ‘Field Zones All Years’ or ‘Field Zones Crop Year’ are visible and then:
i. Double click in the required column to activate the dropdown list
ii. Select the layer required from the list
5. To specify which fields should appear in the report, click on the ‘Options’ subtab and click ‘Selected
Fields’ to pick the fields required
6. Click Run Report
The options selected at step 4 will be remembered next time you run the selected report, so you will only need to follow step 4 in subsequent times if you wish to change the options selected. Users with the precision farming actual or John Deere devices modules will have additional map display options not detailed in the steps above, which can be used to create field maps to display precision farming data. For more information, please refer to the appropriate handbook.
Sharing map data with other Gatekeeper users In addition to the save and print options detailed above, map data from specific layers may be exported to another Gatekeeper user, depending on the layer type.
For exporting cartographic layers or styles, see Exporting information from cartographic layers (p.27). For exporting field zone layers, see Exporting data from field zones layers (p.32). For exporting geoanalysis layers, see Sharing geoanalysis queries (p.37).
14
Crops | Livestock | Business & Accounts | Support | Training | Hardware
Field boundaries
A field’s boundary is the starting point of all mapping activities in Gatekeeper.
A field boundary may be drawn manually into Gatekeeper, or imported through the devices
module.
Where a field is split (has more than one cropping record), each split part has its own boundary.
Changes to the field boundary will affect the field in every year it shares the same field region.
Adding field boundaries manually The following steps are to add a boundary to a whole field - if you wish to add a boundary to a field which is split, please see Split Field Boundaries. To manually add a field boundary for the first time:
1. Go to the field in the fields module
2. Click on the Field tab
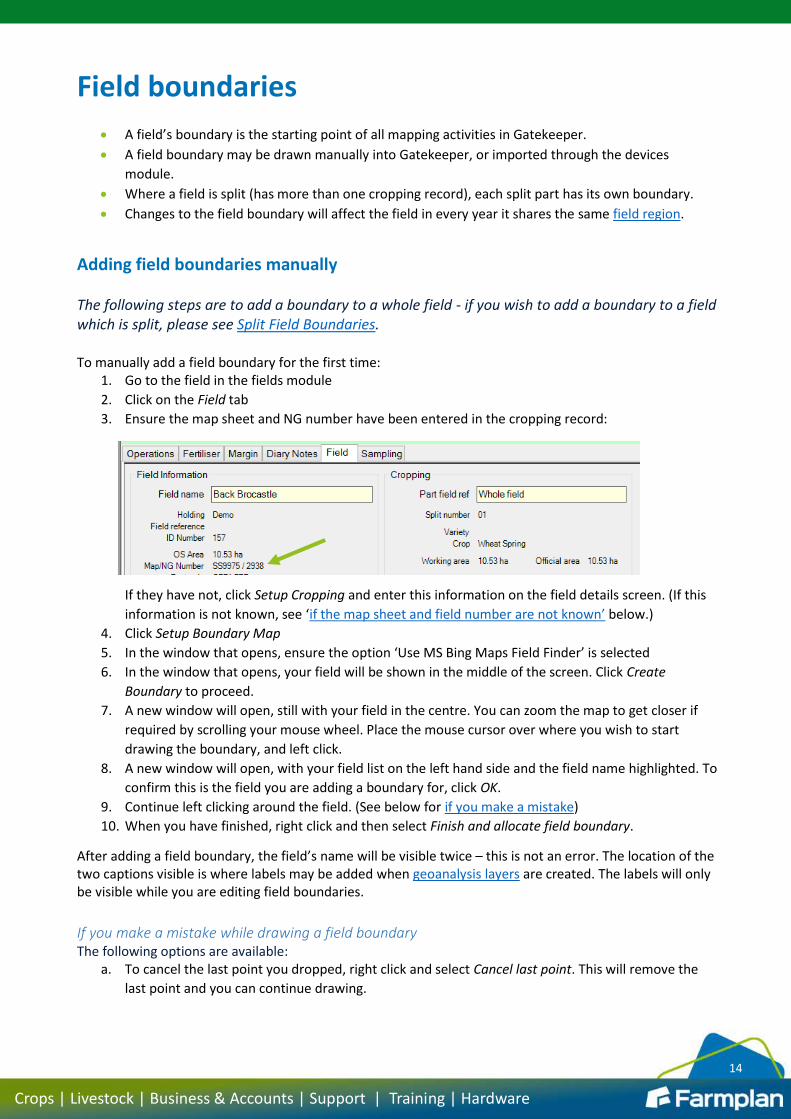
3. Ensure the map sheet and NG number have been entered in the cropping record:
If they have not, click Setup Cropping and enter this information on the field details screen. (If this
information is not known, see ‘if the map sheet and field number are not known’ below.)
4. Click Setup Boundary Map
5. In the window that opens, ensure the option ‘Use MS Bing Maps Field Finder’ is selected
6. In the window that opens, your field will be shown in the middle of the screen. Click Create
Boundary to proceed.
7. A new window will open, still with your field in the centre. You can zoom the map to get closer if
required by scrolling your mouse wheel. Place the mouse cursor over where you wish to start
drawing the boundary, and left click.
8. A new window will open, with your field list on the left hand side and the field name highlighted. To
confirm this is the field you are adding a boundary for, click OK.
9. Continue left clicking around the field. (See below for if you make a mistake)
10. When you have finished, right click and then select Finish and allocate field boundary.
After adding a field boundary, the field’s name will be visible twice – this is not an error. The location of the two captions visible is where labels may be added when geoanalysis layers are created. The labels will only be visible while you are editing field boundaries.
If you make a mistake while drawing a field boundary The following options are available:
a. To cancel the last point you dropped, right click and select Cancel last point. This will remove the
last point and you can continue drawing.
15
Crops | Livestock | Business & Accounts | Support | Training | Hardware
b. To cancel the last five points you dropped, right click and select Cancel last 5 points. This will
remove the last 5 points and you can continue drawing (or cancel the 5 before as well).
c. To cancel the edit completely and go back without saving any changes, right click and select Abort
this edit. This will not save any changes you have made, and you can start from the beginning.
d. Alternatively, if you have made a small mistake, continue drawing the boundary and finalise as per
the instructions. You can then use the point editing tools to correct your mistake once the
boundary is drawn.
If the map sheet and field number are not known, or the field is outside the UK Follow steps 1-5 as above. When you have completed step 5, the location of the field will not be displayed. Instead:
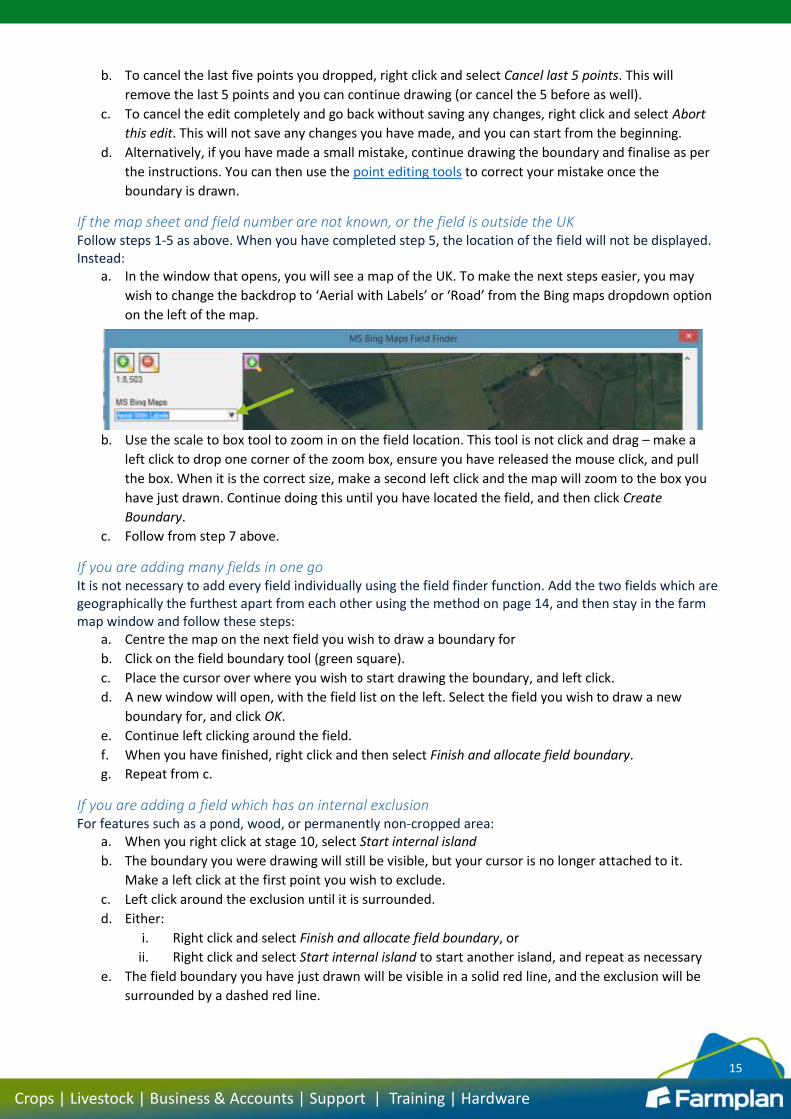
a. In the window that opens, you will see a map of the UK. To make the next steps easier, you may
wish to change the backdrop to ‘Aerial with Labels’ or ‘Road’ from the Bing maps dropdown option
on the left of the map.
b. Use the scale to box tool to zoom in on the field location. This tool is not click and drag – make a
left click to drop one corner of the zoom box, ensure you have released the mouse click, and pull
the box. When it is the correct size, make a second left click and the map will zoom to the box you
have just drawn. Continue doing this until you have located the field, and then click Create
Boundary.
c. Follow from step 7 above.
If you are adding many fields in one go It is not necessary to add every field individually using the field finder function. Add the two fields which are geographically the furthest apart from each other using the method on page 14, and then stay in the farm map window and follow these steps:
a. Centre the map on the next field you wish to draw a boundary for
b. Click on the field boundary tool (green square).
c. Place the cursor over where you wish to start drawing the boundary, and left click.
d. A new window will open, with the field list on the left. Select the field you wish to draw a new
boundary for, and click OK.
e. Continue left clicking around the field.
f. When you have finished, right click and then select Finish and allocate field boundary.
g. Repeat from c.
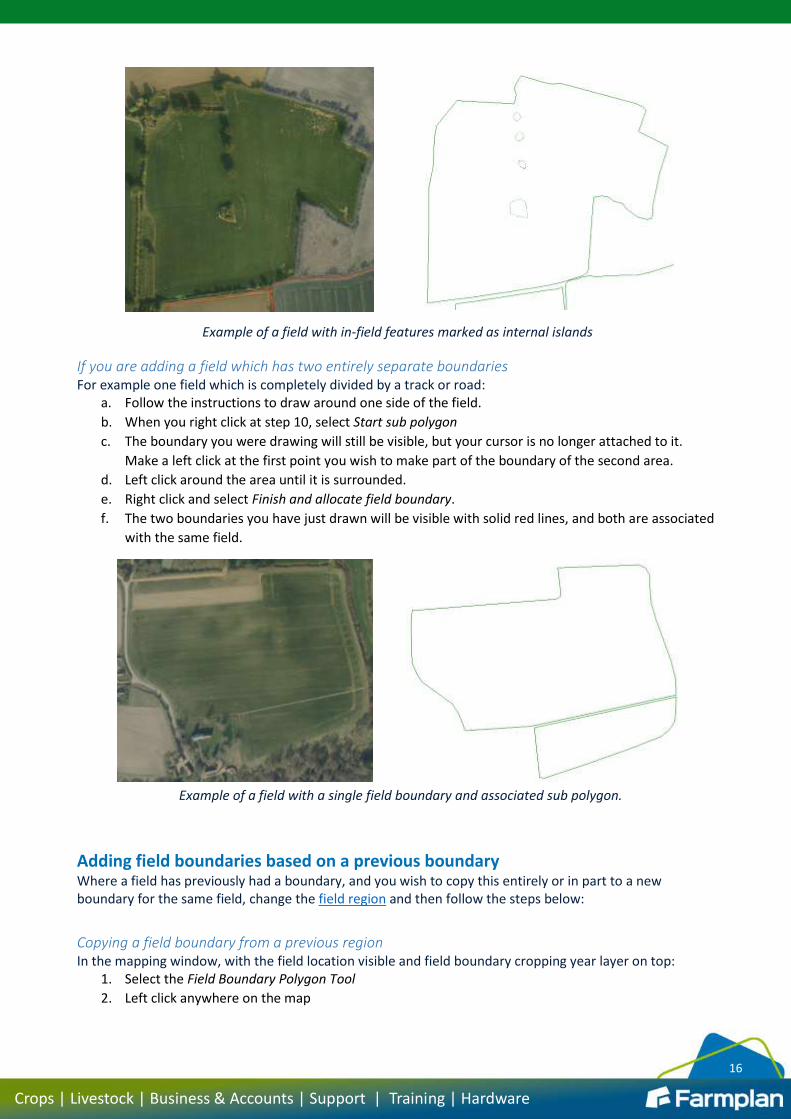
If you are adding a field which has an internal exclusion For features such as a pond, wood, or permanently non-cropped area:
a. When you right click at stage 10, select Start internal island
b. The boundary you were drawing will still be visible, but your cursor is no longer attached to it.
Make a left click at the first point you wish to exclude.
c. Left click around the exclusion until it is surrounded.
d. Either:
i. Right click and select Finish and allocate field boundary, or
ii. Right click and select Start internal island to start another island, and repeat as necessary
e. The field boundary you have just drawn will be visible in a solid red line, and the exclusion will be
surrounded by a dashed red line.
16
Crops | Livestock | Business & Accounts | Support | Training | Hardware
If you are adding a field which has two entirely separate boundaries For example one field which is completely divided by a track or road:
a. Follow the instructions to draw around one side of the field.
b. When you right click at step 10, select Start sub polygon
c. The boundary you were drawing will still be visible, but your cursor is no longer attached to it.
Make a left click at the first point you wish to make part of the boundary of the second area.
d. Left click around the area until it is surrounded.
e. Right click and select Finish and allocate field boundary.
f. The two boundaries you have just drawn will be visible with solid red lines, and both are associated
with the same field.
Adding field boundaries based on a previous boundary Where a field has previously had a boundary, and you wish to copy this entirely or in part to a new boundary for the same field, change the field region and then follow the steps below:
Copying a field boundary from a previous region In the mapping window, with the field location visible and field boundary cropping year layer on top:
1. Select the Field Boundary Polygon Tool
2. Left click anywhere on the map
Example of a field with in-field features marked as internal islands
Example of a field with a single field boundary and associated sub polygon.
17
Crops | Livestock | Business & Accounts | Support | Training | Hardware
3. In the screen that opens, select the field you wish to add a new boundary for
4. On the right of the screen, select the mode option Use Existing Region Boundary ‘Copy’
5. From the dropdown list, select the previous boundary to copy
6. Click OK
The field will now be visible again with the boundary copied from the previous region.
Importing field boundaries If you have the mapping module but not the precision actual module, you can import field boundaries in any of the following generic file format types:
CSV file
KML file
SHP file (using either WGS84 or OS co-ordinate projections)
If you have the precision actual or John Deere Devices module, you will be able to import field boundaries from your specific in-cab devices. For more information, please refer to the precision modules handbook. The steps below assume you have shape files to import. If you are using a different file type, you will just need to navigate to a different node at step 2. If you are using shape files, please be aware that ‘a shape file’ is always comprised of at least three separate files: a .shp file, a .shx file, and a .dbf file. You must have all three component files in order to be able to import a shape file. To import field boundaries:
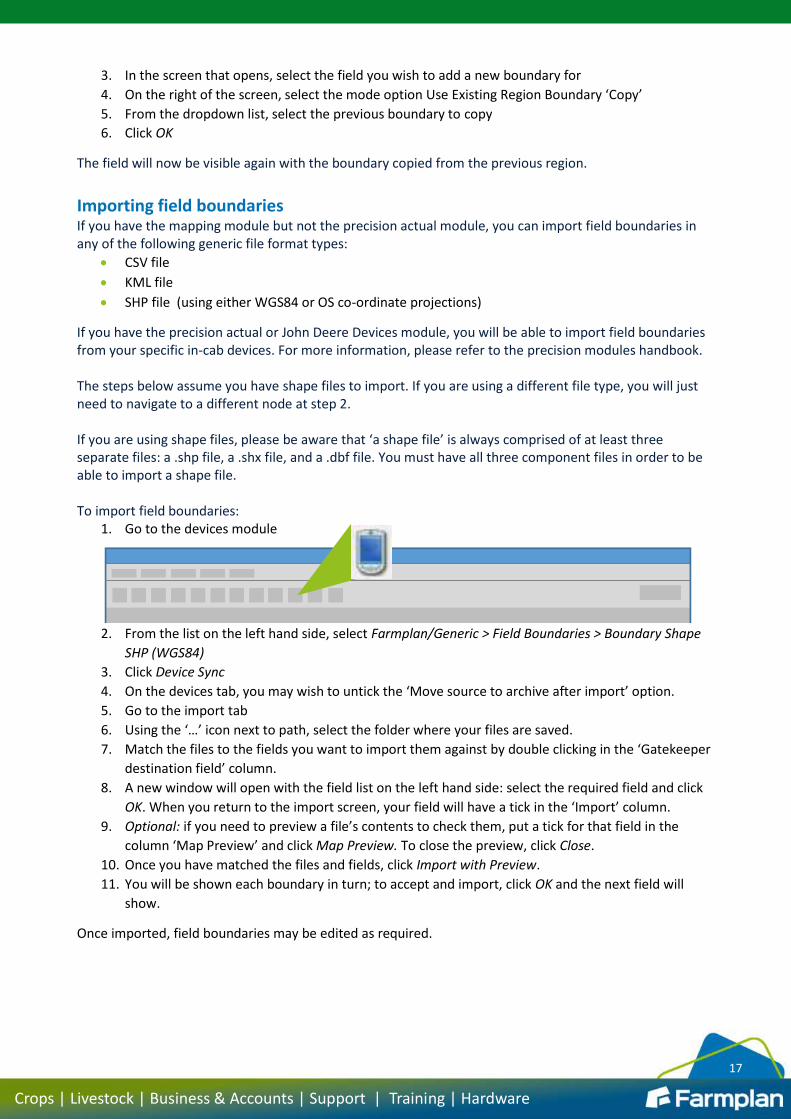
1. Go to the devices module
2. From the list on the left hand side, select Farmplan/Generic > Field Boundaries > Boundary Shape
SHP (WGS84)
3. Click Device Sync
4. On the devices tab, you may wish to untick the ‘Move source to archive after import’ option.
5. Go to the import tab
6. Using the ‘…’ icon next to path, select the folder where your files are saved.
7. Match the files to the fields you want to import them against by double clicking in the ‘Gatekeeper
destination field’ column.
8. A new window will open with the field list on the left hand side: select the required field and click
OK. When you return to the import screen, your field will have a tick in the ‘Import’ column.
9. Optional: if you need to preview a file’s contents to check them, put a tick for that field in the
column ‘Map Preview’ and click Map Preview. To close the preview, click Close.
10. Once you have matched the files and fields, click Import with Preview.
11. You will be shown each boundary in turn; to accept and import, click OK and the next field will
show.
Once imported, field boundaries may be edited as required.
18
Crops | Livestock | Business & Accounts | Support | Training | Hardware
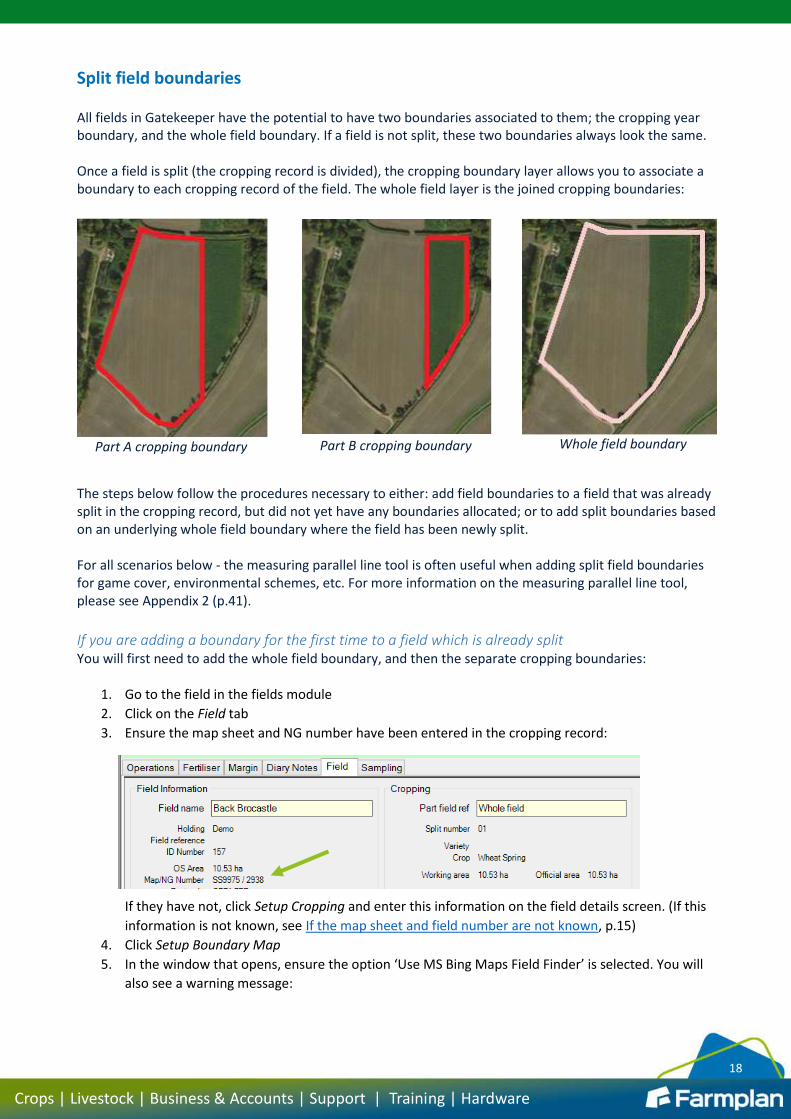
Split field boundaries All fields in Gatekeeper have the potential to have two boundaries associated to them; the cropping year boundary, and the whole field boundary. If a field is not split, these two boundaries always look the same. Once a field is split (the cropping record is divided), the cropping boundary layer allows you to associate a boundary to each cropping record of the field. The whole field layer is the joined cropping boundaries:
The steps below follow the procedures necessary to either: add field boundaries to a field that was already split in the cropping record, but did not yet have any boundaries allocated; or to add split boundaries based on an underlying whole field boundary where the field has been newly split. For all scenarios below - the measuring parallel line tool is often useful when adding split field boundaries for game cover, environmental schemes, etc. For more information on the measuring parallel line tool, please see Appendix 2 (p.41).
If you are adding a boundary for the first time to a field which is already split You will first need to add the whole field boundary, and then the separate cropping boundaries:
1. Go to the field in the fields module
2. Click on the Field tab
3. Ensure the map sheet and NG number have been entered in the cropping record:
If they have not, click Setup Cropping and enter this information on the field details screen. (If this
information is not known, see If the map sheet and field number are not known, p.15)
4. Click Setup Boundary Map
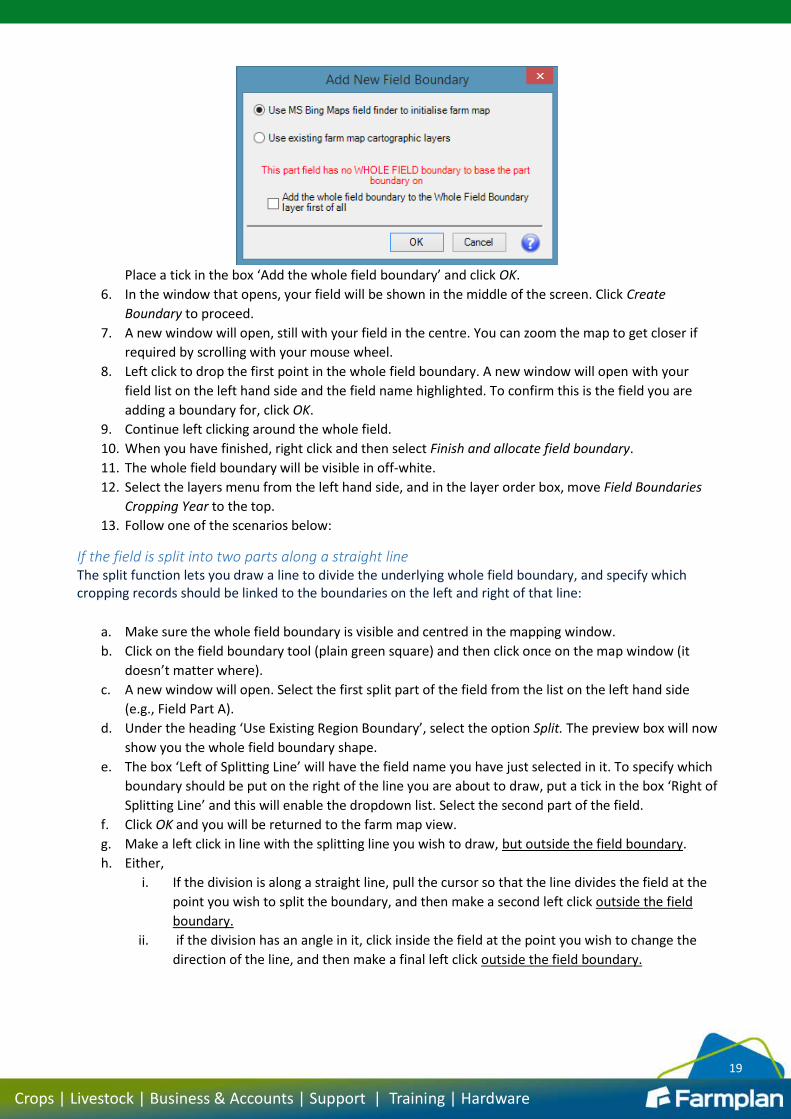
5. In the window that opens, ensure the option ‘Use MS Bing Maps Field Finder’ is selected. You will
also see a warning message:
Part A cropping boundary Part B cropping boundary Whole field boundary
19
Crops | Livestock | Business & Accounts | Support | Training | Hardware
Place a tick in the box ‘Add the whole field boundary’ and click OK.
6. In the window that opens, your field will be shown in the middle of the screen. Click Create
Boundary to proceed.
7. A new window will open, still with your field in the centre. You can zoom the map to get closer if
required by scrolling with your mouse wheel.
8. Left click to drop the first point in the whole field boundary. A new window will open with your
field list on the left hand side and the field name highlighted. To confirm this is the field you are
adding a boundary for, click OK.
9. Continue left clicking around the whole field.
10. When you have finished, right click and then select Finish and allocate field boundary.
11. The whole field boundary will be visible in off-white.
12. Select the layers menu from the left hand side, and in the layer order box, move Field Boundaries
Cropping Year to the top.
13. Follow one of the scenarios below:
If the field is split into two parts along a straight line The split function lets you draw a line to divide the underlying whole field boundary, and specify which cropping records should be linked to the boundaries on the left and right of that line:
a. Make sure the whole field boundary is visible and centred in the mapping window.
b. Click on the field boundary tool (plain green square) and then click once on the map window (it
doesn’t matter where).
c. A new window will open. Select the first split part of the field from the list on the left hand side
(e.g., Field Part A).
d. Under the heading ‘Use Existing Region Boundary’, select the option Split. The preview box will now
show you the whole field boundary shape.
e. The box ‘Left of Splitting Line’ will have the field name you have just selected in it. To specify which
boundary should be put on the right of the line you are about to draw, put a tick in the box ‘Right of
Splitting Line’ and this will enable the dropdown list. Select the second part of the field.
f. Click OK and you will be returned to the farm map view.
g. Make a left click in line with the splitting line you wish to draw, but outside the field boundary.
h. Either,
i. If the division is along a straight line, pull the cursor so that the line divides the field at the
point you wish to split the boundary, and then make a second left click outside the field
boundary.
ii. if the division has an angle in it, click inside the field at the point you wish to change the
direction of the line, and then make a final left click outside the field boundary.
20
Crops | Livestock | Business & Accounts | Support | Training | Hardware
i. Optional: if the splitting line is not quite in the right place, right click and select Drag splitting line to
final position. The line will be duplicated and move with your cursor, and you can drop it where you
want it to be.
j. Right click and select Split polygon along the line.
If the field is split into two parts, but the split function is not appropriate Where a field is split into two parts but it is not possible to use the splitting function to automatically divide the field based on a single drawn line, you can draw the two boundaries in manually. It may be useful to refer to the whole field boundary and use measuring tools to plot where split field boundaries are expected to be. The measuring lines can then be used to draw the split field boundaries.
If the field is split into three or more parts It is only possible to use the split function to assign one part of the field. The remaining parts must be drawn, but it is possible to copy underlying shapes and lines. If you wish to use the splitting line to allocate the main part of a field, follow the steps above but do not select a cropping record to use the other side of the splitting line in step 18. To free-draw a field boundary, follow the steps to manually add a field boundary on page 14. You may find it useful to use the line grabber function to copy the underlying parts of the whole field boundary that apply.
If a field has been split in previous cropping years At the time you split the cropping record (in the fields module, not the mapping module) you will be offered the change to re-use a previous field region and thereby associate any boundaries that are the same. For any split field parts which are a new shape, chose to add a new part field region to start with a clean sheet, and follow the appropriate steps above to add the new boundary.
21
Crops | Livestock | Business & Accounts | Support | Training | Hardware
Editing field boundaries Once a field boundary has been drawn or imported, it can be altered if required. It is essential to understand that changes made to a field boundary will affect that boundary across multiple cropping years, not just in the current cropping year. If you wish to make a change that only applies from this point forward, or to certain years only, you must change the field region before making any changes.
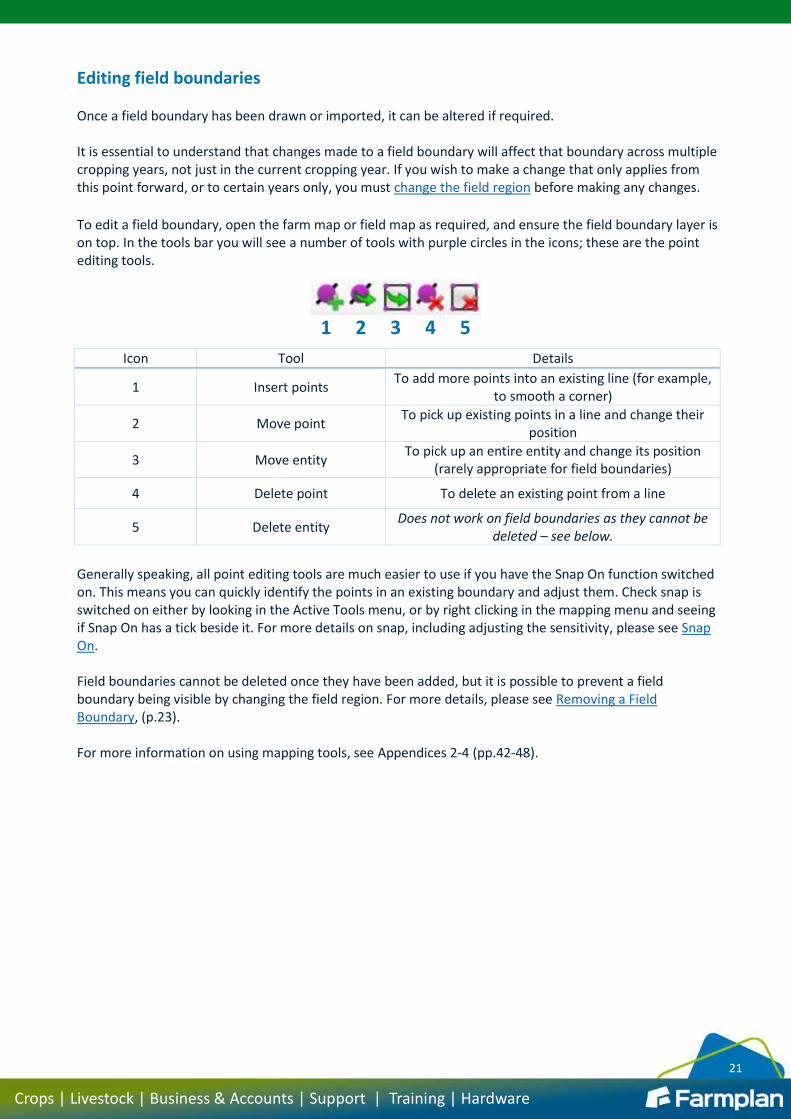
To edit a field boundary, open the farm map or field map as required, and ensure the field boundary layer is on top. In the tools bar you will see a number of tools with purple circles in the icons; these are the point editing tools.
Icon Tool Details
1 Insert points To add more points into an existing line (for example,
to smooth a corner)
2 Move point To pick up existing points in a line and change their
position
3 Move entity To pick up an entire entity and change its position
(rarely appropriate for field boundaries)
4 Delete point To delete an existing point from a line
5 Delete entity Does not work on field boundaries as they cannot be
deleted – see below.
Generally speaking, all point editing tools are much easier to use if you have the Snap On function switched on. This means you can quickly identify the points in an existing boundary and adjust them. Check snap is switched on either by looking in the Active Tools menu, or by right clicking in the mapping menu and seeing if Snap On has a tick beside it. For more details on snap, including adjusting the sensitivity, please see Snap On. Field boundaries cannot be deleted once they have been added, but it is possible to prevent a field boundary being visible by changing the field region. For more details, please see Removing a Field Boundary, (p.23). For more information on using mapping tools, see Appendices 2-4 (pp.42-48).
1 2 3 4 5
22
Crops | Livestock | Business & Accounts | Support | Training | Hardware
Field regions
The field region is what connects the boundary (shape of the field) to the cropping record (field
activities).
If you edit a field boundary, it will change in every year where the cropping record uses the same
field region.
If you wish to make a change to the field boundary that only applies to certain years, or from the
current year forwards, it is necessary to change the field region before making any changes.
It is the same process to follow if a field has previously been split into two parts and is split into two
different parts.
These steps must also be followed if you are importing new boundaries captured with precision
farming equipment and wish to update the boundaries in use.
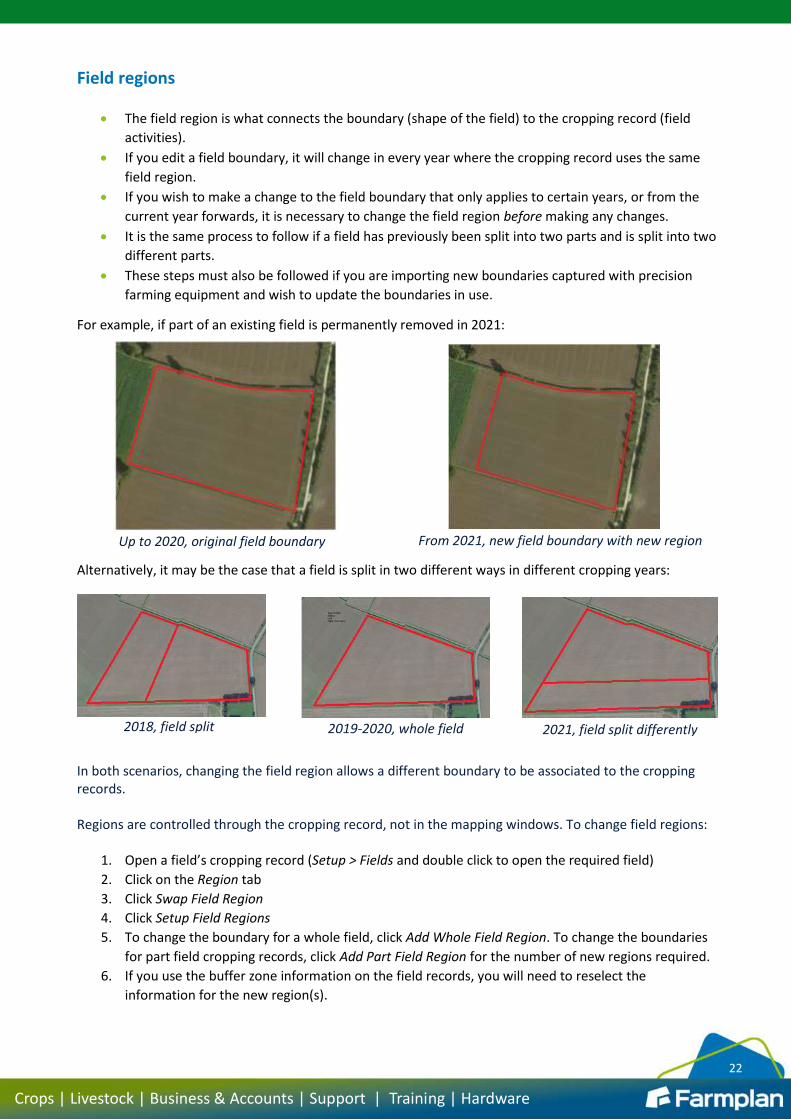
For example, if part of an existing field is permanently removed in 2021:
Alternatively, it may be the case that a field is split in two different ways in different cropping years:
In both scenarios, changing the field region allows a different boundary to be associated to the cropping records. Regions are controlled through the cropping record, not in the mapping windows. To change field regions:
1. Open a field’s cropping record (Setup > Fields and double click to open the required field)
2. Click on the Region tab
3. Click Swap Field Region
4. Click Setup Field Regions
5. To change the boundary for a whole field, click Add Whole Field Region. To change the boundaries
for part field cropping records, click Add Part Field Region for the number of new regions required.
6. If you use the buffer zone information on the field records, you will need to reselect the
information for the new region(s).
Up to 2020, original field boundary From 2021, new field boundary with new region
2018, field split 2019-2020, whole field 2021, field split differently
23
Crops | Livestock | Business & Accounts | Support | Training | Hardware
7. If you are setting up part field regions, you may wish to edit the letter assigned to the region so that
A and B are always the current field regions. To do this:
a. From the left hand side of the screen, click on the region currently labelled A.
b. In the ‘Part Field Reference’ box, change A (for example, make it ‘A2’, ‘A.’, or ‘A 2020’)
c. From the left hand side, click on the new region you wish to make A.
d. In the ‘Part Field Reference’ box, change the current region label to A.
e. Repeat for any other regions as required using B, C, D, etc.
8. Once you have the required region(s) set up, click OK from the next two screens.
9. Click OK to close the cropping record. On the field tab, the ‘Field Map’ button will now say ‘Setup
Boundary Map’. Click to add the new boundary, or import the boundary from a shape file (or, for
precision module users, GPS unit).
Removing a field boundary If you are changing the field region to remove a field boundary because you do not want a field to have a boundary or appear on any maps, use the same steps as above to remove the previous boundary, and do not add a new boundary.
24
Crops | Livestock | Business & Accounts | Support | Training | Hardware
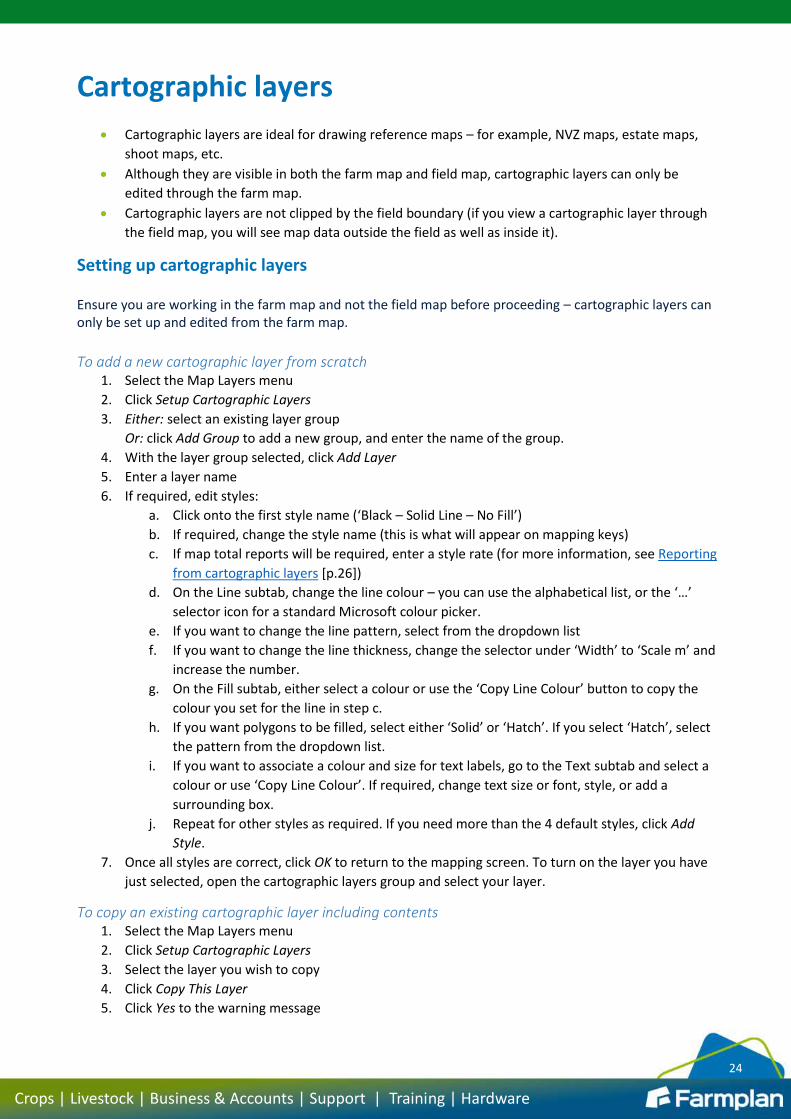
Cartographic layers
Cartographic layers are ideal for drawing reference maps – for example, NVZ maps, estate maps,
shoot maps, etc.
Although they are visible in both the farm map and field map, cartographic layers can only be
edited through the farm map.
Cartographic layers are not clipped by the field boundary (if you view a cartographic layer through
the field map, you will see map data outside the field as well as inside it).
Setting up cartographic layers Ensure you are working in the farm map and not the field map before proceeding – cartographic layers can only be set up and edited from the farm map.
To add a new cartographic layer from scratch 1. Select the Map Layers menu
2. Click Setup Cartographic Layers
3. Either: select an existing layer group
Or: click Add Group to add a new group, and enter the name of the group.
4. With the layer group selected, click Add Layer
5. Enter a layer name
6. If required, edit styles:
a. Click onto the first style name (‘Black – Solid Line – No Fill’)
b. If required, change the style name (this is what will appear on mapping keys)
c. If map total reports will be required, enter a style rate (for more information, see Reporting
from cartographic layers [p.26])
d. On the Line subtab, change the line colour – you can use the alphabetical list, or the ‘…’
selector icon for a standard Microsoft colour picker.
e. If you want to change the line pattern, select from the dropdown list
f. If you want to change the line thickness, change the selector under ‘Width’ to ‘Scale m’ and
increase the number.
g. On the Fill subtab, either select a colour or use the ‘Copy Line Colour’ button to copy the
colour you set for the line in step c.
h. If you want polygons to be filled, select either ‘Solid’ or ‘Hatch’. If you select ‘Hatch’, select
the pattern from the dropdown list.
i. If you want to associate a colour and size for text labels, go to the Text subtab and select a
colour or use ‘Copy Line Colour’. If required, change text size or font, style, or add a
surrounding box.
j. Repeat for other styles as required. If you need more than the 4 default styles, click Add
Style.
7. Once all styles are correct, click OK to return to the mapping screen. To turn on the layer you have
just selected, open the cartographic layers group and select your layer.
To copy an existing cartographic layer including contents 1. Select the Map Layers menu
2. Click Setup Cartographic Layers
3. Select the layer you wish to copy
4. Click Copy This Layer
5. Click Yes to the warning message
25
Crops | Livestock | Business & Accounts | Support | Training | Hardware
6. The layer will be duplicated, with the name ‘Copy of [original layer name]’.
7. Click OK to save and close the setup screen. The layer created will be visible in the cartographic
layers groups.
To copy existing cartographic layer styles into a new, blank, cartographic layer 1. Select the Map Layers menu
2. Click Setup Cartographic Layers
3. Select the layer containing styles you wish to copy
4. Click Add Blank Layer and Copy Styles
5. In the screen that opens, select the styles you wish to copy from the list on the left hand side. You
can select styles from different layers at this point
6. Click the single right facing blue arrow to select styles
7. Click OK to copy styles
8. A new layer with selected styles will be created. Change the layer group if necessary, and click OK
to return to the mapping screen.
Drawing onto cartographic layers
1. Ensure the layer you wish to draw on is turned on and at the top of the layer order. If you will want
to trace elements from another layer, ensure it is the second layer.
2. Open the active tools menu
3. Click on the tool you wish to use
4. Select the style you wish to draw with
5. Draw away, remembering the right click menu to finish or adjust entities.
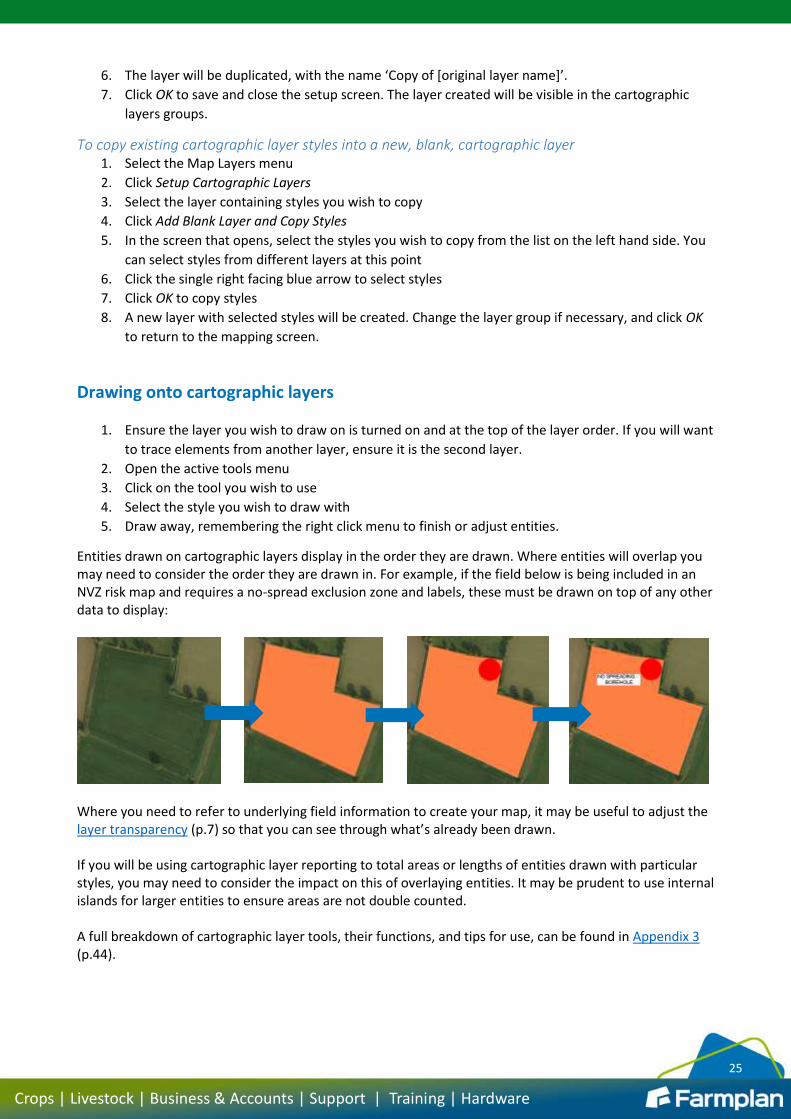
Entities drawn on cartographic layers display in the order they are drawn. Where entities will overlap you may need to consider the order they are drawn in. For example, if the field below is being included in an NVZ risk map and requires a no-spread exclusion zone and labels, these must be drawn on top of any other data to display:
Where you need to refer to underlying field information to create your map, it may be useful to adjust the layer transparency (p.7) so that you can see through what’s already been drawn. If you will be using cartographic layer reporting to total areas or lengths of entities drawn with particular styles, you may need to consider the impact on this of overlaying entities. It may be prudent to use internal islands for larger entities to ensure areas are not double counted. A full breakdown of cartographic layer tools, their functions, and tips for use, can be found in Appendix 3 (p.44).
26
Crops | Livestock | Business & Accounts | Support | Training | Hardware
Reporting from cartographic layers Cartographic layer reports can add up the length or area of entities drawn on them, broken down by style. To use this function, styles must be given a value:
1. Go to the map layers menu
2. Click Setup Cartographic Layers
3. Select the required layer and the first style
4. In the box ‘Rate used by the map report with totals option’, enter the value you wish to allocate to
the style. If you want the report to count length or area, enter a ‘1’. If you want the report to
calculate a point value (for example, points allocation of stewardship options), enter the points
value per whole unit (km or ha).
5. Repeat for each style
6. Click OK to save and close
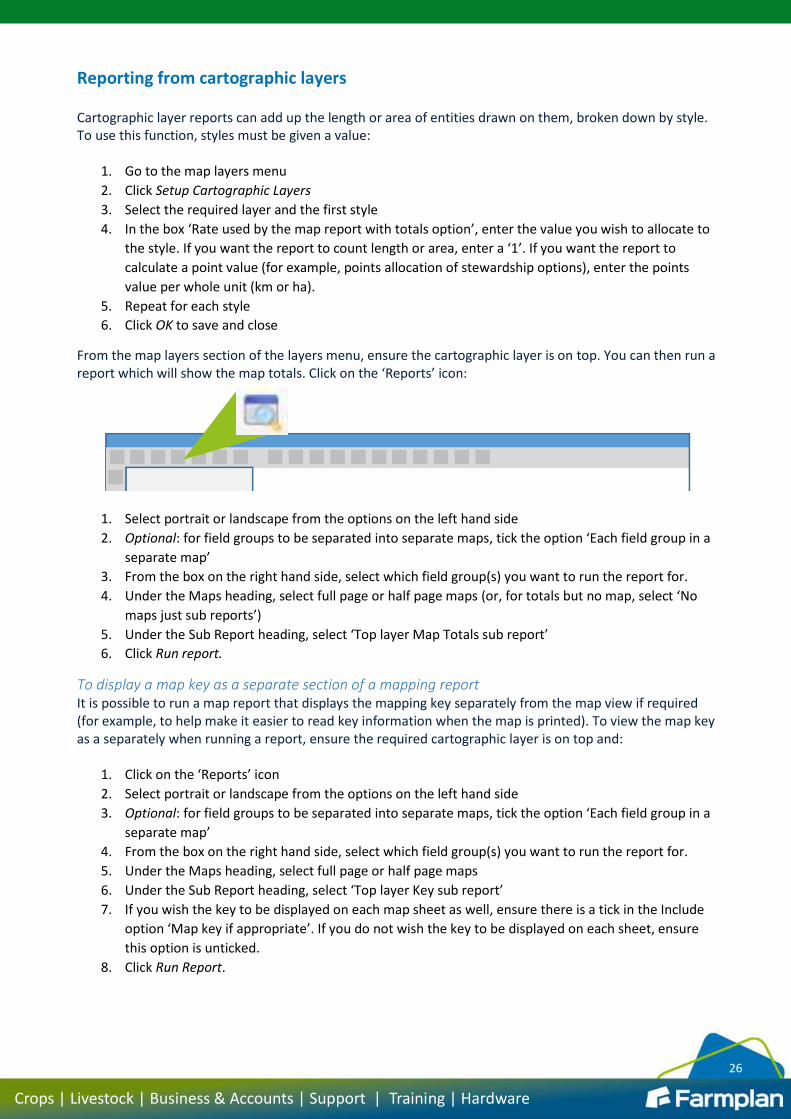
From the map layers section of the layers menu, ensure the cartographic layer is on top. You can then run a report which will show the map totals. Click on the ‘Reports’ icon:
1. Select portrait or landscape from the options on the left hand side
2. Optional: for field groups to be separated into separate maps, tick the option ‘Each field group in a
separate map’
3. From the box on the right hand side, select which field group(s) you want to run the report for.
4. Under the Maps heading, select full page or half page maps (or, for totals but no map, select ‘No
maps just sub reports’)
5. Under the Sub Report heading, select ‘Top layer Map Totals sub report’
6. Click Run report.
To display a map key as a separate section of a mapping report It is possible to run a map report that displays the mapping key separately from the map view if required (for example, to help make it easier to read key information when the map is printed). To view the map key as a separately when running a report, ensure the required cartographic layer is on top and:
1. Click on the ‘Reports’ icon
2. Select portrait or landscape from the options on the left hand side
3. Optional: for field groups to be separated into separate maps, tick the option ‘Each field group in a
separate map’
4. From the box on the right hand side, select which field group(s) you want to run the report for.
5. Under the Maps heading, select full page or half page maps
6. Under the Sub Report heading, select ‘Top layer Key sub report’
7. If you wish the key to be displayed on each map sheet as well, ensure there is a tick in the Include
option ‘Map key if appropriate’. If you do not wish the key to be displayed on each sheet, ensure
this option is unticked.
8. Click Run Report.
27
Crops | Livestock | Business & Accounts | Support | Training | Hardware
Importing information Mapping information provided in certain formats can be imported into the cartographic layers. Commonly this will be whole farm boundaries in a shapefile (sometimes released by the RPA or other regional agency), or ordnance survey map information. In addition, cartographic layer styles can be shared between Gatekeeper users. This includes the import of some ‘standard’ layer setups available for customers from the Farmplan support team, which have been designed to allow you to quickly add layers for data such as environmental schemes, footpath and drainage locations, and NVZ and manure management information.
Importing map data from a third party To import information onto a cartographic mapping layer, from the main Gatekeeper screen:
1. Go to Setup > Mapping > Import Map Data
2. Use the ‘…’ icon by the ‘Path’ line to select where the files are saved
3. From the dropdown list ‘File type’, select the data type to import. If you are importing OS tile data,
select ‘Shapefile using Ordnance Survey’.
4. The screen will fill under the ‘Data to Import’ heading. Put a tick in the Import column for each data
line you want to import.
5. Click Import. You will be shown each set of data in a map preview window. Click OK to accept each
time.
If you have multiple sets of data to import, you can choose to import the next set of data onto a new layer or onto the layer you have just created. If you wish to merge the new files onto an existing layer, at the point of import select ‘Merge layers by name’ from the Options box in the top right of the screen. To view the data imported, open the farm map window and select the layers menu. Your layers will now be under Cartographic Layer Groups > OS Open Data [or other group].
Importing cartographic layer styles or a published cartographic layer from another Gatekeeper user If you have been published cartographic layer data from another user, to import:
1. Open the publishing centre
2. Select the required publication to import (data type will be ‘Mapping Cartographic Layers’)
3. Click Import Published Data
4. Click Import Data
5. The published data will be shown in a preview screen. Click OK to import.
The published data will always be imported onto a new layer.
Exporting information It is possible to share cartographic layer styles, or the contents of a cartographic layer with another Gatekeeper user.
To export cartographic layer styles From the mapping screen and layers menu,
1. Click Setup Cartographic Layers
2. Select the layer which contains the styles you wish to publish (you must have the layer itself
selected, not a style)
3. Click Publish Styles
4. Select a recipient to publish to
28
Crops | Livestock | Business & Accounts | Support | Training | Hardware
5. Add a message if required
6. Click OK. Your publication will be sent the next time you synchronise or do a send and receive.
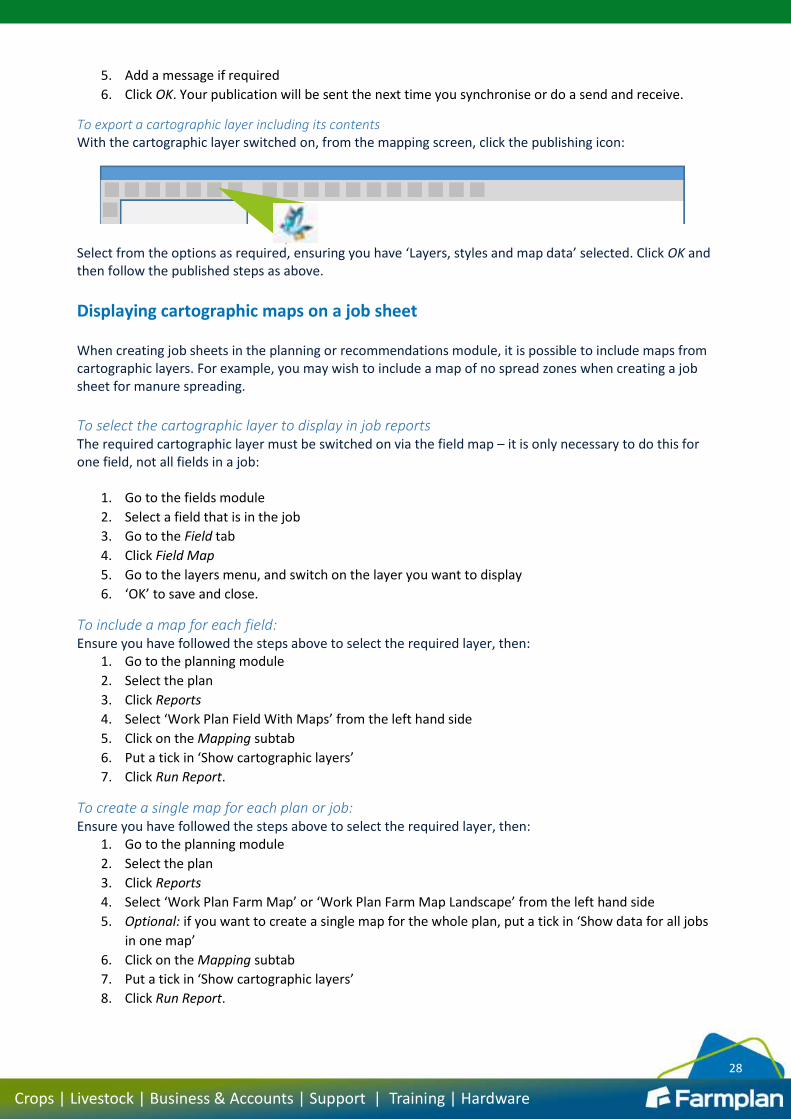
To export a cartographic layer including its contents With the cartographic layer switched on, from the mapping screen, click the publishing icon:
Select from the options as required, ensuring you have ‘Layers, styles and map data’ selected. Click OK and then follow the published steps as above.
Displaying cartographic maps on a job sheet When creating job sheets in the planning or recommendations module, it is possible to include maps from cartographic layers. For example, you may wish to include a map of no spread zones when creating a job sheet for manure spreading.
To select the cartographic layer to display in job reports The required cartographic layer must be switched on via the field map – it is only necessary to do this for one field, not all fields in a job:
1. Go to the fields module
2. Select a field that is in the job
3. Go to the Field tab
4. Click Field Map
5. Go to the layers menu, and switch on the layer you want to display
6. ‘OK’ to save and close.
To include a map for each field: Ensure you have followed the steps above to select the required layer, then:
1. Go to the planning module
2. Select the plan
3. Click Reports
4. Select ‘Work Plan Field With Maps’ from the left hand side
5. Click on the Mapping subtab
6. Put a tick in ‘Show cartographic layers’
7. Click Run Report.
To create a single map for each plan or job: Ensure you have followed the steps above to select the required layer, then:
1. Go to the planning module
2. Select the plan
3. Click Reports
4. Select ‘Work Plan Farm Map’ or ‘Work Plan Farm Map Landscape’ from the left hand side
5. Optional: if you want to create a single map for the whole plan, put a tick in ‘Show data for all jobs
in one map’
6. Click on the Mapping subtab
7. Put a tick in ‘Show cartographic layers’
8. Click Run Report.
29
Crops | Livestock | Business & Accounts | Support | Training | Hardware
Field zone layers
Field zone layers are ideal for recording field specific information – for example, soil types or areas
of weed infestation.
Field zone layers are split into two types. ‘All Years’ layers are available to the field throughout
different cropping years, while the contents of ‘Cropping Year’ layers are specific to the cropping
year they are entered against.
For users with the precision farming actual module or John Deere devices module, it is possible to
import zones collected on precision farming equipment, or provided by soil services providers, into
field zone layers.
For users with the precision farming target module or John Deere devices module, it is possible to
reference field zone layers using the target grid generator to create variable rate application maps.
Setting up field zone layers Field zones may be set up through the field map or farm map as required. However, as field zones must be connected to a field, anything you draw must be within a field boundary. There are a number of pre-existing field zone layers present in mapping, or you can add your own layers as required. The first time you use a layer, you must select what zones you wish to be able to use on each layer; the next time you return to the layer, it will already have those zones available for use.
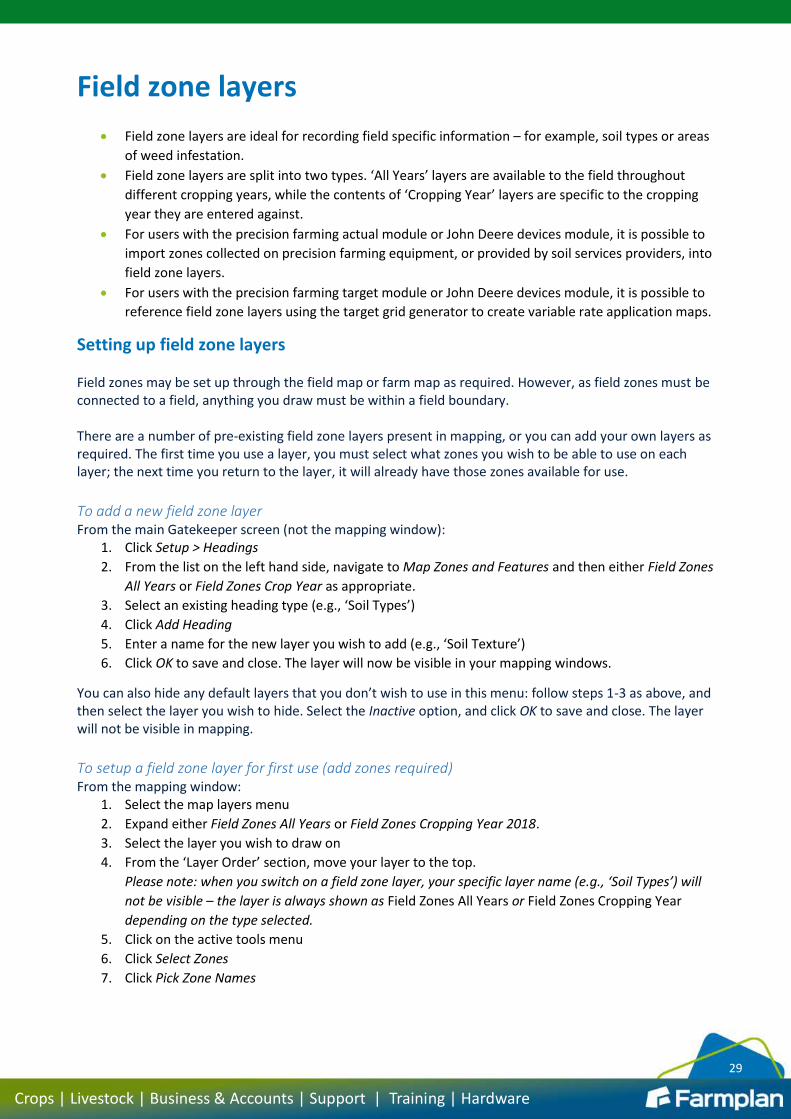
To add a new field zone layer From the main Gatekeeper screen (not the mapping window):
1. Click Setup > Headings
2. From the list on the left hand side, navigate to Map Zones and Features and then either Field Zones
All Years or Field Zones Crop Year as appropriate.
3. Select an existing heading type (e.g., ‘Soil Types’)
4. Click Add Heading
5. Enter a name for the new layer you wish to add (e.g., ‘Soil Texture’)
6. Click OK to save and close. The layer will now be visible in your mapping windows.
You can also hide any default layers that you don’t wish to use in this menu: follow steps 1-3 as above, and then select the layer you wish to hide. Select the Inactive option, and click OK to save and close. The layer will not be visible in mapping.
To setup a field zone layer for first use (add zones required) From the mapping window:
1. Select the map layers menu
2. Expand either Field Zones All Years or Field Zones Cropping Year 2018.
3. Select the layer you wish to draw on
4. From the ‘Layer Order’ section, move your layer to the top.
Please note: when you switch on a field zone layer, your specific layer name (e.g., ‘Soil Types’) will
not be visible – the layer is always shown as Field Zones All Years or Field Zones Cropping Year
depending on the type selected.
5. Click on the active tools menu
6. Click Select Zones
7. Click Pick Zone Names
30
Crops | Livestock | Business & Accounts | Support | Training | Hardware
8. In the screen that opens, click on the small ‘Group’ button on the top left hand corner. This will
divide the available zone types into groups.
9. Click on the plus next to zone groups to view the pre-set zone options. Then either:
a. If suitable, select the zones you wish to use and send them to the right of the screen using
the single blue right arrow, or
b. Setup additional zones:
i. Click Setup Zone Names
ii. Optional: Click Add Group to add an entirely new zone group
iii. Select the relevant group from the list on the left hand side
iv. Click Add Zone
v. Enter a zone name and if required, change the allocated colour
vi. Repeat as required
vii. Click OK to save and close
Select the zones you wish to use on the layer as in (a) above. 10. Click OK twice to close the zone setup screens.
Drawing onto field zone layers It is only possible to view one Field Zones All Years or Field Zones Cropping Year layer at a time. This means you cannot trace or copy entities directly from one Field Zones layer onto another. As you can export and import data from field zone layers, this may be a solution. Alternatively, if this is not suitable, it may be necessary to temporarily copy an entity from one field zones layer onto a cartographic layer, and then onto a different field zones layer. To draw onto a field zone layer:
1. Ensure the layer you wish to draw on is turned on and at the top of the layer order. If you will want
to copy entities from another layer, ensure it is the second layer.
2. Open the active tools menu
3. Click on the tool you wish to use
4. Select the style you wish to draw with
5. Draw away, remembering the right click menu to finish or adjust entities.
A full breakdown of field zone layer tools, their functions, and tips for use, can be found in Appendix 4 (p.47).
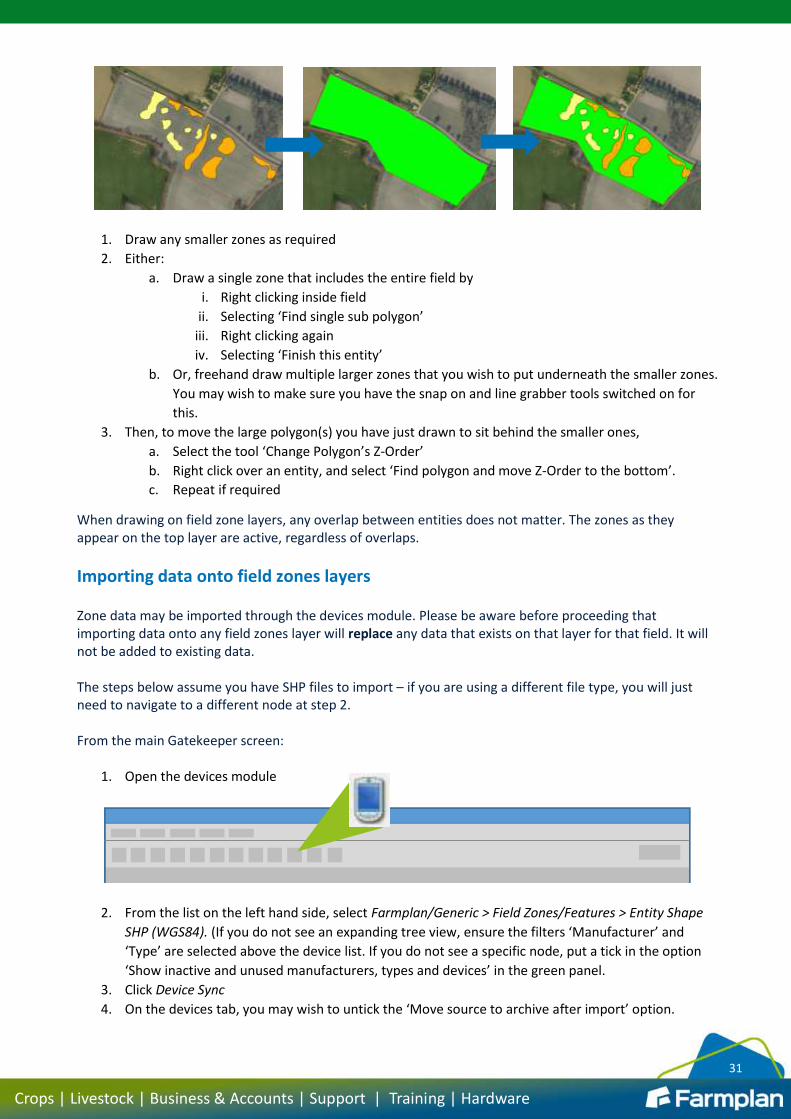
Adjusting the order of entities on a field zone layer Unlike with cartographic layers, entities drawn onto field zone layers can be re-ordered, so they do not need to be drawn in the order they will eventually appear. This functionality can be useful if you are tracing from a backdrop or imported image (for example, using the Bing backdrop to trace visible differences in soil), as it means you can start with the smaller details and fill the rest of the field in afterwards. For example:
31
Crops | Livestock | Business & Accounts | Support | Training | Hardware
1. Draw any smaller zones as required
2. Either:
a. Draw a single zone that includes the entire field by
i. Right clicking inside field
ii. Selecting ‘Find single sub polygon’
iii. Right clicking again
iv. Selecting ‘Finish this entity’
b. Or, freehand draw multiple larger zones that you wish to put underneath the smaller zones.
You may wish to make sure you have the snap on and line grabber tools switched on for
this.
3. Then, to move the large polygon(s) you have just drawn to sit behind the smaller ones,
a. Select the tool ‘Change Polygon’s Z-Order’
b. Right click over an entity, and select ‘Find polygon and move Z-Order to the bottom’.
c. Repeat if required
When drawing on field zone layers, any overlap between entities does not matter. The zones as they appear on the top layer are active, regardless of overlaps.
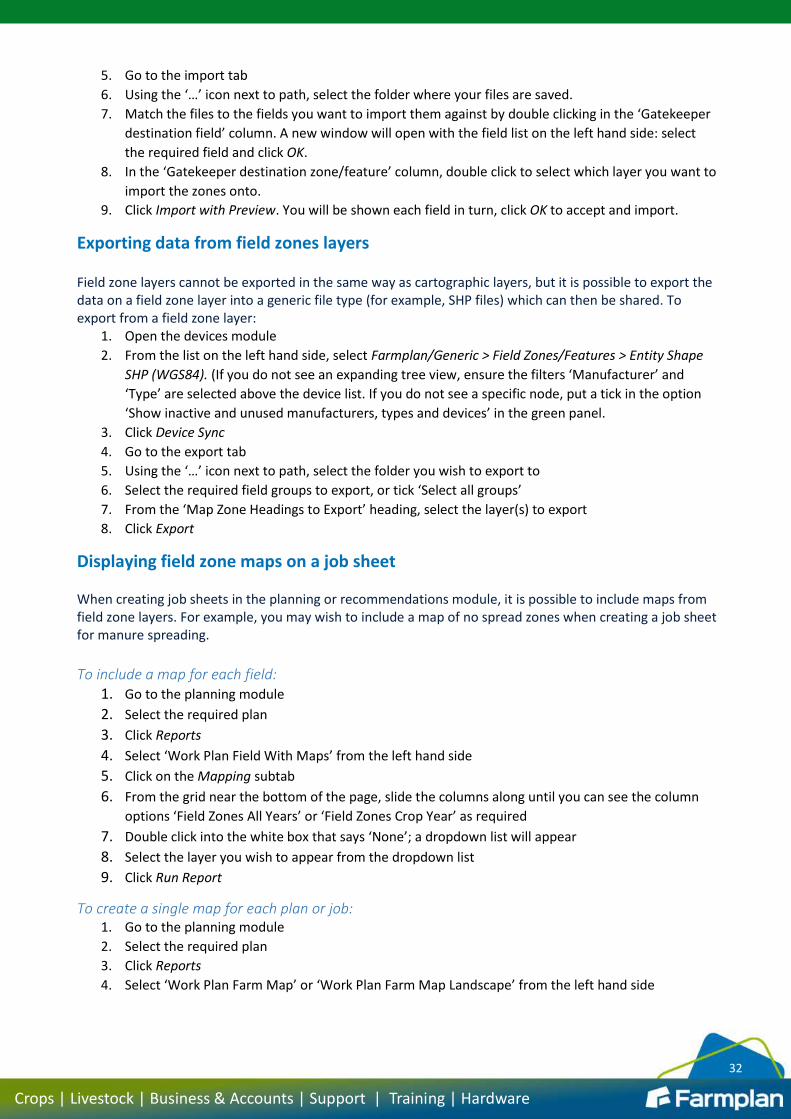
Importing data onto field zones layers Zone data may be imported through the devices module. Please be aware before proceeding that importing data onto any field zones layer will replace any data that exists on that layer for that field. It will not be added to existing data. The steps below assume you have SHP files to import – if you are using a different file type, you will just need to navigate to a different node at step 2. From the main Gatekeeper screen:
1. Open the devices module
2. From the list on the left hand side, select Farmplan/Generic > Field Zones/Features > Entity Shape
SHP (WGS84). (If you do not see an expanding tree view, ensure the filters ‘Manufacturer’ and
‘Type’ are selected above the device list. If you do not see a specific node, put a tick in the option
‘Show inactive and unused manufacturers, types and devices’ in the green panel.
3. Click Device Sync
4. On the devices tab, you may wish to untick the ‘Move source to archive after import’ option.
32
Crops | Livestock | Business & Accounts | Support | Training | Hardware
5. Go to the import tab
6. Using the ‘…’ icon next to path, select the folder where your files are saved.
7. Match the files to the fields you want to import them against by double clicking in the ‘Gatekeeper
destination field’ column. A new window will open with the field list on the left hand side: select
the required field and click OK.
8. In the ‘Gatekeeper destination zone/feature’ column, double click to select which layer you want to
import the zones onto.
9. Click Import with Preview. You will be shown each field in turn, click OK to accept and import.
Exporting data from field zones layers Field zone layers cannot be exported in the same way as cartographic layers, but it is possible to export the data on a field zone layer into a generic file type (for example, SHP files) which can then be shared. To export from a field zone layer:
1. Open the devices module
2. From the list on the left hand side, select Farmplan/Generic > Field Zones/Features > Entity Shape
SHP (WGS84). (If you do not see an expanding tree view, ensure the filters ‘Manufacturer’ and
‘Type’ are selected above the device list. If you do not see a specific node, put a tick in the option
‘Show inactive and unused manufacturers, types and devices’ in the green panel.
3. Click Device Sync
4. Go to the export tab
5. Using the ‘…’ icon next to path, select the folder you wish to export to
6. Select the required field groups to export, or tick ‘Select all groups’
7. From the ‘Map Zone Headings to Export’ heading, select the layer(s) to export
8. Click Export
Displaying field zone maps on a job sheet When creating job sheets in the planning or recommendations module, it is possible to include maps from field zone layers. For example, you may wish to include a map of no spread zones when creating a job sheet for manure spreading.
To include a map for each field: 1. Go to the planning module
2. Select the required plan
3. Click Reports
4. Select ‘Work Plan Field With Maps’ from the left hand side
5. Click on the Mapping subtab
6. From the grid near the bottom of the page, slide the columns along until you can see the column
options ‘Field Zones All Years’ or ‘Field Zones Crop Year’ as required
7. Double click into the white box that says ‘None’; a dropdown list will appear
8. Select the layer you wish to appear from the dropdown list
9. Click Run Report
To create a single map for each plan or job: 1. Go to the planning module
2. Select the required plan
3. Click Reports
4. Select ‘Work Plan Farm Map’ or ‘Work Plan Farm Map Landscape’ from the left hand side
33
Crops | Livestock | Business & Accounts | Support | Training | Hardware
5. Optional: if you want to create a single map for the whole plan, put a tick in ‘Show data for all jobs
in one map’
6. Click on the Mapping subtab
7. From the grid near the bottom of the page, slide the columns along until you can see the column
options ‘Field Zones All Years’ or ‘Field Zones Crop Year’ as required
8. Double click into the white box that says ‘None’; a dropdown list will appear
9. Select the layer you wish to appear from the dropdown list
10. Click Run Report
34
Crops | Livestock | Business & Accounts | Support | Training | Hardware
Image layers
Image layers allow you to import an existing image file and position it on the farm map.
This can be useful for importing paper drainage map and identifying outfall positions, importing
drone images, or screenshots from other information sources.
Images imported are not clipped to field boundaries, so if you are importing multiple files you may
need to use multiple layers to avoid images overlapping (instructions below).
Compatible image file types are .jpeg, .tiff, .png, .bmp of reasonable size (over 50MB will not
import)
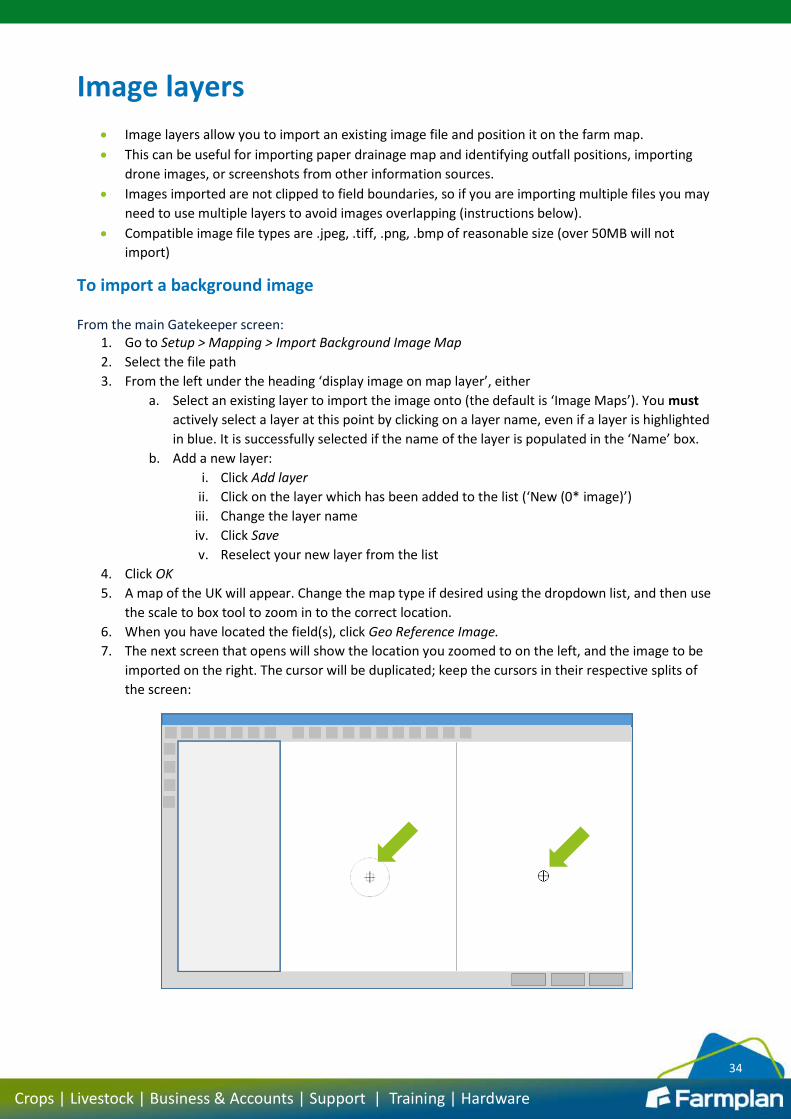
To import a background image From the main Gatekeeper screen:
1. Go to Setup > Mapping > Import Background Image Map
2. Select the file path
3. From the left under the heading ‘display image on map layer’, either
a. Select an existing layer to import the image onto (the default is ‘Image Maps’). You must
actively select a layer at this point by clicking on a layer name, even if a layer is highlighted
in blue. It is successfully selected if the name of the layer is populated in the ‘Name’ box.
b. Add a new layer:
i. Click Add layer
ii. Click on the layer which has been added to the list (‘New (0* image)’)
iii. Change the layer name
iv. Click Save
v. Reselect your new layer from the list
4. Click OK
5. A map of the UK will appear. Change the map type if desired using the dropdown list, and then use
the scale to box tool to zoom in to the correct location.
6. When you have located the field(s), click Geo Reference Image.
7. The next screen that opens will show the location you zoomed to on the left, and the image to be
imported on the right. The cursor will be duplicated; keep the cursors in their respective splits of
the screen:
35
Crops | Livestock | Business & Accounts | Support | Training | Hardware
8. Using the right hand cursor in the right split screen, click on a reference point on the image.
Corners and distinct features make ideal reference points; ideally you want them to be on opposite
corners of the image. After you click, a purple circle will be visible on the image.
9. Using the left hand cursor in the left split screen (which now has a purple circle at the centre of the
crosshairs), click on the position of your reference point from step 8 on the map. This will leave a
purple circle on the map.
10. Using the right hand cursor in the right split screen, click on the second reference point. A purple
link now links the two reference points.
11. Using the left hand cursor on the left split screen, click on the second reference point. As soon as
you make this click, the image on the right hand side will be resized and rotated to match the two
sets of points.
12. Click OK – the screen will close.
13. To view the imported image, open the farm map module and go to the layers menu
14. Expand the ‘Image Maps’ section and turn on the layer you imported the image onto.
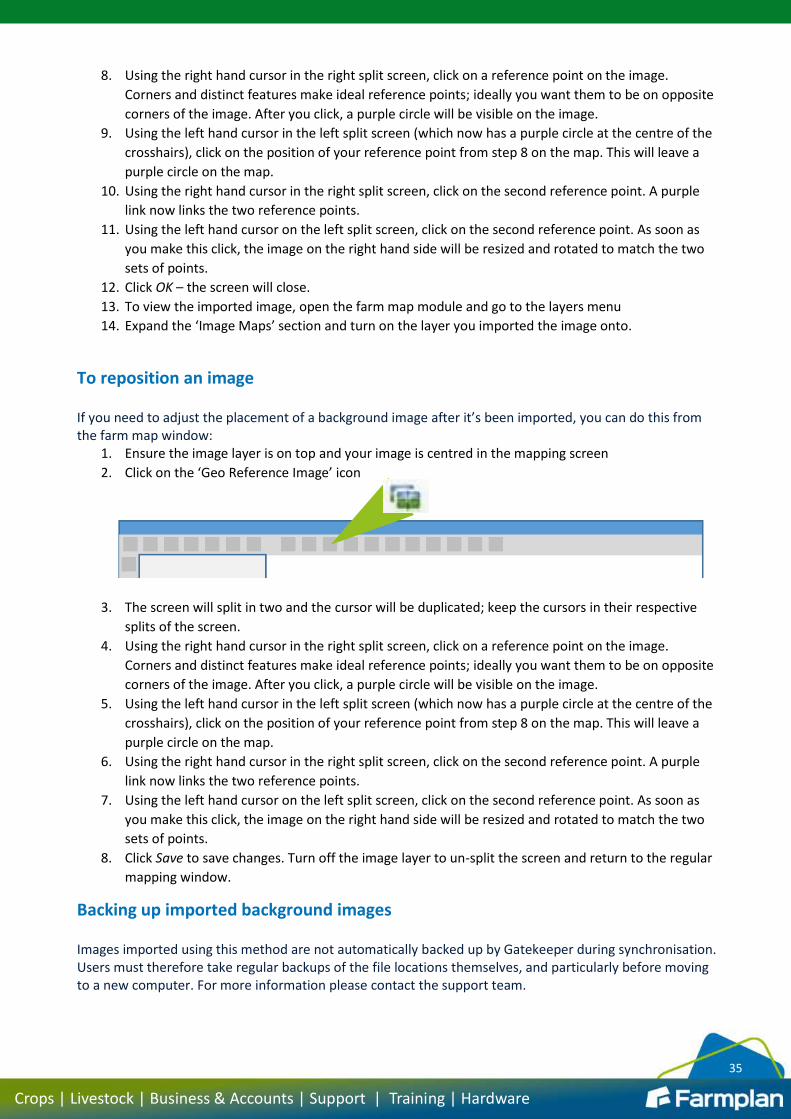
To reposition an image If you need to adjust the placement of a background image after it’s been imported, you can do this from the farm map window:
1. Ensure the image layer is on top and your image is centred in the mapping screen
2. Click on the ‘Geo Reference Image’ icon
3. The screen will split in two and the cursor will be duplicated; keep the cursors in their respective
splits of the screen.
4. Using the right hand cursor in the right split screen, click on a reference point on the image.
Corners and distinct features make ideal reference points; ideally you want them to be on opposite
corners of the image. After you click, a purple circle will be visible on the image.
5. Using the left hand cursor in the left split screen (which now has a purple circle at the centre of the
crosshairs), click on the position of your reference point from step 8 on the map. This will leave a
purple circle on the map.
6. Using the right hand cursor in the right split screen, click on the second reference point. A purple
link now links the two reference points.
7. Using the left hand cursor on the left split screen, click on the second reference point. As soon as
you make this click, the image on the right hand side will be resized and rotated to match the two
sets of points.
8. Click Save to save changes. Turn off the image layer to un-split the screen and return to the regular
mapping window.
Backing up imported background images Images imported using this method are not automatically backed up by Gatekeeper during synchronisation. Users must therefore take regular backups of the file locations themselves, and particularly before moving to a new computer. For more information please contact the support team.
36
Crops | Livestock | Business & Accounts | Support | Training | Hardware
Geoanalysis layers
Geoanalysis layers are designed to allow you to display information from the field record visually in
the mapping windows.
The link between the mapping window and field records for the geoanalysis layer is provided by the
field boundary – so field boundaries need to be present and correct before geoanalysis can be
used.
Creating a geoanalysis layer consists of three stages: creating a layer, creating a query (or linking to
an existing one), and running the query to populate the layer.
Geoanalysis layer ground rules There are two types of geoanalysis layer: geoanalysis auto, and geoanalysis user defined. The auto layers don’t require any set up, and can be switched on just by selecting them, but how they display cannot be edited. Geoanalysis user defined layers are custom, so you can specify how all parameters are displayed. If you also have the precision actual or John Deere devices modules, you can use the geoanalysis functionality to create whole farm versions of field or job maps – for example, a whole farm yield map. The link between field records and geoanalysis layers is not ‘live’ – if you make any changes to field data, you must rebuild any geoanalysis layers for this change to be updated in the maps. Similarly, if you make any changes to the geoanalysis queries, you must rebuild the layer to update the map. All geoanalysis layers are specific to the cropping year they are in. When you move into another cropping year, the layer will be visible but will have nothing on it until you build it for the first time in that year by rebuilding the layer. While it may feel like more work than expected to create a query, once you have it set up you can use it year after year, so it will save time in the long run!
Viewing a geoanalysis auto layer From the main farm map window:
1. Select the layers menu from the left hand side
2. Expand Geoanalysis Auto 2021
3. Select from the available layer options.
Creating a geoanalysis user defined layer Geoanalysis layers may be added in the farm map or field map, but are always generated for all fields (you cannot run a geoanalysis query on just one field). When a geoanalysis layer is created, you can specify a colour to fill the field, and add up to two captions per field. It is therefore possible for a geoanalysis layer to display three sets of information: one colour fill and two captions.
To add a new geoanalysis layer From either the farm map or field map window:
1. Select the geoanalysis menu from the left hand side
2. Click Add Layer
37
Crops | Livestock | Business & Accounts | Support | Training | Hardware
3. Enter a layer name
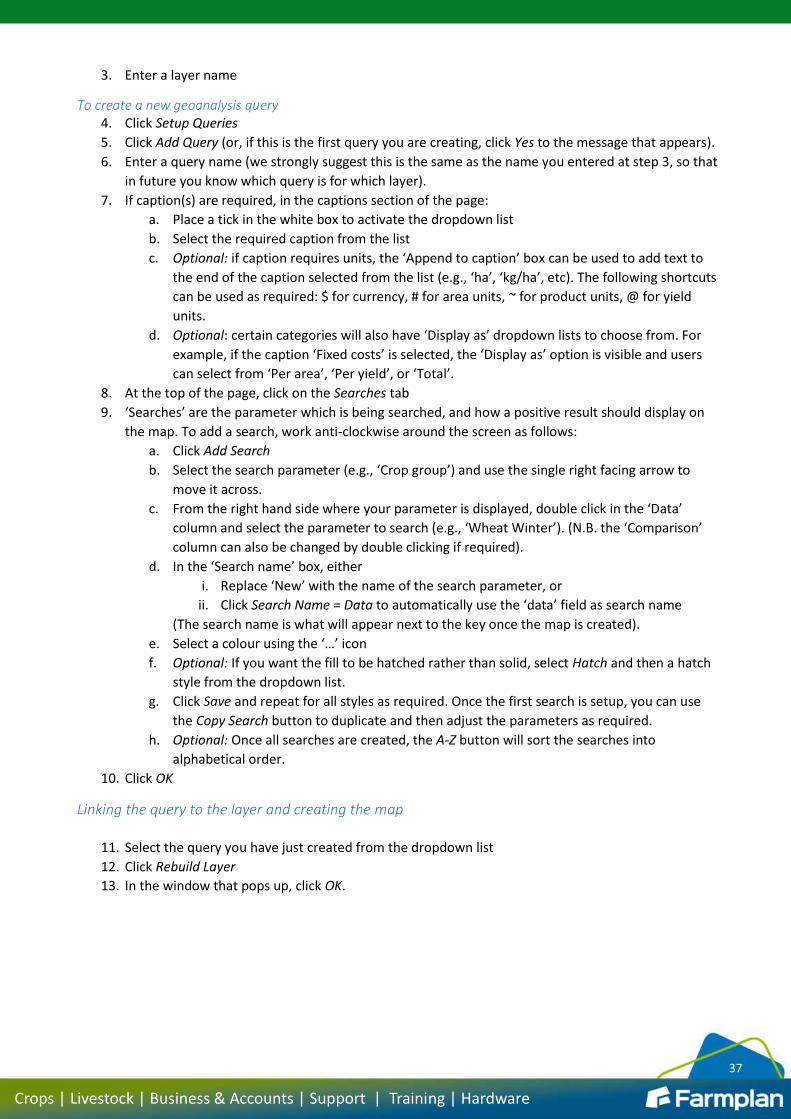
To create a new geoanalysis query 4. Click Setup Queries
5. Click Add Query (or, if this is the first query you are creating, click Yes to the message that appears).
6. Enter a query name (we strongly suggest this is the same as the name you entered at step 3, so that
in future you know which query is for which layer).
7. If caption(s) are required, in the captions section of the page:
a. Place a tick in the white box to activate the dropdown list
b. Select the required caption from the list
c. Optional: if caption requires units, the ‘Append to caption’ box can be used to add text to
the end of the caption selected from the list (e.g., ‘ha’, ‘kg/ha’, etc). The following shortcuts
can be used as required: $ for currency, # for area units, ~ for product units, @ for yield
units.
d. Optional: certain categories will also have ‘Display as’ dropdown lists to choose from. For
example, if the caption ‘Fixed costs’ is selected, the ‘Display as’ option is visible and users
can select from ‘Per area’, ‘Per yield’, or ‘Total’.
8. At the top of the page, click on the Searches tab
9. ‘Searches’ are the parameter which is being searched, and how a positive result should display on
the map. To add a search, work anti-clockwise around the screen as follows:
a. Click Add Search
b. Select the search parameter (e.g., ‘Crop group’) and use the single right facing arrow to
move it across.
c. From the right hand side where your parameter is displayed, double click in the ‘Data’
column and select the parameter to search (e.g., ‘Wheat Winter’). (N.B. the ‘Comparison’
column can also be changed by double clicking if required).
d. In the ‘Search name’ box, either
i. Replace ‘New’ with the name of the search parameter, or
ii. Click Search Name = Data to automatically use the ‘data’ field as search name
(The search name is what will appear next to the key once the map is created).
e. Select a colour using the ‘…’ icon
f. Optional: If you want the fill to be hatched rather than solid, select Hatch and then a hatch
style from the dropdown list.
g. Click Save and repeat for all styles as required. Once the first search is setup, you can use
the Copy Search button to duplicate and then adjust the parameters as required.
h. Optional: Once all searches are created, the A-Z button will sort the searches into
alphabetical order.
10. Click OK
Linking the query to the layer and creating the map
11. Select the query you have just created from the dropdown list
12. Click Rebuild Layer
13. In the window that pops up, click OK.
38
Crops | Livestock | Business & Accounts | Support | Training | Hardware
Sharing geoanalysis queries Geoanalysis layers cannot be shared between Gatekeeper sites, but the queries may be published and layers rebuilt on each site as required. Each site will display a geoanalysis layer based on the field records within that specific site, so using the same query does not guarantee exactly the same map will be created. To publish a geoanalysis query, from the main mapping window:
1. Ensure a geoanalysis layer is switched on
2. Go to the Geoanalysis menu
3. Click Setup Queries
4. Click Publish Query
5. Select publication recipient and add message if necessary
6. Click OK. Publication will be sent next time you synchronise or do a send/receive.
Appendix 1 – The mapping menus
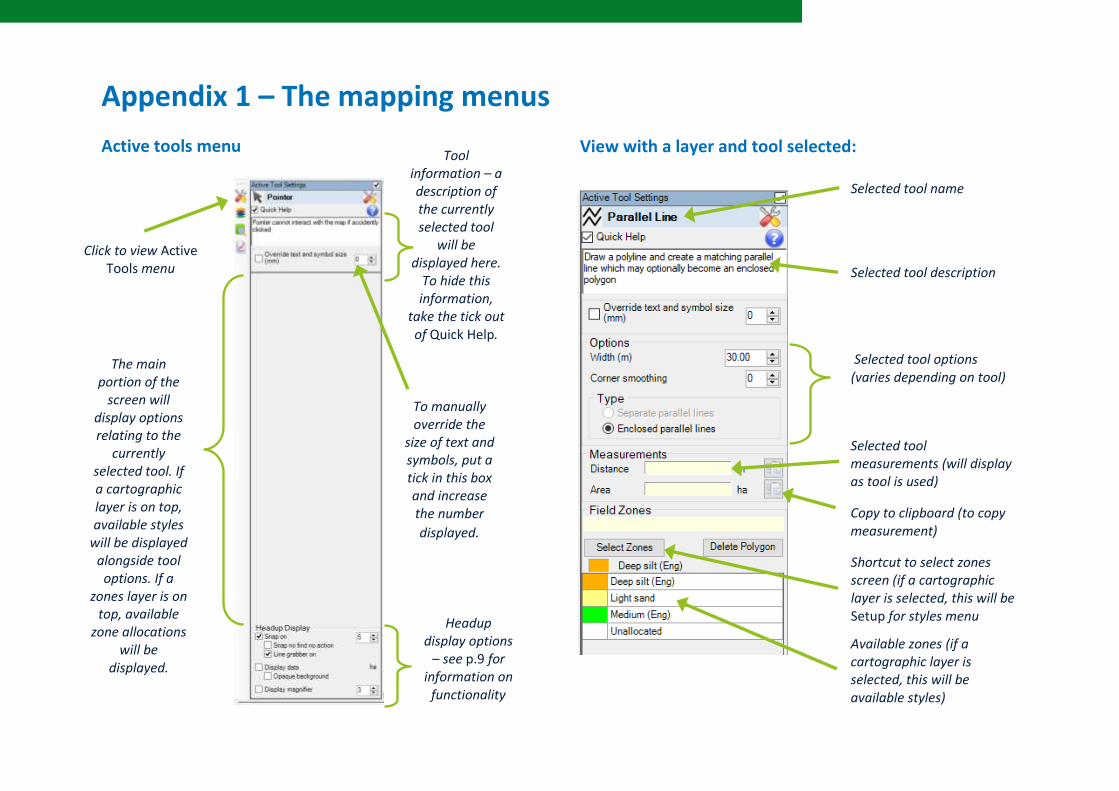
Active tools menu
Click to view Active Tools menu
Tool information – a description of the currently selected tool
will be displayed here.
To hide this information,
take the tick out of Quick Help.
To manually override the
size of text and symbols, put a tick in this box and increase the number
displayed.
The main portion of the
screen will display options relating to the
currently selected tool. If a cartographic layer is on top, available styles
will be displayed alongside tool
options. If a zones layer is on
top, available zone allocations
will be displayed.
Headup display options
– see p.9 for information on
functionality
View with a layer and tool selected:
Selected tool name
Selected tool description
Selected tool options (varies depending on tool)
Selected tool measurements (will display as tool is used)
Copy to clipboard (to copy measurement)
Shortcut to select zones screen (if a cartographic layer is selected, this will be Setup for styles menu
Available zones (if a cartographic layer is selected, this will be available styles)
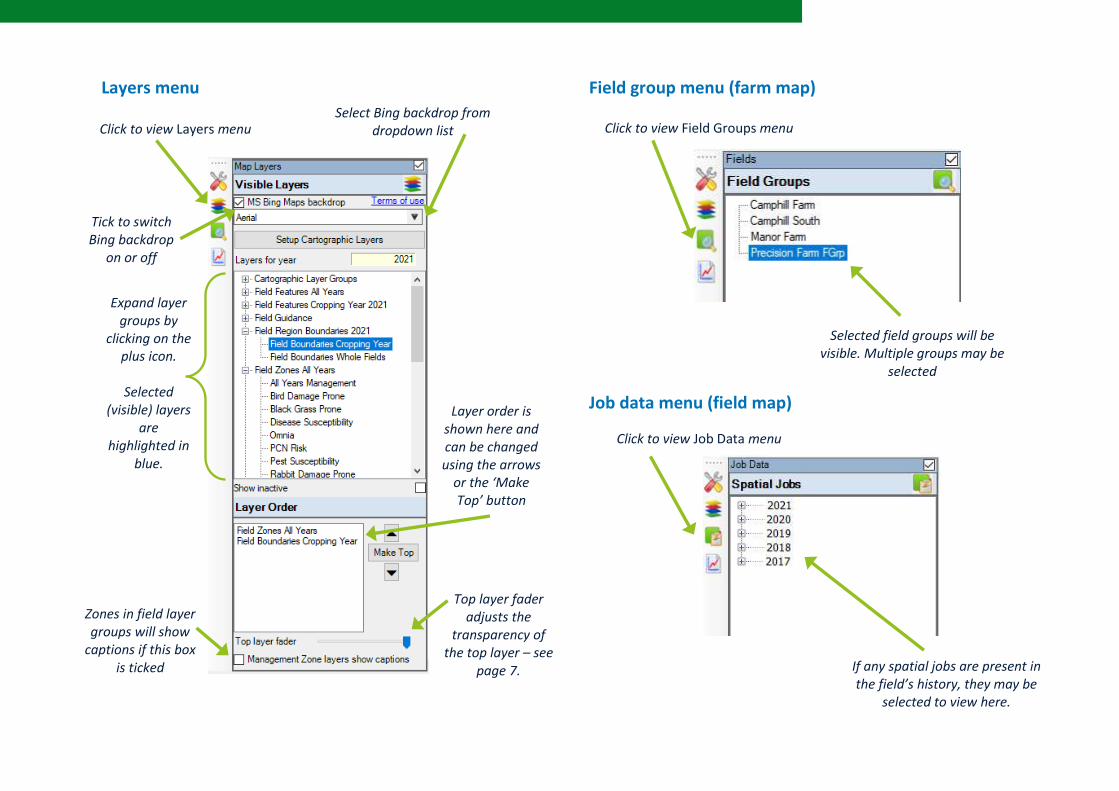
Layers menu
Field group menu (farm map)
Job data menu (field map)
Click to view Layers menu
Tick to switch Bing backdrop
on or off
Expand layer groups by
clicking on the plus icon.
Selected
(visible) layers are
highlighted in blue.
Select Bing backdrop from dropdown list
Layer order is shown here and can be changed using the arrows
or the ‘Make Top’ button
Top layer fader adjusts the
transparency of the top layer – see
page 7.
Zones in field layer groups will show
captions if this box is ticked
Click to view Field Groups menu
Selected field groups will be visible. Multiple groups may be
selected
Click to view Job Data menu
If any spatial jobs are present in the field’s history, they may be
selected to view here.
41
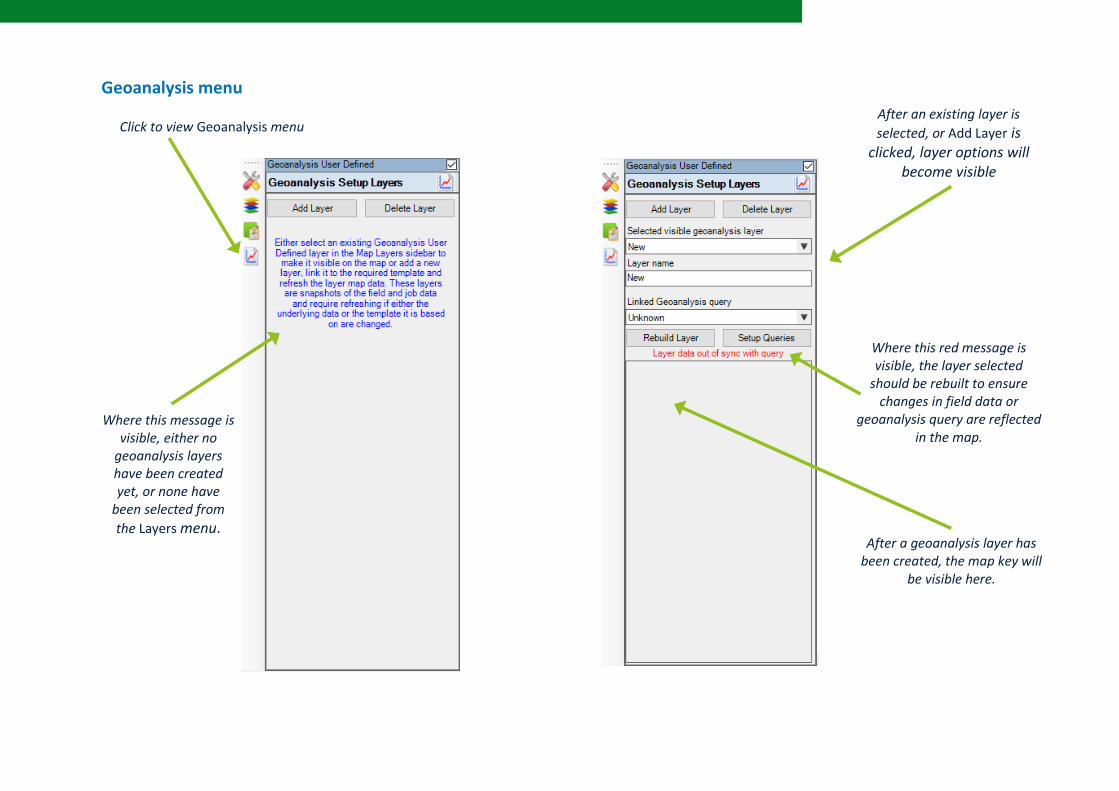
Geoanalysis menu
Click to view Geoanalysis menu
Where this message is visible, either no
geoanalysis layers have been created yet, or none have
been selected from
the Layers menu.
After an existing layer is
selected, or Add Layer is clicked, layer options will
become visible
Where this red message is visible, the layer selected
should be rebuilt to ensure changes in field data or
geoanalysis query are reflected in the map.
After a geoanalysis layer has been created, the map key will
be visible here.
42
Crops | Livestock | Business & Accounts | Support | Training | Hardware
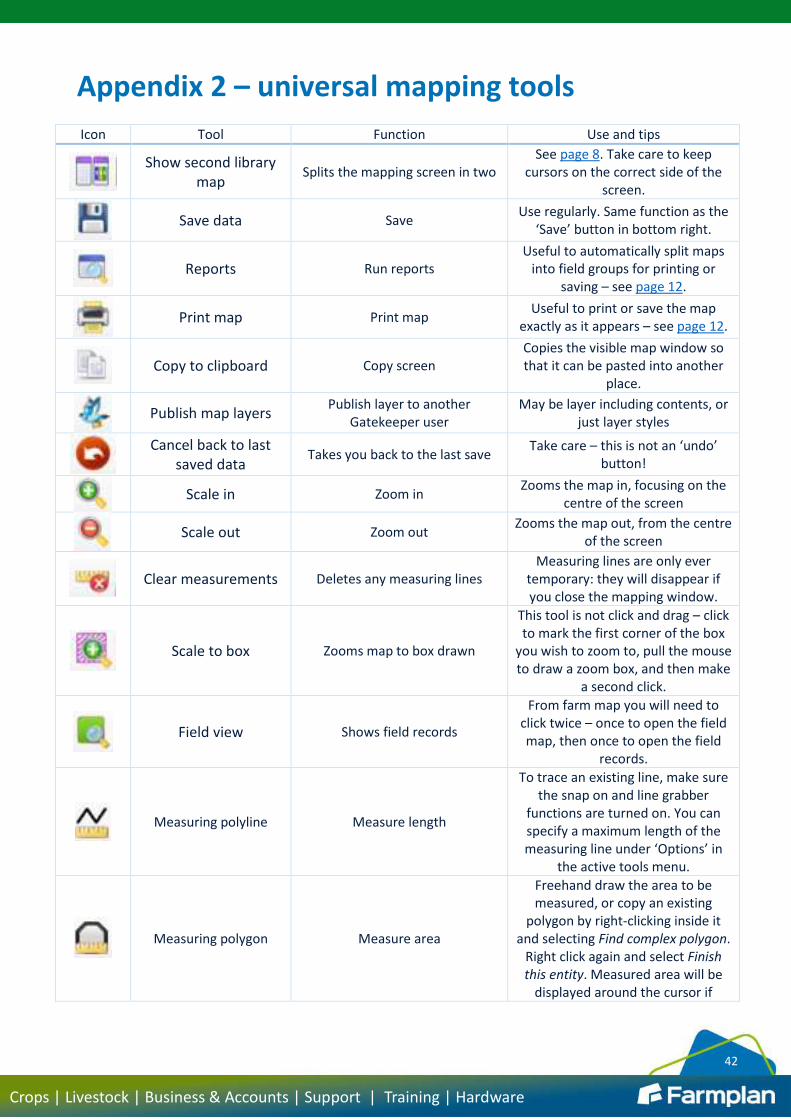
Appendix 2 – universal mapping tools Icon Tool Function Use and tips
Show second library map
Splits the mapping screen in two See page 8. Take care to keep
cursors on the correct side of the screen.
Save data Save
Use regularly. Same function as the ‘Save’ button in bottom right.
Reports Run reports
Useful to automatically split maps into field groups for printing or
saving – see page 12.
Print map Print map
Useful to print or save the map exactly as it appears – see page 12.
Copy to clipboard Copy screen
Copies the visible map window so that it can be pasted into another
place.
Publish map layers
Publish layer to another Gatekeeper user
May be layer including contents, or just layer styles
Cancel back to last saved data
Takes you back to the last save Take care – this is not an ‘undo’
button!
Scale in Zoom in
Zooms the map in, focusing on the centre of the screen
Scale out Zoom out
Zooms the map out, from the centre of the screen
Clear measurements Deletes any measuring lines
Measuring lines are only ever temporary: they will disappear if you close the mapping window.
Scale to box Zooms map to box drawn
This tool is not click and drag – click to mark the first corner of the box
you wish to zoom to, pull the mouse to draw a zoom box, and then make
a second click.
Field view Shows field records
From farm map you will need to click twice – once to open the field map, then once to open the field
records.
Measuring polyline Measure length
To trace an existing line, make sure the snap on and line grabber
functions are turned on. You can specify a maximum length of the measuring line under ‘Options’ in
the active tools menu.
Measuring polygon Measure area
Freehand draw the area to be measured, or copy an existing
polygon by right-clicking inside it and selecting Find complex polygon.
Right click again and select Finish this entity. Measured area will be
displayed around the cursor if
43
Crops | Livestock | Business & Accounts | Support | Training | Hardware
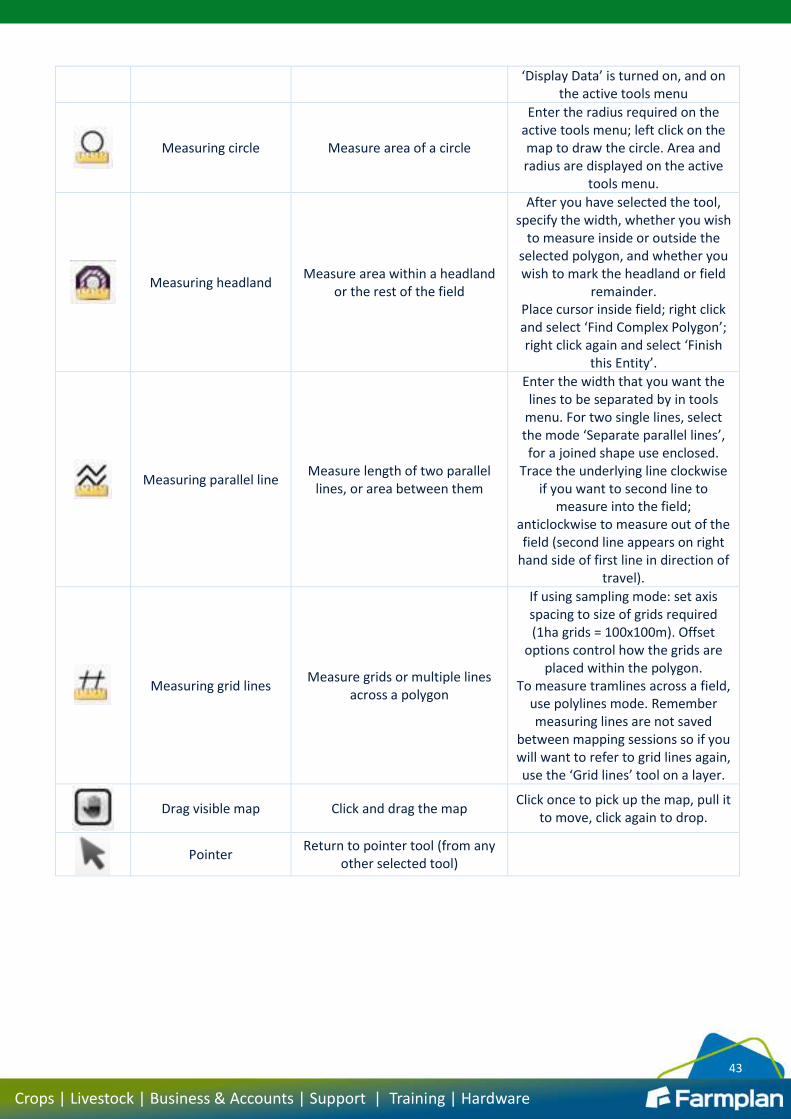
‘Display Data’ is turned on, and on the active tools menu
Measuring circle Measure area of a circle
Enter the radius required on the active tools menu; left click on the map to draw the circle. Area and radius are displayed on the active
tools menu.
Measuring headland
Measure area within a headland or the rest of the field
After you have selected the tool, specify the width, whether you wish
to measure inside or outside the selected polygon, and whether you wish to mark the headland or field
remainder. Place cursor inside field; right click and select ‘Find Complex Polygon’; right click again and select ‘Finish
this Entity’.
Measuring parallel line
Measure length of two parallel lines, or area between them
Enter the width that you want the lines to be separated by in tools
menu. For two single lines, select the mode ‘Separate parallel lines’, for a joined shape use enclosed.
Trace the underlying line clockwise if you want to second line to
measure into the field; anticlockwise to measure out of the field (second line appears on right
hand side of first line in direction of travel).
Measuring grid lines
Measure grids or multiple lines across a polygon
If using sampling mode: set axis spacing to size of grids required (1ha grids = 100x100m). Offset
options control how the grids are placed within the polygon.
To measure tramlines across a field, use polylines mode. Remember measuring lines are not saved
between mapping sessions so if you will want to refer to grid lines again, use the ‘Grid lines’ tool on a layer.
Drag visible map Click and drag the map
Click once to pick up the map, pull it to move, click again to drop.
Pointer
Return to pointer tool (from any other selected tool)
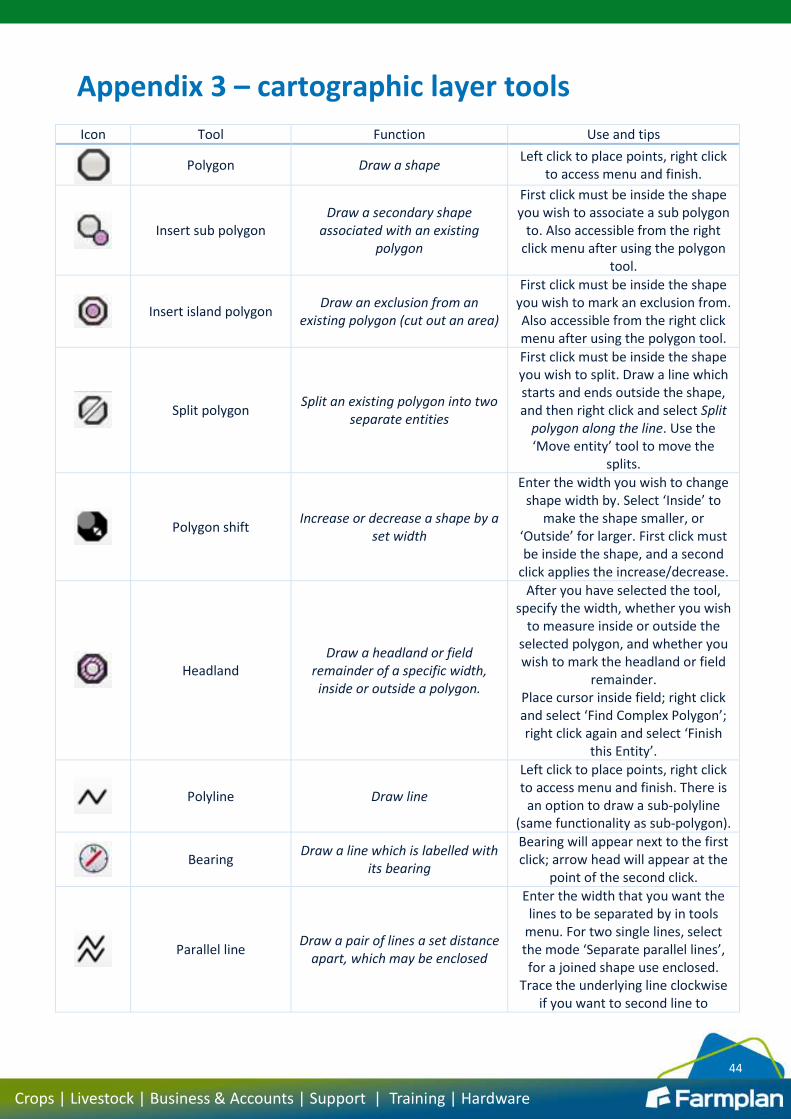
44
Crops | Livestock | Business & Accounts | Support | Training | Hardware
Appendix 3 – cartographic layer tools Icon Tool Function Use and tips
Polygon Draw a shape
Left click to place points, right click to access menu and finish.
Insert sub polygon
Draw a secondary shape associated with an existing
polygon
First click must be inside the shape you wish to associate a sub polygon
to. Also accessible from the right click menu after using the polygon
tool.
Insert island polygon
Draw an exclusion from an existing polygon (cut out an area)
First click must be inside the shape you wish to mark an exclusion from. Also accessible from the right click menu after using the polygon tool.
Split polygon
Split an existing polygon into two separate entities
First click must be inside the shape you wish to split. Draw a line which starts and ends outside the shape, and then right click and select Split
polygon along the line. Use the ‘Move entity’ tool to move the
splits.
Polygon shift
Increase or decrease a shape by a set width
Enter the width you wish to change shape width by. Select ‘Inside’ to
make the shape smaller, or ‘Outside’ for larger. First click must be inside the shape, and a second
click applies the increase/decrease.
Headland
Draw a headland or field remainder of a specific width, inside or outside a polygon.
After you have selected the tool, specify the width, whether you wish
to measure inside or outside the selected polygon, and whether you wish to mark the headland or field
remainder. Place cursor inside field; right click and select ‘Find Complex Polygon’; right click again and select ‘Finish
this Entity’.
Polyline Draw line
Left click to place points, right click to access menu and finish. There is
an option to draw a sub-polyline (same functionality as sub-polygon).
Bearing
Draw a line which is labelled with its bearing
Bearing will appear next to the first click; arrow head will appear at the
point of the second click.
Parallel line
Draw a pair of lines a set distance apart, which may be enclosed
Enter the width that you want the lines to be separated by in tools
menu. For two single lines, select the mode ‘Separate parallel lines’, for a joined shape use enclosed.
Trace the underlying line clockwise if you want to second line to
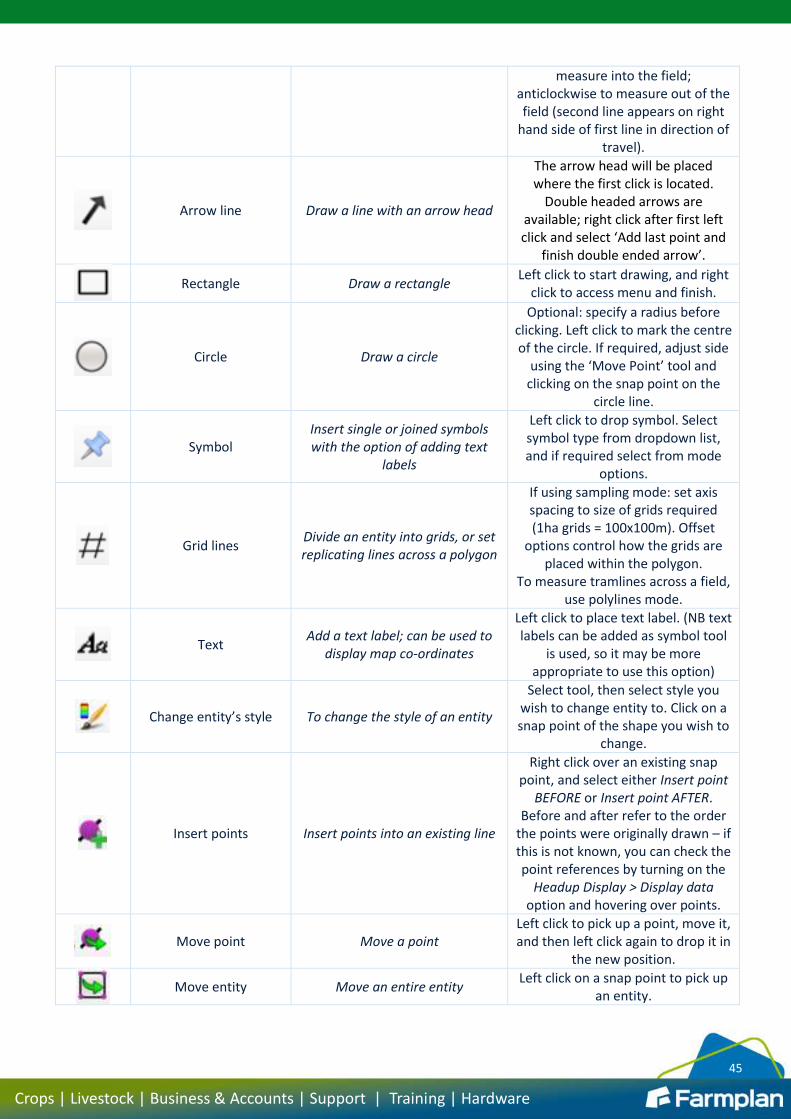
45
Crops | Livestock | Business & Accounts | Support | Training | Hardware
measure into the field; anticlockwise to measure out of the field (second line appears on right
hand side of first line in direction of travel).
Arrow line Draw a line with an arrow head
The arrow head will be placed where the first click is located.
Double headed arrows are available; right click after first left click and select ‘Add last point and
finish double ended arrow’.
Rectangle Draw a rectangle
Left click to start drawing, and right click to access menu and finish.
Circle Draw a circle
Optional: specify a radius before clicking. Left click to mark the centre of the circle. If required, adjust side
using the ‘Move Point’ tool and clicking on the snap point on the
circle line.
Symbol
Insert single or joined symbols with the option of adding text
labels
Left click to drop symbol. Select symbol type from dropdown list, and if required select from mode
options.
Grid lines
Divide an entity into grids, or set replicating lines across a polygon
If using sampling mode: set axis spacing to size of grids required (1ha grids = 100x100m). Offset
options control how the grids are placed within the polygon.
To measure tramlines across a field, use polylines mode.
Text
Add a text label; can be used to display map co-ordinates
Left click to place text label. (NB text labels can be added as symbol tool
is used, so it may be more appropriate to use this option)
Change entity’s style To change the style of an entity
Select tool, then select style you wish to change entity to. Click on a snap point of the shape you wish to
change.
Insert points Insert points into an existing line
Right click over an existing snap point, and select either Insert point
BEFORE or Insert point AFTER. Before and after refer to the order
the points were originally drawn – if this is not known, you can check the point references by turning on the
Headup Display > Display data option and hovering over points.
Move point Move a point
Left click to pick up a point, move it, and then left click again to drop it in
the new position.
Move entity Move an entire entity
Left click on a snap point to pick up an entity.
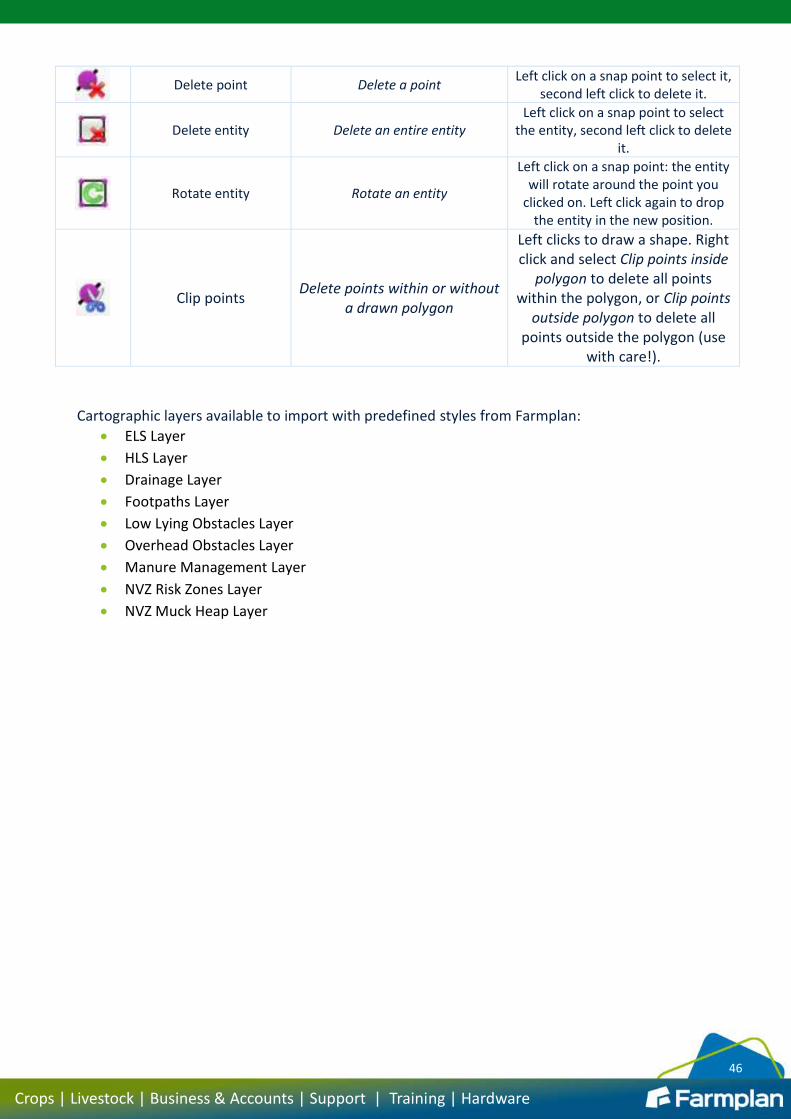
46
Crops | Livestock | Business & Accounts | Support | Training | Hardware
Delete point Delete a point
Left click on a snap point to select it, second left click to delete it.
Delete entity Delete an entire entity
Left click on a snap point to select the entity, second left click to delete
it.
Rotate entity Rotate an entity
Left click on a snap point: the entity will rotate around the point you
clicked on. Left click again to drop the entity in the new position.
Clip points
Delete points within or without a drawn polygon
Left clicks to draw a shape. Right click and select Clip points inside
polygon to delete all points within the polygon, or Clip points
outside polygon to delete all points outside the polygon (use
with care!).
Cartographic layers available to import with predefined styles from Farmplan:
ELS Layer
HLS Layer
Drainage Layer
Footpaths Layer
Low Lying Obstacles Layer
Overhead Obstacles Layer
Manure Management Layer
NVZ Risk Zones Layer
NVZ Muck Heap Layer
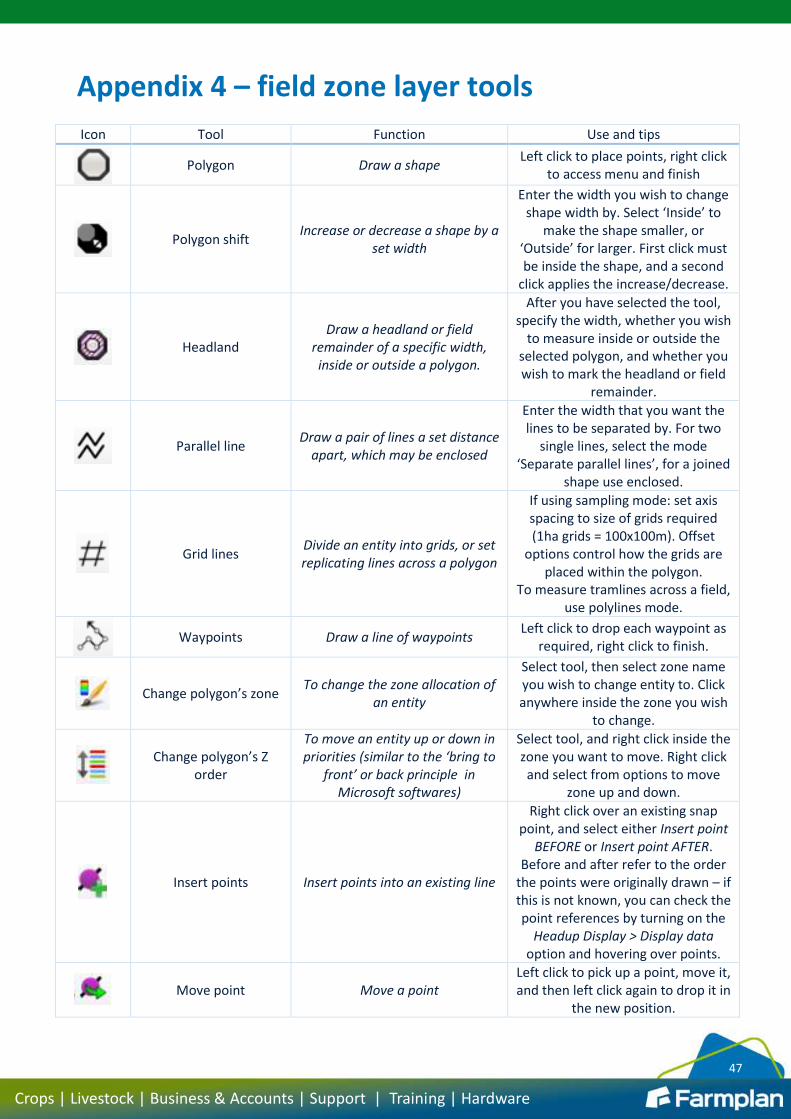
47
Crops | Livestock | Business & Accounts | Support | Training | Hardware
Appendix 4 – field zone layer tools Icon Tool Function Use and tips
Polygon Draw a shape
Left click to place points, right click to access menu and finish
Polygon shift
Increase or decrease a shape by a set width
Enter the width you wish to change shape width by. Select ‘Inside’ to
make the shape smaller, or ‘Outside’ for larger. First click must be inside the shape, and a second
click applies the increase/decrease.
Headland
Draw a headland or field remainder of a specific width, inside or outside a polygon.
After you have selected the tool, specify the width, whether you wish
to measure inside or outside the selected polygon, and whether you wish to mark the headland or field
remainder.
Parallel line
Draw a pair of lines a set distance apart, which may be enclosed
Enter the width that you want the lines to be separated by. For two
single lines, select the mode ‘Separate parallel lines’, for a joined
shape use enclosed.
Grid lines
Divide an entity into grids, or set replicating lines across a polygon
If using sampling mode: set axis spacing to size of grids required (1ha grids = 100x100m). Offset
options control how the grids are placed within the polygon.
To measure tramlines across a field, use polylines mode.
Waypoints Draw a line of waypoints
Left click to drop each waypoint as required, right click to finish.
Change polygon’s zone
To change the zone allocation of an entity
Select tool, then select zone name you wish to change entity to. Click anywhere inside the zone you wish
to change.
Change polygon’s Z order
To move an entity up or down in priorities (similar to the ‘bring to
front’ or back principle in Microsoft softwares)
Select tool, and right click inside the zone you want to move. Right click and select from options to move
zone up and down.
Insert points Insert points into an existing line
Right click over an existing snap point, and select either Insert point
BEFORE or Insert point AFTER. Before and after refer to the order
the points were originally drawn – if this is not known, you can check the point references by turning on the
Headup Display > Display data option and hovering over points.
Move point Move a point
Left click to pick up a point, move it, and then left click again to drop it in
the new position.
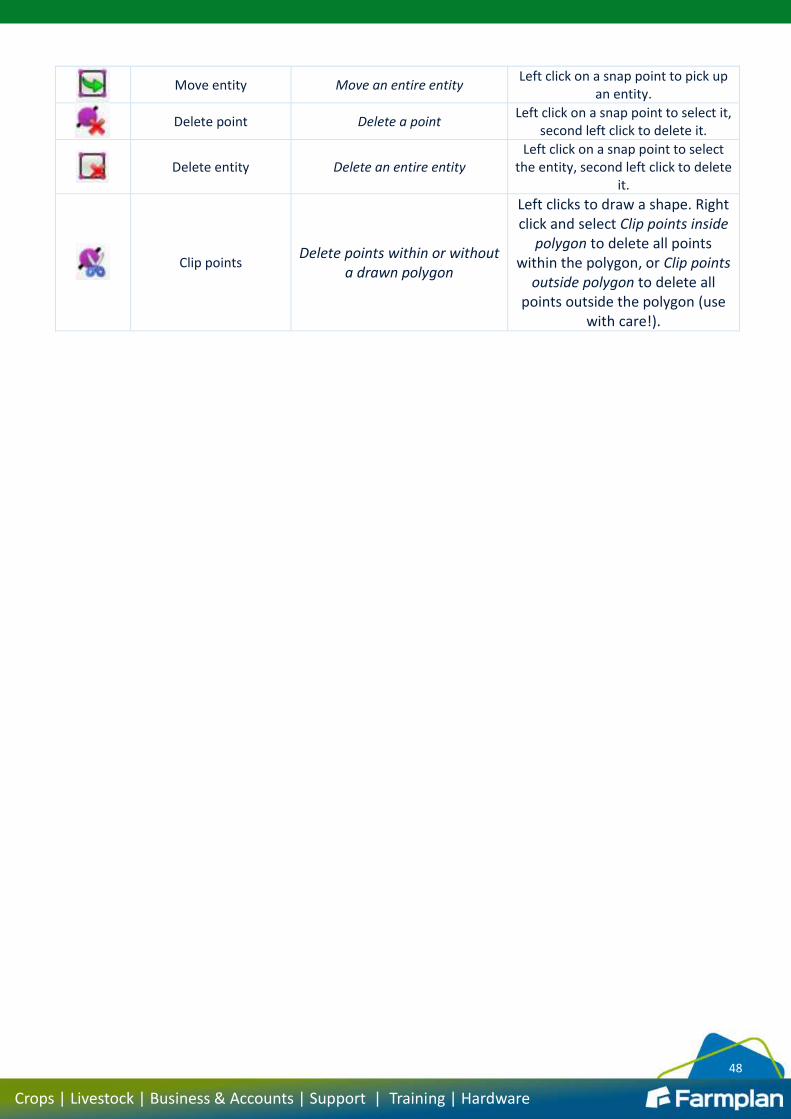
48
Crops | Livestock | Business & Accounts | Support | Training | Hardware
Move entity Move an entire entity
Left click on a snap point to pick up an entity.
Delete point Delete a point
Left click on a snap point to select it, second left click to delete it.
Delete entity Delete an entire entity
Left click on a snap point to select the entity, second left click to delete
it.
Clip points
Delete points within or without a drawn polygon
Left clicks to draw a shape. Right click and select Clip points inside
polygon to delete all points within the polygon, or Clip points
outside polygon to delete all points outside the polygon (use
with care!).
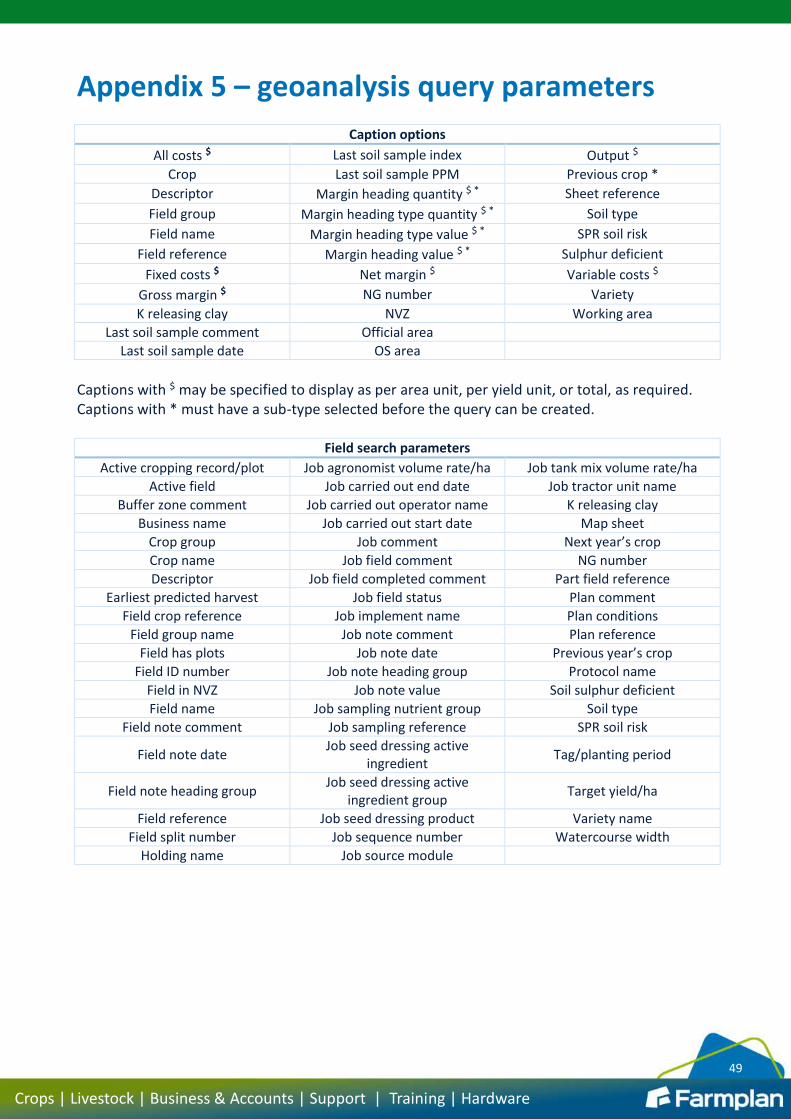
49
Crops | Livestock | Business & Accounts | Support | Training | Hardware
Appendix 5 – geoanalysis query parameters
Caption options
All costs $ Last soil sample index Output $
Crop Last soil sample PPM Previous crop *
Descriptor Margin heading quantity $ * Sheet reference
Field group Margin heading type quantity $ * Soil type
Field name Margin heading type value $ * SPR soil risk
Field reference Margin heading value $ * Sulphur deficient
Fixed costs $ Net margin $ Variable costs $
Gross margin $ NG number Variety
K releasing clay NVZ Working area
Last soil sample comment Official area
Last soil sample date OS area
Captions with $ may be specified to display as per area unit, per yield unit, or total, as required. Captions with * must have a sub-type selected before the query can be created.
Field search parameters
Active cropping record/plot Job agronomist volume rate/ha Job tank mix volume rate/ha
Active field Job carried out end date Job tractor unit name
Buffer zone comment Job carried out operator name K releasing clay
Business name Job carried out start date Map sheet
Crop group Job comment Next year’s crop
Crop name Job field comment NG number
Descriptor Job field completed comment Part field reference
Earliest predicted harvest Job field status Plan comment
Field crop reference Job implement name Plan conditions
Field group name Job note comment Plan reference
Field has plots Job note date Previous year’s crop
Field ID number Job note heading group Protocol name
Field in NVZ Job note value Soil sulphur deficient
Field name Job sampling nutrient group Soil type
Field note comment Job sampling reference SPR soil risk
Field note date Job seed dressing active
ingredient Tag/planting period
Field note heading group Job seed dressing active
ingredient group Target yield/ha
Field reference Job seed dressing product Variety name
Field split number Job sequence number Watercourse width
Holding name Job source module