Embed Size (px)
Citation preview

Fin 4201/8001Topic 4a: Valuing CompaniesThe adventure continues….

The ProjectThe Project
Next few classes, little Next few classes, little reading = time to get reading = time to get organizedorganized
Sources – usual suspectsSources – usual suspects Analyze with tenets, spread Analyze with tenets, spread
sheet w/ forecasts, ratios….sheet w/ forecasts, ratios…. Play from your strengthsPlay from your strengths

Another lookAnother look
AbstractAbstract Introduce firm and Introduce firm and
environmentenvironment Operations Operations IndustryIndustry

Another lookAnother look
Ratio analysisRatio analysis Buffett’s tenetsBuffett’s tenets Equity ValuationEquity Valuation RecommendationRecommendation References, Tables, Charts,… References, Tables, Charts,…

ValuationValuation
Objective: Investment decisionObjective: Investment decision Price < Estimated value = BUYPrice < Estimated value = BUY
Three step approach (Top-down)Three step approach (Top-down) Analysis of economies and marketsAnalysis of economies and markets Analysis of IndustryAnalysis of Industry Analysis of individual firmAnalysis of individual firm
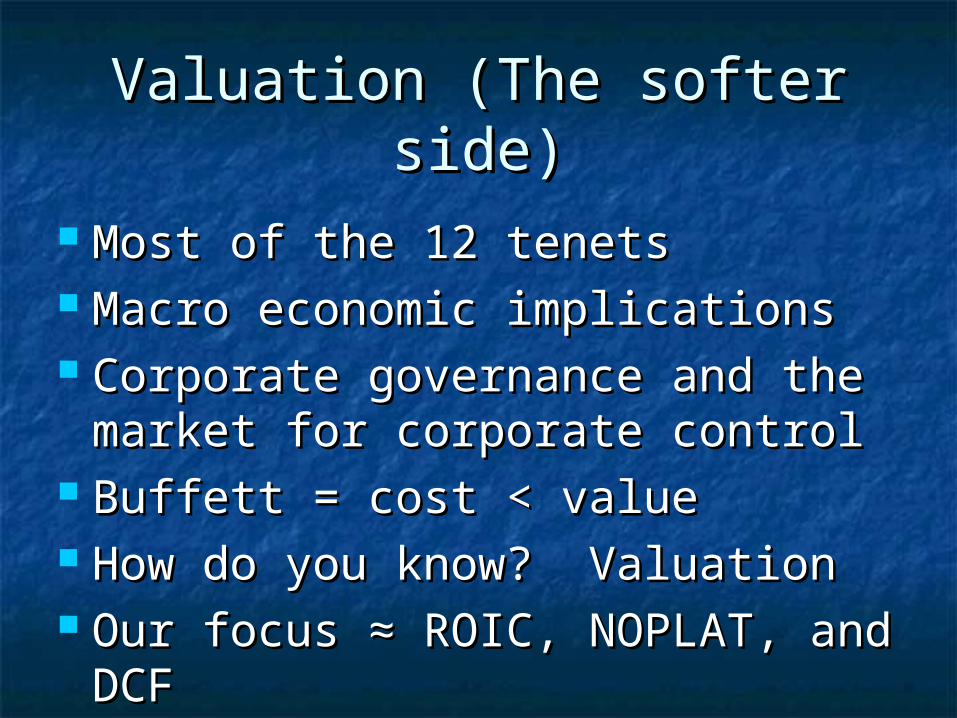
Valuation (The softer side)Valuation (The softer side)
Most of the 12 tenetsMost of the 12 tenets Macro economic implicationsMacro economic implications Corporate governance and the Corporate governance and the
market for corporate controlmarket for corporate control Buffett = cost < valueBuffett = cost < value How do you know? ValuationHow do you know? Valuation Our focus Our focus ≈ ROIC, NOPLAT, and ≈ ROIC, NOPLAT, and
DCFDCF

RReturn eturn OOn n IInvested nvested CCapital apital = Profit/capital = Profit/capital
ROIC is after tax profit divided by ROIC is after tax profit divided by (working capital + PPE)(working capital + PPE) Scorecard vs. some benchmarkScorecard vs. some benchmark Goal Goal ≠ maximize≠ maximize But can’t just look at $ either – But can’t just look at $ either –
Capital costs money (growth for Capital costs money (growth for growths sake)growths sake)
ROIC > Opportunity cost of capitalROIC > Opportunity cost of capital Ultimate = stock performance or Ultimate = stock performance or
value creationvalue creation
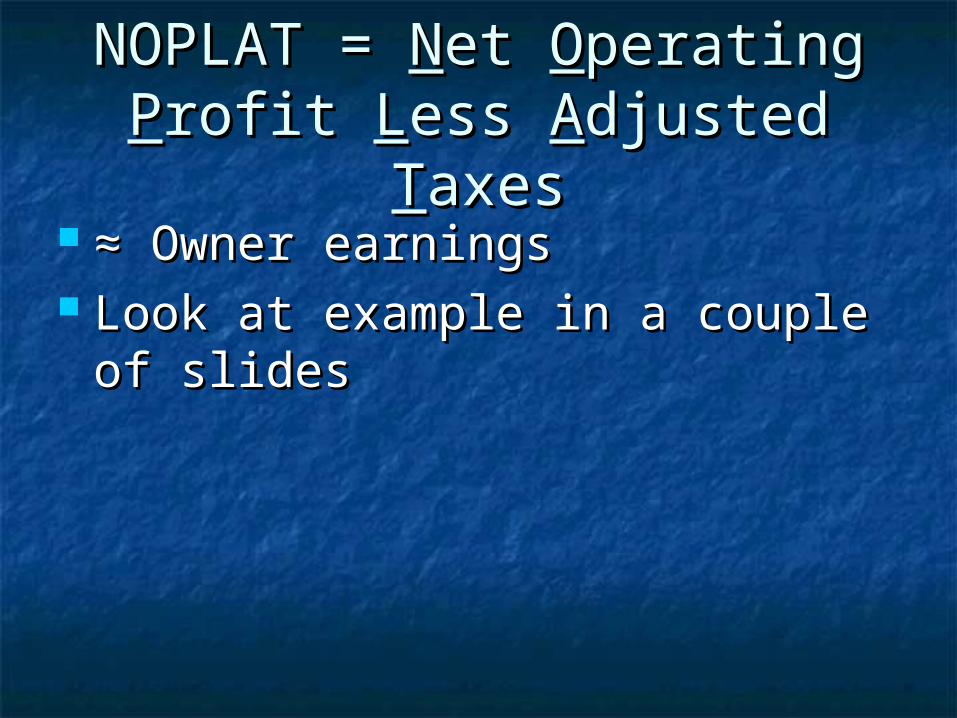
NOPLAT = NOPLAT = NNet et OOperating perating PProfit rofit LLess ess AAdjusted djusted TTaxesaxes
≈ ≈ Owner earningsOwner earnings Look at example in a couple of Look at example in a couple of
slidesslides

DCF – DCF – DDiscounted iscounted CCash ash FFlowlow
Returns depend on market expectationsReturns depend on market expectations The great equalizerThe great equalizer Goal = Maximize PV of cash or economic Goal = Maximize PV of cash or economic
profitprofit Ultimate measure is stock performanceUltimate measure is stock performance ProblemsProblems
Predict future (Buffett KISS and stable)Predict future (Buffett KISS and stable) Earnings can be manipulatedEarnings can be manipulated

Historical AnalysisHistorical Analysis
Need to understand past to be able Need to understand past to be able to predict the futureto predict the future
Reorganize statements to reflect Reorganize statements to reflect economic vs. accounting economic vs. accounting performanceperformance
Measure and analyze ROIC = ability Measure and analyze ROIC = ability to create valueto create value
Assess financial health and capital Assess financial health and capital structure for short and long termstructure for short and long term

Historical AnalysisHistorical Analysis
ROIC = NOPLAT / Invested capitalROIC = NOPLAT / Invested capital Reorg Balance Sheet to create Reorg Balance Sheet to create
invested capitalinvested capital Reorg Income statement to get Reorg Income statement to get
NOPLATNOPLAT How much cash can be taken How much cash can be taken
out?out? FCF = NOPLAT + noncash Op exp FCF = NOPLAT + noncash Op exp
– invested capital– invested capital

ROIC = NOPLAT / ROIC = NOPLAT / Invested Invested CapitalCapital
Invested capital = Balance sheet Invested capital = Balance sheet = Debt + Equity?= Debt + Equity? Debt equivalents = unfunded Debt equivalents = unfunded
retirement liabilities, restructuring retirement liabilities, restructuring reserves,…reserves,…
Equity equivalents = deferred Equity equivalents = deferred taxes…taxes…

AssetsPrior Year
Current year
Prior Year
Current year
Inventory 200 225 Inventory 200 225Net PP&E 300 350 Accounts Pay -125 -150Equity Investments 15 25 Working Cap 75 75Total Assets 515 600
Net PP&E 300 350Invested Capital 375 425
Liabilities & EquityAccounts Pay 125 150 Equity Investments 15 25Debt 225 200 Total Fund Invested 360 450Common Stock 50 50Retained Earnings 115 200 Total Fund InvestedTotal Liab & Eq 515 600 Debt 225 200
Common Stock 50 50Retained Earnings 115 200Total Fund Invested 390 450
Balance sheet Invested Capital
Operating liabilities netted against operating assets
Non op assets not included in capital

ROIC = ROIC = NOPLATNOPLAT / Invested / Invested CapitalCapital
Now to Income statement = Now to Income statement = NOPLATNOPLAT Interest expense not subtractedInterest expense not subtracted Exclude non operating incomeExclude non operating income Adjust taxes to reflect exclusionsAdjust taxes to reflect exclusions
What you have is basically an all What you have is basically an all equity, operations only firmequity, operations only firm

Taxes calc’d on operating profits
If not in capital = not in NOPLAT
Current year
Current year
Revenue 1000 Revenue 1000Op costs -700 Op costs -700Depreciation -20 Depreciation -20Op Profit 280 Op Profit 280
Interest -20 Op Taxes -70Non-op income 4 NOPLAT 210EBT (Pretax inc) 264
After Tax non op Inc. 3Taxes -66 Income to all 213Net Income 198
Reconcile w/ NINet Income 198After-tax interest 15Income to all 213
Invested CapitalIncome Statement
Interest = payout to investor, not expense

ROIC = NOPLAT / Invested ROIC = NOPLAT / Invested CapitalCapital
Now what about Now what about Free Cash FlowFree Cash Flow?? Basically the same as tenet #8 in Basically the same as tenet #8 in
Topic 3 Topic 3 ≈≈ FCF = NOPLAT + Non cash FCF = NOPLAT + Non cash opexpense – investment in capitalopexpense – investment in capital
Intangibles and goodwill – usually Intangibles and goodwill – usually excludeexclude
Other Long Term assets Other Long Term assets Hidden Assets – leases, R&DHidden Assets – leases, R&D Cash if large Cash if large ≠ operating≠ operating

Taxes calc’d on operating profits
CF from non-op treated separate
Interest = payout to investor, not expense
Current year
Current year
Net Income 198 NOPLAT 210Depreciation 20 Depreciation 20chnge Inventory -25 Gross CF 230chang in A/P 25CF from Ops 218 chnge Inventory -25
chang in A/P 25Cap Exp -70 Cap Exp -70chg in equity -10 Gross Invest -70CF from Invest -80
Free Cash Flow 160chg in debt -25chg in stock 0 After Tax non op Inc. 3dividends -113 chg in equity -10CF from Financing 138 CF to investors 153
After tax interest 15chg in debt 25chg in stock 0dividends 113CF to investors 153
Free Cash FlowCash Flow

ForecastingForecasting
Models = try to reduce to simple Models = try to reduce to simple numbersnumbers
Make Make realisticrealistic assumptions on assumptions on sales and costssales and costs
Look for the “drivers”Look for the “drivers” Two-stage growth modelTwo-stage growth model

The ForecastThe Forecast
1)1) Analyze historicalsAnalyze historicals Aggregate items or add more Aggregate items or add more
lineslines CNBC, Yahoo, Edgar, Compustat CNBC, Yahoo, Edgar, Compustat
(WRDS),…(WRDS),…
2)2) Start with ISStart with IS Revenue forecast consistent with Revenue forecast consistent with
historical and economy-wide historical and economy-wide growthgrowth

The ForecastThe Forecast
3)3) Forecast rest of income statement Forecast rest of income statement consistent with “drivers”consistent with “drivers”
COGS – function of sales adjusted for COGS – function of sales adjusted for competition and/or productivitycompetition and/or productivity
Depreciation = % of revenue or % of PPE or Depreciation = % of revenue or % of PPE or historical equipment purchasehistorical equipment purchase
Interest exp or income tied to asset or liability Interest exp or income tied to asset or liability that generates itthat generates it
Taxes – look to historical or just plug 39%Taxes – look to historical or just plug 39%4)4) Forecast Balance sheet, invested capital, Forecast Balance sheet, invested capital,
and non-op assetsand non-op assets E.g. working capital tied to COGS or PPE tied E.g. working capital tied to COGS or PPE tied
to revenue or depreciationto revenue or depreciation

The ForecastThe Forecast
5)5) Forecast investor funds Forecast investor funds Retained earnings = old RE + NI - Retained earnings = old RE + NI -
dividendsdividends Other equity accountsOther equity accounts
6)6) Calculate ROIC and FCF to Calculate ROIC and FCF to generate valuegenerate value
Can use WACC or do like Buffett Can use WACC or do like Buffett (long treasury rate)(long treasury rate)
7)7) Other issuesOther issues