Embed Size (px)
Citation preview


Final Report Main Report
Chapter 2 : Geographic Database Development 7
Chapter 2. Geographic Database Development
Since the commencement of the Study, many types of physical, environmental and socio-economic data in the Study area have been collected.
These data were analysed and evaluated as basic information for the Study. In order to analyse the existing conditions of the Study area, the Study Team has developed a GIS database. Based on the output of the GIS database, existing conditions of the study area are explained below.
2.1. Geographic Database Development for Seismic Disaster Management
2.1.1. Introduction In the past twenty years, Geographic Information System (GIS) database technology has been developed, mainly in the U.S.A. and Canada, as a means to manage and process large volumes of map/spatial data through the full application of computer graphics technology. Because of its most significant capability to handle both graphics and attribute data simultaneously, in recent years, GIS has been used for a wide range of applications in urban/regional management, such as land use planning, environmental or natural resource management, tax assessment and urban utility management. In Japan, after the great Kobe earthquake disaster in 1995, researchers and administrators of local governments are paying much attention on the development of geographic databases for seismic risk assessment of large urban areas. Many large cities have started to construct a multipurpose GIS database, not only for analysis of seismic damage, but also for integrated urban development planning and management based on large-scale topographic maps. These application fields of GIS require relatively complicated data processing of regional/spatial data analysis including overlay, buffer and simulation modelling. For the Study on Seismic Microzoning of the Greater Tehran Area, an integrated geographic database was developed to support the data analysis and planning efforts of the study.
2.1.2. Purpose of the Development of the Geographic Database In order to carry out The Study on Seismic Microzoning of the Greater Tehran Area, a wide range of urban/regional data must be collected and analysed using the proper methodology to evaluate the spatial vulnerability of seismic disaster in the study area. GIS is considered to be the most practical and appropriate methodology for spatial data compilation, analysis and display. Numerous map data showing regional characteristics can be combined and superimposed by computer and analysed to present spatial distribution of seismic disaster vulnerability. Results of data analysis can be formulated into a series of maps and tables representing significant planning indicators for the development of a seismic disaster mitigation plan.
2.1.3. Design of Geographic Database Prior to the database development, the Study Team surveyed the existing availability of GIS compatible systems (including hardware, software and manpower for the data digitisation and primary data processing) in Tehran, with a special focus on ARC/INFO compatible systems. Fortunately, technical services for the ARC/INFO GIS is fully available and totally supported by a private company in Tehran. Governmental agencies such as the Ministry of Agriculture, Geological Survey of Iran, Tehran Municipality and Tehran University, etc.,

The Study on Seismic Microzoning of the Greater Tehran Area in the Islamic Republic of IRAN
8
utilise ARC/INFO GIS. These agencies are using GIS for application in their respective fields or research and educational purposes. Based on the technical background of GIS present in Tehran, the Study Team designed the structure of the geographic database for the Study as shown in Figure 2.1.1


The Study on Seismic Microzoning of the Greater Tehran Area in the Islamic Republic of IRAN
10
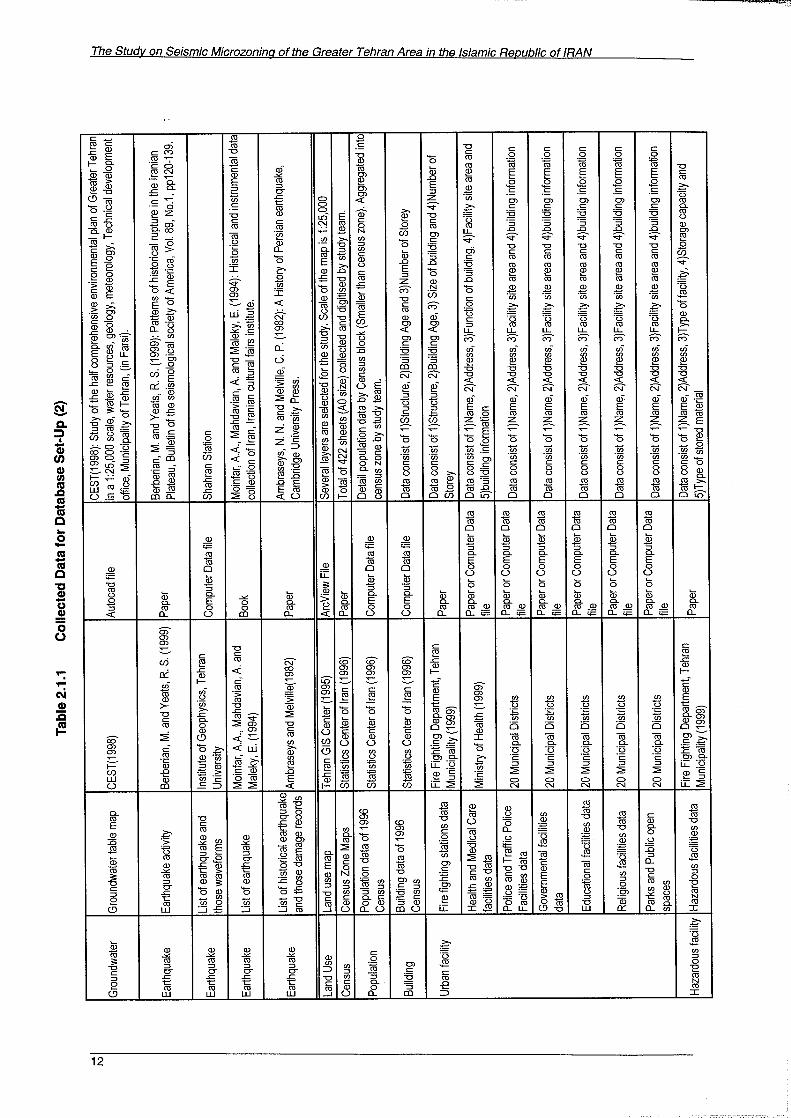
2.1.4. Data Collection and Input (Digitisation) For the development of the geographic database of the Study, the Study Team collected a wide range of basic data covering both natural and socio-economic conditions of the study area. Collected map data were analysed and evaluated based on accuracy, basic scale, date of compilation, method of survey and source agency. In order to develop a geographic database for the study area within the limited time of the Study and to efficiently support data analysis and planning efforts, the Study Team carefully discussed the base map scale with the concerned agencies and ultimately determined a base map scale of 1:25,000 would be the most appropriate for the development of the Study's geographic database. After the design of the database and necessary processing were undertaken, one complete map sheet was generated so as to easily understand the whole study area. Data input/digitisation was subcontracted using local GIS functions and experts to minimise and execute the necessary data conversion from map-form to digital data within a short period. Existing digital data files were also incorporated into the database. Source agencies of collected data are listed in Table 2.1.1. Data input for this Study include the following items:
- Topographic map
- Census zone boundary map
- District and sub-district boundary map
- Traffic zone map of the Tehran Comprehensive Transportation and Traffic Study, 1996
- Road network map
- Location and attributes (structural type/age/number of stories) of critical buildings such as schools, hospitals, police stations, religious buildings, fire stations, city halls and government buildings
- Population map by census zone (1996)
- Residential buildings by census zone, structural type (9 categories), age (5 categories), and number of stories (5 categories) (1996)
- Other Buildings by census zone (same categories as above, 1996)
- Geological map
- Groundwater level
- Location of large-scale bridges, flyovers, open-cut and embankments
- Metro/railway network (same structure as above)
- Main water pipeline network
- Main gas pipeline network
- Main electricity line network
- Telecommunication network
- Location of hazardous material


The Study on Seismic Microzoning of the Greater Tehran Area in the Islamic Republic of IRAN
14
2.1.5. Data Analysis Unit In urban/regional planning, the data analysis unit usually employed is that of administratively delineated city sub-districts, or some smaller unit. In Tehran, however, despite the effort to locate data for these administrative units, the Study Team found only concrete and detailed maps for Tehran's 22 district boundaries.
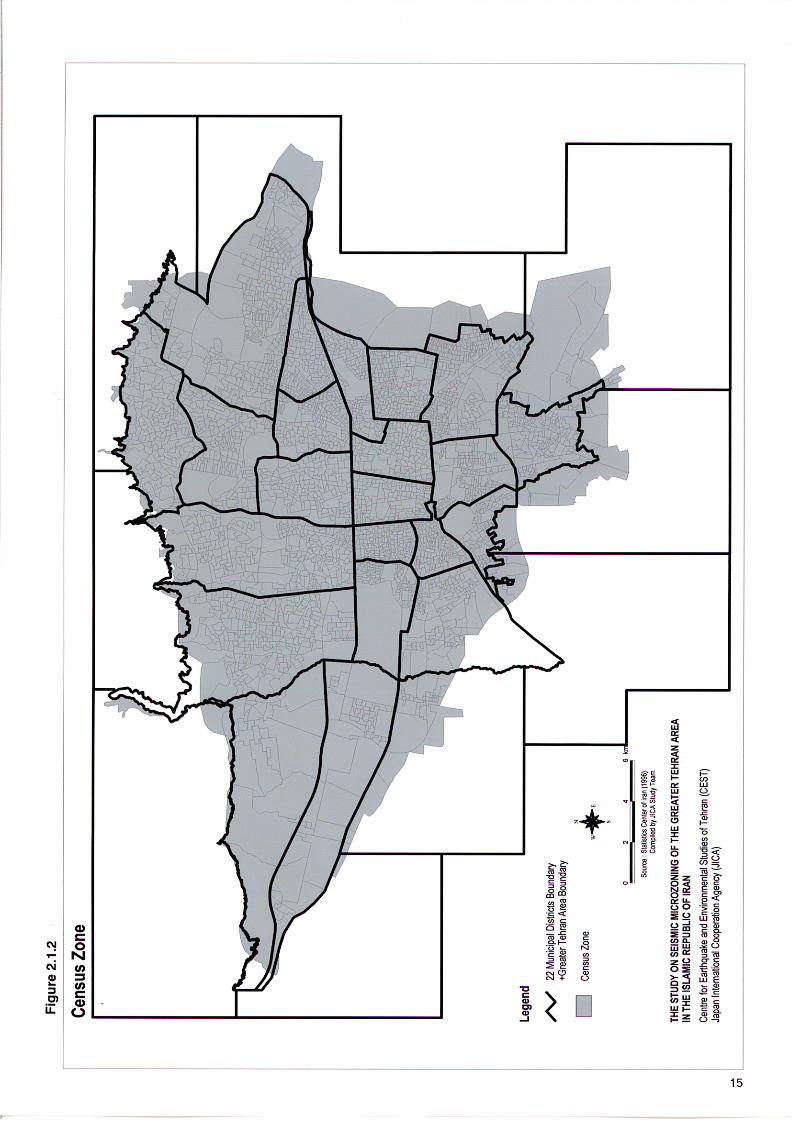
According to the Statistics Center of Iran (SCI), a census survey is conducted once every 10 years and a supplemental survey once every 5 years. In Tehran, a total of 34,805 census blocks are identified and these blocks are aggregated into 3,173 census zones (Figure 2.1.2). Statistical data on population and buildings were accumulated based on these census units. These data were provided to the Study Team in DBF file format by SCI. The census zone boundary was drawn on the traditional Mylar base map (scale 1:2,000), which consisted of 422 sheets. In this Study, the census zone boundary is used as the base unit for the spatial data analysis.

The Study on Seismic Microzoning of the Greater Tehran Area in the Islamic Republic of IRAN
16
2.1.6. Data Analysis Based on the geographic database, spatial characteristics of natural and social conditions of the study area were analysed. The data analysis process consists of three stages: the primary, secondary and tertiary. During the primary data analysis stage, a simple overlay analysis was conducted to show the existing conditions of the study area. For instance, the census zone, district boundary and related population data were combined and displayed together as a population map.
During the secondary data analysis stage, primarily processed data items were combined and superimposed on each other. Seismic disaster potential of the study area was analysed and mapped.
During the tertiary data analysis stage, detailed seismic damages were assessed based on the analysis results of previous stages. All outputs generated by these data processing were mapped and related tables were compiled.
Existing natural and social conditions of the study area, based on the primary data analysis, are described in Chapter 2, section.2.2. Results of the secondary and the tertiary data analysis are described in Chapter 4.
2.1.7. Comprehensive Evaluation of Vulnerability Overall seismic disaster vulnerability of the study area was evaluated by physical and social indicators. District seismic vulnerability was examined and mapped in radar chart format.
2.1.8. Execution of Pilot Study A pilot study was conducted to learn, in detail, the level of seismic disaster preparedness in the urban community. A property-based building survey was conducted, and a detailed database was developed. A diagnosis of seismic disaster preparedness in the pilot study area was compiled, and issues for seismic disaster mitigation were stated.
2.1.9. Recommendations for Seismic Disaster Mitigation Recommendations for seismic disaster mitigation were described from institutional, urban planning and architectural points of view.