Embed Size (px)
Citation preview

Final Report – Total Compensation Study City of Madera
2835 7th Street, Berkeley, California 94710 | 510.658.5633 | www.KoffAssociates.com
Submitted By:
Koff & Associates KATIE KANEKO PRESIDENT 2835 7th Street Berkeley, CA 94710 www.KoffAssociates.com [email protected] Tel: 510.658.5633 Fax: 510.652.5633
Submittal date: 06/05/15
FINAL REPORT OF THE TOTAL COMPENSATION STUDY City of Madera
2835 7th Street, Berkeley, California 94710 | 510.658.5633 | www.KoffAssociates.com
May 17, 2015 Ms. Wendy Silva Director of Human Resources City of Madera 205 West Fourth Street Dear Ms. Silva: Koff & Associates is pleased to present the final total compensation report for the study of all positions at the City of Madera. This report documents the market compensation survey and findings. We would like to thank you, as well as other City staff for your assistance and cooperation, without which this study could not have been brought to its successful completion. We have created a compensation plan that, when finally implemented, will bring the City’s compensation program into an externally competitive and internally equitable status. We will be glad to answer any questions or clarify any points as you are implementing the findings. It was a pleasure working with the City and we look forward to future opportunities to provide you with professional assistance. Very truly yours,
Katie Kaneko President

Final Report – Total Compensation Study City of Madera
2835 7th Street, Berkeley, California 94710 | 510.658.5633 | www.KoffAssociates.com
Table of Contents
Background ....................................................................... ……1 Study Process ............................................................................ 2 Market Compensation Findings ........................................... 10 Internal Salary Relationships ................................................. 15
Using the Market Data as a Tool.......................................... 17
Appendix I: Results Summary
Appendix II: Market Base Salary, Benefit, and Total Compensation Findings Appendix III: Additional Benefits
Final Report – Total Compensation Study City of Madera
2835 7th Street, Berkeley, California 94710 | 510.658.5633 | www.KoffAssociates.com
2
BACKGROUND In December 2014, the City of Madera (City) contracted with Koff & Associates to conduct a comprehensive compensation study for all classifications at the City. All compensation findings are in this report. This compensation review process was precipitated by: The concern of management and the employee groups that employees should be recognized for
the level and scope of work performed and that they are paid on a fair and competitive basis that allows the City to recruit and retain a high-quality staff;
The desire to have a compensation plan that can meet the needs of the City; and The desire to ensure that internal relationships of salaries are based upon objective, non-
quantitative evaluation factors, resulting in equity across the City. The goal of the compensation study is to assist the City in developing a competitive pay and benefit structure, which is based upon market data to ensure that the plan is fiscally responsible, and that meets the needs of the City with regards to recruitment and retention of qualified staff.
Final Report – Total Compensation Study City of Madera
2835 7th Street, Berkeley, California 94710 | 510.658.5633 | www.KoffAssociates.com
3
STUDY PROCESS
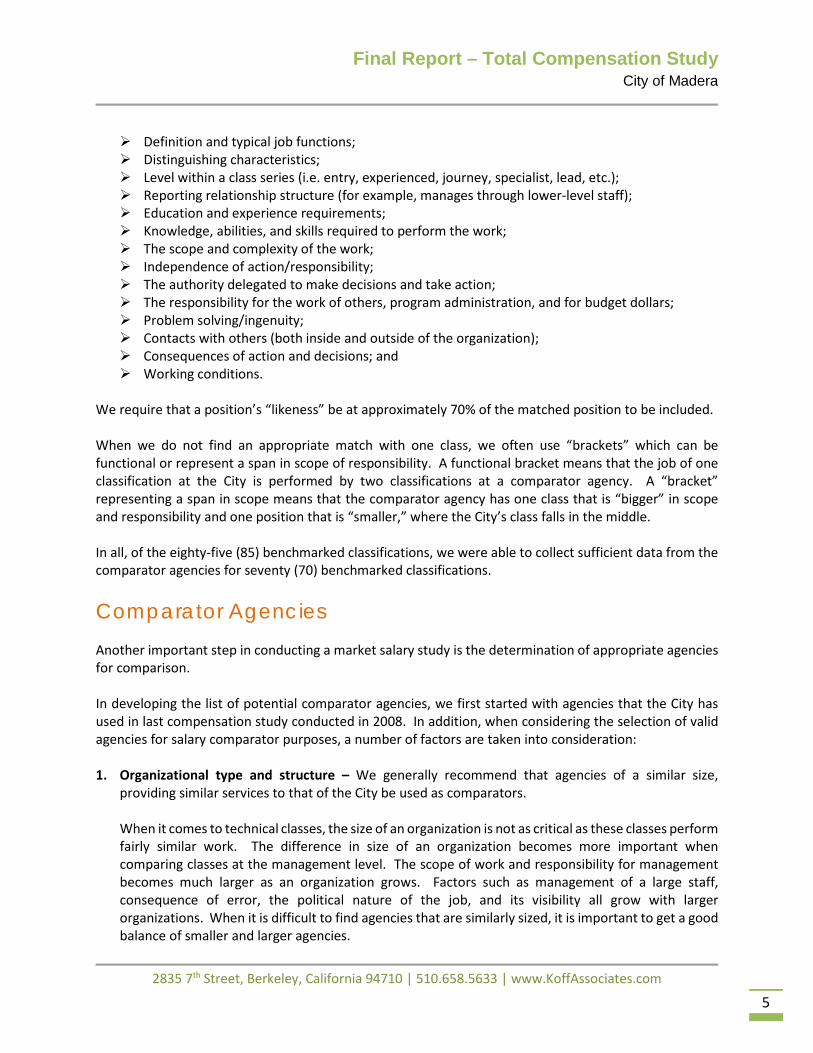
Benchmark Classifications The study included one hundred forty-six (146) classifications and of those, eighty-five (85) classifications were selected in order to collect compensation data within the defined labor market. Survey classifications that had the most consistent and useful survey data were used as “benchmarks” in building the compensation plan. Benchmark classifications are those classifications that are tied directly to market salary data during the salary setting process. These classifications are used as a means of anchoring the City’s overall compensation plan to the market. Other classifications not surveyed would be aligned on the proposed compensation plan using internal equity principles. Survey or benchmark classifications included classes that are reasonably well known, and clearly and concisely described. They are commonly used classes such that other like classes may readily be found in other agencies in order to ensure that sufficient compensation data will be compiled. These survey classifications included:
Classification
1. Accountant II 19. Construction Inspector II
2. Accounting Technician II 20. Deputy City Clerk
3. Administrative Analyst 21. Deputy City Engineer
4. Administrative Assistant 22. Director of Community Development
5. Airport Maintenance Worker II 23. Director of Financial Services
6. Animal Control Officer 24. Director of Human Resources
7. Assistant Engineer 25. Director of Parks and Recreation
8. Assistant Planner 26. Electrical and Facilities Operations Manager
9. Associate Planner 27. Electrician III
10. Building Permit Technician 28. Electronic Instrumentation Technician
11. Business Manager 29. Engineering Project Manager
12. Chief Building Official 30. Engineering Technician II
13. City Administrator 31. Facilities Maintenance Technician
14. City Attorney 32. Facility Aide
15. City Clerk 33. Field Representative
16. City Engineer 34. Financial Services Manager
17. Combination Building Inspector 35. Fleet Operations Manager
18. Computer Technician 36. Grant Administrator

Final Report – Total Compensation Study City of Madera
2835 7th Street, Berkeley, California 94710 | 510.658.5633 | www.KoffAssociates.com
4
Classification (continued)
37. Grant Specialist 62. Public Safety Dispatcher
38. Human Resources Technician II 63. Public Works Maintenance Worker II
39. Information Services Manager 64. Public Works Maintenance Worker IV
40. Maintenance Technician 65. Public Works Operations Director
41. Mechanic II 66. Purchasing Assistant
42. Neighborhood Outreach Coordinator 67. Records Clerk
43. Neighborhood Preservation Specialist II 68. Recreation/Community Programs Coordinator
44. Neighborhood Preservation Supervisor 69. Recreation/Community Programs Manager
45. Network Administrator 70. Senior Nutrition Program Monitor
46. Office Assistant II 71. Senior Planner
47. Paralegal Office Administrator 72. Solid Waste Recycling Assistant
48. Park Planning Manager 73. Streets and Storm Drainage Operations Manager
49. Parks Supervisor 74. Streets and Storm Drainage Operations Supervisor
50. Parks Worker II 75. Utility Billing Supervisor
51. Payroll Specialist 76. Wastewater Collection System Supervisor 52. Planning Manager 53. Plans Examiner
77. Wastewater Laboratory Analyst/Environmental Compliance Inspector II
54. Police Chief 78. Waste Water Treatment Plant Manager
55. Police Commander 79. Wastewater Treatment Plant Mechanic
56. Police Office Supervisor 80. Wastewater Treatment Plant Operator II
57. Police Officer II 81. Water and Sewer Operations Manager
58. Police Sergeant 82. Water Quality Specialist II
59. Procurement Services Manager 83. Water System Supervisor
60. Program Manager – Grants 84. Water System Technician
61. Property and Evidence Officer 85. Water System Worker II
Matching Methodology When we contact the comparator agencies to identify possible matches for each of the benchmarked classifications, there is an assumption that we will not be able to find comparators that are 100% equivalent to the classifications at the City. Therefore, we do not match based upon job titles, which can often be misleading, but we analyze each class description before we consider it as a comparator. Our methodology is to analyze each class description and the whole position by evaluating factors such as:
Final Report – Total Compensation Study City of Madera
2835 7th Street, Berkeley, California 94710 | 510.658.5633 | www.KoffAssociates.com
5
Definition and typical job functions; Distinguishing characteristics; Level within a class series (i.e. entry, experienced, journey, specialist, lead, etc.); Reporting relationship structure (for example, manages through lower-level staff); Education and experience requirements; Knowledge, abilities, and skills required to perform the work; The scope and complexity of the work; Independence of action/responsibility; The authority delegated to make decisions and take action; The responsibility for the work of others, program administration, and for budget dollars; Problem solving/ingenuity; Contacts with others (both inside and outside of the organization); Consequences of action and decisions; and Working conditions.
We require that a position’s “likeness” be at approximately 70% of the matched position to be included. When we do not find an appropriate match with one class, we often use “brackets” which can be functional or represent a span in scope of responsibility. A functional bracket means that the job of one classification at the City is performed by two classifications at a comparator agency. A “bracket” representing a span in scope means that the comparator agency has one class that is “bigger” in scope and responsibility and one position that is “smaller,” where the City’s class falls in the middle. In all, of the eighty-five (85) benchmarked classifications, we were able to collect sufficient data from the comparator agencies for seventy (70) benchmarked classifications.
Comparator Agencies Another important step in conducting a market salary study is the determination of appropriate agencies for comparison. In developing the list of potential comparator agencies, we first started with agencies that the City has used in last compensation study conducted in 2008. In addition, when considering the selection of valid agencies for salary comparator purposes, a number of factors are taken into consideration: 1. Organizational type and structure – We generally recommend that agencies of a similar size,
providing similar services to that of the City be used as comparators. When it comes to technical classes, the size of an organization is not as critical as these classes perform fairly similar work. The difference in size of an organization becomes more important when comparing classes at the management level. The scope of work and responsibility for management becomes much larger as an organization grows. Factors such as management of a large staff, consequence of error, the political nature of the job, and its visibility all grow with larger organizations. When it is difficult to find agencies that are similarly sized, it is important to get a good balance of smaller and larger agencies.
Final Report – Total Compensation Study City of Madera
2835 7th Street, Berkeley, California 94710 | 510.658.5633 | www.KoffAssociates.com
6
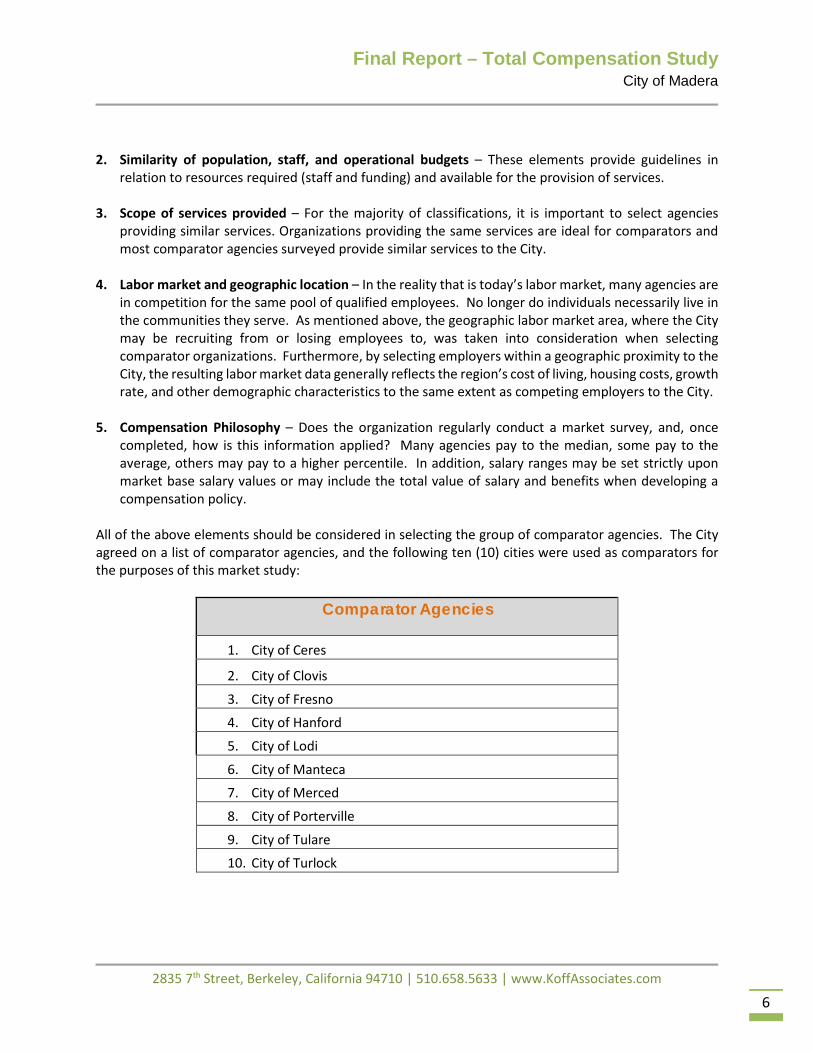
2. Similarity of population, staff, and operational budgets – These elements provide guidelines in
relation to resources required (staff and funding) and available for the provision of services. 3. Scope of services provided – For the majority of classifications, it is important to select agencies
providing similar services. Organizations providing the same services are ideal for comparators and most comparator agencies surveyed provide similar services to the City.
4. Labor market and geographic location – In the reality that is today’s labor market, many agencies are
in competition for the same pool of qualified employees. No longer do individuals necessarily live in the communities they serve. As mentioned above, the geographic labor market area, where the City may be recruiting from or losing employees to, was taken into consideration when selecting comparator organizations. Furthermore, by selecting employers within a geographic proximity to the City, the resulting labor market data generally reflects the region’s cost of living, housing costs, growth rate, and other demographic characteristics to the same extent as competing employers to the City.
5. Compensation Philosophy – Does the organization regularly conduct a market survey, and, once completed, how is this information applied? Many agencies pay to the median, some pay to the average, others may pay to a higher percentile. In addition, salary ranges may be set strictly upon market base salary values or may include the total value of salary and benefits when developing a compensation policy.
All of the above elements should be considered in selecting the group of comparator agencies. The City agreed on a list of comparator agencies, and the following ten (10) cities were used as comparators for the purposes of this market study:
Comparator Agencies
1. City of Ceres
2. City of Clovis
3. City of Fresno
4. City of Hanford
5. City of Lodi
6. City of Manteca
7. City of Merced
8. City of Porterville
9. City of Tulare
10. City of Turlock
Final Report – Total Compensation Study City of Madera
2835 7th Street, Berkeley, California 94710 | 510.658.5633 | www.KoffAssociates.com
7
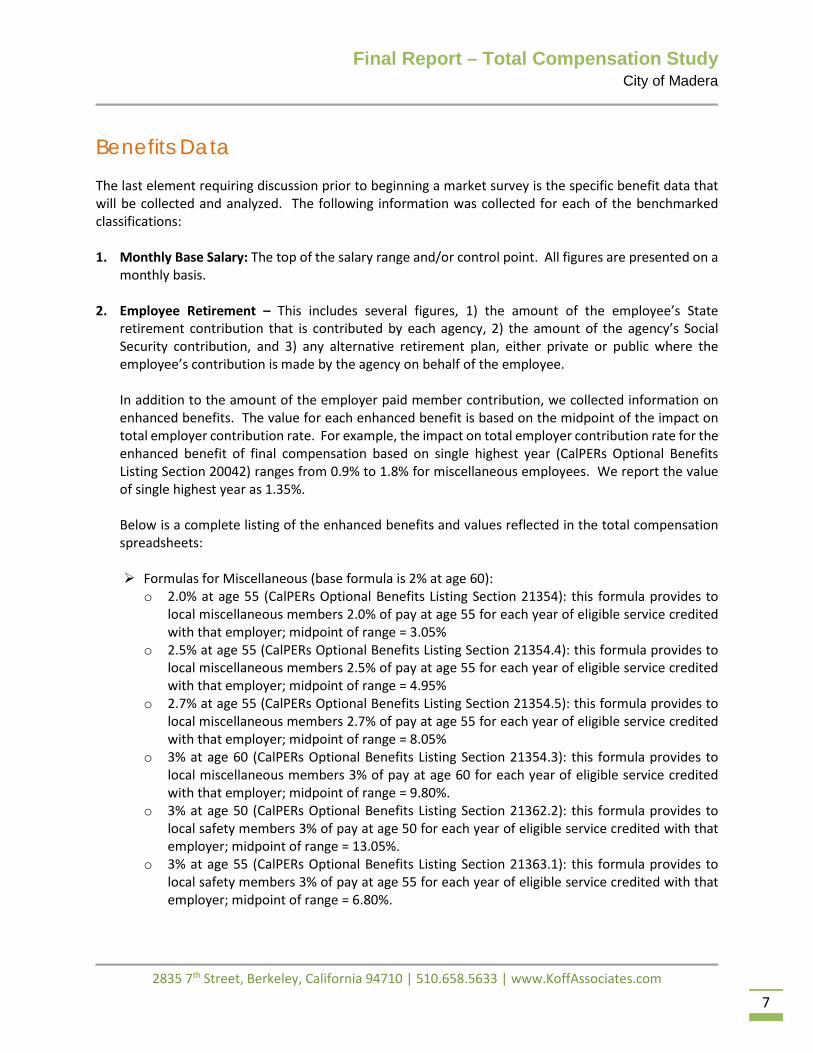
Benefits Data The last element requiring discussion prior to beginning a market survey is the specific benefit data that will be collected and analyzed. The following information was collected for each of the benchmarked classifications: 1. Monthly Base Salary: The top of the salary range and/or control point. All figures are presented on a
monthly basis. 2. Employee Retirement – This includes several figures, 1) the amount of the employee’s State
retirement contribution that is contributed by each agency, 2) the amount of the agency’s Social Security contribution, and 3) any alternative retirement plan, either private or public where the employee’s contribution is made by the agency on behalf of the employee.
In addition to the amount of the employer paid member contribution, we collected information on enhanced benefits. The value for each enhanced benefit is based on the midpoint of the impact on total employer contribution rate. For example, the impact on total employer contribution rate for the enhanced benefit of final compensation based on single highest year (CalPERs Optional Benefits Listing Section 20042) ranges from 0.9% to 1.8% for miscellaneous employees. We report the value of single highest year as 1.35%. Below is a complete listing of the enhanced benefits and values reflected in the total compensation spreadsheets: Formulas for Miscellaneous (base formula is 2% at age 60):
o 2.0% at age 55 (CalPERs Optional Benefits Listing Section 21354): this formula provides to local miscellaneous members 2.0% of pay at age 55 for each year of eligible service credited with that employer; midpoint of range = 3.05%
o 2.5% at age 55 (CalPERs Optional Benefits Listing Section 21354.4): this formula provides to local miscellaneous members 2.5% of pay at age 55 for each year of eligible service credited with that employer; midpoint of range = 4.95%
o 2.7% at age 55 (CalPERs Optional Benefits Listing Section 21354.5): this formula provides to local miscellaneous members 2.7% of pay at age 55 for each year of eligible service credited with that employer; midpoint of range = 8.05%
o 3% at age 60 (CalPERs Optional Benefits Listing Section 21354.3): this formula provides to local miscellaneous members 3% of pay at age 60 for each year of eligible service credited with that employer; midpoint of range = 9.80%.
o 3% at age 50 (CalPERs Optional Benefits Listing Section 21362.2): this formula provides to local safety members 3% of pay at age 50 for each year of eligible service credited with that employer; midpoint of range = 13.05%.
o 3% at age 55 (CalPERs Optional Benefits Listing Section 21363.1): this formula provides to local safety members 3% of pay at age 55 for each year of eligible service credited with that employer; midpoint of range = 6.80%.
Final Report – Total Compensation Study City of Madera
2835 7th Street, Berkeley, California 94710 | 510.658.5633 | www.KoffAssociates.com
8
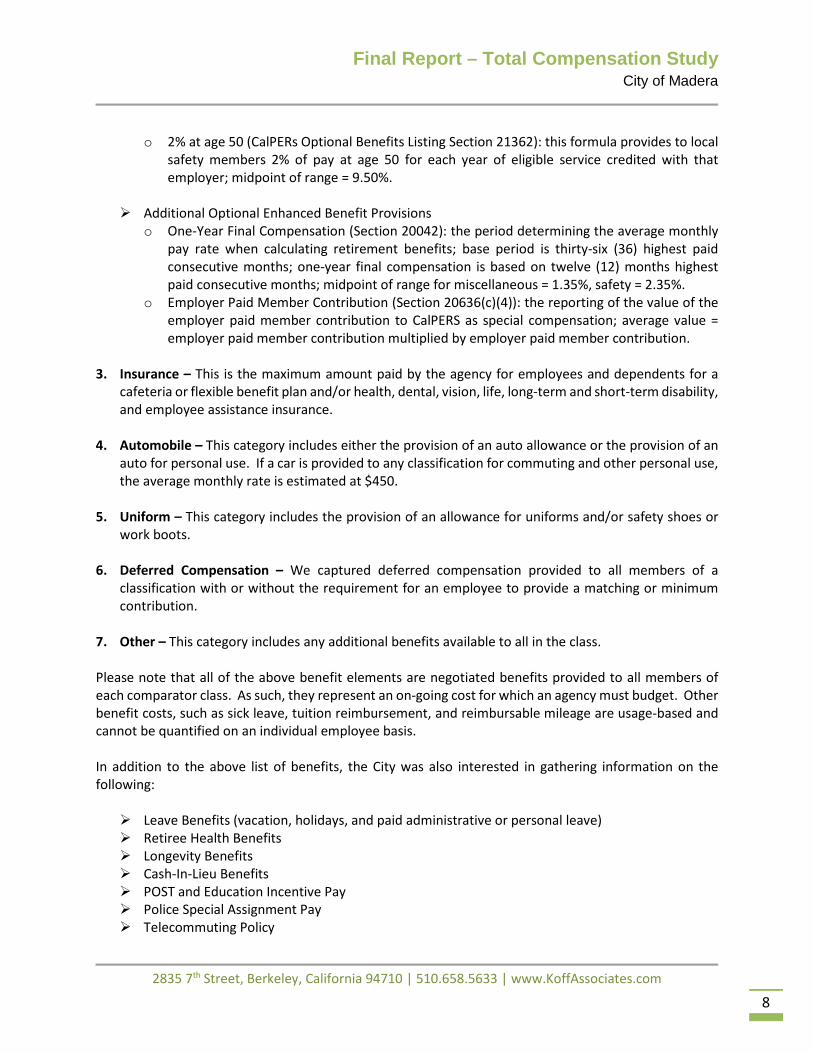
o 2% at age 50 (CalPERs Optional Benefits Listing Section 21362): this formula provides to local safety members 2% of pay at age 50 for each year of eligible service credited with that employer; midpoint of range = 9.50%.
Additional Optional Enhanced Benefit Provisions
o One-Year Final Compensation (Section 20042): the period determining the average monthly pay rate when calculating retirement benefits; base period is thirty-six (36) highest paid consecutive months; one-year final compensation is based on twelve (12) months highest paid consecutive months; midpoint of range for miscellaneous = 1.35%, safety = 2.35%.
o Employer Paid Member Contribution (Section 20636(c)(4)): the reporting of the value of the employer paid member contribution to CalPERS as special compensation; average value = employer paid member contribution multiplied by employer paid member contribution.
3. Insurance – This is the maximum amount paid by the agency for employees and dependents for a
cafeteria or flexible benefit plan and/or health, dental, vision, life, long-term and short-term disability, and employee assistance insurance.
4. Automobile – This category includes either the provision of an auto allowance or the provision of an
auto for personal use. If a car is provided to any classification for commuting and other personal use, the average monthly rate is estimated at $450.
5. Uniform – This category includes the provision of an allowance for uniforms and/or safety shoes or
work boots. 6. Deferred Compensation – We captured deferred compensation provided to all members of a
classification with or without the requirement for an employee to provide a matching or minimum contribution.
7. Other – This category includes any additional benefits available to all in the class. Please note that all of the above benefit elements are negotiated benefits provided to all members of each comparator class. As such, they represent an on-going cost for which an agency must budget. Other benefit costs, such as sick leave, tuition reimbursement, and reimbursable mileage are usage-based and cannot be quantified on an individual employee basis. In addition to the above list of benefits, the City was also interested in gathering information on the following: Leave Benefits (vacation, holidays, and paid administrative or personal leave) Retiree Health Benefits Longevity Benefits Cash-In-Lieu Benefits POST and Education Incentive Pay Police Special Assignment Pay Telecommuting Policy
Final Report – Total Compensation Study City of Madera
2835 7th Street, Berkeley, California 94710 | 510.658.5633 | www.KoffAssociates.com
9
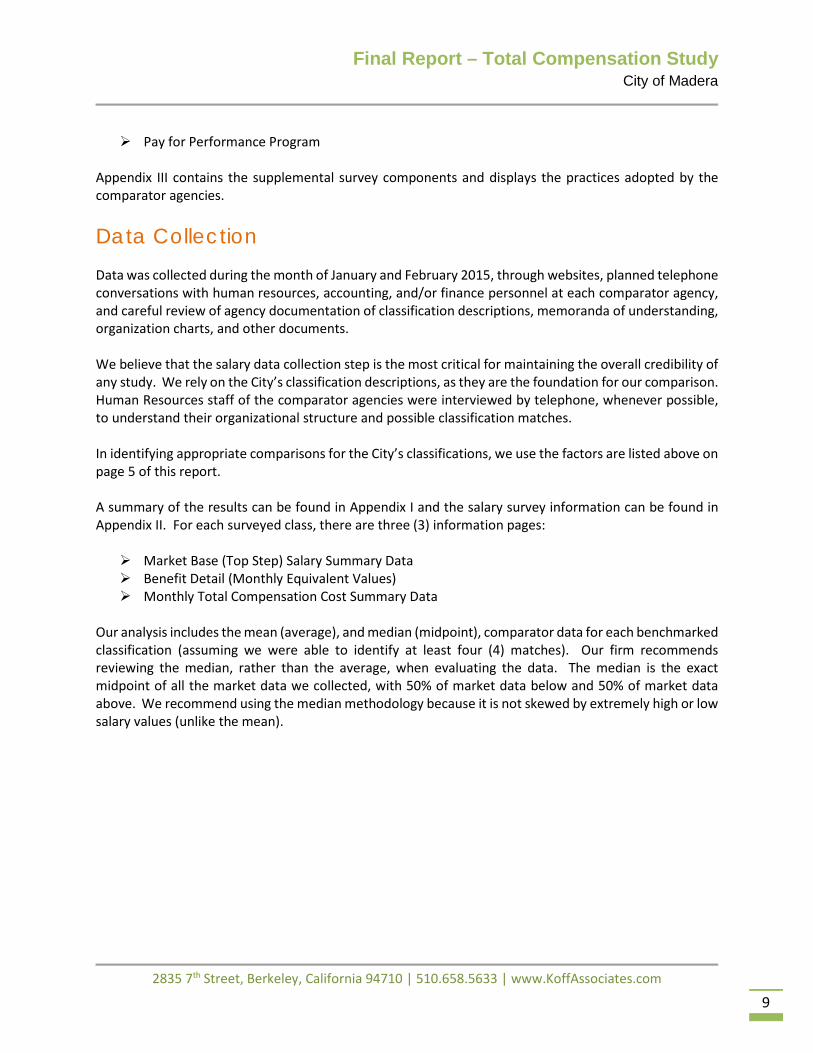
Pay for Performance Program Appendix III contains the supplemental survey components and displays the practices adopted by the comparator agencies.
Data Collection Data was collected during the month of January and February 2015, through websites, planned telephone conversations with human resources, accounting, and/or finance personnel at each comparator agency, and careful review of agency documentation of classification descriptions, memoranda of understanding, organization charts, and other documents. We believe that the salary data collection step is the most critical for maintaining the overall credibility of any study. We rely on the City’s classification descriptions, as they are the foundation for our comparison. Human Resources staff of the comparator agencies were interviewed by telephone, whenever possible, to understand their organizational structure and possible classification matches. In identifying appropriate comparisons for the City’s classifications, we use the factors are listed above on page 5 of this report. A summary of the results can be found in Appendix I and the salary survey information can be found in Appendix II. For each surveyed class, there are three (3) information pages: Market Base (Top Step) Salary Summary Data Benefit Detail (Monthly Equivalent Values) Monthly Total Compensation Cost Summary Data
Our analysis includes the mean (average), and median (midpoint), comparator data for each benchmarked classification (assuming we were able to identify at least four (4) matches). Our firm recommends reviewing the median, rather than the average, when evaluating the data. The median is the exact midpoint of all the market data we collected, with 50% of market data below and 50% of market data above. We recommend using the median methodology because it is not skewed by extremely high or low salary values (unlike the mean).
Final Report – Total Compensation Study City of Madera
2835 7th Street, Berkeley, California 94710 | 510.658.5633 | www.KoffAssociates.com
10
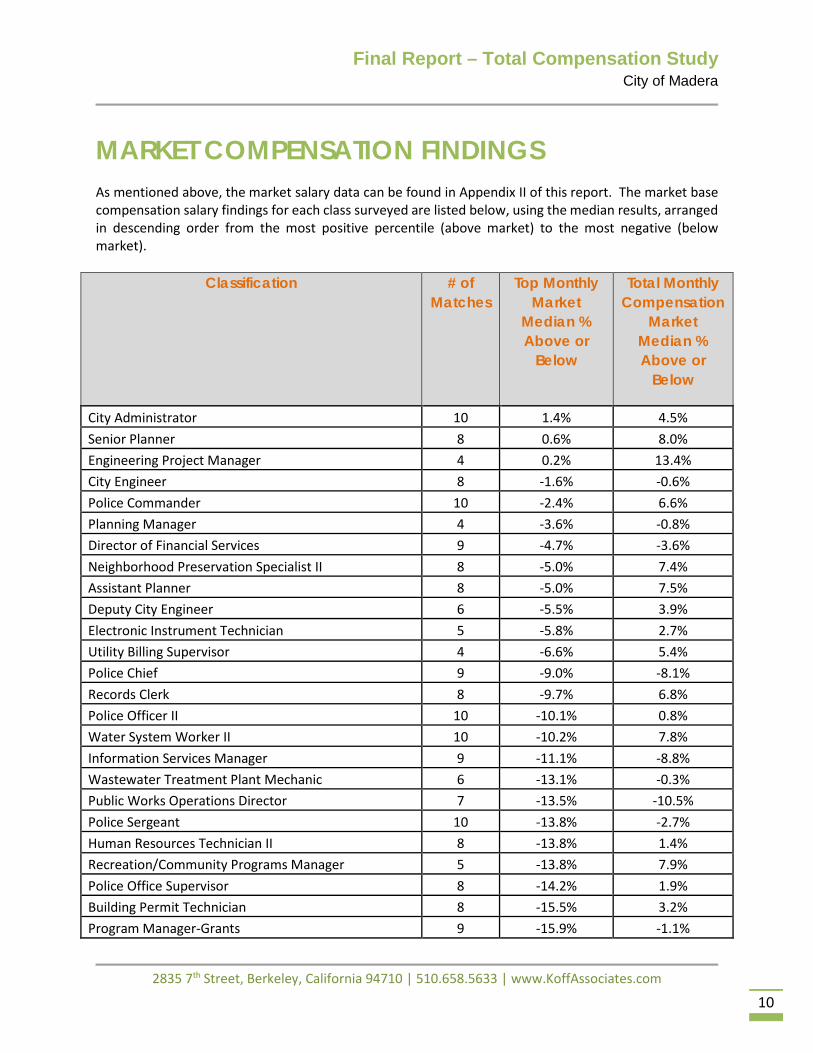
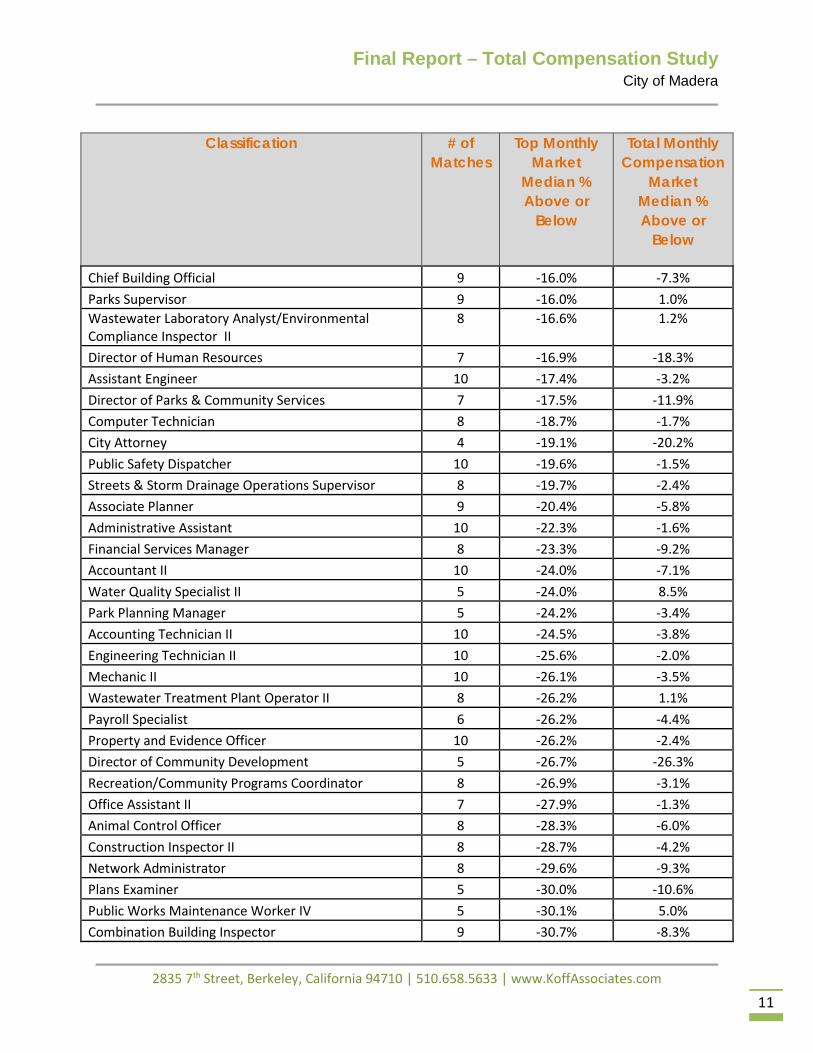
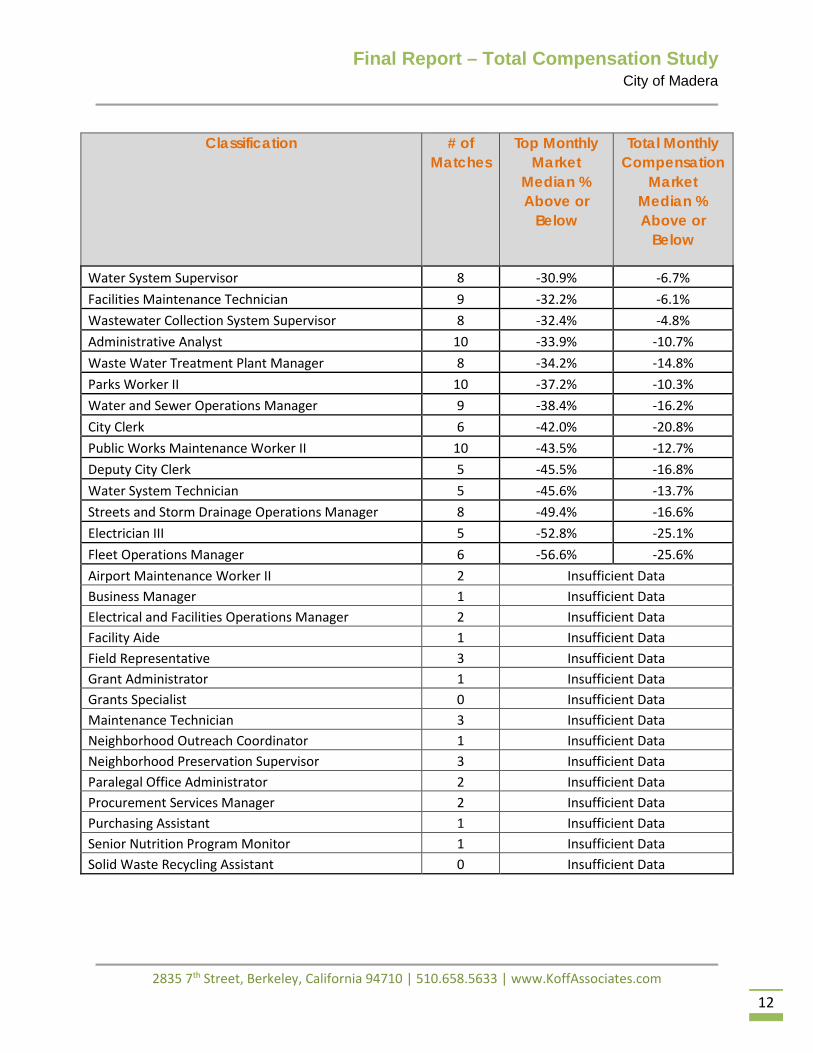
MARKET COMPENSATION FINDINGS As mentioned above, the market salary data can be found in Appendix II of this report. The market base compensation salary findings for each class surveyed are listed below, using the median results, arranged in descending order from the most positive percentile (above market) to the most negative (below market).
Classification # of Matches
Top Monthly Market
Median % Above or
Below
Total Monthly Compensation
Market Median % Above or
Below
City Administrator 10 1.4% 4.5% Senior Planner 8 0.6% 8.0% Engineering Project Manager 4 0.2% 13.4% City Engineer 8 -1.6% -0.6% Police Commander 10 -2.4% 6.6% Planning Manager 4 -3.6% -0.8% Director of Financial Services 9 -4.7% -3.6% Neighborhood Preservation Specialist II 8 -5.0% 7.4% Assistant Planner 8 -5.0% 7.5% Deputy City Engineer 6 -5.5% 3.9% Electronic Instrument Technician 5 -5.8% 2.7% Utility Billing Supervisor 4 -6.6% 5.4% Police Chief 9 -9.0% -8.1% Records Clerk 8 -9.7% 6.8% Police Officer II 10 -10.1% 0.8% Water System Worker II 10 -10.2% 7.8% Information Services Manager 9 -11.1% -8.8% Wastewater Treatment Plant Mechanic 6 -13.1% -0.3% Public Works Operations Director 7 -13.5% -10.5% Police Sergeant 10 -13.8% -2.7% Human Resources Technician II 8 -13.8% 1.4% Recreation/Community Programs Manager 5 -13.8% 7.9% Police Office Supervisor 8 -14.2% 1.9% Building Permit Technician 8 -15.5% 3.2% Program Manager-Grants 9 -15.9% -1.1%
Final Report – Total Compensation Study City of Madera
2835 7th Street, Berkeley, California 94710 | 510.658.5633 | www.KoffAssociates.com
11
Classification # of Matches
Top Monthly Market
Median % Above or
Below
Total Monthly Compensation
Market Median % Above or
Below
Chief Building Official 9 -16.0% -7.3% Parks Supervisor 9 -16.0% 1.0% Wastewater Laboratory Analyst/Environmental Compliance Inspector II
8 -16.6% 1.2%
Director of Human Resources 7 -16.9% -18.3% Assistant Engineer 10 -17.4% -3.2% Director of Parks & Community Services 7 -17.5% -11.9% Computer Technician 8 -18.7% -1.7% City Attorney 4 -19.1% -20.2% Public Safety Dispatcher 10 -19.6% -1.5% Streets & Storm Drainage Operations Supervisor 8 -19.7% -2.4% Associate Planner 9 -20.4% -5.8% Administrative Assistant 10 -22.3% -1.6% Financial Services Manager 8 -23.3% -9.2% Accountant II 10 -24.0% -7.1% Water Quality Specialist II 5 -24.0% 8.5% Park Planning Manager 5 -24.2% -3.4% Accounting Technician II 10 -24.5% -3.8% Engineering Technician II 10 -25.6% -2.0% Mechanic II 10 -26.1% -3.5% Wastewater Treatment Plant Operator II 8 -26.2% 1.1% Payroll Specialist 6 -26.2% -4.4% Property and Evidence Officer 10 -26.2% -2.4% Director of Community Development 5 -26.7% -26.3% Recreation/Community Programs Coordinator 8 -26.9% -3.1% Office Assistant II 7 -27.9% -1.3% Animal Control Officer 8 -28.3% -6.0% Construction Inspector II 8 -28.7% -4.2% Network Administrator 8 -29.6% -9.3% Plans Examiner 5 -30.0% -10.6% Public Works Maintenance Worker IV 5 -30.1% 5.0% Combination Building Inspector 9 -30.7% -8.3%
Final Report – Total Compensation Study City of Madera
2835 7th Street, Berkeley, California 94710 | 510.658.5633 | www.KoffAssociates.com
12
Classification # of Matches
Top Monthly Market
Median % Above or
Below
Total Monthly Compensation
Market Median % Above or
Below
Water System Supervisor 8 -30.9% -6.7% Facilities Maintenance Technician 9 -32.2% -6.1% Wastewater Collection System Supervisor 8 -32.4% -4.8% Administrative Analyst 10 -33.9% -10.7% Waste Water Treatment Plant Manager 8 -34.2% -14.8% Parks Worker II 10 -37.2% -10.3% Water and Sewer Operations Manager 9 -38.4% -16.2% City Clerk 6 -42.0% -20.8% Public Works Maintenance Worker II 10 -43.5% -12.7% Deputy City Clerk 5 -45.5% -16.8% Water System Technician 5 -45.6% -13.7% Streets and Storm Drainage Operations Manager 8 -49.4% -16.6% Electrician III 5 -52.8% -25.1% Fleet Operations Manager 6 -56.6% -25.6% Airport Maintenance Worker II 2 Insufficient Data Business Manager 1 Insufficient Data Electrical and Facilities Operations Manager 2 Insufficient Data Facility Aide 1 Insufficient Data Field Representative 3 Insufficient Data Grant Administrator 1 Insufficient Data Grants Specialist 0 Insufficient Data Maintenance Technician 3 Insufficient Data Neighborhood Outreach Coordinator 1 Insufficient Data Neighborhood Preservation Supervisor 3 Insufficient Data Paralegal Office Administrator 2 Insufficient Data Procurement Services Manager 2 Insufficient Data Purchasing Assistant 1 Insufficient Data Senior Nutrition Program Monitor 1 Insufficient Data Solid Waste Recycling Assistant 0 Insufficient Data
Final Report – Total Compensation Study City of Madera
2835 7th Street, Berkeley, California 94710 | 510.658.5633 | www.KoffAssociates.com
13
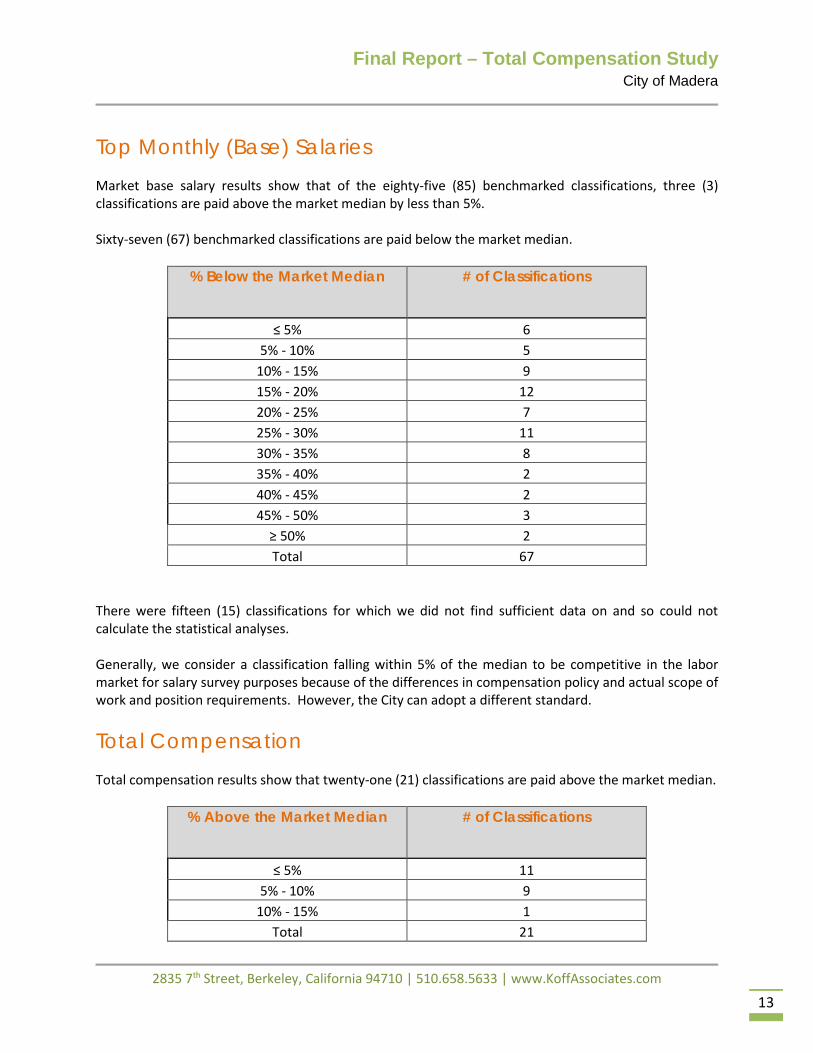
Top Monthly (Base) Salaries Market base salary results show that of the eighty-five (85) benchmarked classifications, three (3) classifications are paid above the market median by less than 5%. Sixty-seven (67) benchmarked classifications are paid below the market median.
% Below the Market Median # of Classifications
≤ 5% 6 5% - 10% 5
10% - 15% 9 15% - 20% 12 20% - 25% 7 25% - 30% 11 30% - 35% 8 35% - 40% 2 40% - 45% 2 45% - 50% 3
≥ 50% 2 Total 67
There were fifteen (15) classifications for which we did not find sufficient data on and so could not calculate the statistical analyses. Generally, we consider a classification falling within 5% of the median to be competitive in the labor market for salary survey purposes because of the differences in compensation policy and actual scope of work and position requirements. However, the City can adopt a different standard.
Total Compensation Total compensation results show that twenty-one (21) classifications are paid above the market median.
% Above the Market Median # of Classifications
≤ 5% 11 5% - 10% 9
10% - 15% 1 Total 21
Final Report – Total Compensation Study City of Madera
2835 7th Street, Berkeley, California 94710 | 510.658.5633 | www.KoffAssociates.com
14
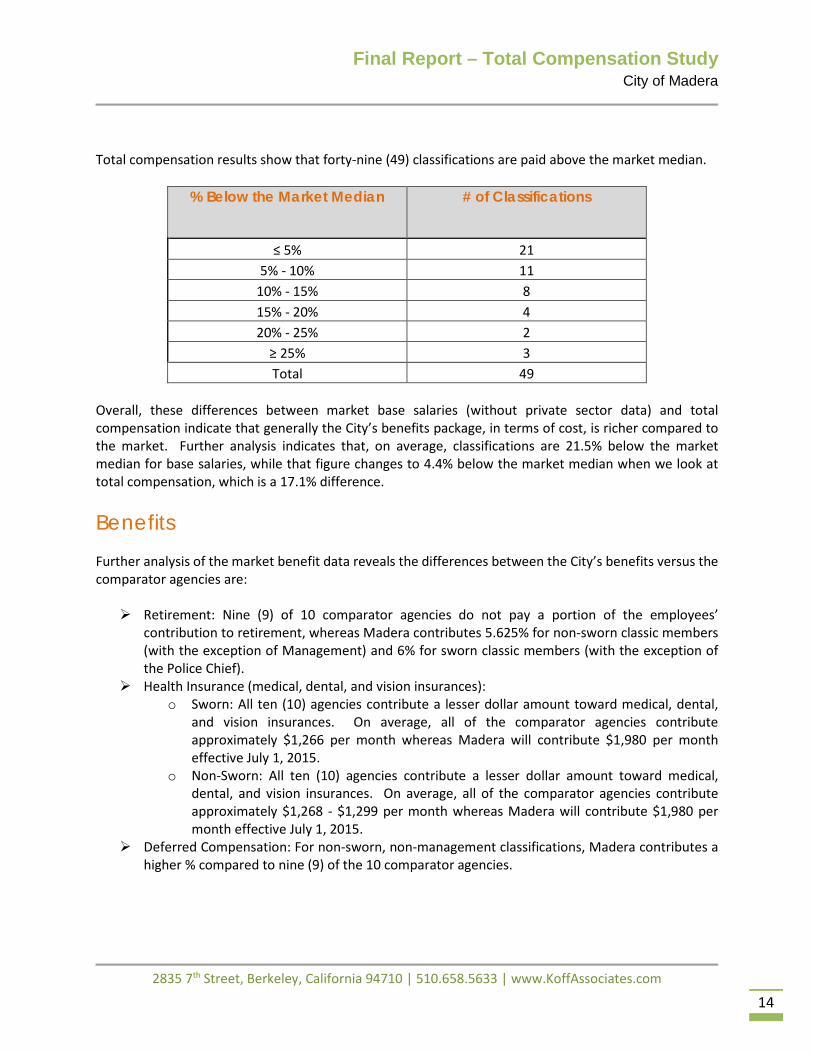
Total compensation results show that forty-nine (49) classifications are paid above the market median.
% Below the Market Median # of Classifications
≤ 5% 21 5% - 10% 11
10% - 15% 8 15% - 20% 4 20% - 25% 2
≥ 25% 3 Total 49
Overall, these differences between market base salaries (without private sector data) and total compensation indicate that generally the City’s benefits package, in terms of cost, is richer compared to the market. Further analysis indicates that, on average, classifications are 21.5% below the market median for base salaries, while that figure changes to 4.4% below the market median when we look at total compensation, which is a 17.1% difference.
Benefits Further analysis of the market benefit data reveals the differences between the City’s benefits versus the comparator agencies are: Retirement: Nine (9) of 10 comparator agencies do not pay a portion of the employees’
contribution to retirement, whereas Madera contributes 5.625% for non-sworn classic members (with the exception of Management) and 6% for sworn classic members (with the exception of the Police Chief).
Health Insurance (medical, dental, and vision insurances): o Sworn: All ten (10) agencies contribute a lesser dollar amount toward medical, dental,
and vision insurances. On average, all of the comparator agencies contribute approximately $1,266 per month whereas Madera will contribute $1,980 per month effective July 1, 2015.
o Non-Sworn: All ten (10) agencies contribute a lesser dollar amount toward medical, dental, and vision insurances. On average, all of the comparator agencies contribute approximately $1,268 - $1,299 per month whereas Madera will contribute $1,980 per month effective July 1, 2015.
Deferred Compensation: For non-sworn, non-management classifications, Madera contributes a higher % compared to nine (9) of the 10 comparator agencies.
Final Report – Total Compensation Study City of Madera
2835 7th Street, Berkeley, California 94710 | 510.658.5633 | www.KoffAssociates.com
15
INTERNAL SALARY RELATIONSHIPS Building from the salary levels established for identified benchmark classes, internal salary relationships can be developed and consistently applied in order to develop specific salary recommendations for all non-benchmarked classifications. In the future, the City may need to utilize internal alignment practices as the staff grows and additional classifications are added. While analyzing internal relationships, the same factors that we used in comparing the City’s current classifications to the labor market during the compensation study should be considered. Below are standard human resources practices that are commonly applied, when making salary recommendations based upon internal relationships, as follows:
A salary within 5% of the market average or median is considered to be competitive in the labor
market for salary survey purposes because of the differences in compensation policy and actual scope of the position and its requirements. However, a closer standard can be adopted by an agency.
Certain internal percentages are often applied. Those that are the most common are: The differential between a trainee and experienced class in a series (I/II or
Trainee/Experienced) is generally 10% to 15%; A lead or advanced journey-level (III or Senior-level) position is generally placed 10% to
15% above the lower experienced level; A full supervisory position is normally placed at least 15% to 20% above the highest level
supervised, depending upon the breadth and scope of supervision; and A full management position is normally placed at least 20% to 25% above the supervisor.
When a market or internal equity adjustment is granted to one class in a series, the other classes
in the series are also adjusted accordingly to maintain internal equity. Internal equity between certain levels of classification is a fundamental factor to be considered when making salary decisions. When conducting a market compensation survey, results can often show that certain classifications that are aligned with each other are not the same in the outside labor market. However, as an organization, careful consideration needs to be given to these alignments because they represent internal value of classifications within job families, as well as across the organization. For all classifications that were not benchmarked or where we did not find sufficient market data, internal alignments with other classifications will need to be considered, either in the same class series or those classifications that have similar scope of work, level of responsibility, and “worth” to the City. Where it is difficult to ascertain internal relationships due to unique qualifications and responsibilities, reliance can be placed on past internal relationships. It is important for City management to carefully review these internal relationships and determine if they are still appropriate given the current market data.
Final Report – Total Compensation Study City of Madera
2835 7th Street, Berkeley, California 94710 | 510.658.5633 | www.KoffAssociates.com
16
It is important to analyze market data and internal relationships within class series as well as across the organization, and make adjustments to salary range placements as necessary based on the needs of the organization. The City may want to make internal equity adjustments or alignments, as it implements a compensation strategy. This market survey is only a tool to be used by the City to determine market indexing and salary determination.
Pay Philosophy The City has many options regarding what type of compensation plan it wants to implement. This decision will be based on what the City’s pay philosophy is, at which level it desires to pay its employees compared to the market, whether it is going to consider additional alternative compensation programs, and how great the competition is with other agencies over recruitment of a highly-qualified workforce.
Final Report – Total Compensation Study City of Madera
2835 7th Street, Berkeley, California 94710 | 510.658.5633 | www.KoffAssociates.com
17
USING THE MARKET DATA AS A TOOL We wish to reiterate that this report and our findings are meant to be a tool for the City to create and implement an equitable compensation plan. Compensation strategies are designed to attract and retain excellent staff. However, financial realities and the City’s expectations may also come into play when determining appropriate compensation philosophies and strategies. The data collected represents a market survey that will give the City an instrument to make future compensation decisions. It has been a pleasure working with City of Madera on this critical project. Please do not hesitate to contact us if we can provide any additional information or clarification regarding this report. Respectfully Submitted, Koff & Associates Katie Kaneko President
Final Report – Total Compensation Study City of Madera
2835 7th Street, Berkeley, California 94710 | 510.658.5633 | www.KoffAssociates.com
Appendix I
Results Summary
Final Report – Total Compensation Study City of Madera
Appendix II
Market Base, Benefits, and Total Compensation Findings
Final Report – Total Compensation Study City of Madera
Appendix III
Additional Benefits