Embed Size (px)
Citation preview

FINAL REPORT
OGP, E&P Sound and Marine Life, JIP
Svein Vaage Broadband Airgun Study
Anders Mattsson, October 2010
PGS Geophysical
Author: A. Mattsson
REPORT
OGP, E&P Sound and Marine Life, JIP
Svein Vaage Broadband Airgun Study
Page : 2 of 27
Date : 27-10-10
1. Introduction ...................................................... 3
2. Test specification ................................................ 3 2.1 Instrumentation set up ............................................. 3
2.1.1 Hydrophones and accelerometer ................................ 6 2.2 Test program ....................................................... 6 2.3 Location ........................................................... 6 2.4 Fish farm monitoring ............................................... 8
2.4.1 Active monitoring ............................................ 8 2.5 Åknes/Tafjord ...................................................... 9
3. Testing and QC .................................................... 9 3.1 Measurements ....................................................... 9 3.2 QC ................................................................ 11
4. Conclusions and comments ......................................... 20
5. Acknowledgements ................................................. 20
6. Appendix A ....................................................... 21
PGS Geophysical
Author: A. Mattsson
REPORT
OGP, E&P Sound and Marine Life, JIP
Svein Vaage Broadband Airgun Study
Page : 3 of 27
Date : 27-10-10
1. Introduction
The purpose of the project was to conduct far-field measurements of airgun and airgun cluster signatures up to 50
kHz for further development of the theoretical model of the seismic source, particularly at higher frequencies.
Extensive measurements were made of the most commonly used airgun types in the industry, over a range of
volumes, operating depths and pressures. These measurements were done in the near-field, mid-field and far-field
using 19 hydrophones and 1 accelerometer. In addition, velocity sensor measurements were made in some parts of
the dataset.
A test site was built up on the west coast of Norway in Hjørundfjord and measurements were conducted from June
to October during 2007. In 2008 the measurements were put on hold due to conflicts with salmon river
organization, fish farmers and local authorities. The test site was relocated to Storfjorden in 2009 and
measurements were conducted from May 2009 to June 2010.
2. Test specification
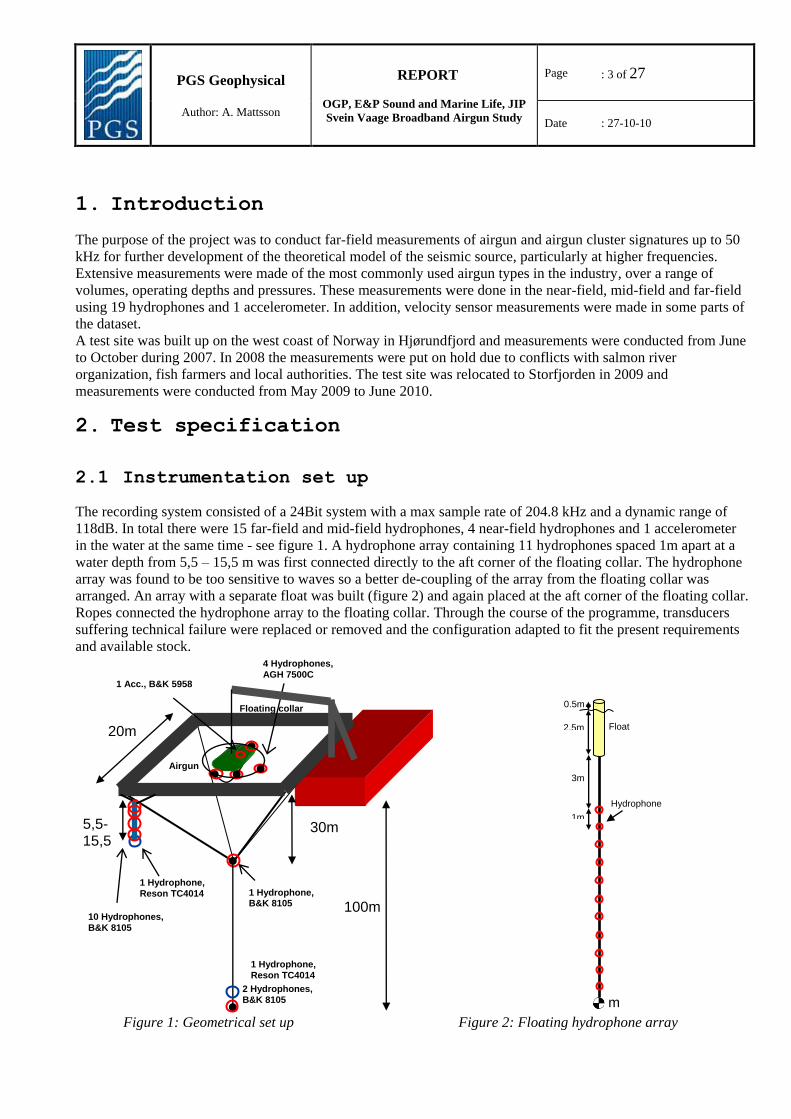
2.1 Instrumentation set up
The recording system consisted of a 24Bit system with a max sample rate of 204.8 kHz and a dynamic range of
118dB. In total there were 15 far-field and mid-field hydrophones, 4 near-field hydrophones and 1 accelerometer
in the water at the same time - see figure 1. A hydrophone array containing 11 hydrophones spaced 1m apart at a
water depth from 5,5 – 15,5 m was first connected directly to the aft corner of the floating collar. The hydrophone
array was found to be too sensitive to waves so a better de-coupling of the array from the floating collar was
arranged. An array with a separate float was built (figure 2) and again placed at the aft corner of the floating collar.
Ropes connected the hydrophone array to the floating collar. Through the course of the programme, transducers
suffering technical failure were replaced or removed and the configuration adapted to fit the present requirements
and available stock.
Figure 1: Geometrical set up Figure 2: Floating hydrophone array
0.5m
2.5m Float
1m
m
Hydrophones
3m
2 Hydrophones, B&K 8105
4 Hydrophones,
AGH 7500C
10 Hydrophones,
B&K 8105
5,5-15,5m
30m
Airgun
1 Hydrophone, B&K 8105
1 Hydrophone, Reson TC4014
Floating collar 1 Acc., B&K 5958
1 Hydrophone, Reson TC4014
20m
100m
PGS Geophysical
Author: A. Mattsson
REPORT
OGP, E&P Sound and Marine Life, JIP
Svein Vaage Broadband Airgun Study
Page : 4 of 27
Date : 27-10-10
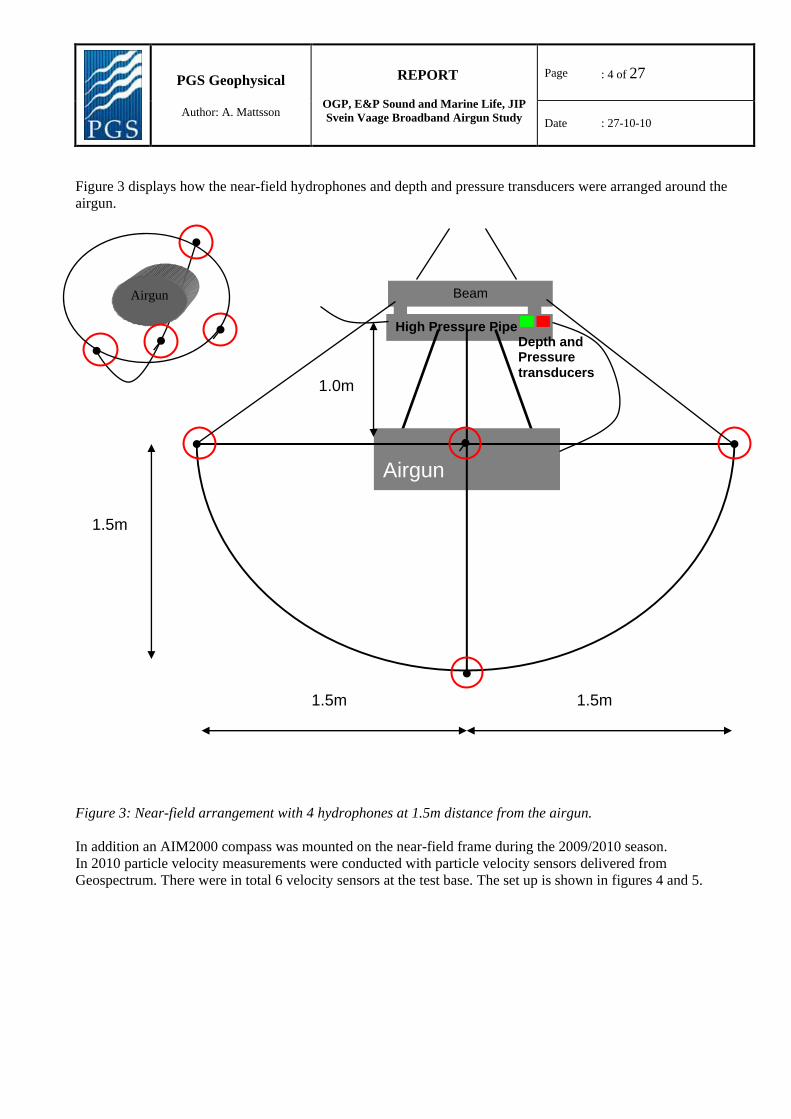
Figure 3 displays how the near-field hydrophones and depth and pressure transducers were arranged around the
airgun.
Figure 3: Near-field arrangement with 4 hydrophones at 1.5m distance from the airgun.
In addition an AIM2000 compass was mounted on the near-field frame during the 2009/2010 season.
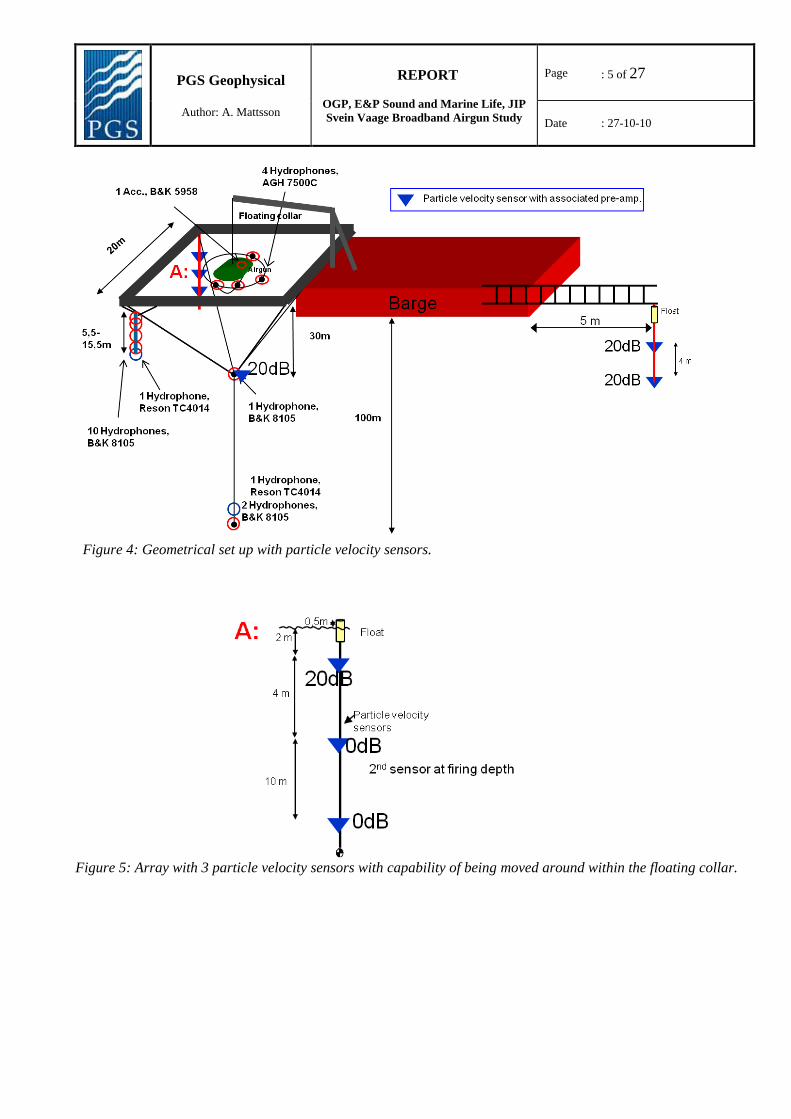
In 2010 particle velocity measurements were conducted with particle velocity sensors delivered from
Geospectrum. There were in total 6 velocity sensors at the test base. The set up is shown in figures 4 and 5.
1.5m
Beam
High Pressure Pipe
Airgun
1.0m
Depth and Pressure transducers
P D
1.5m 1.5m
Airgun
PGS Geophysical
Author: A. Mattsson
REPORT
OGP, E&P Sound and Marine Life, JIP
Svein Vaage Broadband Airgun Study
Page : 5 of 27
Date : 27-10-10
Figure 4: Geometrical set up with particle velocity sensors.
Figure 5: Array with 3 particle velocity sensors with capability of being moved around within the floating collar.
PGS Geophysical
Author: A. Mattsson
REPORT
OGP, E&P Sound and Marine Life, JIP
Svein Vaage Broadband Airgun Study
Page : 6 of 27
Date : 27-10-10
2.1.1 Hydrophones and accelerometer
Far-field hydrophones used:
Bruel&Kjaer 8105, frequency range 0.1Hz -160kHz
Reson TC4014-5, frequency range 15Hz - 480kHz
Near-field hydrophones used:
AGH 7500C, frequency range 1Hz - 1kHz
AGH 7100C (Additional PGS near-field hydrophone placed on the beam above the airgun)
Accelerometer mounted directly on the airgun:
Bruel&Kjaer 5958, frequency range 0.3Hz - 11kHz
2.2 Test program
The most commonly used airguns and 2-element cluster configurations within the geophysical industry were
measured. Airgun type, volume size, operating pressure and depth of the source were varied in the experiment. The
effect of varying the separation between individual airguns within clusters was also measured. At the end of the
test program particle velocity measurements at different positions relative to the seismic source were conducted.
The single airuns that were measured were:
- G-gun 60 cui, 150 cui and 250 cui.
- Bolt 1900 LLXT 30 cui, 120 cui and 200 cui.
- Bolt 1500 LL 80 cui, 150 cui and 340 cui.
- G-gun II 380 cui and 520 cui.
- Bolt APG 175 cui and 300 cui
- GI-gun 45 cui, 75 cui, 105 cui and 150 cui.
- Sleeve gun 10 cui, 20 cui and 40 cui.
For the complete acquisition list please see Appendix A.
2.3 Location
A test site was built up on the west coast of Norway in Hjørundfjord (figures 6 and 7) and measurements were
conducted from June to October during 2007. Test area and permission to perform the measurements were given
by the Norwegian Directorate of Fisheries. The test platform was then de-rigged at the end of the 2007 season.
A new test location in Romsdalsfjorden was authorized by the Norwegian Directorate of Fisheries for the 2008
season. Just before start up at the new test site local authorities together with fish farmers and salmon river
organization opposed the measurements. The Norwegian Petroleum Directorate advised PGS not to pursue this
conflict with the local authorities. It was therefore decided by the JIP PSG to call off the operation for 2008 and to
start investigate alternative test sites for 2009.
New measurements were made from May 2009 to June 2010 in Storfjorden (figure 8), but also in this period the
test area had to be slightly relocated within the same fjord due to young fish being put into a nearby fish farm. A
representative for the fisheries was onboard the test platform at all testing.
PGS Geophysical
Author: A. Mattsson
REPORT
OGP, E&P Sound and Marine Life, JIP
Svein Vaage Broadband Airgun Study
Page : 7 of 27
Date : 27-10-10
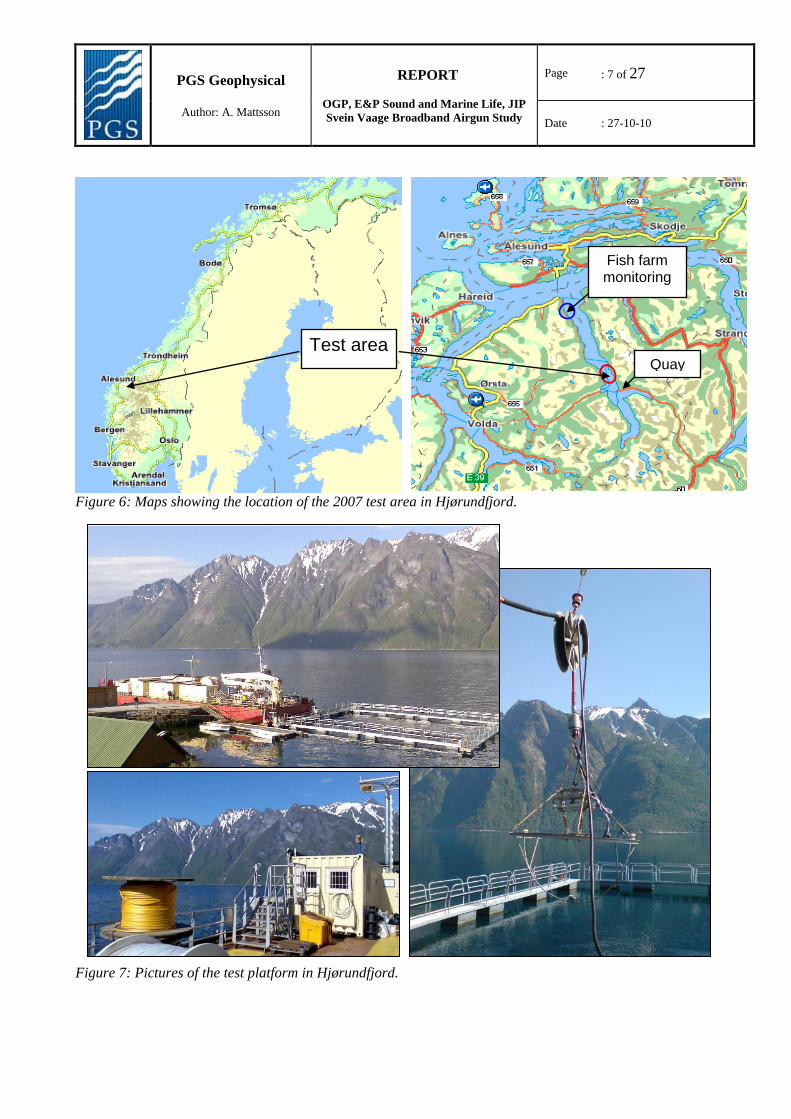
Figure 6: Maps showing the location of the 2007 test area in Hjørundfjord.
Figure 7: Pictures of the test platform in Hjørundfjord.
Test area Quay
Fish farm monitoring
PGS Geophysical
Author: A. Mattsson
REPORT
OGP, E&P Sound and Marine Life, JIP
Svein Vaage Broadband Airgun Study
Page : 8 of 27
Date : 27-10-10
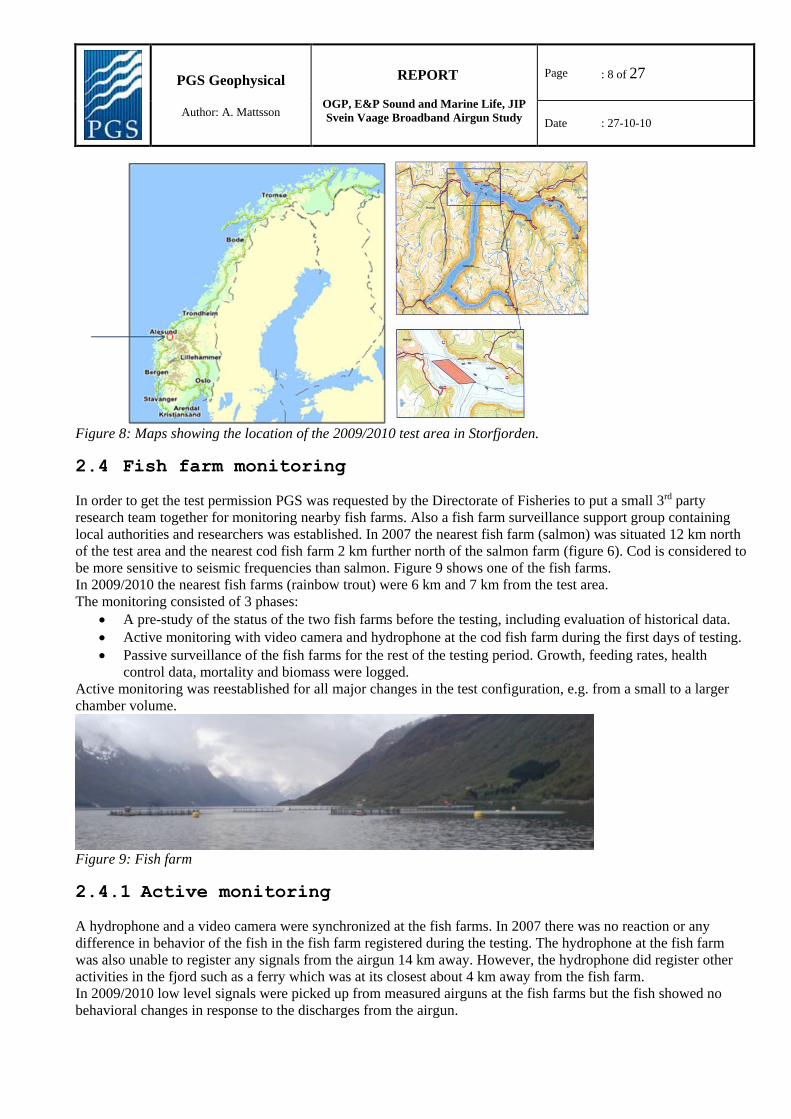
Figure 8: Maps showing the location of the 2009/2010 test area in Storfjorden.
2.4 Fish farm monitoring
In order to get the test permission PGS was requested by the Directorate of Fisheries to put a small 3rd party
research team together for monitoring nearby fish farms. Also a fish farm surveillance support group containing
local authorities and researchers was established. In 2007 the nearest fish farm (salmon) was situated 12 km north
of the test area and the nearest cod fish farm 2 km further north of the salmon farm (figure 6). Cod is considered to
be more sensitive to seismic frequencies than salmon. Figure 9 shows one of the fish farms.
In 2009/2010 the nearest fish farms (rainbow trout) were 6 km and 7 km from the test area.
The monitoring consisted of 3 phases:
A pre-study of the status of the two fish farms before the testing, including evaluation of historical data.
Active monitoring with video camera and hydrophone at the cod fish farm during the first days of testing.
Passive surveillance of the fish farms for the rest of the testing period. Growth, feeding rates, health
control data, mortality and biomass were logged.
Active monitoring was reestablished for all major changes in the test configuration, e.g. from a small to a larger
chamber volume.
Figure 9: Fish farm
2.4.1 Active monitoring
A hydrophone and a video camera were synchronized at the fish farms. In 2007 there was no reaction or any
difference in behavior of the fish in the fish farm registered during the testing. The hydrophone at the fish farm
was also unable to register any signals from the airgun 14 km away. However, the hydrophone did register other
activities in the fjord such as a ferry which was at its closest about 4 km away from the fish farm.
In 2009/2010 low level signals were picked up from measured airguns at the fish farms but the fish showed no
behavioral changes in response to the discharges from the airgun.
PGS Geophysical
Author: A. Mattsson
REPORT
OGP, E&P Sound and Marine Life, JIP
Svein Vaage Broadband Airgun Study
Page : 9 of 27
Date : 27-10-10
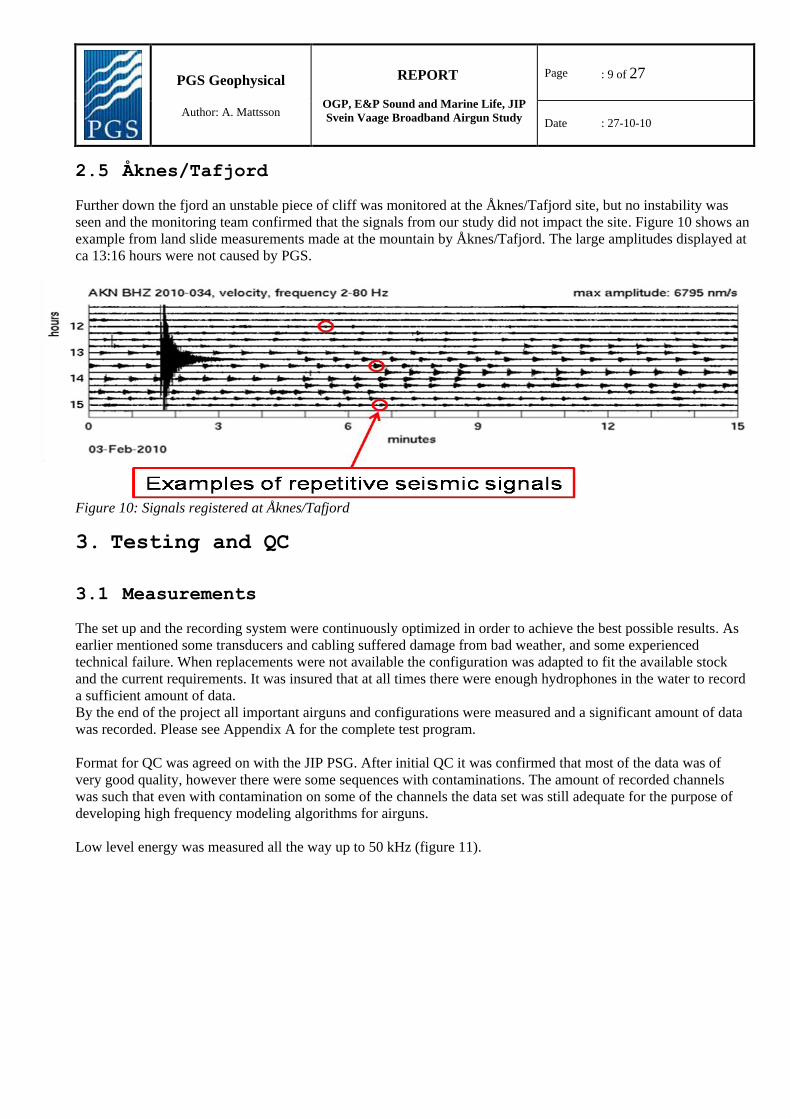
2.5 Åknes/Tafjord
Further down the fjord an unstable piece of cliff was monitored at the Åknes/Tafjord site, but no instability was
seen and the monitoring team confirmed that the signals from our study did not impact the site. Figure 10 shows an
example from land slide measurements made at the mountain by Åknes/Tafjord. The large amplitudes displayed at
ca 13:16 hours were not caused by PGS.
Figure 10: Signals registered at Åknes/Tafjord
3. Testing and QC
3.1 Measurements
The set up and the recording system were continuously optimized in order to achieve the best possible results. As
earlier mentioned some transducers and cabling suffered damage from bad weather, and some experienced
technical failure. When replacements were not available the configuration was adapted to fit the available stock
and the current requirements. It was insured that at all times there were enough hydrophones in the water to record
a sufficient amount of data.
By the end of the project all important airguns and configurations were measured and a significant amount of data
was recorded. Please see Appendix A for the complete test program.
Format for QC was agreed on with the JIP PSG. After initial QC it was confirmed that most of the data was of
very good quality, however there were some sequences with contaminations. The amount of recorded channels
was such that even with contamination on some of the channels the data set was still adequate for the purpose of
developing high frequency modeling algorithms for airguns.
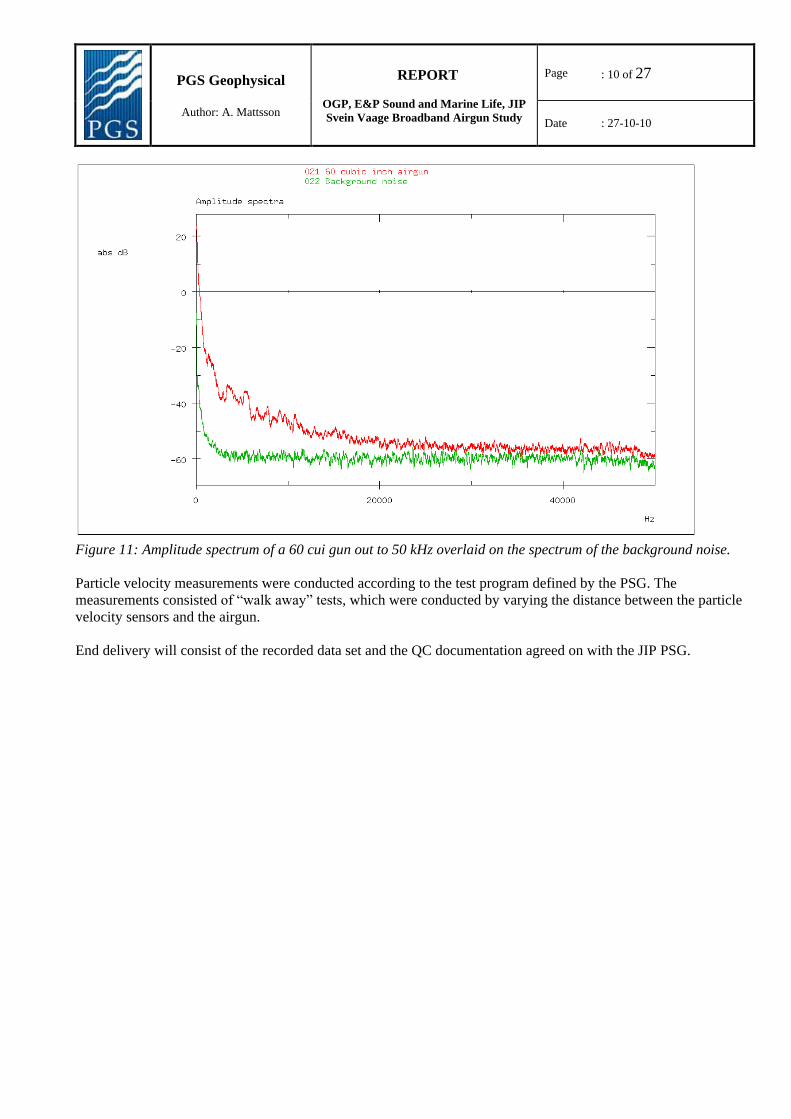
Low level energy was measured all the way up to 50 kHz (figure 11).
PGS Geophysical
Author: A. Mattsson
REPORT
OGP, E&P Sound and Marine Life, JIP
Svein Vaage Broadband Airgun Study
Page : 10 of 27
Date : 27-10-10
Figure 11: Amplitude spectrum of a 60 cui gun out to 50 kHz overlaid on the spectrum of the background noise.
Particle velocity measurements were conducted according to the test program defined by the PSG. The
measurements consisted of “walk away” tests, which were conducted by varying the distance between the particle
velocity sensors and the airgun.
End delivery will consist of the recorded data set and the QC documentation agreed on with the JIP PSG.
PGS Geophysical
Author: A. Mattsson
REPORT
OGP, E&P Sound and Marine Life, JIP
Svein Vaage Broadband Airgun Study
Page : 11 of 27
Date : 27-10-10
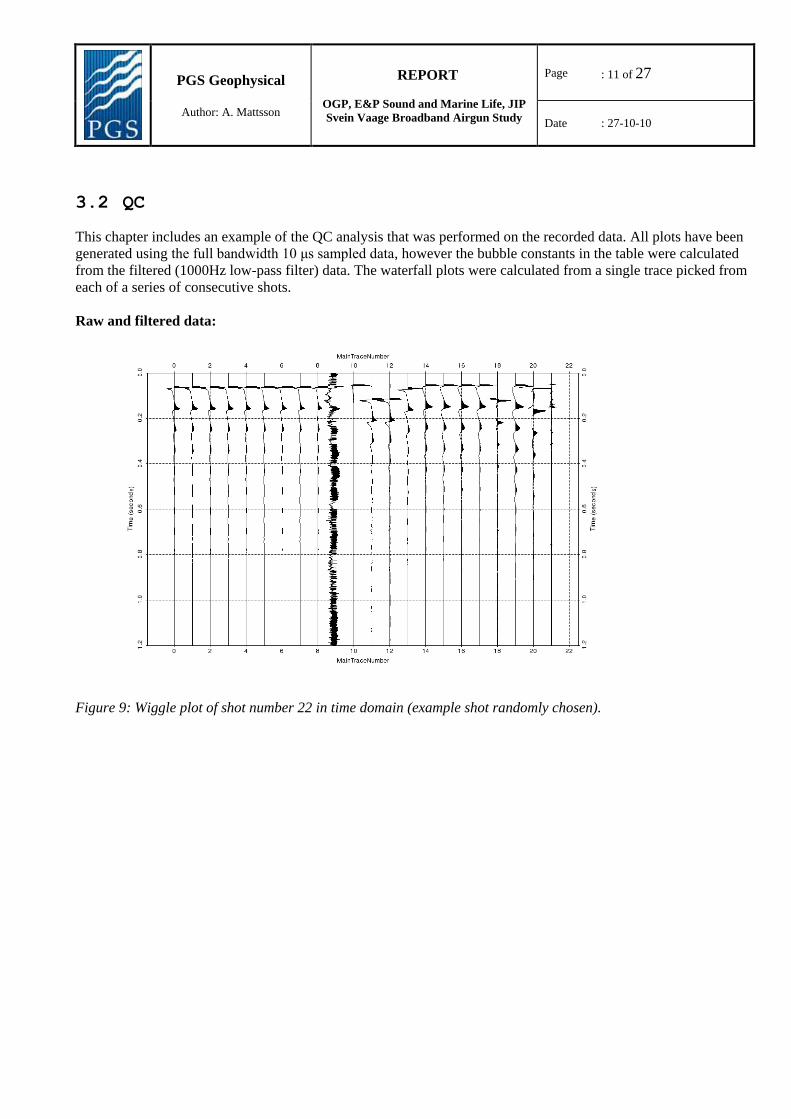
3.2 QC
This chapter includes an example of the QC analysis that was performed on the recorded data. All plots have been
generated using the full bandwidth 10 μs sampled data, however the bubble constants in the table were calculated
from the filtered (1000Hz low-pass filter) data. The waterfall plots were calculated from a single trace picked from
each of a series of consecutive shots.
Raw and filtered data:
Figure 9: Wiggle plot of shot number 22 in time domain (example shot randomly chosen).
PGS Geophysical
Author: A. Mattsson
REPORT
OGP, E&P Sound and Marine Life, JIP
Svein Vaage Broadband Airgun Study
Page : 12 of 27
Date : 27-10-10
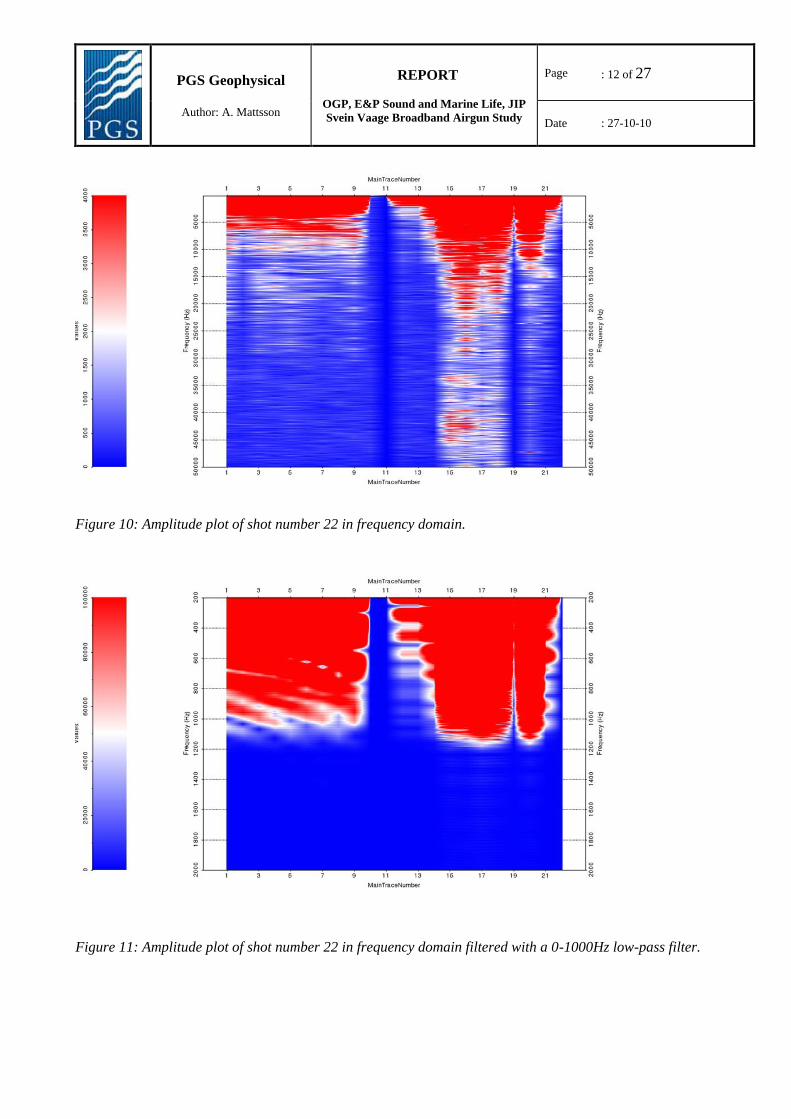
Figure 10: Amplitude plot of shot number 22 in frequency domain.
Figure 11: Amplitude plot of shot number 22 in frequency domain filtered with a 0-1000Hz low-pass filter.
PGS Geophysical
Author: A. Mattsson
REPORT
OGP, E&P Sound and Marine Life, JIP
Svein Vaage Broadband Airgun Study
Page : 13 of 27
Date : 27-10-10
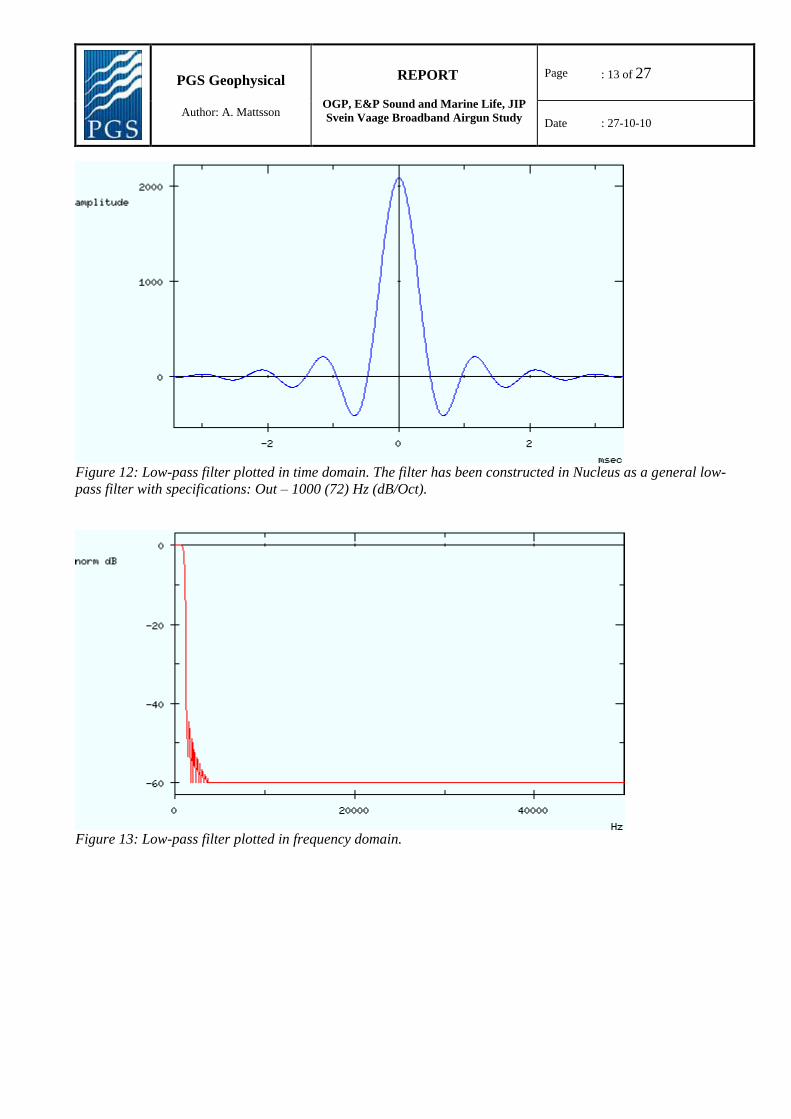
Figure 12: Low-pass filter plotted in time domain. The filter has been constructed in Nucleus as a general low-
pass filter with specifications: Out – 1000 (72) Hz (dB/Oct).
Figure 13: Low-pass filter plotted in frequency domain.
PGS Geophysical
Author: A. Mattsson
REPORT
OGP, E&P Sound and Marine Life, JIP
Svein Vaage Broadband Airgun Study
Page : 14 of 27
Date : 27-10-10
Figure 14: Low-pass filter, phase spectrum.
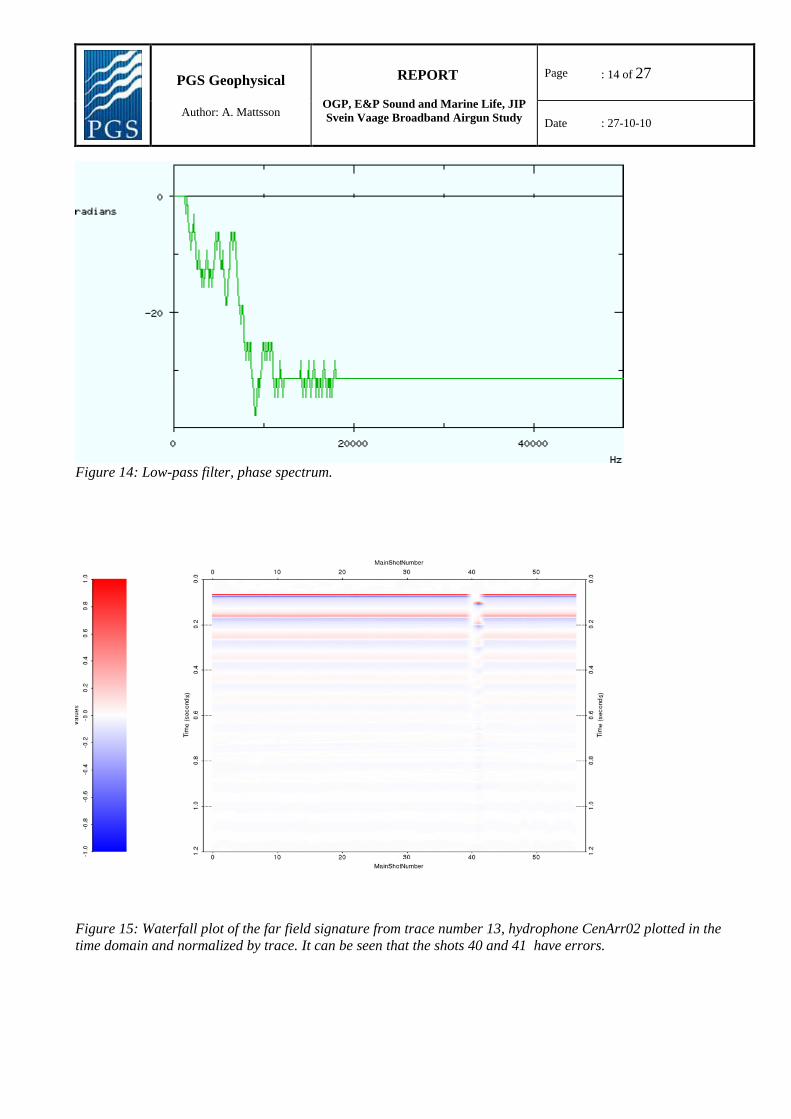
Figure 15: Waterfall plot of the far field signature from trace number 13, hydrophone CenArr02 plotted in the
time domain and normalized by trace. It can be seen that the shots 40 and 41 have errors.
PGS Geophysical
Author: A. Mattsson
REPORT
OGP, E&P Sound and Marine Life, JIP
Svein Vaage Broadband Airgun Study
Page : 15 of 27
Date : 27-10-10
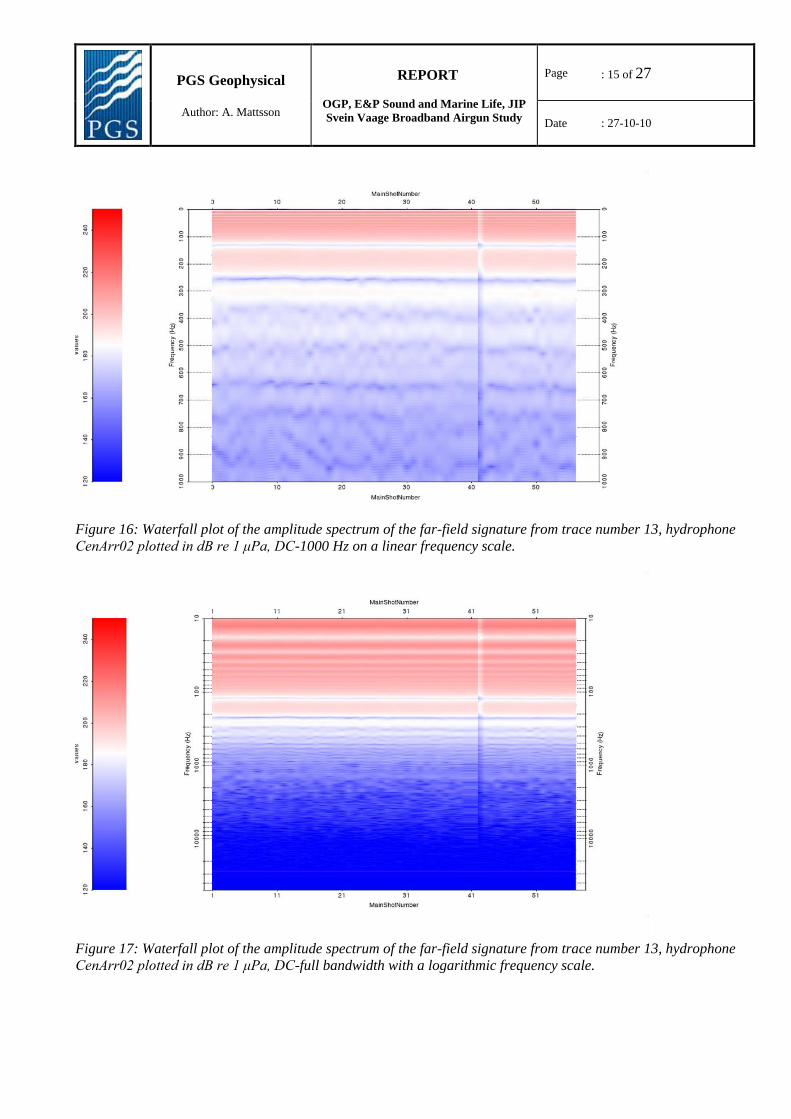
Figure 16: Waterfall plot of the amplitude spectrum of the far-field signature from trace number 13, hydrophone
CenArr02 plotted in dB re 1 μPa, DC-1000 Hz on a linear frequency scale.
Figure 17: Waterfall plot of the amplitude spectrum of the far-field signature from trace number 13, hydrophone
CenArr02 plotted in dB re 1 μPa, DC-full bandwidth with a logarithmic frequency scale.
PGS Geophysical
Author: A. Mattsson
REPORT
OGP, E&P Sound and Marine Life, JIP
Svein Vaage Broadband Airgun Study
Page : 16 of 27
Date : 27-10-10
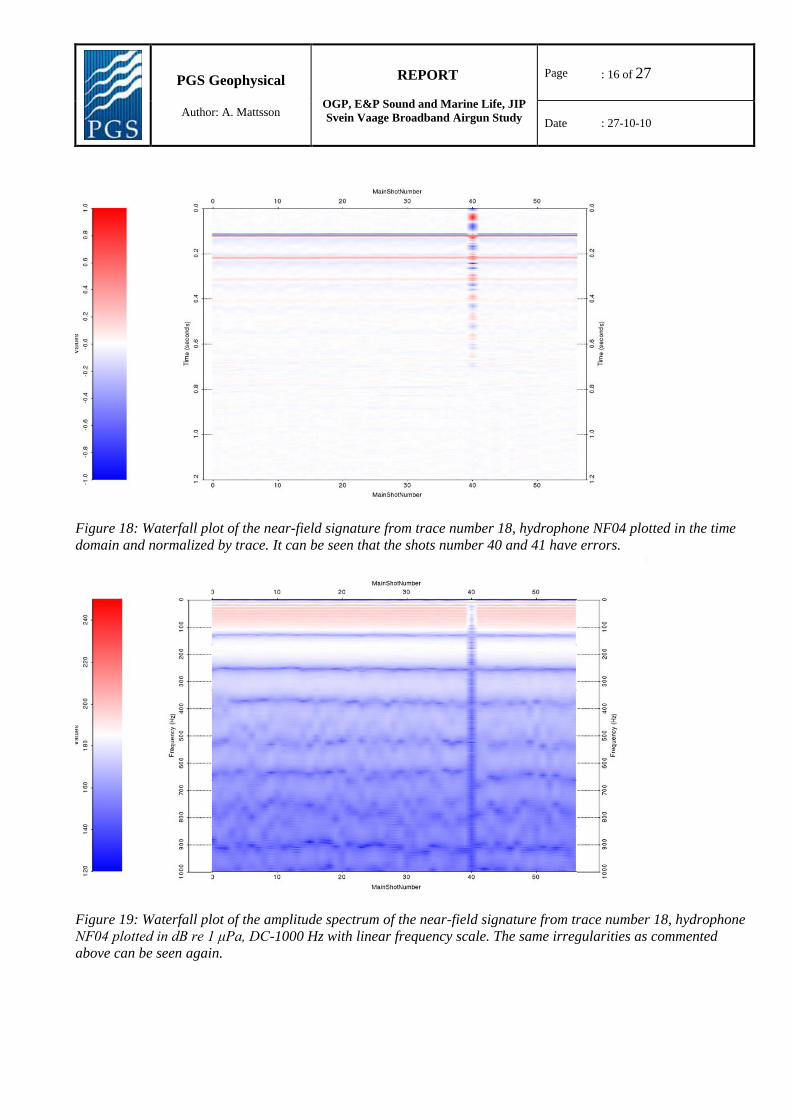
Figure 18: Waterfall plot of the near-field signature from trace number 18, hydrophone NF04 plotted in the time
domain and normalized by trace. It can be seen that the shots number 40 and 41 have errors.
Figure 19: Waterfall plot of the amplitude spectrum of the near-field signature from trace number 18, hydrophone
NF04 plotted in dB re 1 μPa, DC-1000 Hz with linear frequency scale. The same irregularities as commented
above can be seen again.
PGS Geophysical
Author: A. Mattsson
REPORT
OGP, E&P Sound and Marine Life, JIP
Svein Vaage Broadband Airgun Study
Page : 17 of 27
Date : 27-10-10
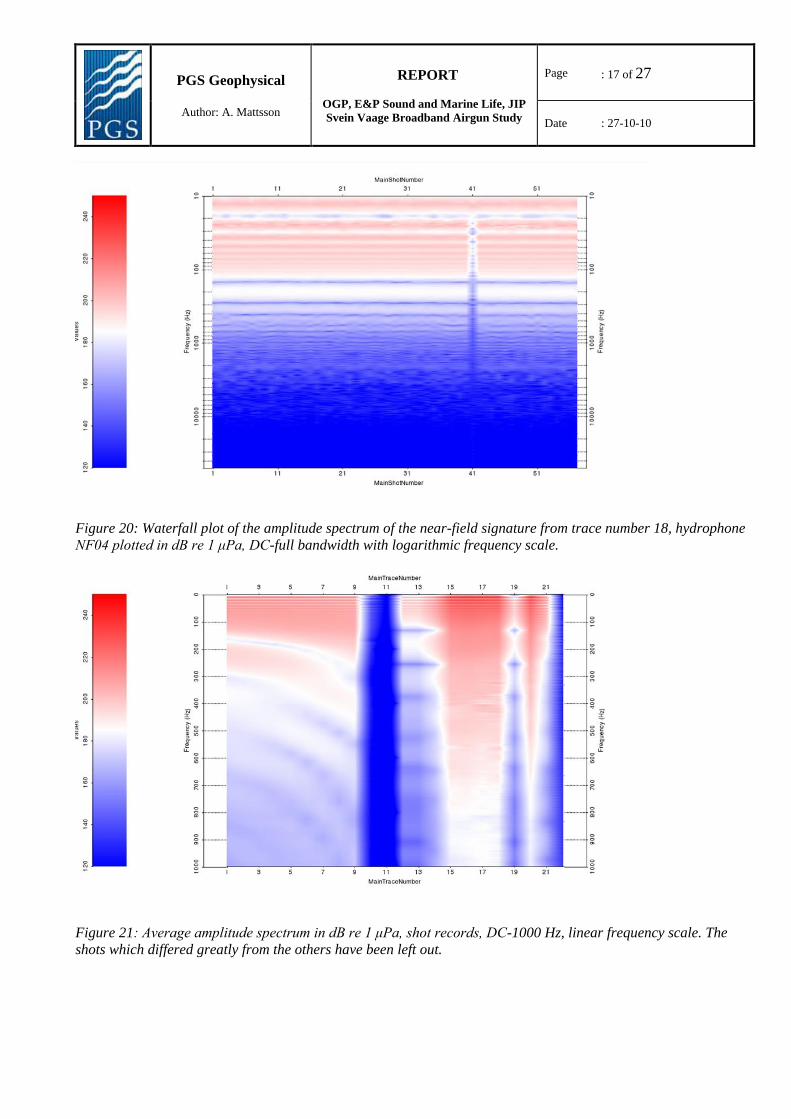
Figure 20: Waterfall plot of the amplitude spectrum of the near-field signature from trace number 18, hydrophone
NF04 plotted in dB re 1 μPa, DC-full bandwidth with logarithmic frequency scale.
Figure 21: Average amplitude spectrum in dB re 1 μPa, shot records, DC-1000 Hz, linear frequency scale. The
shots which differed greatly from the others have been left out.
PGS Geophysical
Author: A. Mattsson
REPORT
OGP, E&P Sound and Marine Life, JIP
Svein Vaage Broadband Airgun Study
Page : 18 of 27
Date : 27-10-10
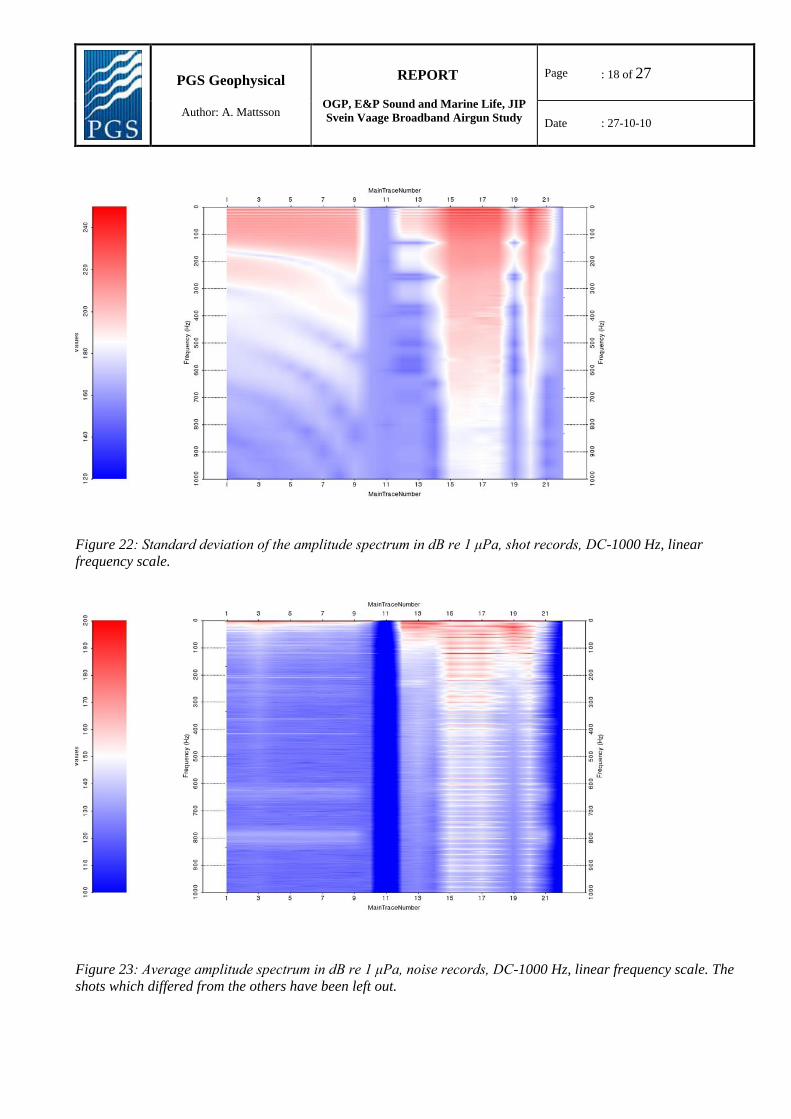
Figure 22: Standard deviation of the amplitude spectrum in dB re 1 μPa, shot records, DC-1000 Hz, linear
frequency scale.
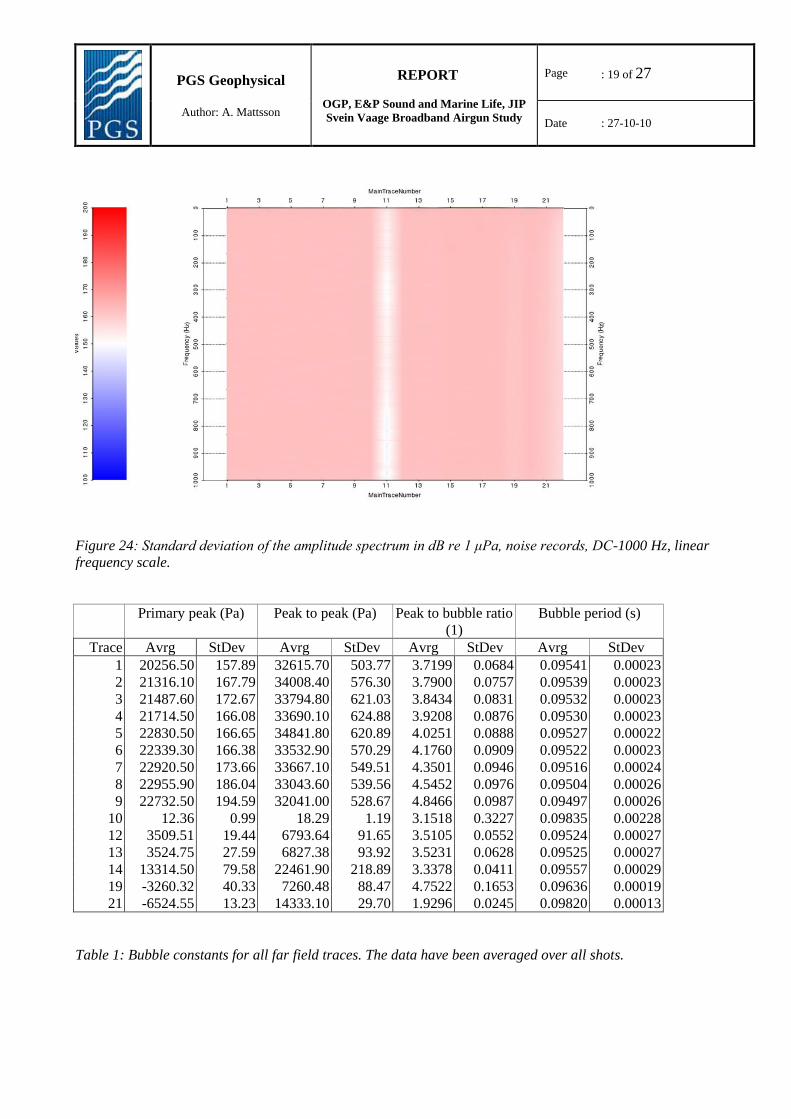
Figure 23: Average amplitude spectrum in dB re 1 μPa, noise records, DC-1000 Hz, linear frequency scale. The
shots which differed from the others have been left out.
PGS Geophysical
Author: A. Mattsson
REPORT
OGP, E&P Sound and Marine Life, JIP
Svein Vaage Broadband Airgun Study
Page : 19 of 27
Date : 27-10-10
Figure 24: Standard deviation of the amplitude spectrum in dB re 1 μPa, noise records, DC-1000 Hz, linear
frequency scale.
Primary peak (Pa) Peak to peak (Pa) Peak to bubble ratio
(1)
Bubble period (s)
Trace Avrg StDev Avrg StDev Avrg StDev Avrg StDev
1 20256.50 157.89 32615.70 503.77 3.7199 0.0684 0.09541 0.00023
2 21316.10 167.79 34008.40 576.30 3.7900 0.0757 0.09539 0.00023
3 21487.60 172.67 33794.80 621.03 3.8434 0.0831 0.09532 0.00023
4 21714.50 166.08 33690.10 624.88 3.9208 0.0876 0.09530 0.00023
5 22830.50 166.65 34841.80 620.89 4.0251 0.0888 0.09527 0.00022
6 22339.30 166.38 33532.90 570.29 4.1760 0.0909 0.09522 0.00023
7 22920.50 173.66 33667.10 549.51 4.3501 0.0946 0.09516 0.00024
8 22955.90 186.04 33043.60 539.56 4.5452 0.0976 0.09504 0.00026
9 22732.50 194.59 32041.00 528.67 4.8466 0.0987 0.09497 0.00026
10 12.36 0.99 18.29 1.19 3.1518 0.3227 0.09835 0.00228
12 3509.51 19.44 6793.64 91.65 3.5105 0.0552 0.09524 0.00027
13 3524.75 27.59 6827.38 93.92 3.5231 0.0628 0.09525 0.00027
14 13314.50 79.58 22461.90 218.89 3.3378 0.0411 0.09557 0.00029
19 -3260.32 40.33 7260.48 88.47 4.7522 0.1653 0.09636 0.00019
21 -6524.55 13.23 14333.10 29.70 1.9296 0.0245 0.09820 0.00013
Table 1: Bubble constants for all far field traces. The data have been averaged over all shots.
PGS Geophysical
Author: A. Mattsson
REPORT
OGP, E&P Sound and Marine Life, JIP
Svein Vaage Broadband Airgun Study
Page : 20 of 27
Date : 27-10-10
4. Conclusions and comments
-The test program was extended significantly from what was originally planned in 2006/2007.
-The test site worked well and good measurements have been made. Test rig and recording system were
continuously improved throughout the test program.
-Some of the data was partly contaminated, however because so many hydrophones were recorded for each shot
even partly contaminated shots contained significant useful data.
-Bad weather caused delays during parts of the program.
-Not all airguns that were part of the acquisition plan were delivered and some measurements had to be cancelled.
The JIP PSG made decisions on which measurements to prioritize.
-Several meetings were held with local authorities and researchers regarding test permission and test location.
-Local newspapers paid attention to our presence in the fjords.
-There was no indication that the testing disturbed the fish in the nearby fish farms.
5. Acknowledgements
Many thanks, to the PGS colleagues working on this project: Terje Lundsten, Gregg Parkes, Andy Wright, David
Hedgeland, Jens Wisløff, Fabien Julliard and the whole crew on the test barge making it happen.
Many thanks, to the colleagues in the JIP PSG and OGP, especially to Mike Jenkerson at ExxonMobil who was
driving and managing this project and John Campbell at OGP for the support.
Finally, a special thought goes to Svein Vaage for his essential contribution and guidance at the beginning of this
project.
PGS Geophysical
Author: A. Mattsson
REPORT
OGP, E&P Sound and Marine Life, JIP
Svein Vaage Broadband Airgun Study
Page : 21 of 27
Date : 27-10-10
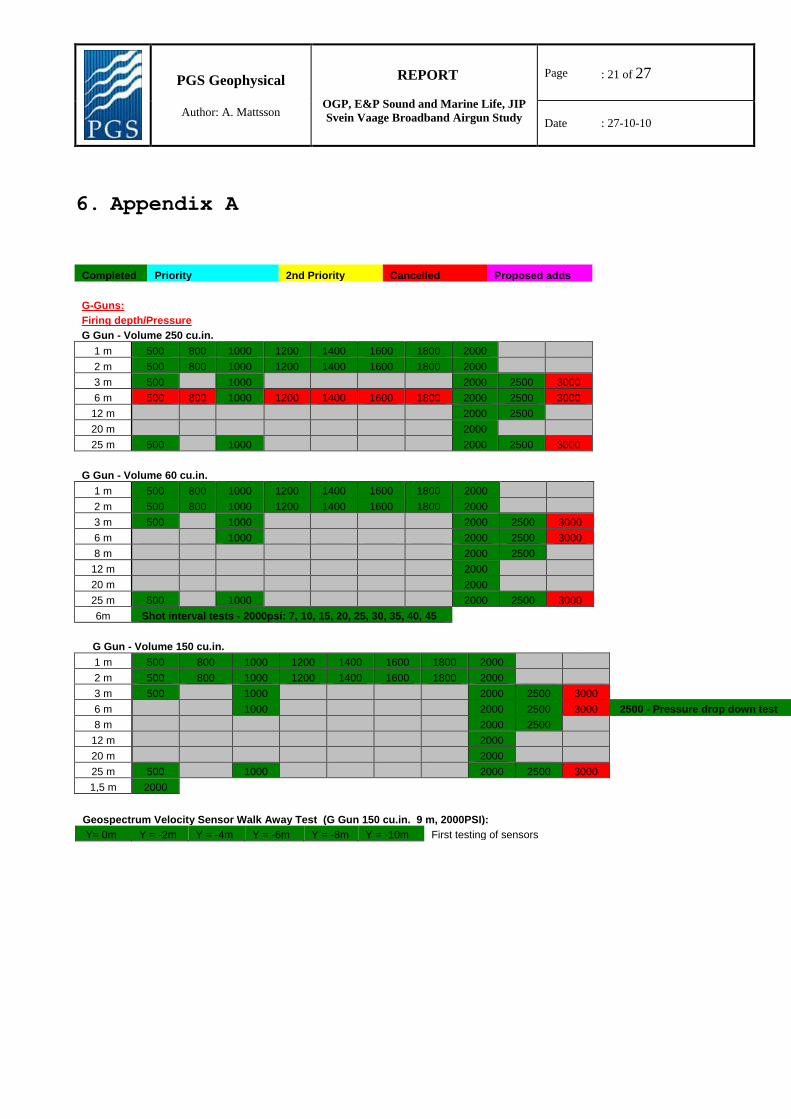
6. Appendix A
Completed Priority 2nd Priority Cancelled Proposed adds
G-Guns: Firing depth/Pressure
G Gun - Volume 250 cu.in. 1 m 500 800 1000 1200 1400 1600 1800 2000
2 m 500 800 1000 1200 1400 1600 1800 2000 3 m 500 1000 2000 2500 3000
6 m 500 800 1000 1200 1400 1600 1800 2000 2500 3000 12 m 2000 2500 20 m 2000
25 m 500 1000 2000 2500 3000
G Gun - Volume 60 cu.in. 1 m 500 800 1000 1200 1400 1600 1800 2000
2 m 500 800 1000 1200 1400 1600 1800 2000 3 m 500 1000 2000 2500 3000 6 m 1000 2000 2500 3000 8 m 2000 2500 12 m 2000 20 m 2000 25 m 500 1000 2000 2500 3000 6m Shot interval tests - 2000psi: 7, 10, 15, 20, 25, 30, 35, 40, 45
G Gun - Volume 150 cu.in. 1 m 500 800 1000 1200 1400 1600 1800 2000
2 m 500 800 1000 1200 1400 1600 1800 2000 3 m 500 1000 2000 2500 3000 6 m 1000 2000 2500 3000 2500 - Pressure drop down test
8 m 2000 2500 12 m 2000 20 m 2000 25 m 500 1000 2000 2500 3000 1,5 m 2000
Geospectrum Velocity Sensor Walk Away Test (G Gun 150 cu.in. 9 m, 2000PSI):
Y= 0m Y = -2m Y = -4m Y = -6m Y = -8m Y = -10m First testing of sensors
PGS Geophysical
Author: A. Mattsson
REPORT
OGP, E&P Sound and Marine Life, JIP
Svein Vaage Broadband Airgun Study
Page : 22 of 27
Date : 27-10-10
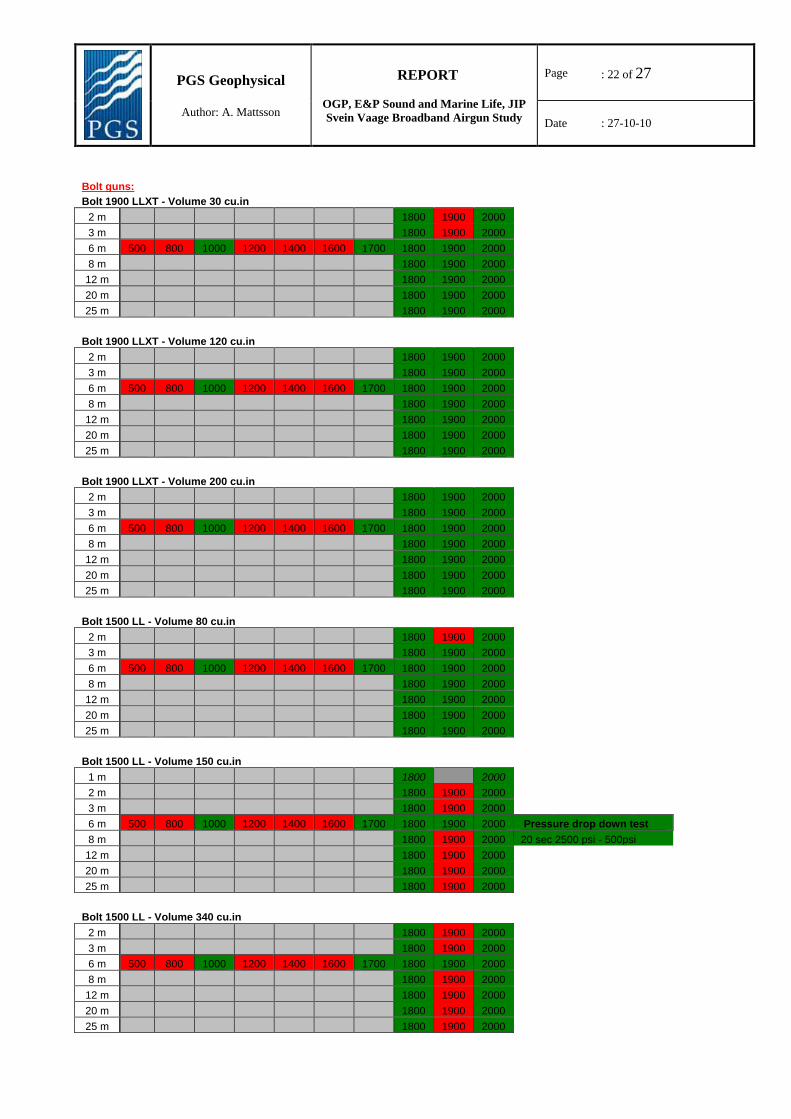
Bolt guns:
Bolt 1900 LLXT - Volume 30 cu.in 2 m 1800 1900 2000
3 m 1800 1900 2000 6 m 500 800 1000 1200 1400 1600 1700 1800 1900 2000 8 m 1800 1900 2000 12 m 1800 1900 2000 20 m 1800 1900 2000 25 m 1800 1900 2000
Bolt 1900 LLXT - Volume 120 cu.in 2 m 1800 1900 2000
3 m 1800 1900 2000 6 m 500 800 1000 1200 1400 1600 1700 1800 1900 2000 8 m 1800 1900 2000 12 m 1800 1900 2000 20 m 1800 1900 2000 25 m 1800 1900 2000
Bolt 1900 LLXT - Volume 200 cu.in 2 m 1800 1900 2000
3 m 1800 1900 2000 6 m 500 800 1000 1200 1400 1600 1700 1800 1900 2000 8 m 1800 1900 2000 12 m 1800 1900 2000 20 m 1800 1900 2000 25 m 1800 1900 2000
Bolt 1500 LL - Volume 80 cu.in 2 m 1800 1900 2000
3 m 1800 1900 2000 6 m 500 800 1000 1200 1400 1600 1700 1800 1900 2000 8 m 1800 1900 2000 12 m 1800 1900 2000 20 m 1800 1900 2000 25 m 1800 1900 2000
Bolt 1500 LL - Volume 150 cu.in 1 m 1800 2000
2 m 1800 1900 2000 3 m 1800 1900 2000 6 m 500 800 1000 1200 1400 1600 1700 1800 1900 2000 Pressure drop down test
8 m 1800 1900 2000 20 sec 2500 psi - 500psi
12 m 1800 1900 2000 20 m 1800 1900 2000 25 m 1800 1900 2000
Bolt 1500 LL - Volume 340 cu.in 2 m 1800 1900 2000
3 m 1800 1900 2000 6 m 500 800 1000 1200 1400 1600 1700 1800 1900 2000 8 m 1800 1900 2000 12 m 1800 1900 2000 20 m 1800 1900 2000 25 m 1800 1900 2000
PGS Geophysical
Author: A. Mattsson
REPORT
OGP, E&P Sound and Marine Life, JIP
Svein Vaage Broadband Airgun Study
Page : 23 of 27
Date : 27-10-10
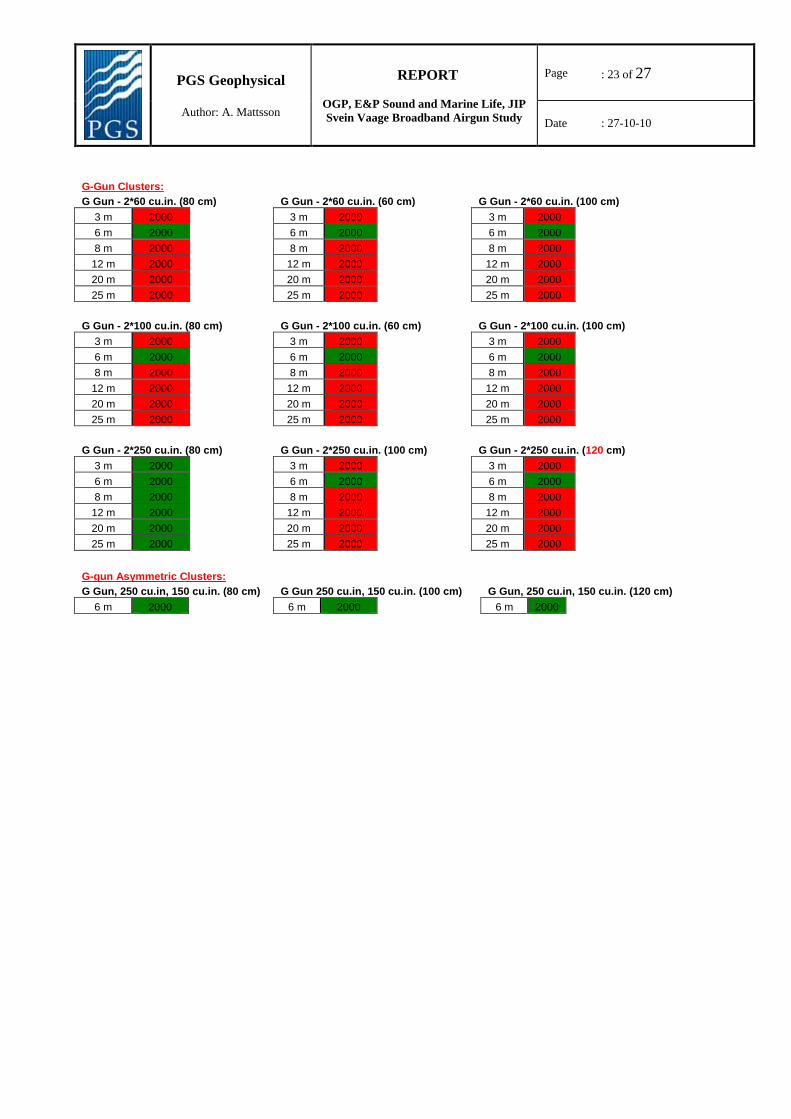
G-Gun Clusters:
G Gun - 2*60 cu.in. (80 cm)
G Gun - 2*60 cu.in. (60 cm)
G Gun - 2*60 cu.in. (100 cm) 3 m 2000
3 m 2000
3 m 2000
6 m 2000
6 m 2000
6 m 2000 8 m 2000
8 m 2000
8 m 2000
12 m 2000
12 m 2000
12 m 2000 20 m 2000
20 m 2000
20 m 2000
25 m 2000
25 m 2000
25 m 2000
G Gun - 2*100 cu.in. (80 cm)
G Gun - 2*100 cu.in. (60 cm)
G Gun - 2*100 cu.in. (100 cm) 3 m 2000
3 m 2000
3 m 2000
6 m 2000
6 m 2000
6 m 2000 8 m 2000
8 m 2000
8 m 2000
12 m 2000
12 m 2000
12 m 2000 20 m 2000
20 m 2000
20 m 2000
25 m 2000
25 m 2000
25 m 2000
G Gun - 2*250 cu.in. (80 cm)
G Gun - 2*250 cu.in. (100 cm)
G Gun - 2*250 cu.in. (120 cm) 3 m 2000
3 m 2000
3 m 2000
6 m 2000
6 m 2000
6 m 2000 8 m 2000
8 m 2000
8 m 2000
12 m 2000
12 m 2000
12 m 2000 20 m 2000
20 m 2000
20 m 2000
25 m 2000
25 m 2000
25 m 2000
G-gun Asymmetric Clusters: G Gun, 250 cu.in, 150 cu.in. (80 cm) G Gun 250 cu.in, 150 cu.in. (100 cm) G Gun, 250 cu.in, 150 cu.in. (120 cm)
6 m 2000
6 m 2000
6 m 2000
PGS Geophysical
Author: A. Mattsson
REPORT
OGP, E&P Sound and Marine Life, JIP
Svein Vaage Broadband Airgun Study
Page : 24 of 27
Date : 27-10-10
Bolt gun Clusters:
Bolt 1900 LLXT - 2*90 cu.in. (60 cm) Bolt 1900 LLXT - 2*90 cu.in. (80 cm) Bolt 1900 LLXT - 2*90 cu.in. (100 cm)
3 m 2000
3 m 2000
3 m 2000 6 m 2000
6 m 2000
6 m 2000
8 m 2000
8 m 2000
8 m 2000 12 m 2000
12 m 2000
12 m 2000
20 m 2000
20 m 2000
20 m 2000 25 m 2000
25 m 2000
25 m 2000
Bolt 1900 LLXT - 2*120 cu.in. (80 cm) 3 m 2000
6 m 2000
Not delivered 8 m 2000
12 m 2000 20 m 2000 25 m 2000
Bolt 1900 LLXT - 2*125 cu.in. (80 cm) Bolt 1900 LLXT - 2*125 cu.in. (60 cm) Bolt 1900 LLXT - 2*125 cu.in. (100 cm)
3 m 2000
3 m 2000
3 m 2000 6 m 2000
6 m 2000
6 m 2000
8 m 2000
8 m 2000
8 m 2000 12 m 2000
12 m 2000
12 m 2000
20 m 2000
20 m 2000
20 m 2000 25 m 2000
25 m 2000
25 m 2000
Bolt 1900 LLXT - 2*145 cu.in. (80 cm) Bolt 1900 LLXT - 2*145 cu.in. (60 cm) Bolt 1900 LLXT - 2*145 cu.in. (100 cm)
3 m 2000
3 m 2000
3 m 2000 6 m 2000
6 m 2000
6 m 2000
8 m 2000
8 m 2000
8 m 2000 12 m 2000
12 m 2000
12 m 2000
20 m 2000
20 m 2000
20 m 2000 25 m 2000
25 m 2000
25 m 2000
Bolt 1500 LL - 2*150 cu.in. (80 cm) 3 m 2000
6 m 2000 8 m 2000 12 m 2000 20 m 2000 25 m 2000
Bolt 1500 LL - 2*155 cu.in. (80 cm) Bolt 1500 LL - 2*155 cu.in. (60 cm) Bolt 1500 LL - 2*155 cu.in. (100 cm)
3 m 2000
3 m 2000
3 m 2000 6 m 2000
6 m 2000
6 m 2000
8 m 2000
8 m 2000
8 m 2000 12 m 2000
12 m 2000
12 m 2000
20 m 2000
20 m 2000
20 m 2000 25 m 2000
25 m 2000
25 m 2000
Bolt 1500 LL - 2*235 cu.in. (100 cm) Bolt 1500 LL - 2*235 cu.in. (80 cm) Bolt 1500 LL - 2*235 cu.in. (120 cm)
3 m 2000
3 m 2000
3 m 2000 6 m 2000
6 m 2000
6 m 2000
8 m 2000
8 m 2000
8 m 2000 12 m 2000
12 m 2000
12 m 2000
20 m 2000
20 m 2000
20 m 2000 25 m 2000
25 m 2000
25 m 2000
PGS Geophysical
Author: A. Mattsson
REPORT
OGP, E&P Sound and Marine Life, JIP
Svein Vaage Broadband Airgun Study
Page : 25 of 27
Date : 27-10-10
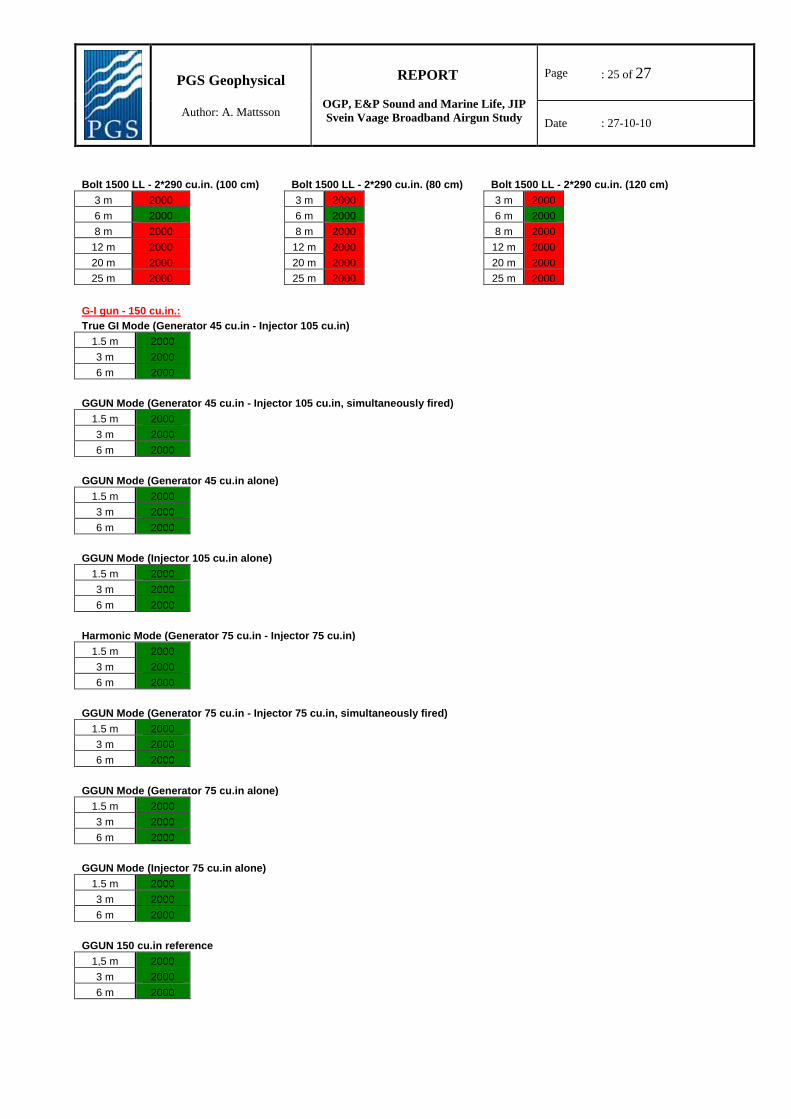
Bolt 1500 LL - 2*290 cu.in. (100 cm) Bolt 1500 LL - 2*290 cu.in. (80 cm) Bolt 1500 LL - 2*290 cu.in. (120 cm)
3 m 2000
3 m 2000
3 m 2000 6 m 2000
6 m 2000
6 m 2000
8 m 2000
8 m 2000
8 m 2000 12 m 2000
12 m 2000
12 m 2000
20 m 2000
20 m 2000
20 m 2000 25 m 2000
25 m 2000
25 m 2000
G-I gun - 150 cu.in.:
True GI Mode (Generator 45 cu.in - Injector 105 cu.in) 1.5 m 2000
3 m 2000 6 m 2000
GGUN Mode (Generator 45 cu.in - Injector 105 cu.in, simultaneously fired)
1.5 m 2000 3 m 2000 6 m 2000
GGUN Mode (Generator 45 cu.in alone) 1.5 m 2000
3 m 2000 6 m 2000
GGUN Mode (Injector 105 cu.in alone) 1.5 m 2000
3 m 2000 6 m 2000
Harmonic Mode (Generator 75 cu.in - Injector 75 cu.in) 1.5 m 2000
3 m 2000 6 m 2000
GGUN Mode (Generator 75 cu.in - Injector 75 cu.in, simultaneously fired)
1.5 m 2000 3 m 2000 6 m 2000
GGUN Mode (Generator 75 cu.in alone) 1.5 m 2000
3 m 2000 6 m 2000
GGUN Mode (Injector 75 cu.in alone) 1.5 m 2000
3 m 2000 6 m 2000
GGUN 150 cu.in reference 1,5 m 2000
3 m 2000 6 m 2000
PGS Geophysical
Author: A. Mattsson
REPORT
OGP, E&P Sound and Marine Life, JIP
Svein Vaage Broadband Airgun Study
Page : 26 of 27
Date : 27-10-10
GGUN 45 cu.in Reference 1.5 m 2000 Not delivered/existing
3 m 2000 6 m 2000
GGUN 75 cu.in reference 1.5 m 2000 Not delivered/existing
3 m 2000 6 m 2000
GGUN 105 cu.in reference 1.5 m 2000 Not delivered/existing
3 m 2000 6 m 2000
Sleeve gun:
10 cu.in.
20 cu.in.
40 cu.in. 1 m 2000 Not delivered
1 m 2000
1 m 2000
6 m 2000
6 m 2000
6 m 2000
Sleeve gun Clusters: Sleeve - 2*10 cu.in. (40 cm) Sleeve - 2*20 cu.in. (52 cm) Sleeve - 2*40 cu.in. (62 cm)
1 m 2000 Not delivered
1 m 2000 No spare parts for repairing gun 1 m 2000
6 m 2000
6 m 2000
6 m 2000
Sleeve - 4*40 cu.in. (46 cm)
3 m 2000
G-Guns: G Gun II - Volume 380 cu.in.
3 m 1800 2000 6 m 1800 2000 2500
9 m 1800 2000
G Gun II - Volume 520 cu.in. 3 m 1800 2000
6 m 1800 2000 2500 9 m 1800 2000
Bolt guns: Bolt APG - Volume 50 cu.in
3 m 1800 2000 Not delivered 6 m 1800 2000
9 m 1800 2000
Bolt APG - Volume 2 x 175 cu.in 3 m 2000
6 m 500 800 1000 1200 1400 1600 1800 1900 2000
9 m 2000
Bolt APG - Volume 1 x 175 cu.in 3 m 2000
6 m 500 800 1000 1200 1400 1600 1800 1900 2000
9 m 2000
PGS Geophysical
Author: A. Mattsson
REPORT
OGP, E&P Sound and Marine Life, JIP
Svein Vaage Broadband Airgun Study
Page : 27 of 27
Date : 27-10-10
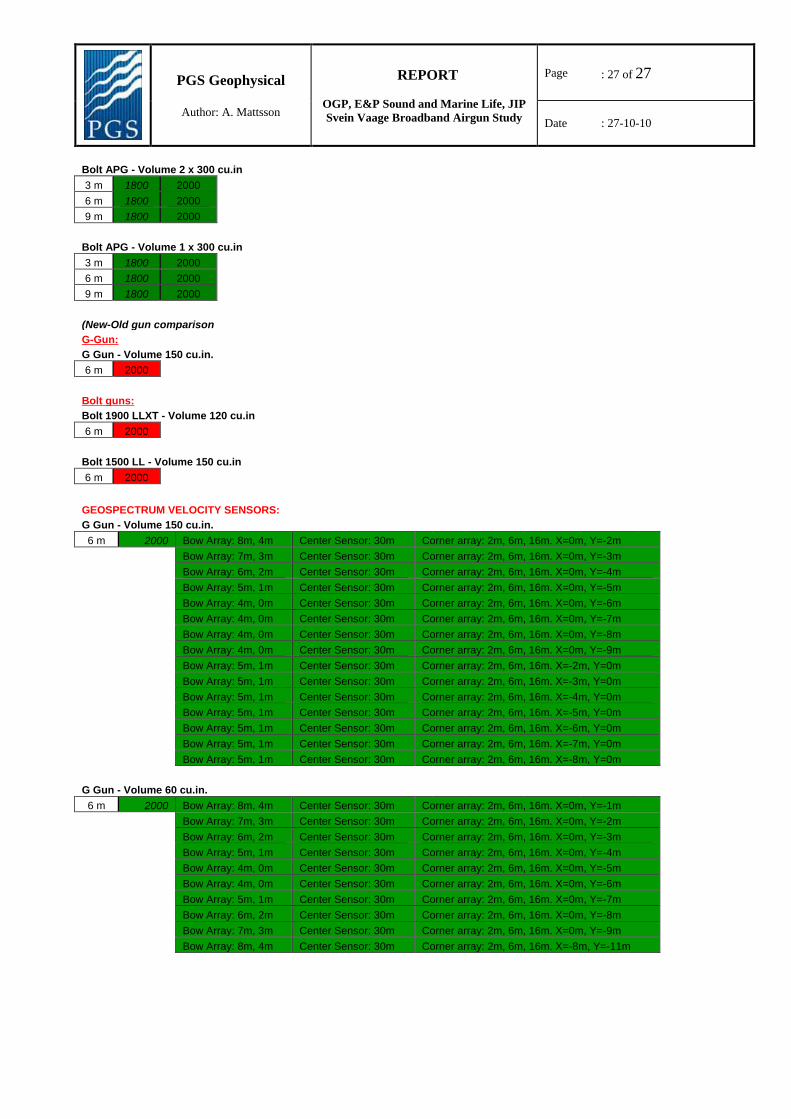
Bolt APG - Volume 2 x 300 cu.in
3 m 1800 2000 6 m 1800 2000 9 m 1800 2000
Bolt APG - Volume 1 x 300 cu.in
3 m 1800 2000 6 m 1800 2000 9 m 1800 2000
(New-Old gun comparison G-Gun:
G Gun - Volume 150 cu.in. 6 m 2000
Bolt guns: Bolt 1900 LLXT - Volume 120 cu.in
6 m 2000
Bolt 1500 LL - Volume 150 cu.in 6 m 2000
GEOSPECTRUM VELOCITY SENSORS:
G Gun - Volume 150 cu.in. 6 m 2000 Bow Array: 8m, 4m Center Sensor: 30m Corner array: 2m, 6m, 16m. X=0m, Y=-2m
Bow Array: 7m, 3m Center Sensor: 30m Corner array: 2m, 6m, 16m. X=0m, Y=-3m
Bow Array: 6m, 2m Center Sensor: 30m Corner array: 2m, 6m, 16m. X=0m, Y=-4m
Bow Array: 5m, 1m Center Sensor: 30m Corner array: 2m, 6m, 16m. X=0m, Y=-5m
Bow Array: 4m, 0m Center Sensor: 30m Corner array: 2m, 6m, 16m. X=0m, Y=-6m
Bow Array: 4m, 0m Center Sensor: 30m Corner array: 2m, 6m, 16m. X=0m, Y=-7m
Bow Array: 4m, 0m Center Sensor: 30m Corner array: 2m, 6m, 16m. X=0m, Y=-8m
Bow Array: 4m, 0m Center Sensor: 30m Corner array: 2m, 6m, 16m. X=0m, Y=-9m
Bow Array: 5m, 1m Center Sensor: 30m Corner array: 2m, 6m, 16m. X=-2m, Y=0m
Bow Array: 5m, 1m Center Sensor: 30m Corner array: 2m, 6m, 16m. X=-3m, Y=0m
Bow Array: 5m, 1m Center Sensor: 30m Corner array: 2m, 6m, 16m. X=-4m, Y=0m
Bow Array: 5m, 1m Center Sensor: 30m Corner array: 2m, 6m, 16m. X=-5m, Y=0m
Bow Array: 5m, 1m Center Sensor: 30m Corner array: 2m, 6m, 16m. X=-6m, Y=0m
Bow Array: 5m, 1m Center Sensor: 30m Corner array: 2m, 6m, 16m. X=-7m, Y=0m
Bow Array: 5m, 1m Center Sensor: 30m Corner array: 2m, 6m, 16m. X=-8m, Y=0m
G Gun - Volume 60 cu.in. 6 m 2000 Bow Array: 8m, 4m Center Sensor: 30m Corner array: 2m, 6m, 16m. X=0m, Y=-1m
Bow Array: 7m, 3m Center Sensor: 30m Corner array: 2m, 6m, 16m. X=0m, Y=-2m
Bow Array: 6m, 2m Center Sensor: 30m Corner array: 2m, 6m, 16m. X=0m, Y=-3m
Bow Array: 5m, 1m Center Sensor: 30m Corner array: 2m, 6m, 16m. X=0m, Y=-4m
Bow Array: 4m, 0m Center Sensor: 30m Corner array: 2m, 6m, 16m. X=0m, Y=-5m
Bow Array: 4m, 0m Center Sensor: 30m Corner array: 2m, 6m, 16m. X=0m, Y=-6m
Bow Array: 5m, 1m Center Sensor: 30m Corner array: 2m, 6m, 16m. X=0m, Y=-7m
Bow Array: 6m, 2m Center Sensor: 30m Corner array: 2m, 6m, 16m. X=0m, Y=-8m
Bow Array: 7m, 3m Center Sensor: 30m Corner array: 2m, 6m, 16m. X=0m, Y=-9m
Bow Array: 8m, 4m Center Sensor: 30m Corner array: 2m, 6m, 16m. X=-8m, Y=-11m