Embed Size (px)
Citation preview

2017
Final Results of Home Environment Survey
انتبئح انهبئخ نسر انجئخ انسنخ


Preface تـقديــم
The Ministry of Development Planning and statistics
(MDPS) is pleased to present this report on "Home
Environment Survey" in Qatar, which was conducted in
2017. The report basically aims to provide a comprehensive
statistical materials about the environmental reality in home
sector, as this is of great importance for the protection of
natural resources and public health from any harmful
effects. The report addresses the most important statistical
indicators that have been collected regarding home
environment, including water, wastewater, solid waste, air
pollution and noise. The report also shows indicators
related to usage of detergents, disinfectant and insecticides
by family.
سر وزارة التخطط التنموي و اإلحصاء أن تقدم هذا التقرر حول
.2017مسح البئة المنزلة ف دولة قطر والذي تم ف العام
هدف التقرر أساسا إلى توفر مادة إحصائة شاملة حول الواقع البئ
ف القطاع المنزل لما لذلك من أهمة كبرى لحماة الموارد الطبعة
وتناول التقرر أهم المإشرات . والصحة العامة من أة تؤثرات ضارة
اإلحصائة الت أمكن توفرها حول البئة المنزلة، وذلك ف مجال
الماه، والماه العادمة، والنفاات الصلبة وتلوث الهواء، والضجج، كما
تناول مإشرات عن استخدام األسرة للمنظفات والمطهرات والمبدات
باإلضافة إلى ترتبها حسب األكثر استخداما للكهرباء، والماء،. الحشرة
واستخدام األلواح الشمسة واإلجراءات المتبعة لحماة البئة المنزلة والتوعة للقضاا
البئة، والت تحتم علنا بذل المزد من الجهد ومراعاة االعتبارات الخاصة بحماة البئة عند
تخطط وتنفذ المشارع اإلنمائة، فضال عن قام كل فرد بواجبه، لما لذلك من أهمة كبرى
.لحماة مواردنا الطبعة، والصحة العامة من أة تؤثرات ضارة
حتوي االول منها على المقدمة واألهداف، ثالثة فصول رئسة،تكون هذا التقرر من
الثالث تصمم العنة ومعدالت التجاوب، اما الفصل والثان علىوالتعارف والمفاهم،
.فعرض ملخص تحلل ألهم نتائج المسح
نؤمل أن نكون قد نجحنا من خالل تنفذ هذا المسح بتوفر بانات حدثة عن الواقع البئ
آملن أن . للقطاع المنزل ف دولة قطر، لسد الفجوة الكبرى الكبر ف هذا النوع من البانات
ستفد المخطط وصانع القرار من هذه النتائج ف صاغة الخطط واتخاذ القرارات المإثرة
.ف المجاالت السكانة واالجتماعة
In addition, the report classifies families by their usage of electricity, water,
solar panels and the followed procedures to protect home environment and
raising awareness of enviromental issues which drive us to make more efforts
to portect the environment when planning and implementing development
projects. Also, the individuals' behavior towards such issues is of great
importance, as it has great impact on the protection of natural resources and
public health from any harmful effects.
The report consists of three chapters; First chapter includes the introduction,
objectives, definitions and concepts. Second chapter includes sample design
and response rates. Last chapter presents analytical summary of the main
results.
In conclusion, we hope we succeeded by this survey in providing updated
data on the environmental reality in the home sector in Qatar, in order to
bridge the gap in this type of data. Hoping that the planners and decision
maker shall benefit from these results in formulating plans and making
decisions that affect the population and social fields.
May Allah help us do good for the benefit of our motherland وهللا نسؤل أن وفقنا لما فه خر هذا الوطن
Dr. Saleh Bin Mohammed Al-Nabit صالح بن محمد النابت. د
Minister of Development Planning and Statistics وزر التخطط التنموي واإلحصاء
- 3 -


No Subjectرقم الصفحة
Page No.الموضــــــــــــــــــــــــــــــــــــــــــــــــــــــوع م
3
11
Introduction and Objectives 13 المقــدمـــة واألهـــداف
Definitions and Concepts 15 التعارف و المفاهم
17
Sample Design 19 تصمم العنة
Response Rates 21 معدالت التجاوب
23
The Main Resultes 25 ملخص تحلل الهم النتائج
31
97
Survey Questionnaire ( Arabic version ) 99 (النسخة العربة )استمارة المسح
Survey Questionnaire ( English version ) 108 (النسخة اإلنجلزة )استمارة المسح
Index فهــــرس
Chapter One الفصل االول
Chapter Tow الفصل الثالث
List of results tables قائمة جداول النتائج
Preface تقدم
Appendix الملحق
Chapter Tow الفصل الثان
- 5 -
Table
No.Subject
رقم الصفحة
Page No.الموضــــــــــــــــــــــــــــــــــــــــــــــــــــــوع
رقم
الجدول
1Percent Distribution of Households by Municipality and the Means of
Obtaining Drinking Water33 التوزع النسب لألسر حسب البلدة ووسلة الحصول على ماه الشرب 1
2Percent Distribution of Households by Municipality and the Means of
Obtaining Water for Domestic Use34 التوزع النسب لألسر حسب البلدة ووسلة الحصول على ماه االستخدام المنزل 2
3Percent Distribution of Households by Municipality and Household
Evaluation of Drinking Water Quality35 التوزع النسب لألسر حسب البلدة وتقم األسرة لجودة الماه المستخدمة للشرب 3
4Percent Distribution of Households by Municipality and Household
Evaluation of Domestic Water Use 36 التوزع النسب لألسر حسب البلدة وتقم األسرة لجودة الماه لالستخدام المنزل 4
5Percent Distribution of Households by Municipality and the Entity that
collects or disposes the solid waste37
التوزع النسب لألسر حسب البلدة والجهة الت تقوم بعملة جمع النفاات الصلبة أو
التخلص منها5
6Percent Distribution of Households by Municipality and Number of
Times Waste Collected Per Week38 التوزع النسب لألسر حسب البلدة وعدد مرات التخلص من النفاات الصلبة أسبوعا 6
7Percent Distribution of Households by Municipality and Estimated
Quantity of Solid Waste Disposed at One Time (by Kg)39
التوزع النسب لألسر حسب البلدة وتقدر كمة النفاات الصلبة الت تم التخلص منها ف
(بالكلوجرام)المرة الواحدة 7
8Percent Distribution of Households by Municipality and the Distance
(by Meter) to the Nearest Solid Waste Container40 ألقرب مكان لجمع النفاات الصلبة (بالمتر)التوزع النسب لألسر حسب البلدة والمسافة 8
9Percent Distribution of Households by Municipality and the Major
Component of Solid Waste41 التوزع النسب لألسر حسب البلدة وأهم مكون للنفاات الصلبة 9
10Percent Distribution of Households by Municipality and the Wastewater
Disposal Methods42 التوزع النسب لألسر حسب البلدة وكفة التخلص من الماه العادمة 10
11Percent Distribution of Households Having Cesspool by Municipality
and Size of Cesspool (by cubic Meter)43
التوزع النسب لألسر الت لدها حفرة امتصاصة حسب البلدة وحجم الحفرة االمتصاصة
(بالمتر المكعب)11
List of Tables قائمة الجداول
- 6 -
Table
No.Subject
رقم الصفحة
Page No.الموضــــــــــــــــــــــــــــــــــــــــــــــــــــــوع
رقم
الجدول
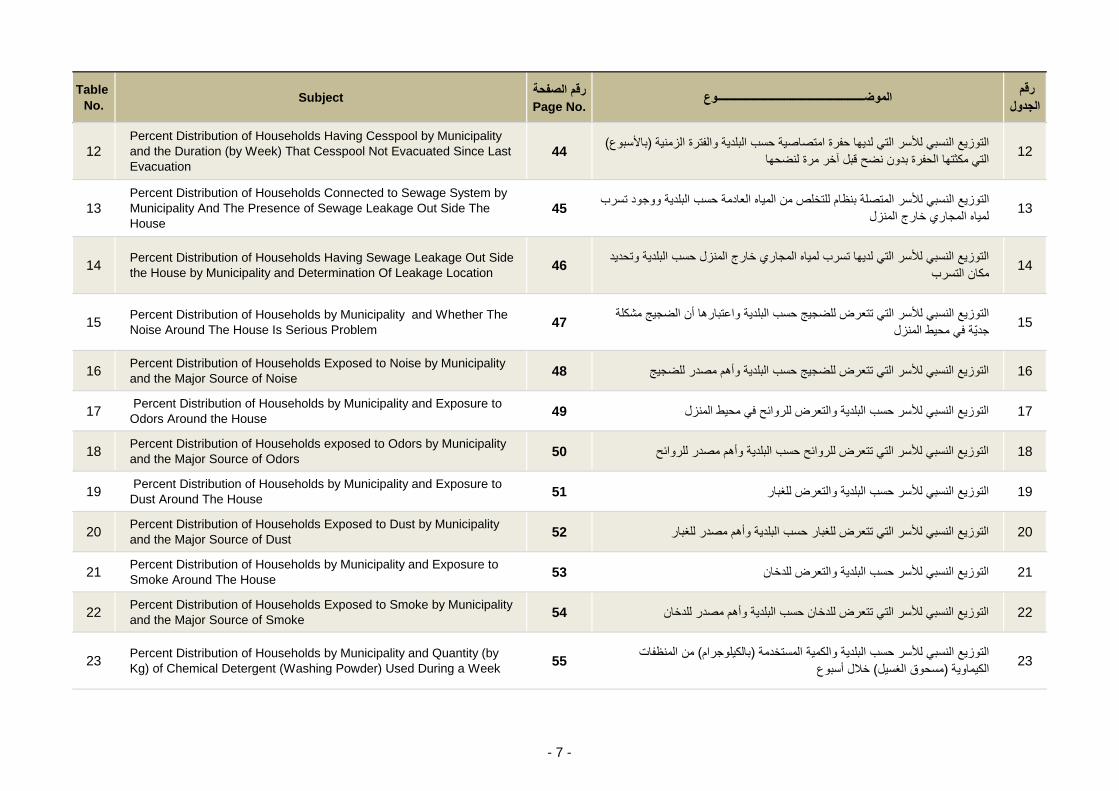
12Percent Distribution of Households Having Cesspool by Municipality
and the Duration (by Week) That Cesspool Not Evacuated Since Last
Evacuation
44 (باألسبوع)التوزع النسب لألسر الت لدها حفرة امتصاصة حسب البلدة والفترة الزمنة
الت مكثتها الحفرة بدون نضح قبل آخر مرة لنضحها12
13Percent Distribution of Households Connected to Sewage System by
Municipality And The Presence of Sewage Leakage Out Side The
House
45التوزع النسب لألسر المتصلة بنظام للتخلص من الماه العادمة حسب البلدة ووجود تسرب
لماه المجاري خارج المنزل13
14Percent Distribution of Households Having Sewage Leakage Out Side
the House by Municipality and Determination Of Leakage Location46
التوزع النسب لألسر الت لدها تسرب لماه المجاري خارج المنزل حسب البلدة وتحدد
مكان التسرب14
15Percent Distribution of Households by Municipality and Whether The
Noise Around The House Is Serious Problem 47
التوزع النسب لألسر الت تتعرض للضجج حسب البلدة واعتبارها أن الضجج مشكلة
ة ف محط المنزل جد15
16Percent Distribution of Households Exposed to Noise by Municipality
and the Major Source of Noise48 التوزع النسب لألسر الت تتعرض للضجج حسب البلدة وأهم مصدر للضجج 16
17 Percent Distribution of Households by Municipality and Exposure to
Odors Around the House49 التوزع النسب لألسر حسب البلدة والتعرض للروائح ف محط المنزل 17
18Percent Distribution of Households exposed to Odors by Municipality
and the Major Source of Odors50 التوزع النسب لألسر الت تتعرض للروائح حسب البلدة وأهم مصدر للروائح 18
19 Percent Distribution of Households by Municipality and Exposure to
Dust Around The House51 التوزع النسب لألسر حسب البلدة والتعرض للغبار 19
20Percent Distribution of Households Exposed to Dust by Municipality
and the Major Source of Dust52 التوزع النسب لألسر الت تتعرض للغبار حسب البلدة وأهم مصدر للغبار 20
21Percent Distribution of Households by Municipality and Exposure to
Smoke Around The House53 التوزع النسب لألسر حسب البلدة والتعرض للدخان 21
22Percent Distribution of Households Exposed to Smoke by Municipality
and the Major Source of Smoke 54 التوزع النسب لألسر الت تتعرض للدخان حسب البلدة وأهم مصدر للدخان 22
23Percent Distribution of Households by Municipality and Quantity (by
Kg) of Chemical Detergent (Washing Powder) Used During a Week55
من المنظفات (بالكلوجرام)التوزع النسب لألسر حسب البلدة والكمة المستخدمة
خالل أسبوع (مسحوق الغسل)الكماوة 23
- 7 -

Table
No.Subject
رقم الصفحة
Page No.الموضــــــــــــــــــــــــــــــــــــــــــــــــــــــوع
رقم
الجدول
24Percent Distribution of Households by Municipality and Quantity (by
Liter) of Liquid Soap Used During a Week 56
من الصابون السائل خالل (باللتر)التوزع النسب لألسر حسب البلدة والكمة المستخدمة
األسبوع الواحد24
25Percent Distribution of Households by Municipality and Quantity (by
Liter) of Chemical Detergent (Clorox) Used During a Week57
من المنظفات الكماوة (باللتر)التوزع النسب لألسر حسب البلدة والكمة المستخدمة
خالل األسبوع الواحد (مبض)25
26Percent Distribution of Households by Municipality and Quantity (by
Liter) of Industrial Disinfectant Used During a Week 58
من المطهرات الصناعة (باللتر)التوزع النسب لألسر حسب البلدة والكمة المستخدمة
خالل األسبوع الواحد26
27Percent Distribution of Households by Municipality and Quantity (by
Milliliters) of Insecticides (Liquid) Used During a Week59
من المبدات الحشرة (بالملللتر)التوزع النسب لألسر حسب البلدة والكمة المستخدمة
خالل األسبوع الواحد (السائلة)27
28Percent Distribution of Households by Municipality and Quantity (by
Gram) of Insecticides (Powder) Used During a Week60
من المبدات الحشرة (بالجرام)التوزع النسب لألسر حسب البلدة والكمة المستخدمة
خالل األسبوع الواحد (مسحوق)28
29Percent Distribution of Households using Insecticides by Municipality
and Effective Factors For Households to choose
)Detergents–Disinfectant- Insecticides(
61التوزع النسب لألسر الت تستخدم المبدات حسب البلدة والعوامل المإثرة الختار األسرة
(المبدات- المطهرات - للمنظفات)29
30Percent Distribution of Households by Municipality and Households
Checking on Container Ingredients and Following Usage and Storage
Instructions
62التوزع النسب لألسر حسب البلدة وتدقق األسرة على المكونات المدونة على العبوة وإتباع
التعلمات ف طرقة االستعمال والحفظ30
31Percent Distribution of Households by Municipality and Type of air
conditioners in the Household house 63 التوزع النسب لألسر حسب البلدة ونوع المكفات ف منزل األسرة 31
32Percent Distribution of Households by Municipality and the Uses of
Water Sorted by (1) Most Commonly Used to ... , (5) Least Used64
... األكثر استخداما إلى (1)التوزع النسب لألسر حسب البلدة واستخدام الماه مرتبة من
األقل استخداما (5)، 32
33Percent Distribution of Households by Municipality and the Uses of
Electricity Sorted by (1) Most Commonly Used to ... , (5) Least Used68
األكثر استخداما (1)التوزع النسب لألسر حسب البلدة واستخدامات الكهرباء مرتبة من
األقل استخداما (5)، ... إلى 33
- 8 -

Table
No.Subject
رقم الصفحة
Page No.الموضــــــــــــــــــــــــــــــــــــــــــــــــــــــوع
رقم
الجدول
34 Percent Distribution of Households by Municipality and Obstacles to
Using Solar Panels for heat water and generate electricity at home
Sorted by (1) Most Commonly Used to ... , (5) Least Used
72التوزع النسب لألسر حسب البلدة والموانع ف استخدام األلواح الشمسة لتسخن الماه
األقل استخداما (5)، ... األكثر استخداما إلى (1)وتولد الكهرباء ف المنزل مرتبة من 34
35Percent Distribution of Households by Municipality and Whether a
Household Member Suffer From Asthma Caused by Dust76 التوزع النسب لألسر حسب البلدة ومعاناة أحد أفراد األسرة من الربو الناتج عن الغبار 35
36Percent Distribution of Households by Municipality and Whether The
Household Use Air Filtration at Home77 ف المنزل (فلترة الهواء )التوزع النسب لألسر حسب البلدة واستخدام األسرة 36
37Percent Distribution of Households by Municipality and Whether The
Household Perform Periodic Maintenance for A/Cs78 التوزع النسب لألسر حسب البلدة وإجراء األسرة للصانة الدورة للمكفات 37
38Percent Distribution of Households by Municipality and Whether The
Household Set the Air Conditioners' Thermostat at 24 Degrees79
التوزع النسب لألسر حسب البلدة وضبط األسرة لدرجة حرارة ترموستات المكف عند
درجة2438
39Percent Distribution of Households by Municipality and Whether The
Household use Energy-saving bulbs80 التوزع النسب لألسر حسب البلدة واستخدام األسرة للمبات توفر الطاقة 39
40Percent Distribution of Households by Municipality and Whether The
Household Use Water Saving Devices81 التوزع النسب لألسر حسب البلدة واستخدام األسرة ألجهزة ترشد الماه 40
41Percent Distribution of Households by Municipality and Whether a
Household Member Participated in Any Environment Awareness
Campaign Previously
82التوزع النسب لألسر حسب البلدة ومشاركة أحد أفراد األسرة ف أي حملة توعة حول
توعة البئة سابقا41
42Percent Distribution of Households by Municipality and Sources of
Households Knowledge About Environmental Issues Sorted by (1)
Most Commonly Used to ... , (5) Least Used
83 (1)التوزع النسب لألسر حسب البلدة ومصادر معرفة األسرة بالقضاا البئة مرتبة من
األقل استخداما (5)، … األكثر استخداما إلى 42
43Percent Distribution of Households by Municipality and Motivating
Factors to Protect The Environment Sorted by (1) Most Commonly
Used to ... , (5) Least Used
87األكثر (1)التوزع النسب لألسر حسب البلدة والعوامل المحفزة لحماة البئة مرتبة من
األقل استخداما (5)، ... استخداما إلى 43
44 Percent Distribution of Households by Municipality and Environmental
Protection Procedures The Household Willing to Take Sorted by (1)
Most Commonly Used to ... , (4) Least Used
91التوزع النسب لألسر حسب البلدة وإجراءات حماة البئة الت تستعد األسرة التخاذها
األقل استخداما (4)، ... األكثر استخداما إلى (1)مرتبة من 44
- 9 -


* Introduction and Objectives
* Definitions and Concepts
انمذيخ األهذاف*
انفصم االول
Chapter One
انتؼبرف و انفبهى*

Introduction and Objectives املقــدمـــة واألهـــداف
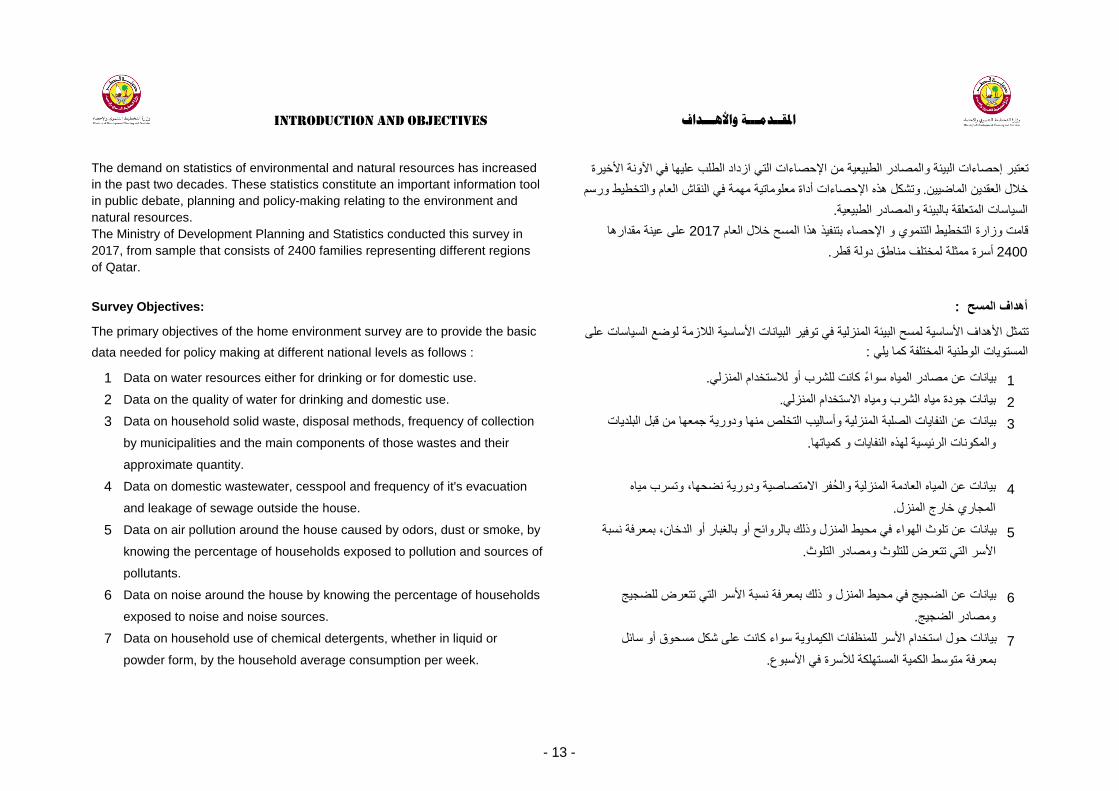
The demand on statistics of environmental and natural resources has increased
in the past two decades. These statistics constitute an important information tool
in public debate, planning and policy-making relating to the environment and
natural resources.
The Ministry of Development Planning and Statistics conducted this survey in
2017, from sample that consists of 2400 families representing different regions
of Qatar.
تعتبر إحصاءات البئة والمصادر الطبعة من اإلحصاءات الت ازداد الطلب علها ف اآلونة األخرة
وتشكل هذه اإلحصاءات أداة معلوماتة مهمة ف النقاش العام والتخطط ورسم . خالل العقدن الماضن
.الساسات المتعلقة بالبئة والمصادر الطبعة
على عنة مقدارها 2017قامت وزارة التخطط التنموي و اإلحصاء بتنفذ هذا المسح خالل العام
. أسرة ممثلة لمختلف مناطق دولة قطر2400
Survey Objectives: :أهداف المسح
The primary objectives of the home environment survey are to provide the basic
data needed for policy making at different national levels as follows :
تتمثل األهداف األساسة لمسح البئة المنزلة ف توفر البانات األساسة الالزمة لوضع الساسات على
:المستوات الوطنة المختلفة كما ل
1 Data on water resources either for drinking or for domestic use. .بانات عن مصادر الماه سواء كانت للشرب أو لالستخدام المنزل 1
2
3 Data on household solid waste, disposal methods, frequency of collection بانات عن النفاات الصلبة المنزلة وأسالب التخلص منها ودورة جمعها من قبل البلدات 3
2 Data on the quality of water for drinking and domestic use. .بانات جودة ماه الشرب وماه االستخدام المنزل
بانات عن تلوث الهواء ف محط المنزل وذلك بالروائح أو بالغبار أو الدخان، بمعرفة نسبة 5
by municipalities and the main components of those wastes and their .والمكونات الرئسة لهذه النفاات و كماتها
4 Data on domestic wastewater, cesspool and frequency of it's evacuation بانات عن الماه العادمة المنزلة والحفر االمتصاصة ودورة نضحها، وتسرب ماه 4
approximate quantity.
6 Data on noise around the house by knowing the percentage of households بانات عن الضجج ف محط المنزل و ذلك بمعرفة نسبة األسر الت تتعرض للضجج 6
and leakage of sewage outside the house. .المجاري خارج المنزل
5 Data on air pollution around the house caused by odors, dust or smoke, by
pollutants.
knowing the percentage of households exposed to pollution and sources of
exposed to noise and noise sources. .ومصادر الضجج
7 Data on household use of chemical detergents, whether in liquid or بانات حول استخدام األسر للمنظفات الكماوة سواء كانت على شكل مسحوق أو سائل 7
powder form, by the household average consumption per week. .بمعرفة متوسط الكمة المستهلكة لألسرة ف األسبوع
.األسر الت تتعرض للتلوث ومصادر التلوث
- 13 -
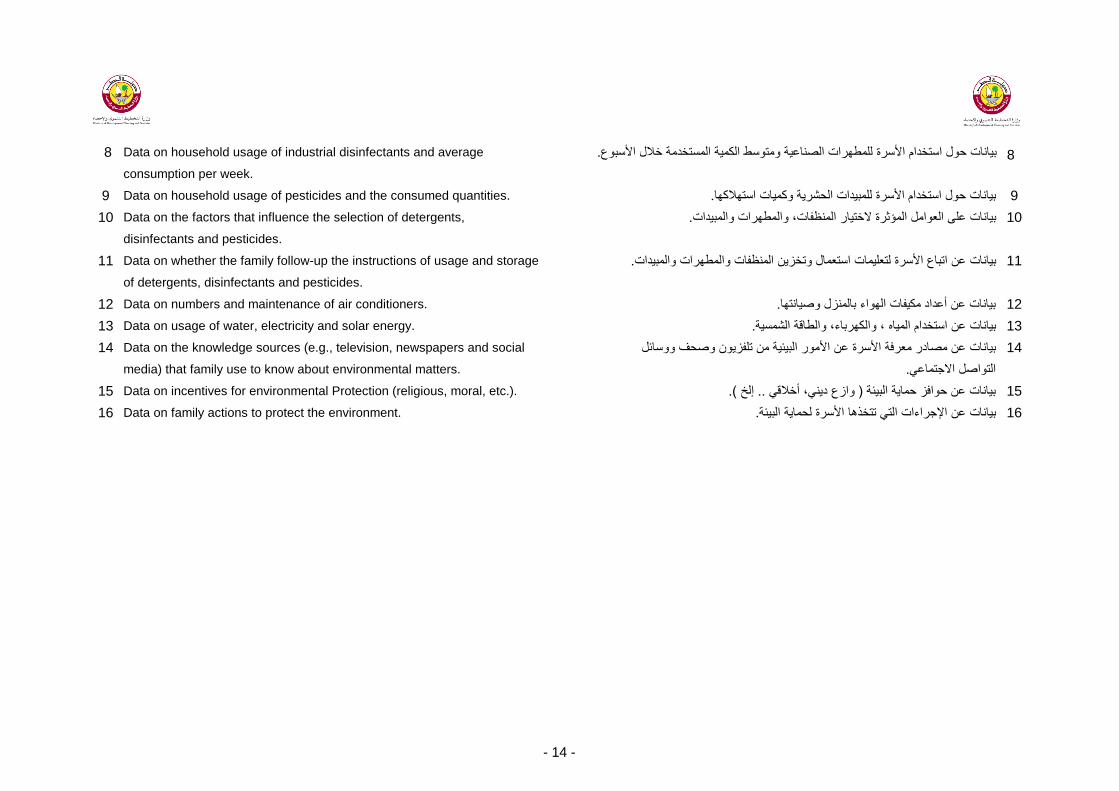
8 Data on household usage of industrial disinfectants and average بانات حول استخدام األسرة للمطهرات الصناعة ومتوسط الكمة المستخدمة خالل األسبوع. 8
consumption per week.
9 Data on household usage of pesticides and the consumed quantities. .بانات حول استخدام األسرة للمبدات الحشرة وكمات استهالكها 9
10 Data on the factors that influence the selection of detergents, بانات على العوامل المإثرة الختار المنظفات، والمطهرات والمبدات. 10
disinfectants and pesticides.
11 Data on whether the family follow-up the instructions of usage and storage .بانات عن اتباع األسرة لتعلمات استعمال وتخزن المنظفات والمطهرات والمبدات 11
13 Data on usage of water, electricity and solar energy. .بانات عن استخدام الماه ، والكهرباء، والطاقة الشمسة 13
of detergents, disinfectants and pesticides.
12 Data on numbers and maintenance of air conditioners. .بانات عن أعداد مكفات الهواء بالمنزل وصانتها 12
14 Data on the knowledge sources (e.g., television, newspapers and social بانات عن مصادر معرفة األسرة عن األمور البئة من تلفزون وصحف ووسائل 14
media) that family use to know about environmental matters. التواصل االجتماع.
15 Data on incentives for environmental Protection (religious, moral, etc.). .(إلخ .. وازع دن، أخالق )بانات عن حوافز حماة البئة 15
16 Data on family actions to protect the environment. .بانات عن اإلجراءات الت تتخذها األسرة لحماة البئة 16
- 14 -

Definitions and concepts التعاريف و املفاهيم
Household: :األســـرة
An individual or a group of individuals who live together in one dwelling and
share food, drink and other living arrangements. They spend on their needs
of goods and services from their cash income, whether it's a comined income
of multiple individuals or only one individual.
فرد، أو مجموعة أفراد قمون معا ف مسكن واحد وشتركون معا ف المؤكل والمشرب وغرها من
شإون المعشة بحث تتكون منهم جمعا وحدة معشة واحدة تنفق على احتاجاتها االستهالكة من
السلع والخدمات من االراد النقدي المجتمع لدها سواء كان مصدره فردا واحدا من أفراد األسرة أو
.أكثر
Environment : :البئــــة
All external conditions affecting the organism's life, growth and survival. .إجمال الظروف الخارجة الت تإثر ف حاة الكائن الح و نموه وبقائه
Wastewater : :الماه العادمة
Wastewater that is usually disposed of by cesspools or sewage system. الماه المستعملة والت تم التخلص منها عادة عن طرق الحفر االمتصاصة أو نظام الصرف
.الصح
Wastewater leakage : :تسرب الماه العادمة
A leakage of wastewater is considered when the respondent is aware of
presence of leaking in cesspool or sewage pipelines near the housing unit. عتبر هناك تسرب للماه العادمة ف حالة علم المستجب بوجود تسرب سواء من الحفرة
.االمتصاصة أو شبكة الصرف الصح القربة من المنزل أو اإلمدادات المتصلة بهما
Air pollution : :تلوث الهواء
The presence of a pollutant or pollutaed materlias in the air which don't
dissipate properly and affect human health or make negative impacts on the
environment.
وجود ملوث أو مواد ملوثة ف الهواء ال تتبدد بصورة سلمة وتإثر على صحة االنسان أو رفاهته
.أو تحدث آثارا بئة ضارة أخرى
Waste collection : :جمع النفاات
Collection and transfer of waste to the place of treatment or disposal by the
municipality..جمع ونقل النفاات إلى مكان معالجتها أو التخلص منها من جانب البلدة
Rubbish burning : :حرق النفاات
Uncontrolled open burning of rubbish such as wood, textiles and others. .حرق غر منظم ف الهواء الطلق لنفاات مثل الخشب والمنسوجات وغرها
- 15 -
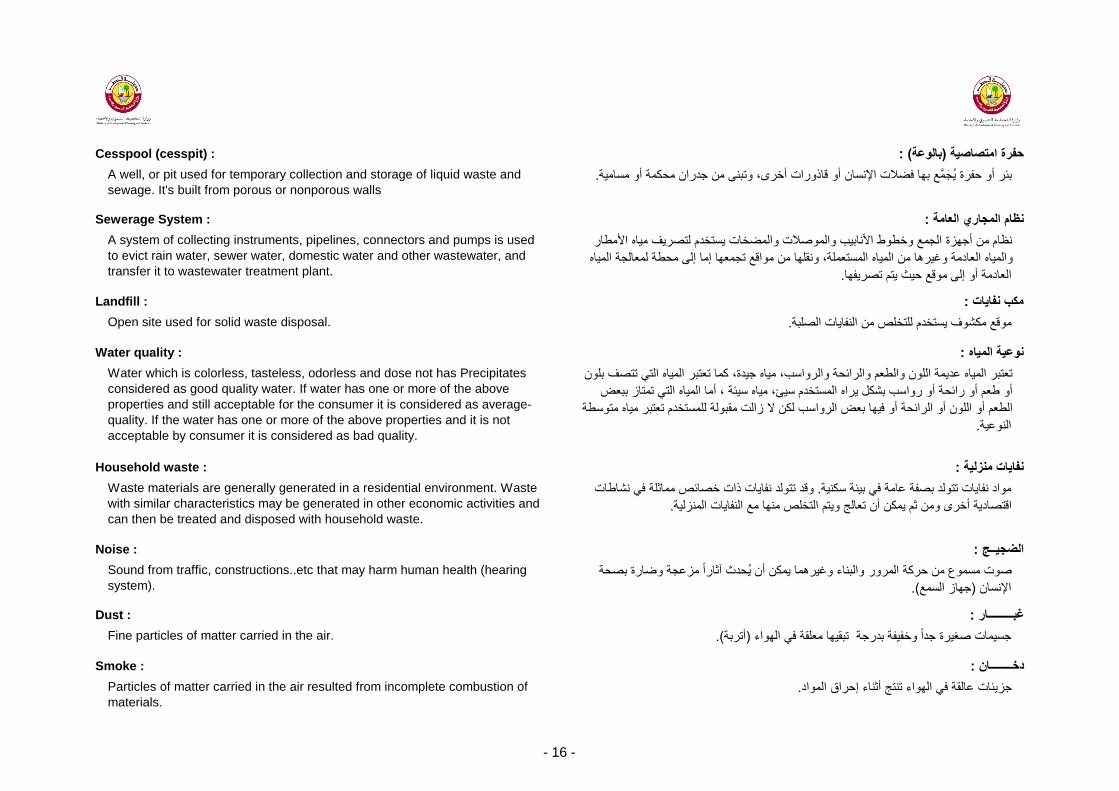
Cesspool (cesspit) : :(بالوعة)حفرة امتصاصة
A well, or pit used for temporary collection and storage of liquid waste and
sewage. It's built from porous or nonporous wallsع بها فضالت اإلنسان أو قاذورات أخرى، وتبنى من جدران محكمة أو مسامة جم .بئر أو حفرة
Sewerage System : :نظام المجاري العامة
A system of collecting instruments, pipelines, connectors and pumps is used
to evict rain water, sewer water, domestic water and other wastewater, and
transfer it to wastewater treatment plant.
نظام من أجهزة الجمع وخطوط األنابب والموصالت والمضخات ستخدم لتصرف ماه األمطار
والماه العادمة وغرها من الماه المستعملة، ونقلها من مواقع تجمعها إما إلى محطة لمعالجة الماه
.العادمة أو إلى موقع حث تم تصرفها
Landfill : :مكب نفاات
Open site used for solid waste disposal. .موقع مكشوف ستخدم للتخلص من النفاات الصلبة
Water quality : :نوعة الماه
Water which is colorless, tasteless, odorless and dose not has Precipitates
considered as good quality water. If water has one or more of the above
properties and still acceptable for the consumer it is considered as average-
quality. If the water has one or more of the above properties and it is not
acceptable by consumer it is considered as bad quality.
تعتبر الماه عدمة اللون والطعم والرائحة والرواسب، ماه جدة، كما تعتبر الماه الت تتصف بلون
أو طعم أو رائحة أو رواسب بشكل راه المستخدم سئ، ماه سئة ، أما الماه الت تمتاز ببعض
الطعم أو اللون أو الرائحة أو فها بعض الرواسب لكن ال زالت مقبولة للمستخدم تعتبر ماه متوسطة
.النوعة
Household waste : :نفاات منزلة
Waste materials are generally generated in a residential environment. Waste
with similar characteristics may be generated in other economic activities and
can then be treated and disposed with household waste.
وقد تتولد نفاات ذات خصائص مماثلة ف نشاطات . مواد نفاات تتولد بصفة عامة ف بئة سكنة
.اقتصادة أخرى ومن ثم مكن أن تعالج وتم التخلص منها مع النفاات المنزلة
Noise : :الضجــج
Sound from traffic, constructions..etc that may harm human health (hearing
system).حدث آثارا مزعجة وضارة بصحة صوت مسموع من حركة المرور والبناء وغرهما مكن أن
.(جهاز السمع)اإلنسان
Particles of matter carried in the air resulted from incomplete combustion of
materials..جزئات عالقة ف الهواء تنتج أثناء إحراق المواد
Dust : :غبـــــــــار
Fine particles of matter carried in the air. .(أتربة)جسمات صغرة جدا وخففة بدرجة تبقها معلقة ف الهواء
Smoke : :دخــــــــان
- 16 -
انفصم انثب
Chapter Tow
* Sample design تصى انؼخ*
* Response rates يؼذالد انتدبوة*


SAMPLE DESIGN تصميم العينة
The Home Environment Survey include both Qatari and Non-Qatari
households. Thus, a frame for Qatari and Non-Qatari households were used in
this survey, the PSUs were formed as follows :
شمل مسح البئة المنزلة األسر القطرة وغر القطرة، وبالتال تم استخدام إطار لعنة أسر قطرة
:وغر قطرة، وتم تشكل وحدات المعانة األساسة وفقا لخصائص التصمم وأحجام العنة كما ل
Sampling Frame and Forming Primary Sampling Units (PSUs) : :(PSUs)إطار العنة وتشكل وحدات العنات األساسة
The sampling frame used for this survey is based on 2015 Simplified Census of
population, housing and establishments. The Ministry of Development,
Planning and Statistics (MDPS) has divided the whole country into small
geographical areas called Census blocks. These were enumeration areas
during the Census. These Blocks were combined to create Primary Sampling
Units (PSUs). Separate frames were constructed; for Qatari (on average 75
households) and non-Qatari households (100 households on average). The
formation of PSUs respects the administrative structure of the State of Qatar.
التعداد المبسط للسكان والمساكن 2015ستند إطار المعانة المستخدم ف هذا المسح إلى عام
وقد قسمت وزارة التنمة والتخطط واإلحصاء البلد بؤكمله إلى مناطق جغرافة صغرة . والمنشآت
تم تجمع هذه الكتل إلنشاء وحدات معانة أولة . وكانت هذه مناطق عد أثناء التعداد. تسمى كتل التعداد
(PSUs) . واألسر غر ( أسرة ف المتوسط75)وقد شدت إطارات منفصلة؛ بالنسبة لألسر القطرة
وجتمع تشكل وحدات المعانة األولة مع الهكل اإلداري لدولة . ( أسرة ف المتوسط100)القطرة
.قطر
Sample Design Features : :خصائص تصمم العنات
A two-stage sample design is used in this survey, selecting PSUs at the first
stage and a sample of households within each selected PSU at the second
stage. The unit chosen at the first stage is called the Primary Sampling Unit and
the unit selected at the second stage is called the Secondary Sampling Unit.
تم استخدام تصمم العنة على مرحلتن ف هذا المسح، واختار وحدات المعانة األولة ف المرحلة
وتسمى الوحدة . األولى وعنة من األسر داخل كل وحدة معانة أولة مختارة ف المرحلة الثانة
المختارة ف المرحلة األولى وحدة أخذ العنات األولة، وتسمى الوحدة المختارة ف المرحلة الثانة
.وحدة أخذ العنات الثانوة
200 PSUs were selected, 100 from Qatari frame of PSUs and another 100
PSUs were selected from Non-Qatari frame. In the first stage, a systematic
random sample of PSUs is drawn with probability proportional to size (size will
be the number of HH in each PSU) from the area frames. After the selection of
PSUs, households were selected with 12 households from each selected PSU
with simple systematic random sampling. Interviewers visited each selected
household and administered the questionnaire.
من اإلطار القطري لوحدات المعانة األولة، وتم اختار 100 وحدة معانة أولة، و 200تم اختار
ف المرحلة األولى، تم رسم عنة عشوائة . وحدة معانة أولة أخرى من اإلطار غر القطري100
الحجم سكون عدد األسر ف كل )منهجة من وحدات المعانة األولة مع احتمال تناسب مع الحجم
وبعد اختار وحدات المعانة األولة، تم اختار األسر . من إطارات المنطقة (وحدة معانة أولة
وزار . أسرة من كل وحدة معانة أولة مختارة مع أخذ عنات عشوائة منهجة بسطة12المعشة ب
.الباحثون كل أسرة مختارة وأداروا االستبان
- 19 -

Sample Size and Sample Distribution : :حجم وتوزع العنة
وتم تحقق . أسرة غر قطرة1200 قطري و 1200 أسرة تتؤلف من 2400وكان حجم العنة للمسح
وحدة 100 وحدة قطرة و 100) وحدة معانة أولة 200حجم العنة المستهدفة عن طرق اختار
وبذلت جهود مقدرة . أسرة من كل وحدة معانة أولة مختارة12ثم اختار (معانة أولة غر قطرة
:كما وضح الجدول التال . لتمثل جمع البلدات ف العنة
توزع األسر بعنة المسح حسب البلدةDistribution of Households in Survey Sample by Municipality
The sample size for the survey was 2400 households composed of 1200 Qatari
and 1200 Non-Qatari households. The target sample size was achieved by
selecting 200 PSUs(100 Qatari and 100 Non-Qatari PSUs) and then selecting
12 households from each selected PSU. The efforts were made that all the
municipalities are represented in the sample, as shown in the table below :
أسر قطرة
Qatari householdsالبلدـــــة
وحدات العنات
(PSUs) األساسة
األسر
Households
وحدات العنات
(PSUs)األساسة
األسر
Households
Al Rayyan 852
Municipalityمجموع األسر
Total HH
أسر غر قطرة
Non-Qatari households
Doha 984 55 660 27
60
الدوحة
28 336 43
الوكرة
516 الران
324
2 24 10
7 84 5
120 أم صالل
Al Wakra 144
12 الشمال
Al Khor 96 4 48 4 48
Al Shamal 24
Umm Slal 144
1 12 7 84
الخور
1 12 1
الظعان
36 الشحانة
Al Dayyen 96
Totalالمجموع 2400 100 1200 100 1200
Al Sheehaniya 60 2 24 3
- 20 -

Response rate: :معدالت التجاوب
The response rate of “Home Environment Survey” was (93.1%) among the
2400 surveyed households, which is high rate. The Non-responding and
incomplete rate is (6.9%). As shown in the following table.
أسرة ، 2400من إجمال عدد األسر البالغ % 93.1بلغ معدل تجاوب األسر ف مسح البئة المنزلة
، كما وضح %6.9وعتبر معدل عال نسبا ، وبلغت نسبة حاالت عدم التجاوب و الغر مكتمل نسبة
:الجدول التال
معدل تجاوب األسر حسب نوع التجاوبResponse rate of households by type of response
Response(%)النسبة عدد أسر العنة
(%) percentageاالستجابة households of
sample
Respondent households 93.1 2235 األسر المستجبة
Non Respondent households 4.6 111 األسر غر المستجبة
Total of sample 100 2400 مجموع العنة
Incomplete 2.3 54 غرمكتمل
- 21 -

(يهخص تسهه ألهى انتبئح )
( Analytical Summary of Main Results )
انفصم انثبنث
Chapter Three

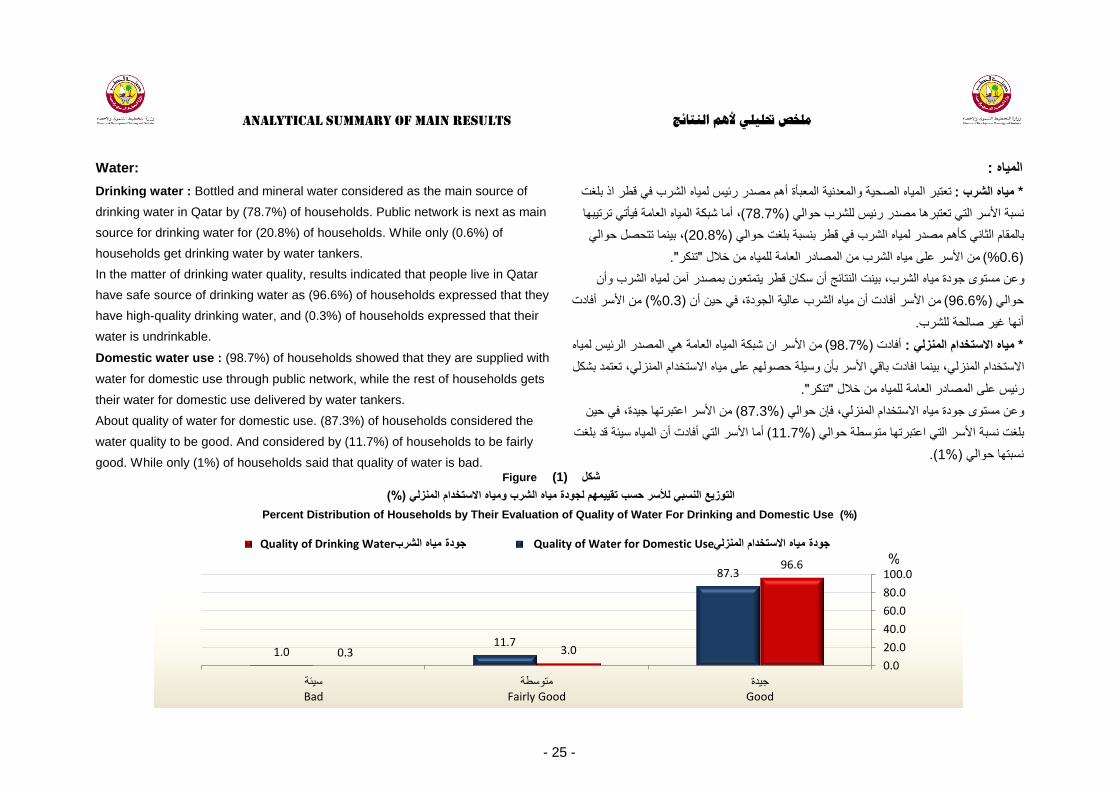
Figure (1) شكل
(%)التوزع النسب لألسر حسب تقمهم لجودة ماه الشرب وماه االستخدام المنزل
Percent Distribution of Households by Their Evaluation of Quality of Water For Drinking and Domestic Use (%)
Analytical summary of main results ملخص حتليلي ألهم النتائج
Water: :الماه
Drinking water : Bottled and mineral water considered as the main source of
drinking water in Qatar by (78.7%) of households. Public network is next as main
source for drinking water for (20.8%) of households. While only (0.6%) of
households get drinking water by water tankers.
In the matter of drinking water quality, results indicated that people live in Qatar
have safe source of drinking water as (96.6%) of households expressed that they
have high-quality drinking water, and (0.3%) of households expressed that their
water is undrinkable.
Domestic water use : (98.7%) of households showed that they are supplied with
water for domestic use through public network, while the rest of households gets
their water for domestic use delivered by water tankers.
About quality of water for domestic use. (87.3%) of households considered the
water quality to be good. And considered by (11.7%) of households to be fairly
good. While only (1%) of households said that quality of water is bad.
تعتبر الماه الصحة والمعدنة المعبؤة أهم مصدر رئس لماه الشرب ف قطر اذ بلغت : ماه الشرب *
، أما شبكة الماه العامة فؤت ترتبها (78.7%)نسبة األسر الت تعتبرها مصدر رئس للشرب حوال
، بنما تتحصل حوال (20.8%)بالمقام الثان كؤهم مصدر لماه الشرب ف قطر بنسبة بلغت حوال
".تنكر"من األسر على ماه الشرب من المصادر العامة للماه من خالل (%0.6)
وعن مستوى جودة ماه الشرب، بنت النتائج أن سكان قطر تمتعون بمصدر آمن لماه الشرب وأن
من األسر أفادت (%0.3)من األسر أفادت أن ماه الشرب عالة الجودة، ف حن أن (96.6%)حوال
.أنها غر صالحة للشرب
من األسر ان شبكة الماه العامة ه المصدر الرئس لماه (98.7%)أفادت : ماه االستخدام المنزل *
االستخدام المنزل، بنما افادت باق األسر بؤن وسلة حصولهم على ماه االستخدام المنزل، تعتمد بشكل
".تنكر"رئس على المصادر العامة للماه من خالل
من األسر اعتبرتها جدة، ف حن (87.3%)وعن مستوى جودة ماه االستخدام المنزل، فإن حوال
أما األسر الت أفادت أن الماه سئة قد بلغت (11.7%)بلغت نسبة األسر الت اعتبرتها متوسطة حوال
.(1%)نسبتها حوال
96.6
3.0 0.3
87.3
11.7 1.0
0.0
20.0
40.0
60.0
80.0
100.0
جيدةGood
متوسطةFairly Good
سيئةBad
Quality of Water for Domestic Use جودة مياه االستخدام المنزلي Quality of Drinking Water جودة مياه الشرب
%
- 25 -

Solid Waste: النفاات الصلبة:
Waste collection and disposal : The results showed that (80.1%) of households
get rid of their domestic solid waste (7) times or more weekly. Results also
revealed that solid waste management is done by municipalities for (99.9%) of
households.
Solid waste composition : According to results, (80.6%) of households stated
that food waste is the first major component in their solid waste, next major
component is paper/cartoon, followed by plastic.
من األسر تقوم بالتخلص من (80.1%)أوضحت النتائج أن حوال :جمع النفاات والتخلص منها *
من (99.9%)كما بنت النتائج أن حوال . مرات فؤكثر اسبوعا (7) الصلبة بمعدل المنزلةالنفاات
. والتخلص منها من أمام المنزلاألسر تعتمد بشكل كامل على البلدات ف عملة جمعها
عند استعراض مكونات النفاات الصلبة الت تقوم األسر بالتخلص منها، :مكونات النفاات الصلبة *
من األسر أن أهم مكون لنفااتها الصلبة تمثل ف مخلفات الطعام، وؤت ف (80.6%)أفادت حوال
.المرتبة الثانة الورق والكرتون له البالستكFigure (2) شكل
(%)التوزع النسب لالسر حسب أهم مكون للنفاات الصلبة
Percent Distribution of Households by the Major Component of Solid Waste (%)
Wastewater: :الماه العادمة
The results showed that wastewater network is used by (73.9%) of households to
dispose their wastewater, and (25.7%) of households use cesspool to dispose
their wastewater.
Regarding to sewage leakage outside the housing units for households that use
wastewater network or cesspool , results expressed that only (2.4%) of
households said that there is a leak in wastewater outside the housing units.
However, the majority of households expressed that they don't have and sewage
leakage.
أوضحت النتائج أن تخلص األسر من الماه العادمة تم غالبا عن طرق نظام المجاري العامة حث أن
من األسر لدها حفرة (25.7%)من األسر لدها اتصال بنظام المجاري العامة، بنما (73.9%)
امتصاصة للتخلص من الماه العادمة
وعن تسرب ماه المجاري خارج المنزل لألسر الت لدها اتصال بشكبة المجاري العامة أو تلك الت لدها
فقط من تلك األسر تعان من تسرب لماه المجاري (2.4%)حفرة امتصاصة، فقد أظهرت النتائج أن
خارج المنزل، بنما افادت الغالبة العظمى من تلك االسر بعدم وجود أي نوع من أنواع التسرب لماه
.المجاري خارج المنزل
80.6
11.6
2.0 0.5
5.0
0.2 0.0
Food Wasteمخلفات الطعام
Paper/Cartoonكرتون /ورق
Baby’s Diapersحفاظات أطفال
Aluminum Containers/Metalsحديد /علب ألمنيوم
Plasticبالستيك
Agricultural Waste (Grass or Animal( )نباتية أو حيوانية)نفايات زراعية
Glassزجاج
- 26 -

(%)التوزع النسب لألسر حسب التعرض للملوثات ف محط المنزل
Percent Distribution of Households by Exposure to Pollutants in House Surroundings (%)
Pollution in home surroundings: :التلوث ف محط المنزل
Exposure to noise : The results showed that (78.4%) of households in Qatar live
in an environment that free of noise. While (21.6%) of households are exposed to
noise, as following (15.2%) are exposed to noise occasionally and (6.4%) are
exposed to noise very often. According to households who are exposed noise:
Road traffic and construction works considered as major sources of noise with
(55.3%) and (38.1%) respectively.
Exposure to odors, dust and smoke : The percentage of households that have
surroundings free of odors reached (84.3%), and (78.5%) of households are not
exposed to dust, while (93.5%) of households indicated that they are not exposed
to smoke. Whereas the rest of households stated that they are exposed to those
pollutants either occasionally or very often.
Regarding the sources of pollutants that pollutes households' homes
surroundings. Households exposed to odors, dust and smoke said that the major
sources of those pollutants are (wastewater and waste containers, wind, vehicles)
respectively.
من األسر ف قطر تعش ف بئة خالة من الضجج، (78.4%)بنت النتائج أن :التعرض للضجج *
لألسر الت (15.2%)موزعة على (21.6%)أما األسر الت تتعرض للضجج فقد بلغت نسبتها
وتمثل حركة المرور وأعمال البناء، أهم . تتعرض للضجج غالبا (6.4%)تتعرض للضجج أحانا، و
(38.1%)و (55.3%)مصادر الضجج لألسر الت أفادت بؤنها تتعرض للضجج، حث بلغت نسبتهما
.على التوال
بلغت نسبة األسر الت تعش ف بئة خالة من الروائح :التعرض للروائح والغبار والدخان *
(93.5%)من األسر أنها تعش ف بئة نقة من الغبار، وعبرت (78.5%)، بنما أعتبرت (%84.3)
ف حن أوضحت باق األسر بؤنها تتعرض أحانا أو . من األسر أنها تنعم ببئة خالة من التعرض للدخان
.نادرا لتلك الملوثات ف محط المنزل
أما عن مصادر تلوث البئة ف محط المنزل بسبب تلك الملوثات، فقد أفادت األسر الت تتعرض للروائح
، الراح، المركبات مكب النفااتالماه العادمة و )أو الغبار أو الدخان أن أهم مصادر تلك الملوثات ه
.على التوال (ووسائل التنقل اآللة Figure (3) شكل
78.4 84.3
78.5
93.5
21.6 15.8
21.5
6.5
0.0
10.0
20.0
30.0
40.0
50.0
60.0
70.0
80.0
90.0
100.0
التعرض للضجيجExposure to Noise
التعرض للروائحExposure to Odors
التعرض للغبارExposure to Dust
التعرض للدخانExposure to Smoke
Sometime or Very Oftenأحيانا أو غالبا Not exist or Seldomال يوجد أو نادرا %
- 27 -
Percent Distribution of Households by Households Checking on Container Ingredients and Following Usage and Storage Instructions (%)
(%)التوزع النسب لألسر حسب تدقق األسرة على المكونات المدونة على العبوة واتباع التعلمات ف طرقة االستعمال والحفظ
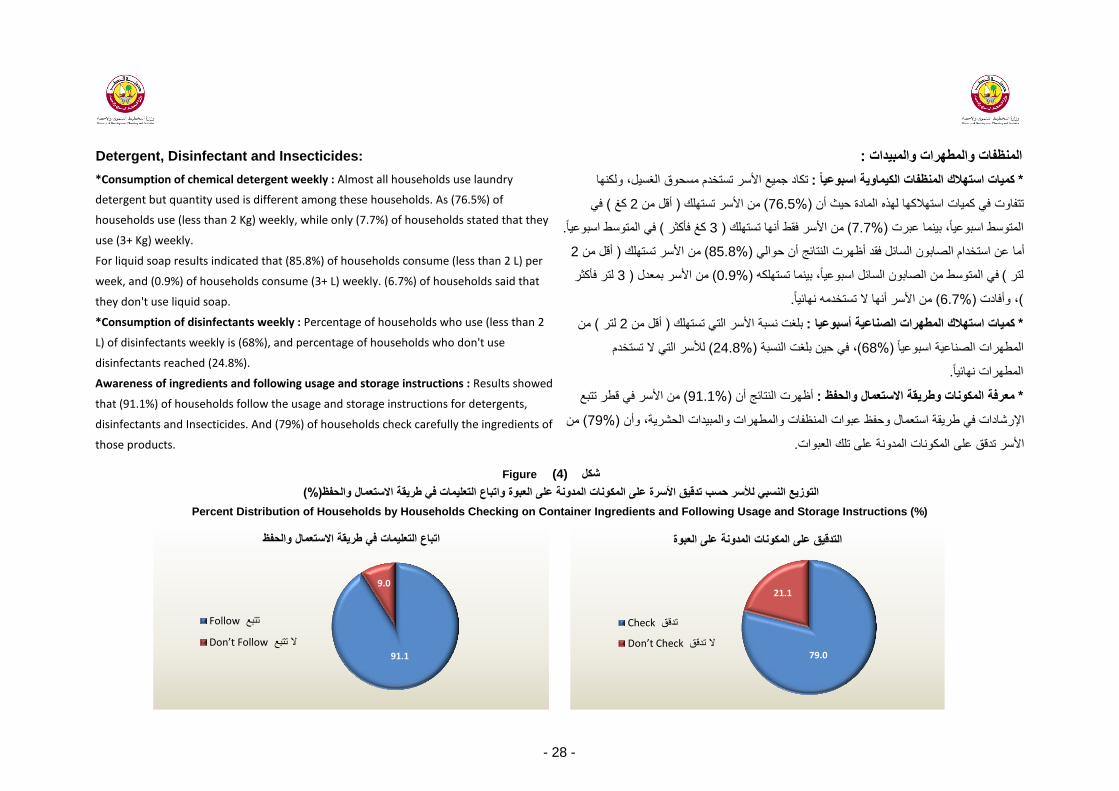
Detergent, Disinfectant and Insecticides: :المنظفات والمطهرات والمبدات
*Consumption of chemical detergent weekly : Almost all households use laundry
detergent but quantity used is different among these households. As (76.5%) of
households use (less than 2 Kg) weekly, while only (7.7%) of households stated that they
use (3+ Kg) weekly.
For liquid soap results indicated that (85.8%) of households consume (less than 2 L) per
week, and (0.9%) of households consume (3+ L) weekly. (6.7%) of households said that
they don't use liquid soap.
*Consumption of disinfectants weekly : Percentage of households who use (less than 2
L) of disinfectants weekly is (68%), and percentage of households who don't use
disinfectants reached (24.8%).
Awareness of ingredients and following usage and storage instructions : Results showed
that (91.1%) of households follow the usage and storage instructions for detergents,
disinfectants and Insecticides. And (79%) of households check carefully the ingredients of
those products.
تكاد جمع األسر تستخدم مسحوق الغسل، ولكنها :كمات استهالك المنظفات الكماوة اسبوعا *
ف ( كغ 2أقل من )من األسر تستهلك (76.5%)تتفاوت ف كمات استهالكها لهذه المادة حث أن
.ف المتوسط اسبوعا ( كغ فؤكثر 3 )من األسر فقط أنها تستهلك (7.7%)المتوسط اسبوعا، بنما عبرت
2أقل من )من األسر تستهلك (85.8%)أما عن استخدام الصابون السائل فقد أظهرت النتائج أن حوال
لتر فؤكثر 3) من األسر بمعدل ( 0.9)%ف المتوسط من الصابون السائل اسبوعا، بنما تستهلكه (لتر
.من األسر أنها ال تستخدمه نهائا( 6.7)%، وأفادت (
من ( لتر 2أقل من )بلغت نسبة األسر الت تستهلك :كمات استهالك المطهرات الصناعة أسبوعا *
لألسر الت ال تستخدم (24.8%)، ف حن بلغت النسبة (68%)المطهرات الصناعة اسبوعا
.المطهرات نهائا
من األسر ف قطر تتبع (91.1%)أظهرت النتائج أن :معرفة المكونات وطرقة االستعمال والحفظ *
من (79%)اإلرشادات ف طرقة استعمال وحفظ عبوات المنظفات والمطهرات والمبدات الحشرة، وأن
.األسر تدقق على المكونات المدونة على تلك العبوات
Figure (4) شكل
79.0
21.1
التدقيق على المكونات المدونة على العبوة
Checkتدقق
Don’t Checkال تدقق 91.1
9.0
اتباع التعليمات في طريقة االستعمال والحفظ
Followتتبع
Don’t Followال تتبع
- 28 -
من األسر عن (%32.8)تتخذ األسر ف قطر اجراءات متنوعة لحماة البئة، حث عبرت مانسبته
استعدادها لحماة البئة من خالل فرز المواد مثل البالستك والورق والمعادن قبل إلقائها ف النفاات، كما
.من األسر عن استعدادها لتقلل الفاقد من االغذة (21.5%)عبرت
من األسر بؤنها (27.7%) أما عن مدى استعداد األسر لترشد استهالك الكهرباء والماء، فقد أفادت
ف . من األسر قالت أنها تستطع تقلل استهالك الماه (17.2%)جاهزة لتخفض استهالك الكهرباء، و
من األسر ف (58.4%)من األسر أنها تستخدم أجهزة لترشد استهالك الماه، و (48.2%)حن أفادت
.قطر ستخدمون لمبات توفر الطاقة
Households in Qatar take several procedures to protect environment, as (32.8%)
of households have tendency to take procedures to protect environment by
separating materials like plastic, papers and metals before dumping them. And
(21.5%) of households stated that they are willing to decrease the wasted food.
About the tendency of households to reduce their electricity and water
consumption, (27.7%) of households expressed that they are willing to reduce
electricity consumption. While (17.2%) of households stated that they are able to
decrease water consumption. Also, (48.2%) of households showed that they use
devices to decrease electricity and water consumption, and (58.4%) of
households in Qatar use energy-efficient light bulbs
Sources of environmental awareness: :مصادر التوعة البئة
(42.6%) of households know about the environmental issues from TV. While
(31.4%) of households use social media to raise their environmental awareness,
and for (19.1%) of households the environmental awareness come form local
newspapers, radio and publications from officials entities.
من األسر ف قطر، بنما (42.6%)تساهم قنوات التلفزون ف توعة األسرة بالقضاا البئة بنسبة
، ف حن ساهمت الصحف المحلة واإلذاعة (31.4%)ساهمت وسائل التواصل االجتماع بنسبة
.(19.1%)ونشرات الجهات الرسمة التوعوة بنسبة
Environmental protection procedures: :إجراءات الحماة البئة
- 29 -

خذاول انتبئح انهبئخ نسر انجئخ انسنخ
Tables of Final Results
of Home Environment Survey


Table No (1) خذول رلى (1)
المجموع
ماه
معدنة ماه صحة معبئة
تنكر من
مصادر عامة
شبكة
ماه عامة
Total Mineral WaterBottled
WaterTanker Public Network
% % % % %
Total 100 19.1 59.6 0.6 20.8 إجمال
Doha 100 24.3 58.6 0.0 17.1 الدوحة
Al Rayyan 100 16.7 59.7 0.6 23.1 الران
Al Wakra 100 2.8 80.3 0.7 16.2 الوكرة
Umm Slal 100 20.0 45.7 0.0 34.3 أم صالل
Al Khor and Al Thakhira 100 7.4 68.4 0.0 24.2 الخور والذخرة
Al Dayyan + Al Shamal 100 12.5 62.5 0.0 25.0 الشمال+ الظعان
Al Sheehaniya 100 32.2 37.3 13.6 17.0 الشحانة
انتىزغ انسج نألسر زست انجهذخ ووسهخ انسصىل ػهى يب انشرة
Percent Distribution of Households
by Municipality and the Means of Obtaining Drinking Water
وسلة الحصول على ماه الشرب
Municipalityالبلـــدـــة
Means of Obtaining Drinking Water
2017
- 33 -

Table No (2) خذول رلى (2)
المجموعتنكر من
مصادر عامةشبكة ماه عامة
Total Tanker Public Network
% % %
Total 100 1.3 98.7 إجمال
Doha 100 0.3 99.7 الدوحة
Al Rayyan 100 1.2 98.8 الران
Al Wakra 100 5.6 94.4 الوكرة
Umm Slal 100 0.0 100 أم صالل
Al Khor and Al Thakhira 100 1.1 98.9 الخور والذخرة
Al Dayyan + Al Shamal 100 0.0 100 الشمال+ الظعان
Al Sheehaniya 100 13.6 86.4 الشحانة
انتىزغ انسج نألسر زست انجهذخ ووسهخ انسصىل ػهى يب االستخذاو انسن
Percent Distribution of Households
by Municipality and the Means of Obtaining Water for Domestic Use
Municipality
وسلة الحصول على ماه االستخدام المنزل
البلـــدـــة
Means of Obtaining Water for Domestic Use
2017
- 34 -

Table No (3) خذول رلى (3)
المجموع سئة متوسطة جدة
Total Bad Fairly Good Good
% % % %
Total 100 0.3 3.0 96.6 إجمال
Doha 100 0.3 3.3 96.4 الدوحة
Al Rayyan 100 0.3 3.2 96.6 الران
Al Wakra 100 1.4 3.5 95.1 الوكرة
Umm Slal 100 0.0 3.6 96.4 أم صالل
Al Khor and Al Thakhira 100 0.0 1.1 99.0 الخور والذخرة
Al Dayyan + Al Shamal 100 0.0 0.9 99.1 الشمال+ الظعان
Al Sheehaniya 100 0.0 1.7 98.3 الشحانة
انتىزغ انسج نألسر زست انجهذخ وتمى األسرح ندىدح انب انستخذيخ نهشرة
Percent Distribution of Households
by Municipality and Household Evaluation of Drinking Water Quality
Municipality
جودة ماه الشرب
البلـــدـــة
Quality of Drinking Water
2017
Bad : There is severe color, taste, Odor or sediments هناك لون أو طعم أو رائحة أو رواسب بشكل كبر: سئة.
.عدمة اللون والطعم والرائحة والرواسب: جدة
.هناك بعض اللون أو الطعم أو الرائحة وال زالت مقبولة: متوسطة
Good : Colorless, Tasteless, Odorless, and No sediments.
Fairly Good : There is some color, taste or odro and is still acceptable.
- 35 -
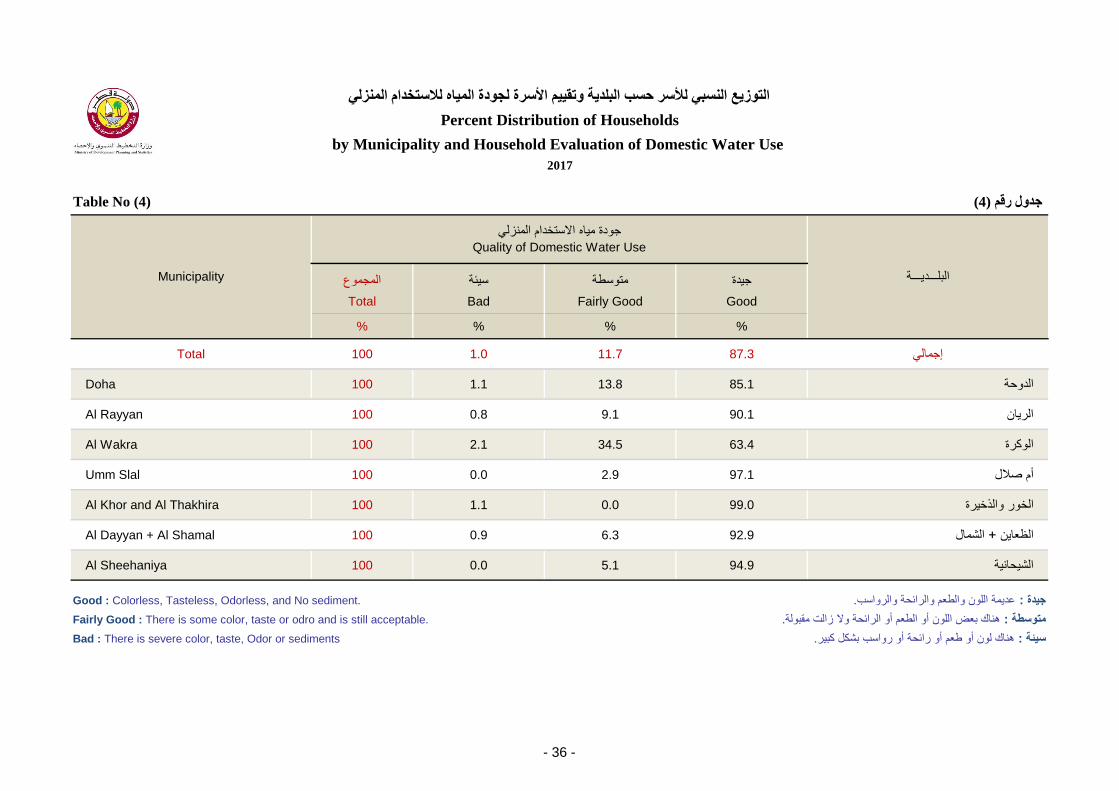
Table No (4) خذول رلى (4)
المجموع سئة متوسطة جدة
Total Bad Fairly Good Good
% % % %
Total 100 1.0 11.7 87.3 إجمال
Doha 100 1.1 13.8 85.1 الدوحة
Al Rayyan 100 0.8 9.1 90.1 الران
Al Wakra 100 2.1 34.5 63.4 الوكرة
Umm Slal 100 0.0 2.9 97.1 أم صالل
Al Khor and Al Thakhira 100 1.1 0.0 99.0 الخور والذخرة
Al Dayyan + Al Shamal 100 0.9 6.3 92.9 الشمال+ الظعان
Al Sheehaniya 100 0.0 5.1 94.9 الشحانة
Quality of Domestic Water Use
انتىزغ انسج نألسر زست انجهذخ وتمى األسرح ندىدح انب نالستخذاو انسن
Percent Distribution of Households
by Municipality and Household Evaluation of Domestic Water Use
Municipality
جودة ماه االستخدام المنزل
البلـــدـــة
2017
Good : Colorless, Tasteless, Odorless, and No sediment. .عدمة اللون والطعم والرائحة والرواسب: جدة
Fairly Good : There is some color, taste or odro and is still acceptable. .هناك بعض اللون أو الطعم أو الرائحة وال زالت مقبولة: متوسطة
Bad : There is severe color, taste, Odor or sediments هناك لون أو طعم أو رائحة أو رواسب بشكل كبر: سئة.
- 36 -
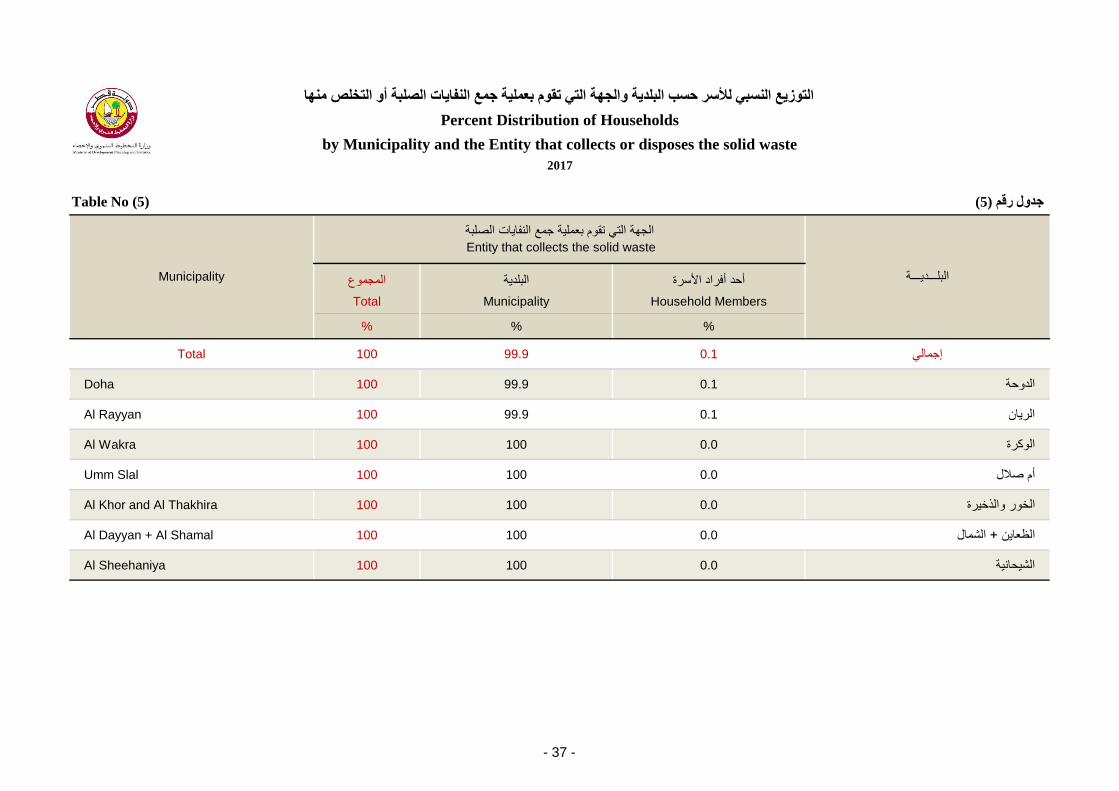
Table No (5) خذول رلى (5)
المجموع البلدة أحد أفراد األسرة
Total Municipality Household Members
% % %
Total 100 99.9 0.1 إجمال
Doha 100 99.9 0.1 الدوحة
Al Rayyan 100 99.9 0.1 الران
Al Wakra 100 100 0.0 الوكرة
Umm Slal 100 100 0.0 أم صالل
Al Khor and Al Thakhira 100 100 0.0 الخور والذخرة
Al Dayyan + Al Shamal 100 100 0.0 الشمال+ الظعان
Al Sheehaniya 100 100 0.0 الشحانة
انتىزغ انسج نألسر زست انجهذخ واندهخ انت تمىو ثؼهخ خغ انفببد انصهجخ أو انتخهص يهب
Percent Distribution of Households
by Municipality and the Entity that collects or disposes the solid waste
Municipality
الجهة الت تقوم بعملة جمع النفاات الصلبة
البلـــدـــة
Entity that collects the solid waste
2017
- 37 -
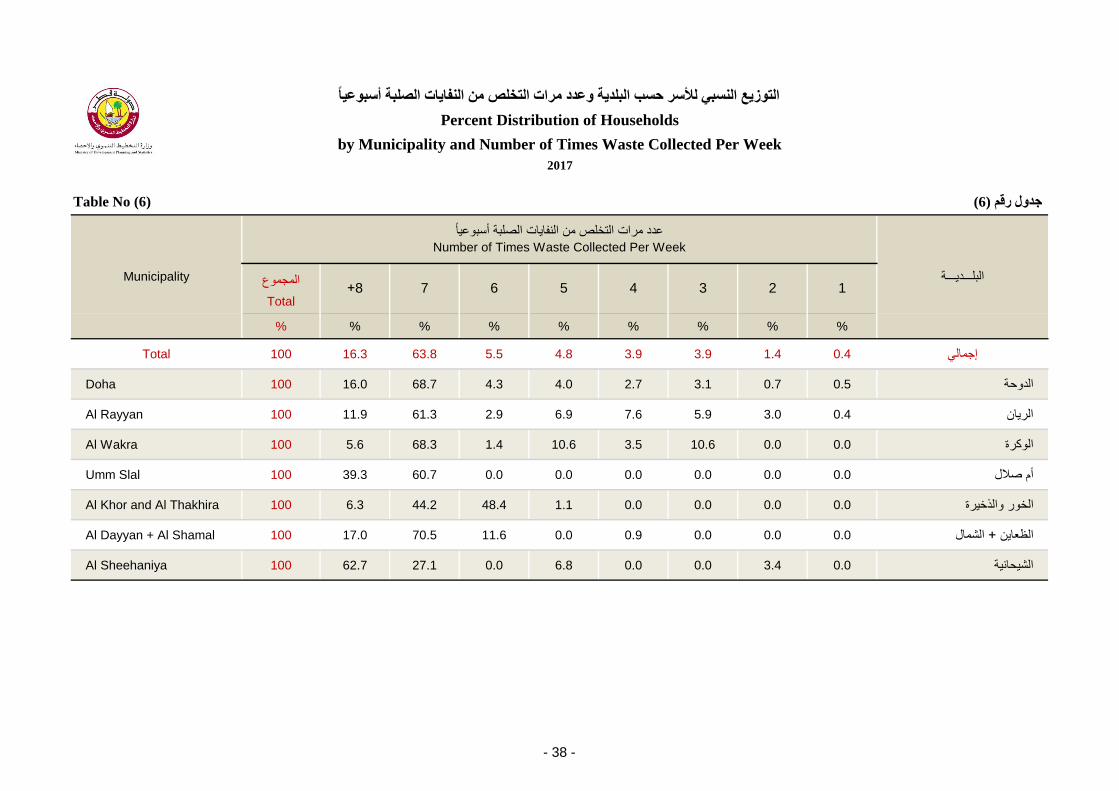
Table No (6) خذول رلى (6)
المجموع
Total
% % % % % % % % %
Total 100 16.3 63.8 5.5 4.8 3.9 3.9 1.4 0.4 إجمال
Doha 100 16.0 68.7 4.3 4.0 2.7 3.1 0.7 0.5 الدوحة
Al Rayyan 100 11.9 61.3 2.9 6.9 7.6 5.9 3.0 0.4 الران
Al Wakra 100 5.6 68.3 1.4 10.6 3.5 10.6 0.0 0.0 الوكرة
Umm Slal 100 39.3 60.7 0.0 0.0 0.0 0.0 0.0 0.0 أم صالل
Al Khor and Al Thakhira 100 6.3 44.2 48.4 1.1 0.0 0.0 0.0 0.0 الخور والذخرة
Al Dayyan + Al Shamal 100 17.0 70.5 11.6 0.0 0.9 0.0 0.0 0.0 الشمال+ الظعان
Al Sheehaniya 100 62.7 27.1 0.0 6.8 0.0 0.0 3.4 0.0 الشحانة
2017
انتىزغ انسج نألسر زست انجهذخ وػذد يراد انتخهص ي انفببد انصهجخ أسجىػب
Percent Distribution of Households
by Municipality and Number of Times Waste Collected Per Week
Municipality
عدد مرات التخلص من النفاات الصلبة أسبوعا
البلـــدـــة18+
Number of Times Waste Collected Per Week
7 6 5 4 3 2
- 38 -

Table No (7) خذول رلى (7)
المجموع فؤكثر (ج.ك) 6 6 وأقل من 5 5 وأقل من 4 4 وأقل من 3 3 وأقل من 2 2أقل من
Total6 (K.g) & More 5 & less
than 6
4 & less
than 5
3 & less
than 4
2 & less
than 3
Less than
2
% % % % % % %
Total 100 17.4 13.5 9.3 23.2 24.6 12.1 إجمال
Doha 100 15.9 13.3 9.0 24.1 26.2 11.5 الدوحة
Al Rayyan 100 22.2 14.0 9.7 23.6 22.9 7.6 الران
Al Wakra 100 3.5 21.1 10.6 19.7 24.7 20.4 الوكرة
Umm Slal 100 5.7 10.7 12.9 24.3 32.9 13.6 أم صالل
Al Khor and Al Thakhira 100 0.0 5.3 10.5 9.5 24.2 50.5 الخور والذخرة
Al Dayyan + Al Shamal 100 5.4 17.0 5.4 40.2 24.1 8.0 الشمال+ الظعان
Al Sheehaniya 100 93.2 5.1 1.7 0.0 0.0 0.0 الشحانة
Estimated Quantity of Solid Waste Disposed at One Time (by Kg)
(ثبنكهىخراو)انتىزغ انسج نألسر زست انجهذخ وتمذر كخ انفببد انصهجخ انت تى انتخهص يهب ف انرح انىازذح
Percent Distribution of Households
by Municipality and Estimated Quantity of Solid Waste Disposed at One Time (by Kg)
Municipality
(بالكلوجرام)تقدر كمة النفاات الصلبة الت تم التخلص منها ف المرة الواحدة
البلـــدـــة
2017
- 39 -

Table No (8) خذول رلى (8)
المجموع فؤكثر (متر) 200 200 وأقل من 100 100 وأقل من 50 50أقل من
Total200 (meters)
& more
100 & less
than 200
50 & less
than 100
Less than
50
% % % % %
Total 100 0.3 3.2 13.3 83.2 إجمال
Doha 100 0.5 2.7 10.5 86.3 الدوحة
Al Rayyan 100 0.1 4.0 19.9 76.0 الران
Al Wakra 100 0.0 7.0 26.8 66.2 الوكرة
Umm Slal 100 0.0 0.0 0.7 99.3 أم صالل
Al Khor and Al Thakhira 100 0.0 0.0 4.2 95.8 الخور والذخرة
Al Dayyan + Al Shamal 100 0.0 0.0 3.6 96.4 الشمال+ الظعان
Al Sheehaniya 100 0.0 10.2 10.2 79.7 الشحانة
أللرة يكب ندغ انفببد انصهجخ (ثبنتر)انتىزغ انسج نألسر زست انجهذخ وانسبفخ
Percent Distribution of Households
by Municipality and the Distance (by Meter) to the Nearest Solid Waste Container
Municipality
ألقرب مكان لجمع النفاات الصلبة (بالمتر)المسافة
البلـــدـــة
Distance (by Meter) to the Nearest Solid Waste Container
2017
- 40 -

Table No (9) خذول رلى (9)
المجموع *أخرى بالستك
/ورق
كرتون
مخلفات
الطعامTotal
Other* Plastic Paper / Cartoon Food
Waste
% % % %
Total 100 2.8 5.0 11.6 80.6 إجمال
Doha 100 2.2 4.8 8.8 84.2 الدوحة
Al Rayyan 100 2.6 7.6 19.8 70.0 الران
Al Wakra 100 3.5 3.5 4.2 88.7 الوكرة
Umm Slal 100 11.4 2.1 9.3 77.1 أم صالل
Al Khor and Al Thakhira 100 1.1 0.0 0.0 99.0 الخور والذخرة
Al Dayyan + Al Shamal 100 0.0 0.0 11.6 88.4 الشمال+ الظعان
Al Sheehaniya 100 0.0 3.4 0.0 96.6 الشحانة
* Other include agricultural waste (grass or animal), aluminum containers/metals, glass, babys diapers. .حدد ، زجاج ، حفاظات أطفال/، علب ألمنوم (نباتة أو حوانة)أخرى تشمل نفاات زراعة *
The Major Component of Solid Waste
انتىزغ انسج نألسر زست انجهذخ وأهى يكى نهفببد انصهجخ
Percent Distribution of Households
by Municipality and the Major Component of Solid Waste
Municipality
أهم مكونات للنفاات الصلبة
البلـــدـــة
2017
- 41 -
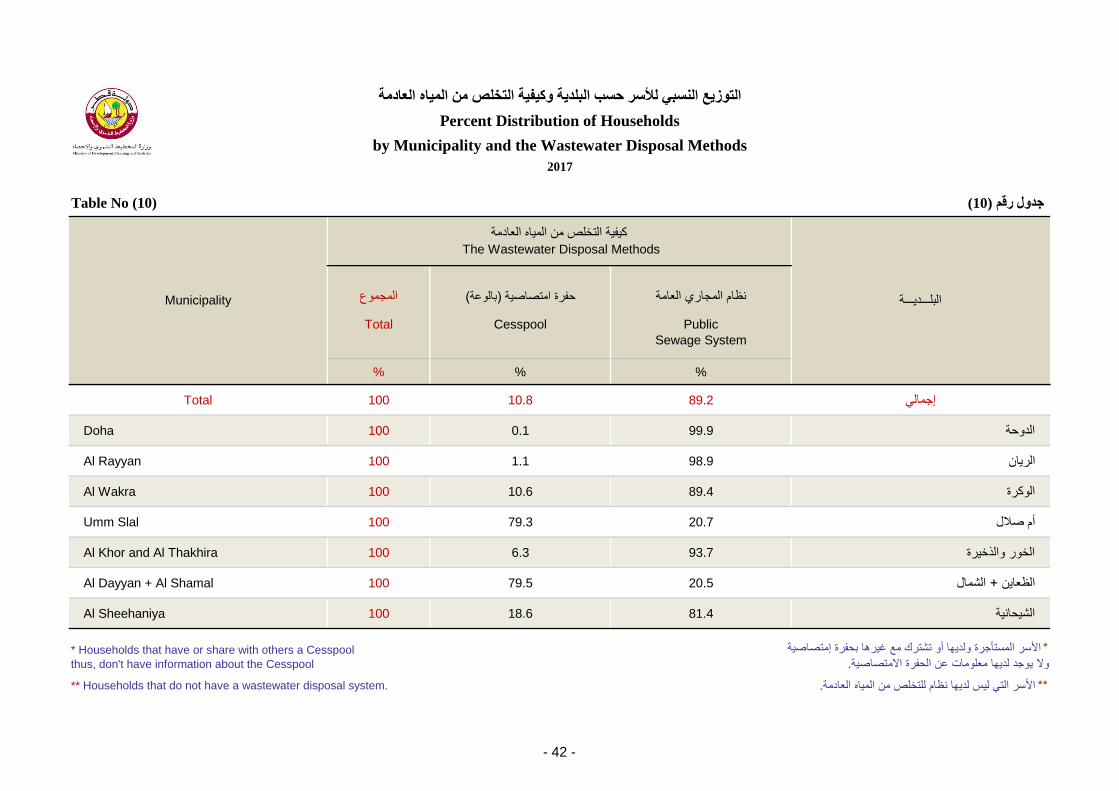
Table No (10) خذول رلى (10)
المجموع (بالوعة)حفرة امتصاصة نظام المجاري العامة
Total Cesspool Public
Sewage System
% % %
Total 100 10.8 89.2 إجمال
Doha 100 0.1 99.9 الدوحة
Al Rayyan 100 1.1 98.9 الران
Al Wakra 100 10.6 89.4 الوكرة
Umm Slal 100 79.3 20.7 أم صالل
Al Khor and Al Thakhira 100 6.3 93.7 الخور والذخرة
Al Dayyan + Al Shamal 100 79.5 20.5 الشمال+ الظعان
Al Sheehaniya 100 18.6 81.4 الشحانة
انتىزغ انسج نألسر زست انجهذخ وكفخ انتخهص ي انب انؼبديخ
Percent Distribution of Households
by Municipality and the Wastewater Disposal Methods
Municipality
كفة التخلص من الماه العادمة
البلـــدـــة
The Wastewater Disposal Methods
2017
* Households that have or share with others a Cesspool
thus, don't have information about the Cesspool
األسر المستؤجرة ولدها أو تشترك مع غرها بحفرة إمتصاصة *
.وال وجد لدها معلومات عن الحفرة االمتصاصة
** Households that do not have a wastewater disposal system. .األسر الت لس لدها نظام للتخلص من الماه العادمة **
- 42 -

Table No (11) خذول رلى (11)
المجموع 40 وأقل من 30 فؤكثر40 30 وأقل من 20 20 وأقل من 10 10أقل من
Total 40 & More 30 & less
than 40
20 & less
than 30
10 & less
than 20
Less than
10
% % % % % %
Total 100 19.2 3.3 7.5 70.0 0.0 إجمال
Doha 100 0.0 0.0 0.0 100.0 0.0 الدوحة
Al Rayyan 100 87.5 12.5 0.0 0.0 0.0 الران
Al Wakra 100 0.0 0.0 0.0 100 0.0 الوكرة
Umm Slal 100 27.9 1.8 1.8 68.5 0.0 أم صالل
Al Khor and Al Thakhira 100 100.0 0.0 0.0 0.0 0.0 الخور والذخرة
Al Dayyan + Al Shamal 100 1.1 0.0 14.6 84.3 0.0 الشمال+ الظعان
Al Sheehaniya 100 10.0 50.0 30.0 10.0 0.0 الشحانة
(ثبنتر انكؼت)انتىزغ انسج نألسر انت نذهب زفرح ايتصبصخ زست انجهذخ وزدى انسفرح االيتصبصخ
Percent Distribution of Households Having Cesspool
by Municipality and Size of Cesspool (by cubic Meter)
Municipality
(بالمتر المكعب)حجم الحفرة االمتصاصة
البلـــدـــة
Size of Cesspool (by cubic Meter)
2017
- 43 -

Table No (12) خذول رلى (12)
المجموع 8 وأقل من 6 أسابع فؤكثر8 6 وأقل من 4 4 وأقل من 2 أقل من أسبوعن
Total8 weeks
& more
6 & less
than 8
4 & less
than 6
2 & less
than 4
Less than
Two week
% % % % % %
Total 100 10.2 3.4 32.2 24.3 29.9 إجمال
Doha 100 0.0 0.0 0.0 0.0 100.0 الدوحة
Al Rayyan 100 12.5 0.0 25.0 50.0 12.5 الران
Al Wakra 100 0.0 0.0 11.1 22.2 66.7 الوكرة
Umm Slal 100 7.7 1.1 42.9 13.2 35.2 أم صالل
Al Khor and Al Thakhira 100 20.0 0.0 60.0 0.0 20.0 الخور والذخرة
Al Dayyan + Al Shamal 100 16.1 7.1 21.4 42.9 12.5 الشمال+ الظعان
Al Sheehaniya 100 0.0 14.3 0.0 14.3 71.4 الشحانة
انت يكثتهب انسفرح ثذو عر لجم آخر يرح نعسهب (ثبألسجىع)انتىزغ انسج نألسر انت نذهب زفرح ايتصبصخ زست انجهذخ وانفترح انسيخ
Percent Distribution of Households Having Cesspool
by Municipality and the Duration (by Week) That Cesspool Not Evacuated Since Last Evacuation
Municipality
الت مكثتها الحفرة بدون نضح قبل آخر مرة لنضحها (باألسبوع)الفترة الزمنة
البلـــدـــة
Duration That Cesspool Not Evacuated Since Last Evacuation
2017
- 44 -

Table No (13) خذول رلى (13)
المجموع وجد تسرب ال وجد تسربTotal There is Leakage No Leakage
% % %
Total 100 2.4 97.6 إجمال
Doha 100 2.5 97.5 الدوحة
Al Rayyan 100 1.8 98.2 الران
Al Wakra 100 0.7 99.3 الوكرة
Umm Slal 100 7.1 92.9 أم صالل
Al Khor and Al Thakhira 100 0.0 100 الخور والذخرة
Al Dayyan + Al Shamal 100 0.9 99.1 الشمال+ الظعان
Al Sheehaniya 100 6.8 93.2 الشحانة
انتىزغ انسج نألسر انتصهخ ثظبو نهتخهص ي انب انؼبديخ زست انجهذخ ووخىد تسرة نب اندبري خبرج انسل
Percent Distribution of Households Connected to Sewage System
by Municipality And The Presence of Sewage Leakage Out Side The House
Municipality
تسرب لماه المجاري خارج المنازل
البلـــدـــة
Sewage Leakage Out Side The House
2017
- 45 -
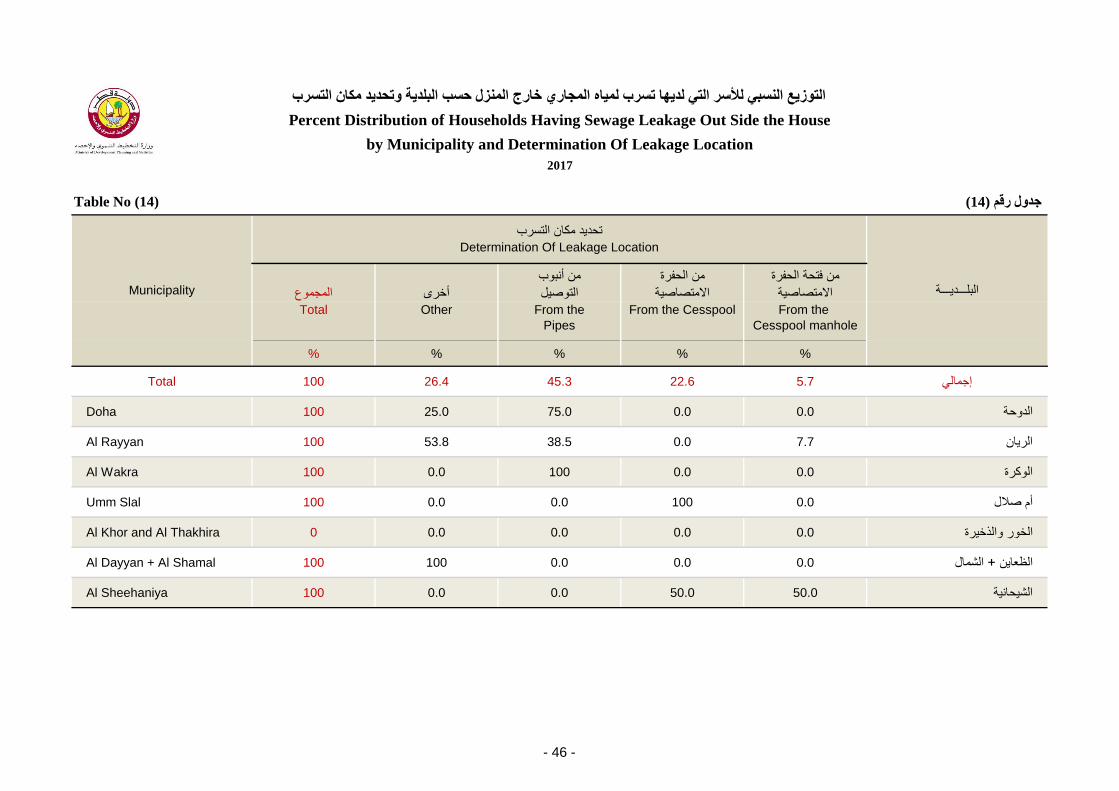
Table No (14) خذول رلى (14)
المجموع أخرى
من أنبوب
التوصل
من الحفرة
االمتصاصة
من فتحة الحفرة
االمتصاصةTotal Other From the
Pipes
From the Cesspool From the
Cesspool manhole
% % % % %
Total 100 26.4 45.3 22.6 5.7 إجمال
Doha 100 25.0 75.0 0.0 0.0 الدوحة
Al Rayyan 100 53.8 38.5 0.0 7.7 الران
Al Wakra 100 0.0 100 0.0 0.0 الوكرة
Umm Slal 100 0.0 0.0 100 0.0 أم صالل
Al Khor and Al Thakhira 0 0.0 0.0 0.0 0.0 الخور والذخرة
Al Dayyan + Al Shamal 100 100 0.0 0.0 0.0 الشمال+ الظعان
Al Sheehaniya 100 0.0 0.0 50.0 50.0 الشحانة
انتىزغ انسج نألسر انت نذهب تسرة نب اندبري خبرج انسل زست انجهذخ وتسذذ يكب انتسرة
Percent Distribution of Households Having Sewage Leakage Out Side the House
by Municipality and Determination Of Leakage Location
Municipality
تحدد مكان التسرب
البلـــدـــة
Determination Of Leakage Location
2017
- 46 -
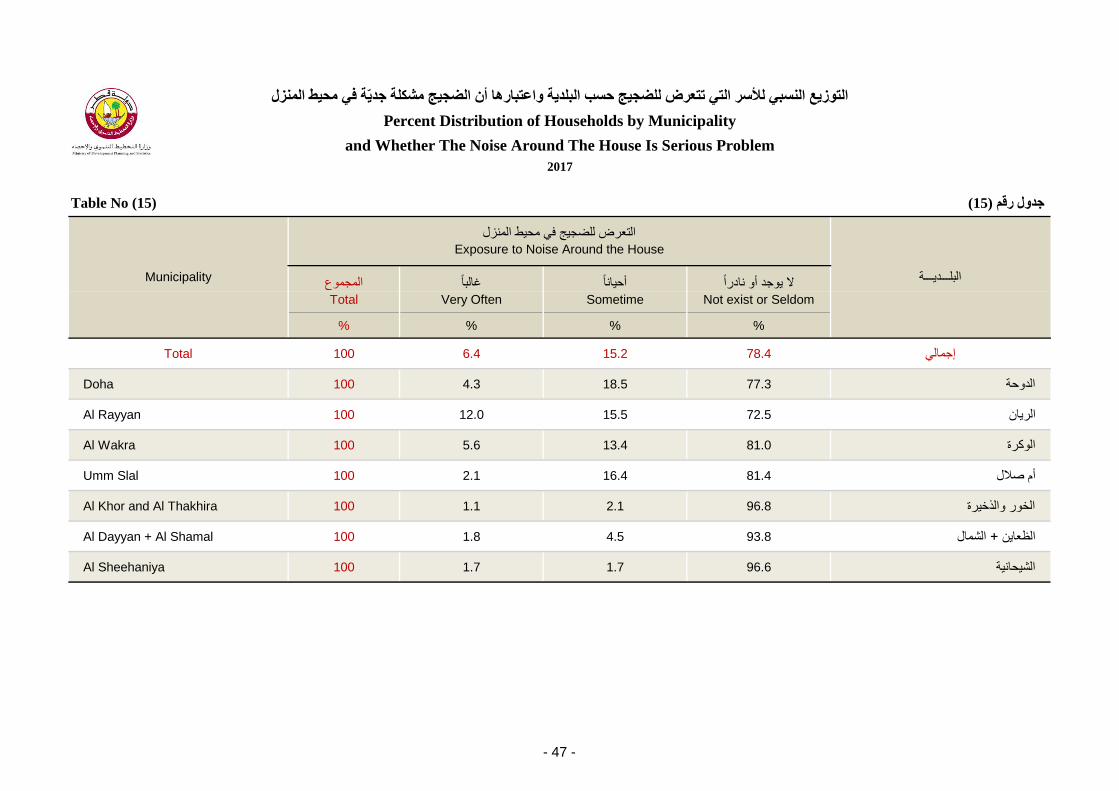
Table No (15) خذول رلى (15)
المجموع غالبا أحانا ال وجد أو نادراTotal Very Often Sometime Not exist or Seldom
% % % %
Total 100 6.4 15.2 78.4 إجمال
Doha 100 4.3 18.5 77.3 الدوحة
Al Rayyan 100 12.0 15.5 72.5 الران
Al Wakra 100 5.6 13.4 81.0 الوكرة
Umm Slal 100 2.1 16.4 81.4 أم صالل
Al Khor and Al Thakhira 100 1.1 2.1 96.8 الخور والذخرة
Al Dayyan + Al Shamal 100 1.8 4.5 93.8 الشمال+ الظعان
Al Sheehaniya 100 1.7 1.7 96.6 الشحانة
انتىزغ انسج نألسر انت تتؼرض نهعدح زست انجهذخ واػتجبرهب أ انعدح يشكهخ خذخ ف يسػ انسل
Percent Distribution of Households by Municipality
and Whether The Noise Around The House Is Serious Problem
Municipality
التعرض للضجج ف محط المنزل
البلـــدـــة
Exposure to Noise Around the House
2017
- 47 -

Table No (16) خذول رلى (16)
المجموع أخرى
أنشطة
صناعة
اقالع و هبوط
الطائرات أعمال بناء
حركة
المرور
Total OtherIndustrial
Activities
Plane takeoffs
and landings
Construction
Work
Road
Traffic
% % % % % %
Total 100 4.6 1.5 0.6 38.1 55.3 إجمال
Doha 100 4.1 0.5 0.9 33.3 61.2 الدوحة
Al Rayyan 100 3.5 1.5 0.5 46.2 48.2 الران
Al Wakra 100 11.1 7.4 0.0 33.3 48.2 الوكرة
Umm Slal 100 0.0 0.0 0.0 30.8 69.2 أم صالل
Al Khor and Al Thakhira 100 33.4 33.3 0.0 33.3 0.0 الخور والذخرة
Al Dayyan + Al Shamal 100 14.3 0.0 0.0 14.3 71.4 الشمال+ الظعان
Al Sheehaniya 100 50.0 0.0 0.0 0.0 50.0 الشحانة
انتىزغ انسج نألسر انت تتؼرض نهعدح زست انجهذخ وأهى يصذر نهعدح
Percent Distribution of Households Exposed to Noise
by Municipality and the Major Source of Noise
Municipality
أهم مصدر للضجج
البلـــدـــة
Major Source of Noise
2017
- 48 -
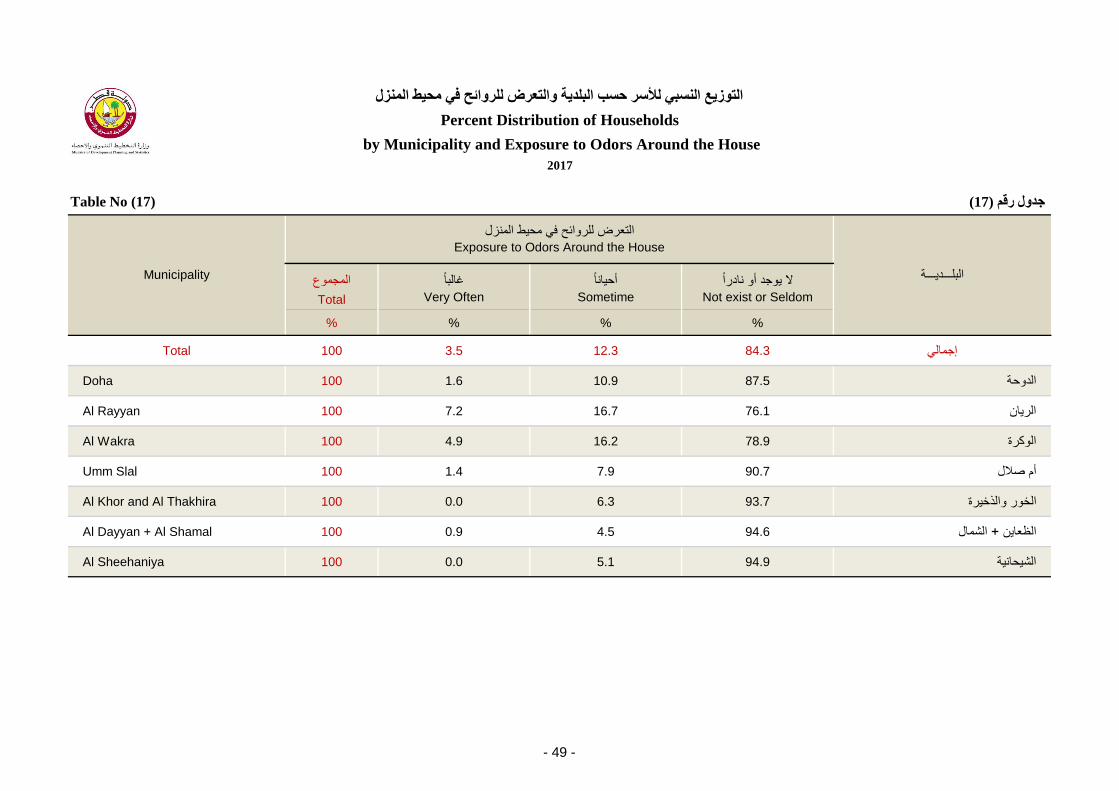
Table No (17) خذول رلى (17)
المجموع غالبا أحانا ال وجد أو نادرا
Total Very Often Sometime Not exist or Seldom
% % % %
Total 100 3.5 12.3 84.3 إجمال
Doha 100 1.6 10.9 87.5 الدوحة
Al Rayyan 100 7.2 16.7 76.1 الران
Al Wakra 100 4.9 16.2 78.9 الوكرة
Umm Slal 100 1.4 7.9 90.7 أم صالل
Al Khor and Al Thakhira 100 0.0 6.3 93.7 الخور والذخرة
Al Dayyan + Al Shamal 100 0.9 4.5 94.6 الشمال+ الظعان
Al Sheehaniya 100 0.0 5.1 94.9 الشحانة
انتىزغ انسج نألسر زست انجهذخ وانتؼرض نهروائر ف يسػ انسل
Percent Distribution of Households
by Municipality and Exposure to Odors Around the House
Municipality
التعرض للروائح ف محط المنزل
البلـــدـــة
Exposure to Odors Around the House
2017
- 49 -
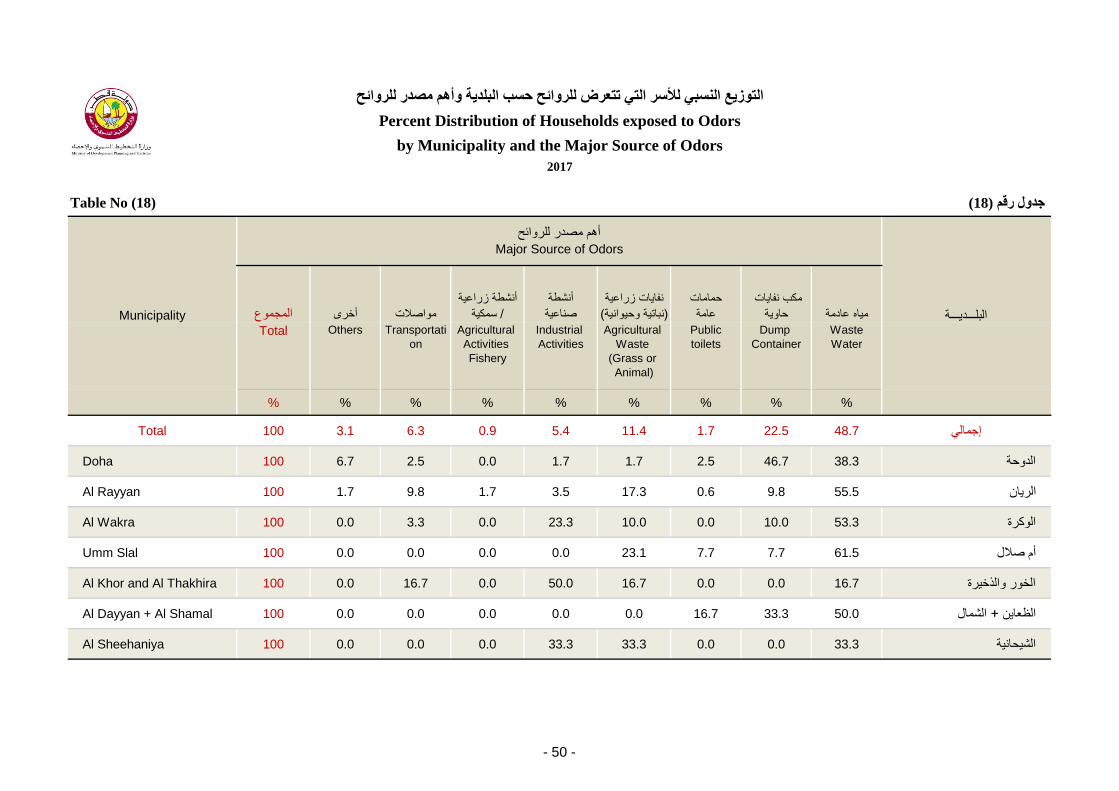
Table No (18) خذول رلى (18)
المجموع أخرى مواصالت
أنشطة زراعة
سمكة/
أنشطة
صناعة
نفاات زراعة
(نباتة وحوانة)
حمامات
عامة
مكب نفاات
حاوة ماه عادمة
Total Others Transportati
on
Agricultural
Activities
Fishery
Industrial
Activities
Agricultural
Waste
(Grass or
Animal)
Public
toilets
Dump
Container
Waste
Water
% % % % % % % % %
Total 100 3.1 6.3 0.9 5.4 11.4 1.7 22.5 48.7 إجمال
Doha 100 6.7 2.5 0.0 1.7 1.7 2.5 46.7 38.3 الدوحة
Al Rayyan 100 1.7 9.8 1.7 3.5 17.3 0.6 9.8 55.5 الران
Al Wakra 100 0.0 3.3 0.0 23.3 10.0 0.0 10.0 53.3 الوكرة
Umm Slal 100 0.0 0.0 0.0 0.0 23.1 7.7 7.7 61.5 أم صالل
Al Khor and Al Thakhira 100 0.0 16.7 0.0 50.0 16.7 0.0 0.0 16.7 الخور والذخرة
Al Dayyan + Al Shamal 100 0.0 0.0 0.0 0.0 0.0 16.7 33.3 50.0 الشمال+ الظعان
Al Sheehaniya 100 0.0 0.0 0.0 33.3 33.3 0.0 0.0 33.3 الشحانة
انتىزغ انسج نألسر انت تتؼرض نهروائر زست انجهذخ وأهى يصذر نهروائر
Percent Distribution of Households exposed to Odors
by Municipality and the Major Source of Odors
Municipality
أهم مصدر للروائح
البلـــدـــة
Major Source of Odors
2017
- 50 -

Table No (19) خذول رلى (19)
المجموع غالبا أحانا ال وجد أو نادرا
Total Very Often Sometime Not exist or Seldom
% % % %
Total 100 5.0 16.5 78.5 إجمال
Doha 100 1.5 15.4 83.2 الدوحة
Al Rayyan 100 12.0 17.1 70.9 الران
Al Wakra 100 6.3 28.9 64.8 الوكرة
Umm Slal 100 0.0 26.4 73.6 أم صالل
Al Khor and Al Thakhira 100 0.0 7.4 92.6 الخور والذخرة
Al Dayyan + Al Shamal 100 0.9 8.0 91.1 الشمال+ الظعان
Al Sheehaniya 100 0.0 5.1 94.9 الشحانة
انتىزغ انسج نألسر زست انجهذخ وانتؼرض نهغجبر
Percent Distribution of Households
by Municipality and Exposure to Dust Around The House
Municipality
التعرض للغبار
البلـــدـــة
Exposure to Dust Around The House
2017
- 51 -

Table No (20) خذول رلى (20)
المجموع أخرى أنشطة صناعة راح أعمال بناء طرق غر معبد
Total OtherIndustrial
activities WindConstruction
WorkUnpaved
Road
% % % % % %
Total 100 0.4 2.1 51.3 28.5 17.7 إجمال
Doha 100 0.6 1.2 49.4 31.5 17.3 الدوحة
Al Rayyan 100 0.5 2.8 44.6 35.6 16.6 الران
Al Wakra 100 0.0 0.0 58.0 10.0 32.0 الوكرة
Umm Slal 100 0.0 0.0 86.5 5.4 8.1 أم صالل
Al Khor and Al Thakhira 100 0.0 14.3 42.9 14.3 28.6 الخور والذخرة
Al Dayyan + Al Shamal 100 0.0 0.0 60.0 30.0 10.0 الشمال+ الظعان
Al Sheehaniya 100 0.0 33.3 66.7 0.0 0.0 الشحانة
انتىزغ انسج نألسر انت تتؼرض نهغجبر زست انجهذخ وأهى يصذر نهغجبر
Percent Distribution of Households Exposed to Dust
by Municipality and the Major Source of Dust
Municipality
أهم مصدر للغبار
البلـــدـــة
Major Source of Dust
2017
- 52 -

Table No (21) خذول رلى (21)
المجموع غالبا أحانا ال وجد أو نادرا
Total Very Often Sometime Not exist or Seldom
% % % %
Total 100 2.1 4.4 93.5 إجمال
Doha 100 0.4 3.6 96.0 الدوحة
Al Rayyan 100 5.4 7.3 87.3 الران
Al Wakra 100 1.4 4.2 94.4 الوكرة
Umm Slal 100 0.0 1.4 98.6 أم صالل
Al Khor and Al Thakhira 100 0.0 3.2 96.8 الخور والذخرة
Al Dayyan + Al Shamal 100 0.0 0.0 100 الشمال+ الظعان
Al Sheehaniya 100 1.7 0.0 98.3 الشحانة
انتىزغ انسج نألسر زست انجهذخ وانتؼرض نهذخب
Percent Distribution of Households
by Municipality and Exposure to Smoke Around The House
Municipality
التعرض للدخان
البلـــدـــة
Exposure to Smoke
2017
- 53 -

Table No (22) خذول رلى (22)
المجموع أخرى أعمال بناء مواصالت حرق النفاات أنشطة صناعة
Total OtherConstruction
Work TransportationWaste
Burning
Industrial activities
% % % % % %
Total 100 6.2 10.3 43.5 26.2 13.8 إجمال
Doha 100 20.5 15.4 20.5 41.0 2.6 الدوحة
Al Rayyan 100 0.0 8.7 59.8 20.7 10.9 الران
Al Wakra 100 0.0 12.5 0.0 12.5 75.0 الوكرة
Umm Slal 100 0.0 0.0 0.0 100 0.0 أم صالل
Al Khor and Al Thakhira 100 33.3 0.0 0.0 0.0 66.7 الخور والذخرة
Al Dayyan + Al Shamal 0 0.0 0.0 0.0 0.0 0.0 الشمال+ الظعان
Al Sheehaniya 100 0.0 0.0 0.0 0.0 100 الشحانة
انتىزغ انسج نألسر انت تتؼرض نهذخب زست انجهذخ وأهى يصذر نهذخب
Percent Distribution of Households Exposed to Smoke
by Municipality and the Major Source of Smoke
Municipality
أهم مصدر للدخان
البلـــدـــة
Major Source of Smoke
2017
- 54 -

Table No (23) خذول رلى (23)
المجموع ال تستخدم فؤكثر (ج.ك) 3 3 وأقل من 2 2 وأقل من 1 1أقل من
Total Not using3 (Kg)
& More
2 & less
than 3
1 & less
than 2
Less than
1
% % % % % %
Total 100 2.4 7.7 13.4 40.4 36.1 إجمال
Doha 100 4.4 4.6 10.3 36.2 44.6 الدوحة
Al Rayyan 100 1.2 13.4 20.7 39.5 25.1 الران
Al Wakra 100 0.0 7.0 14.1 46.5 32.4 الوكرة
Umm Slal 100 0.0 4.3 14.3 67.1 14.3 أم صالل
Al Khor and Al Thakhira 100 1.1 2.1 1.1 28.4 67.4 الخور والذخرة
Al Dayyan + Al Shamal 100 0.9 2.7 8.9 57.1 30.4 الشمال+ الظعان
Al Sheehaniya 100 1.7 15.3 0.0 28.8 54.2 الشحانة
خالل أسجىع (يسسىق انغسم)ي انظفبد انكبوخ (ثبنكهىخراو)انتىزغ انسج نألسر زست انجهذخ وانكخ انستخذيخ
Percent Distribution of Households
by Municipality and Quantity (by Kg) of Chemical Detergent (Washing Powder) Used During a Week
Municipality
(بالكلوجرام)الكمة المستخدمة خالل أسبوع
البلـــدـــة
Quantity Used During a Week (by Kg)
2017
- 55 -
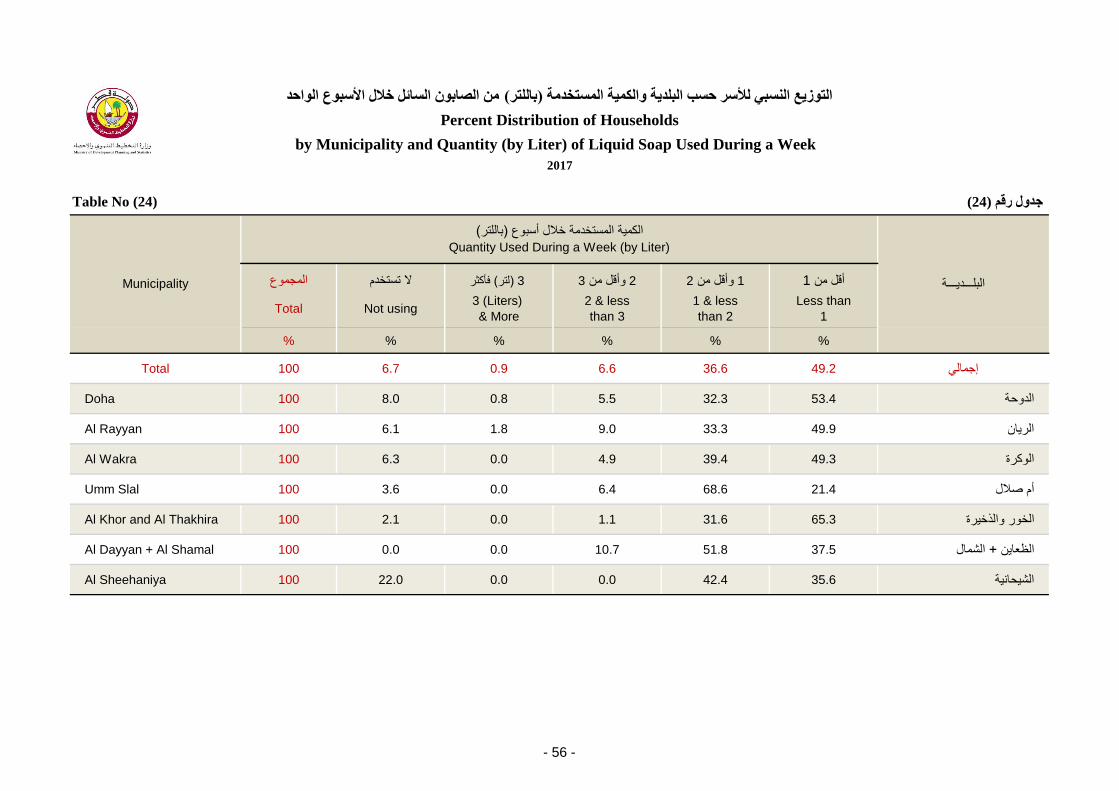
Table No (24) خذول رلى (24)
المجموع ال تستخدم فؤكثر (لتر) 3 3 وأقل من 2 2 وأقل من 1 1أقل من
Total Not using3 (Liters)
& More
2 & less
than 3
1 & less
than 2
Less than
1
% % % % % %
Total 100 6.7 0.9 6.6 36.6 49.2 إجمال
Doha 100 8.0 0.8 5.5 32.3 53.4 الدوحة
Al Rayyan 100 6.1 1.8 9.0 33.3 49.9 الران
Al Wakra 100 6.3 0.0 4.9 39.4 49.3 الوكرة
Umm Slal 100 3.6 0.0 6.4 68.6 21.4 أم صالل
Al Khor and Al Thakhira 100 2.1 0.0 1.1 31.6 65.3 الخور والذخرة
Al Dayyan + Al Shamal 100 0.0 0.0 10.7 51.8 37.5 الشمال+ الظعان
Al Sheehaniya 100 22.0 0.0 0.0 42.4 35.6 الشحانة
ي انصبثى انسبئم خالل األسجىع انىازذ (ثبنهتر)انتىزغ انسج نألسر زست انجهذخ وانكخ انستخذيخ
Percent Distribution of Households
by Municipality and Quantity (by Liter) of Liquid Soap Used During a Week
Municipality
(باللتر)الكمة المستخدمة خالل أسبوع
البلـــدـــة
Quantity Used During a Week (by Liter)
2017
- 56 -

Table No (25) خذول رلى (25)
المجموع ال تستخدم فؤكثر (لتر) 3 3 وأقل من 2 2 وأقل من 1 1أقل من
Total Not using3 (Liters)
& More
2 & less
than 3
1 & less
than 2
Less than
1
% % % % % %
Total 100 33.9 0.4 2.4 17.2 46.0 إجمال
Doha 100 38.3 0.3 2.6 12.8 46.0 الدوحة
Al Rayyan 100 33.8 0.6 2.8 21.3 41.6 الران
Al Wakra 100 47.9 0.7 0.7 9.2 41.6 الوكرة
Umm Slal 100 5.7 0.0 2.1 32.1 60.0 أم صالل
Al Khor and Al Thakhira 100 20.0 0.0 0.0 13.7 66.3 الخور والذخرة
Al Dayyan + Al Shamal 100 32.1 0.9 4.5 17.0 45.5 الشمال+ الظعان
Al Sheehaniya 100 22.0 0.0 0.0 30.5 47.5 الشحانة
خالل األسجىع انىازذ (يجط)ي انظفبد انكبوخ (ثبنهتر)انتىزغ انسج نألسر زست انجهذخ وانكخ انستخذيخ
Percent Distribution of Households
by Municipality and Quantity (by Liter) of Chemical Detergent (Clorox) Used During a Week
Municipality
(باللتر)الكمة المستخدمة خالل أسبوع
البلـــدـــة
Quantity Used During a Week (by Liter)
2017
- 57 -

Table No (26) خذول رلى (26)
المجموع ال تستخدم فؤكثر (لتر) 3 3 وأقل من 2 2 وأقل من 1 1أقل من
Total Not using3 (Liters)
& More
2 & less
than 3
1 & less
than 2
Less than
1
% % % % % %
Total 100 24.8 1.4 5.8 24.0 44.0 إجمال
Doha 100 25.2 2.3 5.7 16.8 50.0 الدوحة
Al Rayyan 100 26.4 0.6 5.3 23.9 43.9 الران
Al Wakra 100 17.6 2.1 16.9 19.7 43.7 الوكرة
Umm Slal 100 40.7 0.0 1.4 45.0 12.9 أم صالل
Al Khor and Al Thakhira 100 20.0 0.0 1.1 43.2 35.8 الخور والذخرة
Al Dayyan + Al Shamal 100 3.6 1.8 8.9 45.5 40.2 الشمال+ الظعان
Al Sheehaniya 100 25.4 0.0 0.0 30.5 44.1 الشحانة
ي انطهراد انصبػخ خالل األسجىع انىازذ (ثبنهتر)انتىزغ انسج نألسر زست انجهذخ وانكخ انستخذيخ
Percent Distribution of Households
by Municipality and Quantity (by Liter) of Industrial Disinfectant Used During a Week
Municipality
(باللتر)الكمة المستخدمة خالل أسبوع
البلـــدـــة
Quantity Used During a Week (by Liter)
2017
- 58 -
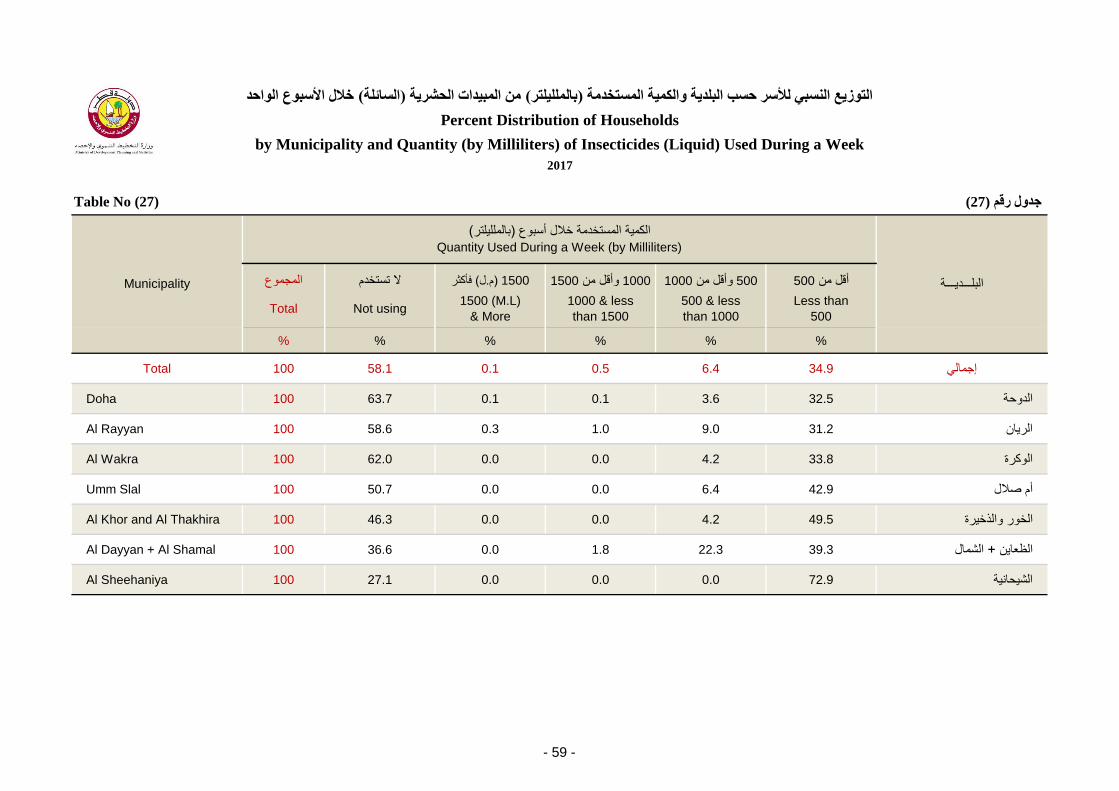
Table No (27) خذول رلى (27)
المجموع ال تستخدم فؤكثر (ل.م) 1500 1500 وأقل من 1000 1000 وأقل من 500 500أقل من
Total Not using1500 (M.L)
& More
1000 & less
than 1500
500 & less
than 1000
Less than
500
% % % % % %
Total 100 58.1 0.1 0.5 6.4 34.9 إجمال
Doha 100 63.7 0.1 0.1 3.6 32.5 الدوحة
Al Rayyan 100 58.6 0.3 1.0 9.0 31.2 الران
Al Wakra 100 62.0 0.0 0.0 4.2 33.8 الوكرة
Umm Slal 100 50.7 0.0 0.0 6.4 42.9 أم صالل
Al Khor and Al Thakhira 100 46.3 0.0 0.0 4.2 49.5 الخور والذخرة
Al Dayyan + Al Shamal 100 36.6 0.0 1.8 22.3 39.3 الشمال+ الظعان
Al Sheehaniya 100 27.1 0.0 0.0 0.0 72.9 الشحانة
خالل األسجىع انىازذ (انسبئهخ)ي انجذاد انسشرخ (ثبنهههتر)انتىزغ انسج نألسر زست انجهذخ وانكخ انستخذيخ
Percent Distribution of Households
by Municipality and Quantity (by Milliliters) of Insecticides (Liquid) Used During a Week
Municipality
(بالملللتر)الكمة المستخدمة خالل أسبوع
البلـــدـــة
Quantity Used During a Week (by Milliliters)
2017
- 59 -
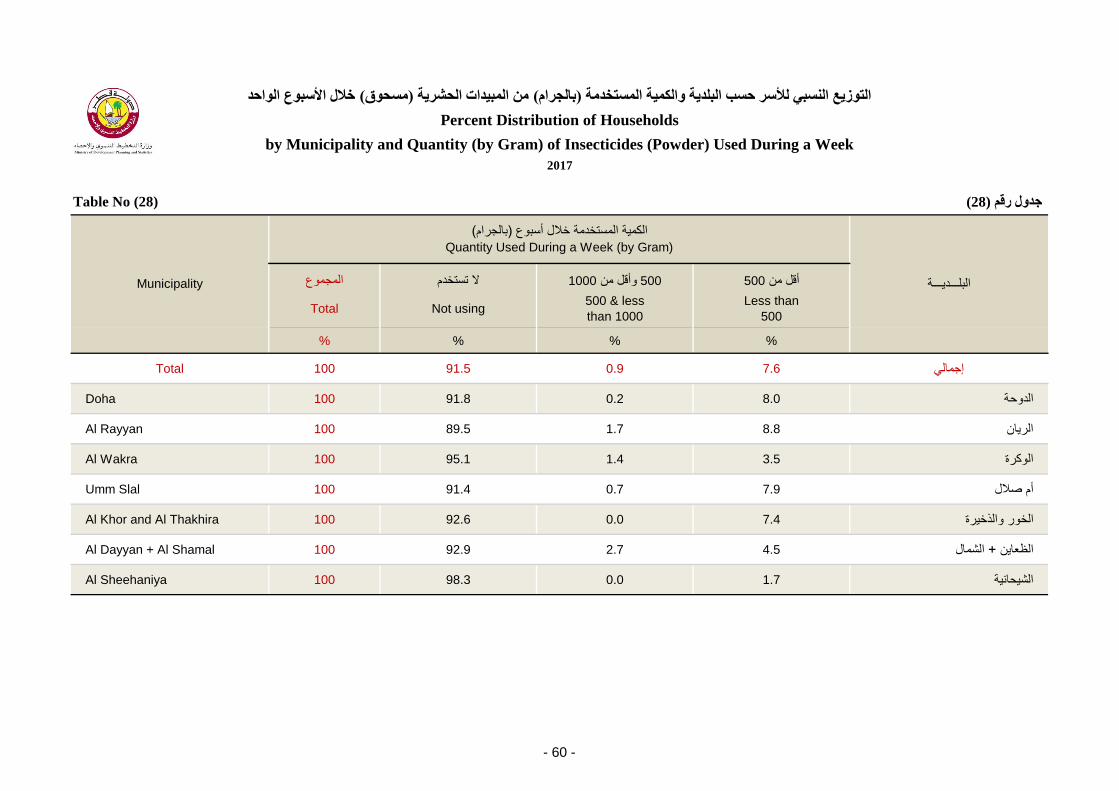
Table No (28) خذول رلى (28)
المجموع ال تستخدم 1000 وأقل من 500 500أقل من
Total Not using500 & less
than 1000
Less than
500
% % % %
Total 100 91.5 0.9 7.6 إجمال
Doha 100 91.8 0.2 8.0 الدوحة
Al Rayyan 100 89.5 1.7 8.8 الران
Al Wakra 100 95.1 1.4 3.5 الوكرة
Umm Slal 100 91.4 0.7 7.9 أم صالل
Al Khor and Al Thakhira 100 92.6 0.0 7.4 الخور والذخرة
Al Dayyan + Al Shamal 100 92.9 2.7 4.5 الشمال+ الظعان
Al Sheehaniya 100 98.3 0.0 1.7 الشحانة
خالل األسجىع انىازذ (يسسىق)ي انجذاد انسشرخ (ثبندراو)انتىزغ انسج نألسر زست انجهذخ وانكخ انستخذيخ
Percent Distribution of Households
by Municipality and Quantity (by Gram) of Insecticides (Powder) Used During a Week
Municipality
(بالجرام)الكمة المستخدمة خالل أسبوع
البلـــدـــة
Quantity Used During a Week (by Gram)
2017
- 60 -
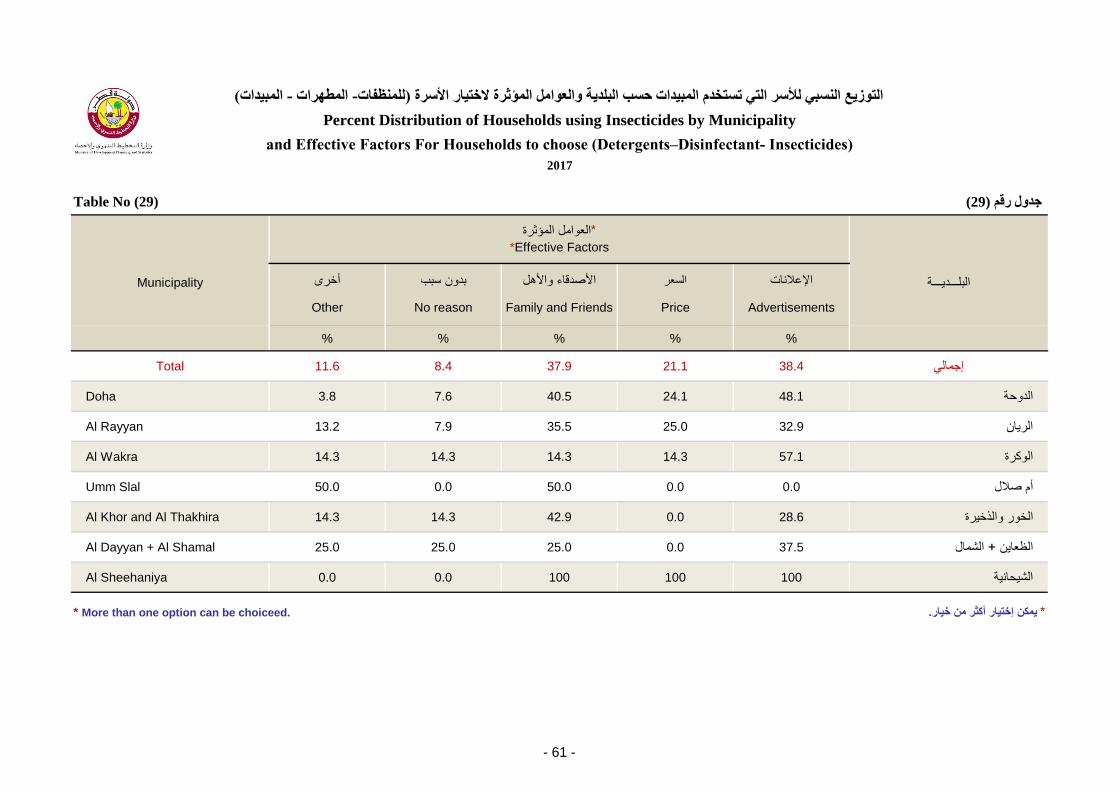
Table No (29) خذول رلى (29)
أخرى بدون سبب األصدقاء واألهل السعر اإلعالنات
Other No reason Family and Friends Price Advertisements
% % % % %
Total 11.6 8.4 37.9 21.1 38.4 إجمال
Doha 3.8 7.6 40.5 24.1 48.1 الدوحة
Al Rayyan 13.2 7.9 35.5 25.0 32.9 الران
Al Wakra 14.3 14.3 14.3 14.3 57.1 الوكرة
Umm Slal 50.0 0.0 50.0 0.0 0.0 أم صالل
Al Khor and Al Thakhira 14.3 14.3 42.9 0.0 28.6 الخور والذخرة
Al Dayyan + Al Shamal 25.0 25.0 25.0 0.0 37.5 الشمال+ الظعان
Al Sheehaniya 0.0 0.0 100 100 100 الشحانة
.مكن إختار أكثر من خار *
2017
*Effective Factors
العوامل المإثرة*
* More than one option can be choiceed.
(انجذاد- انطهراد - نهظفبد)انتىزغ انسج نألسر انت تستخذو انجذاد زست انجهذخ وانؼىايم انؤثرح الختبر األسرح
Percent Distribution of Households using Insecticides by Municipality
and Effective Factors For Households to choose )Detergents–Disinfectant- Insecticides(
Municipality البلـــدـــة
- 61 -
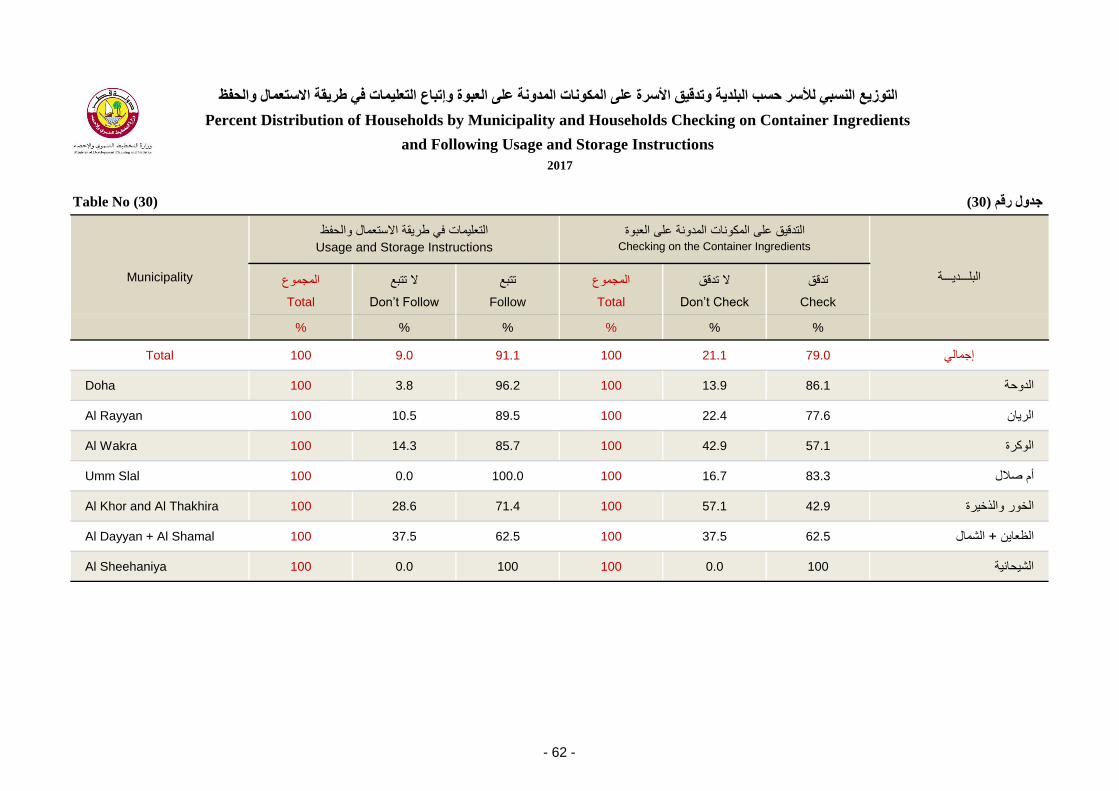
Table No (30) خذول رلى (30)
المجموع ال تتبع تتبع المجموع ال تدقق تدقق
Total Don’t Follow Follow Total Don’t Check Check
% % % % % %
Total 100 9.0 91.1 100 21.1 79.0 إجمال
Doha 100 3.8 96.2 100 13.9 86.1 الدوحة
Al Rayyan 100 10.5 89.5 100 22.4 77.6 الران
Al Wakra 100 14.3 85.7 100 42.9 57.1 الوكرة
Umm Slal 100 0.0 100.0 100 16.7 83.3 أم صالل
Al Khor and Al Thakhira 100 28.6 71.4 100 57.1 42.9 الخور والذخرة
Al Dayyan + Al Shamal 100 37.5 62.5 100 37.5 62.5 الشمال+ الظعان
Al Sheehaniya 100 0.0 100 100 0.0 100 الشحانة
2017
Usage and Storage Instructions
انتىزغ انسج نألسر زست انجهذخ وتذلك األسرح ػهى انكىبد انذوخ ػهى انؼجىح وإتجبع انتؼهبد ف غرمخ االستؼبل وانسفظ
Percent Distribution of Households by Municipality and Households Checking on Container Ingredients
and Following Usage and Storage Instructions
Municipality
التدقق على المكونات المدونة على العبوة
البلـــدـــة
Checking on the Container Ingredients
التعلمات ف طرقة االستعمال والحفظ
- 62 -

Table No (31) خذول رلى (31)
المجموع مكف شباك مكف اسبلت مكف مركزي
Total Window A/C Split Unit Central A/C
% % % %
Total 100 29.7 69.6 0.7 إجمال
Doha 100 27.0 71.6 1.4 الدوحة
Al Rayyan 100 34.7 64.8 0.6 الران
Al Wakra 100 20.7 79.2 0.2 الوكرة
Umm Slal 100 22.6 77.3 0.1 أم صالل
Al Khor and Al Thakhira 100 37.7 62.4 0.0 الخور والذخرة
Al Dayyan + Al Shamal 100 27.1 72.8 0.2 الشمال+ الظعان
Al Sheehaniya 100 33.3 66.6 0.2 الشحانة
انتىزغ انسج نألسر زست انجهذخ وىع انكفبد ف يسل األسرح
Percent Distribution of Households
by Municipality and Type of air conditioners in the Household house
Municipality
نوع المكفات
البلـــدـــة
Type of air conditioners
2017
- 63 -
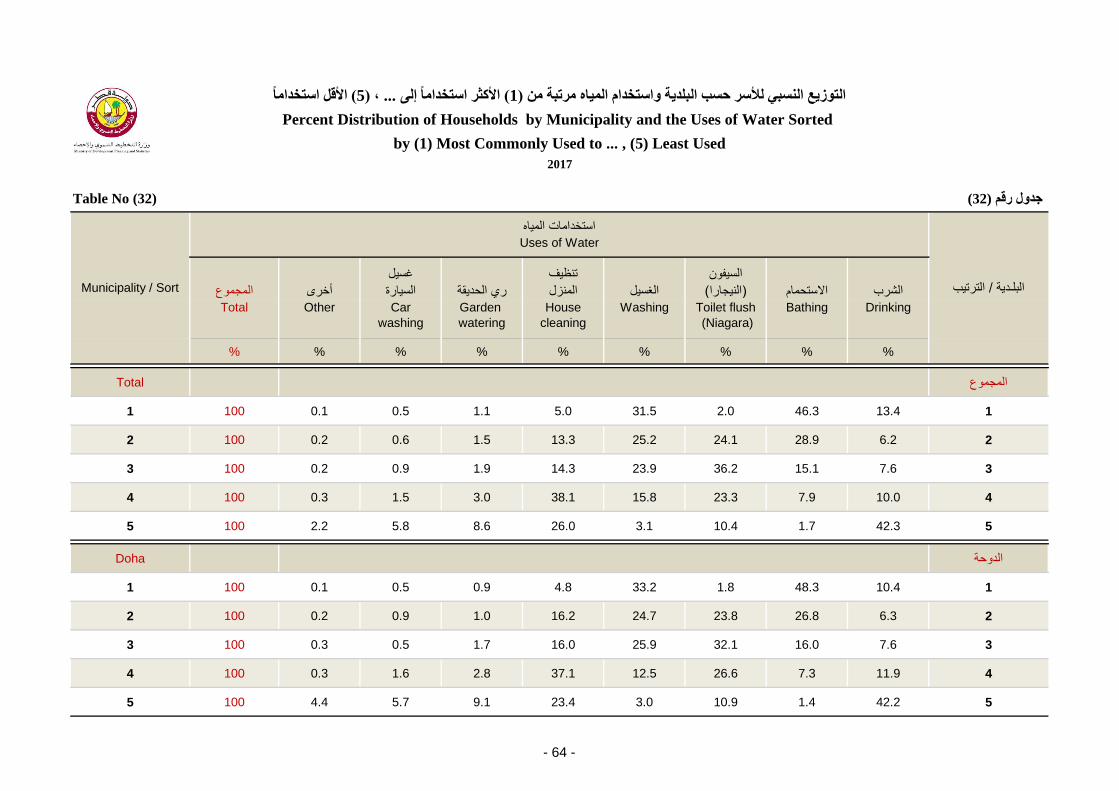
Table No (32) خذول رلى (32)
المجموع أخرى
غسل
السارة ري الحدقة
تنظف
المنزل الغسل
السفون
(النجارا) االستحمام الشرب
Total Other Car
washing
Garden
watering
House
cleaning
Washing Toilet flush
(Niagara)
Bathing Drinking
% % % % % % % % %
Total المجموع
1 100 0.1 0.5 1.1 5.0 31.5 2.0 46.3 13.4 1
2 100 0.2 0.6 1.5 13.3 25.2 24.1 28.9 6.2 2
3 100 0.2 0.9 1.9 14.3 23.9 36.2 15.1 7.6 3
4 100 0.3 1.5 3.0 38.1 15.8 23.3 7.9 10.0 4
5 100 2.2 5.8 8.6 26.0 3.1 10.4 1.7 42.3 5
Doha الدوحة
1 100 0.1 0.5 0.9 4.8 33.2 1.8 48.3 10.4 1
2 100 0.2 0.9 1.0 16.2 24.7 23.8 26.8 6.3 2
3 100 0.3 0.5 1.7 16.0 25.9 32.1 16.0 7.6 3
4 100 0.3 1.6 2.8 37.1 12.5 26.6 7.3 11.9 4
5 100 4.4 5.7 9.1 23.4 3.0 10.9 1.4 42.2 5
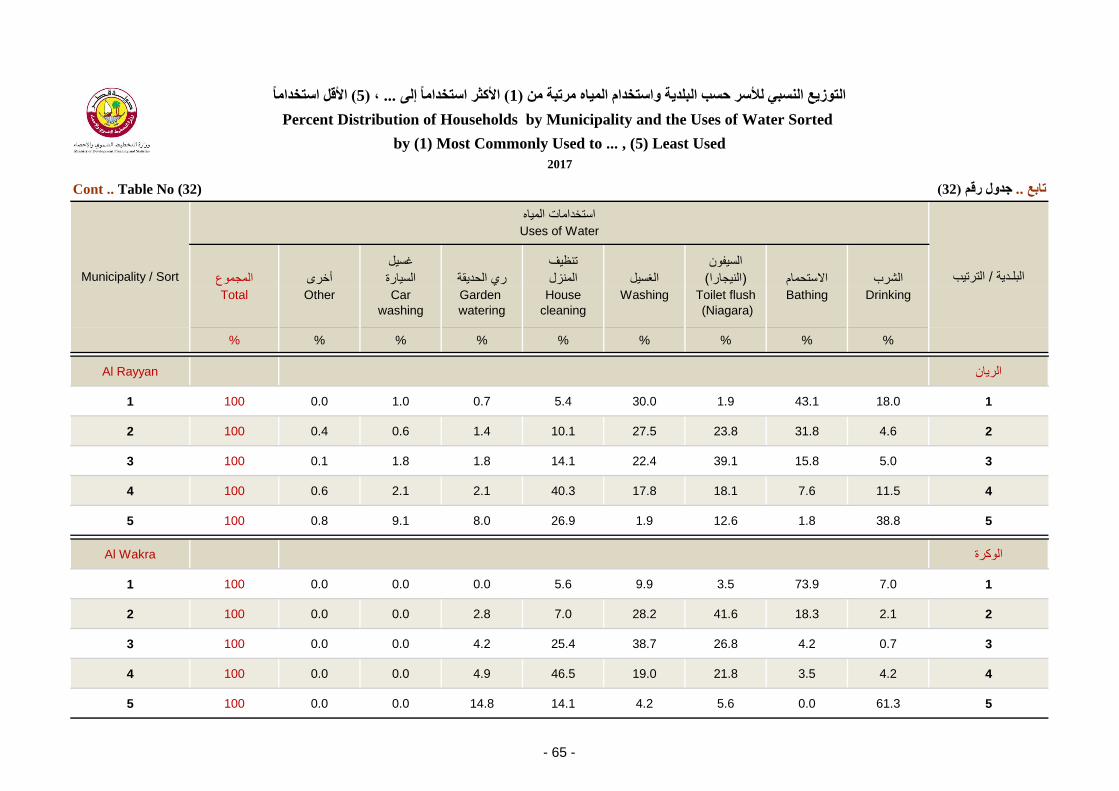
األلم استخذايب (5)، ... األكثر استخذايب إنى (1)انتىزغ انسج نألسر زست انجهذخ واستخذاو انب يرتجخ ي
Percent Distribution of Households by Municipality and the Uses of Water Sorted
by (1) Most Commonly Used to ... , (5) Least Used
Municipality / Sort
استخدامات الماه
الترتب/ البلـدة
Uses of Water
2017
- 64 -
المجموع أخرى
غسل
السارة ري الحدقة
تنظف
المنزل الغسل
السفون
(النجارا) االستحمام الشرب
Total Other Car
washing
Garden
watering
House
cleaning
Washing Toilet flush
(Niagara)
Bathing Drinking
% % % % % % % % %
Al Rayyan الران
1 100 0.0 1.0 0.7 5.4 30.0 1.9 43.1 18.0 1
2 100 0.4 0.6 1.4 10.1 27.5 23.8 31.8 4.6 2
3 100 0.1 1.8 1.8 14.1 22.4 39.1 15.8 5.0 3
4 100 0.6 2.1 2.1 40.3 17.8 18.1 7.6 11.5 4
5 100 0.8 9.1 8.0 26.9 1.9 12.6 1.8 38.8 5
Al Wakra الوكرة
1 100 0.0 0.0 0.0 5.6 9.9 3.5 73.9 7.0 1
2 100 0.0 0.0 2.8 7.0 28.2 41.6 18.3 2.1 2
3 100 0.0 0.0 4.2 25.4 38.7 26.8 4.2 0.7 3
4 100 0.0 0.0 4.9 46.5 19.0 21.8 3.5 4.2 4
5 100 0.0 0.0 14.8 14.1 4.2 5.6 0.0 61.3 5
األلم استخذايب (5)، ... األكثر استخذايب إنى (1)انتىزغ انسج نألسر زست انجهذخ واستخذاو انب يرتجخ ي
Percent Distribution of Households by Municipality and the Uses of Water Sorted
by (1) Most Commonly Used to ... , (5) Least Used
Cont .. Table No (32) (32)خذول رلى ..تبثغ
2017
Municipality / Sort
استخدامات الماه
الترتب/ البلـدة
Uses of Water
- 65 -

المجموع أخرى
غسل
السارة ري الحدقة
تنظف
المنزل الغسل
السفون
(النجارا) االستحمام الشرب
Total Other Car
washing
Garden
watering
House
cleaning
Washing Toilet flush
(Niagara)
Bathing Drinking
% % % % % % % % %
Umm Slal أم صالل
1 100 0.7 0.0 5.7 7.1 55.0 0.7 28.6 2.1 1
2 100 0.0 0.0 3.6 2.1 26.4 9.3 38.6 20.0 2
3 100 0.0 0.0 1.4 2.1 9.3 38.6 20.7 27.9 3
4 100 0.0 1.4 3.6 34.3 7.1 37.1 8.6 7.9 4
5 100 0.0 0.7 2.1 50.7 2.1 13.6 3.6 27.1 5
الخور والذخرة
1 100 0.0 0.0 0.0 1.1 13.7 2.1 83.2 0.0 1
2 100 0.0 0.0 4.2 9.5 29.5 41.1 10.5 5.3 2
3 100 0.0 0.0 4.2 10.5 29.5 35.8 4.2 15.8 3
4 100 0.0 1.1 9.5 39.0 27.4 15.8 2.1 5.3 4
5 100 0.0 0.0 2.1 24.2 0.0 2.1 0.0 71.6 5
األلم استخذايب (5)، ... األكثر استخذايب إنى (1)انتىزغ انسج نألسر زست انجهذخ واستخذاو انب يرتجخ ي
Percent Distribution of Households by Municipality and the Uses of Water Sorted
by (1) Most Commonly Used to ... , (5) Least Used
Cont .. Table No (32)
Municipality / Sort
استخدامات الماه
الترتب/ البلـدة
Uses of Water
(32)خذول رلى ..تبثغ
2017
Al Khor and Al Thakhira
- 66 -
المجموع أخرى
غسل
السارة ري الحدقة
تنظف
المنزل الغسل
السفون
(النجارا) االستحمام الشرب
Total Other Car
washing
Garden
watering
House
cleaning
Washing Toilet flush
(Niagara)
Bathing Drinking
% % % % % % % % %
الشمال+ الظعان
1 100 0.0 0.0 1.8 7.1 54.5 4.5 28.6 3.6 1
2 100 0.0 0.9 0.0 39.3 18.8 18.8 16.1 6.3 2
3 100 0.0 1.8 1.8 8.9 21.4 40.2 23.2 2.7 3
4 100 0.0 0.9 2.7 33.9 2.7 29.5 26.8 3.6 4
5 100 0.0 7.1 14.3 8.0 2.7 4.5 5.4 58.0 5
Al Sheehaniya الشحانة
1 100 0.0 0.0 1.7 0.0 3.4 1.7 3.4 89.8 1
2 100 0.0 0.0 0.0 3.4 1.7 10.2 83.1 1.7 2
3 100 0.0 0.0 0.0 6.8 6.8 76.3 6.8 3.4 3
4 100 0.0 0.0 3.4 23.7 64.4 5.1 3.4 0.0 4
5 100 0.0 0.0 5.1 62.7 23.7 5.1 1.7 1.7 5
Municipality / Sort
استخدامات الماه
الترتب/ البلـدة
Uses of Water
Al Dayyan + Al Shamal
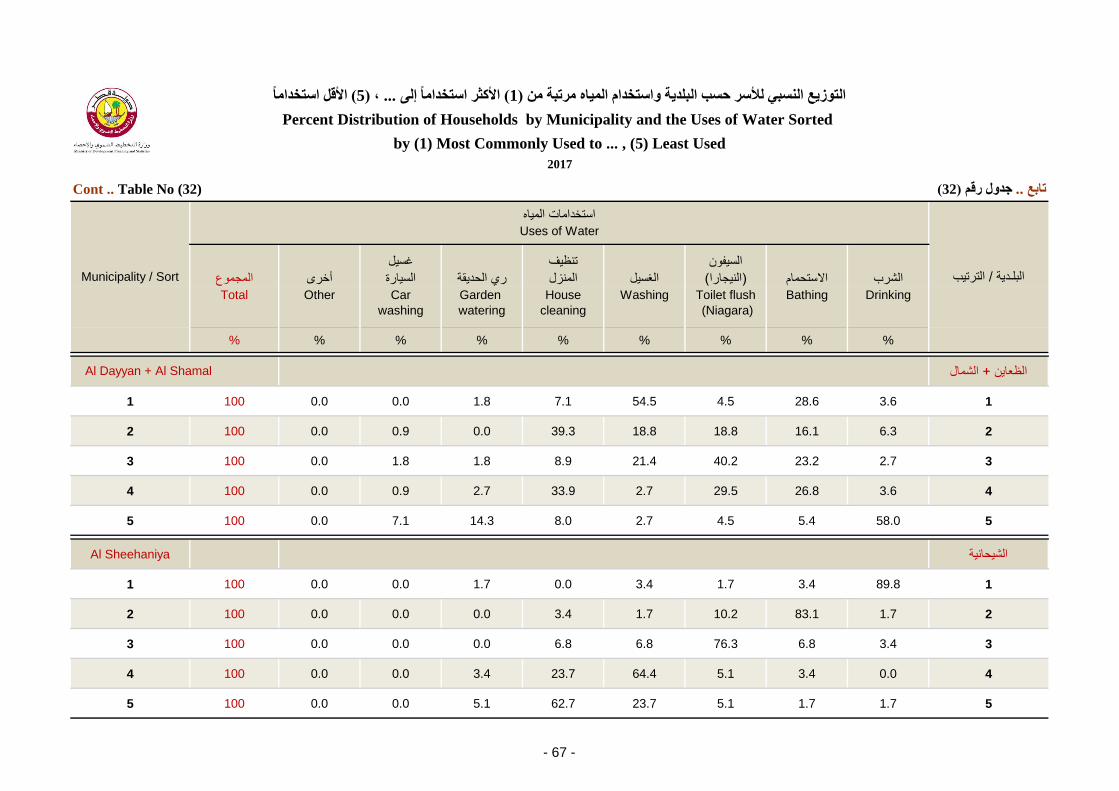
األلم استخذايب (5)، ... األكثر استخذايب إنى (1)انتىزغ انسج نألسر زست انجهذخ واستخذاو انب يرتجخ ي
Percent Distribution of Households by Municipality and the Uses of Water Sorted
by (1) Most Commonly Used to ... , (5) Least Used
Cont .. Table No (32) (32)خذول رلى ..تبثغ
2017
- 67 -
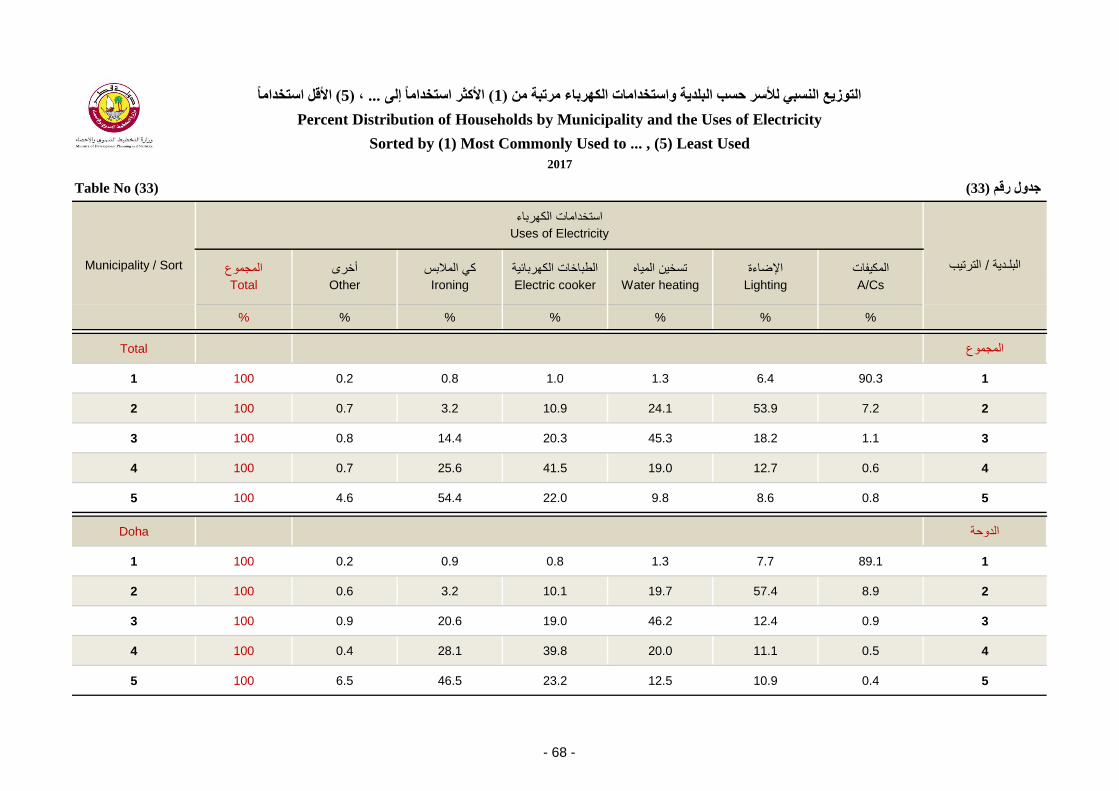
Table No (33) خذول رلى (33)
المجموع أخرى ك المالبس الطباخات الكهربائة تسخن الماه اإلضاءة المكفات
Total Other Ironing Electric cooker Water heating Lighting A/Cs
% % % % % % %
Total المجموع
1 100 0.2 0.8 1.0 1.3 6.4 90.3 1
2 100 0.7 3.2 10.9 24.1 53.9 7.2 2
3 100 0.8 14.4 20.3 45.3 18.2 1.1 3
4 100 0.7 25.6 41.5 19.0 12.7 0.6 4
5 100 4.6 54.4 22.0 9.8 8.6 0.8 5
Doha الدوحة
1 100 0.2 0.9 0.8 1.3 7.7 89.1 1
2 100 0.6 3.2 10.1 19.7 57.4 8.9 2
3 100 0.9 20.6 19.0 46.2 12.4 0.9 3
4 100 0.4 28.1 39.8 20.0 11.1 0.5 4
5 100 6.5 46.5 23.2 12.5 10.9 0.4 5
األلم استخذايب (5)، ... األكثر استخذايب إنى (1)انتىزغ انسج نألسر زست انجهذخ واستخذايبد انكهرثبء يرتجخ ي
Percent Distribution of Households by Municipality and the Uses of Electricity
Sorted by (1) Most Commonly Used to ... , (5) Least Used
Municipality / Sort
استخدامات الكهرباء
الترتب/ البلـدة
Uses of Electricity
2017
- 68 -
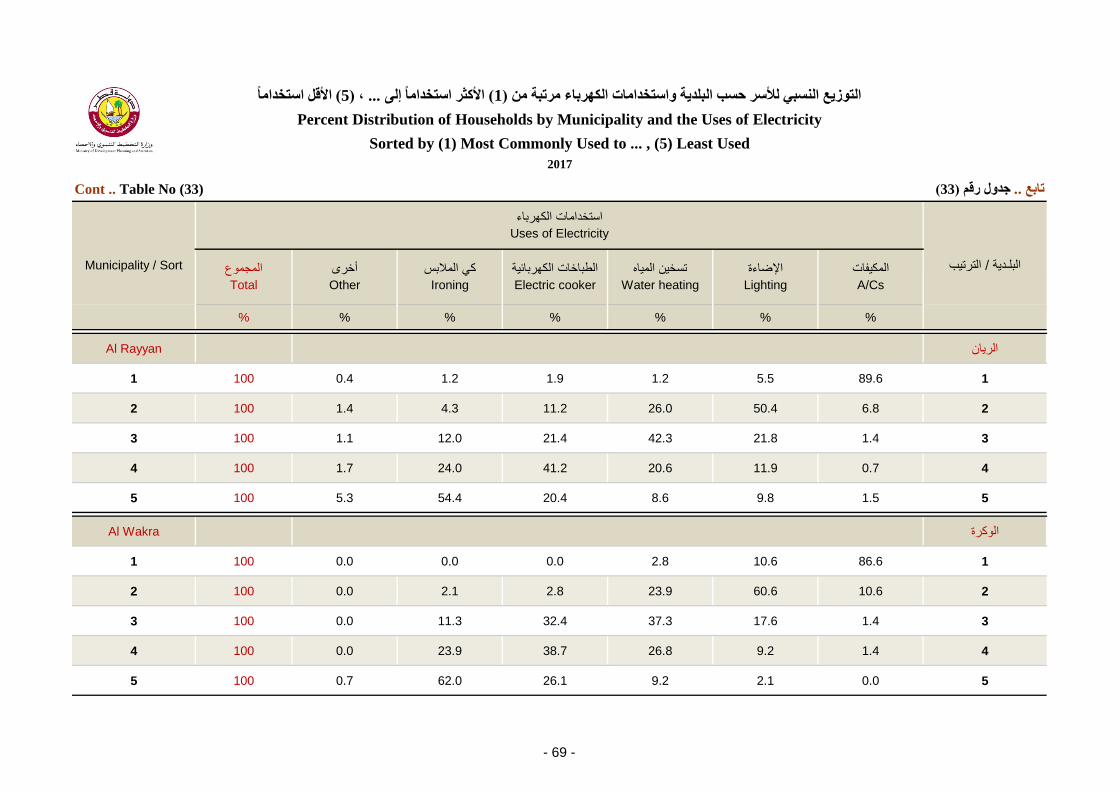
المجموع أخرى ك المالبس الطباخات الكهربائة تسخن الماه اإلضاءة المكفات
Total Other Ironing Electric cooker Water heating Lighting A/Cs
% % % % % % %
Al Rayyan الران
1 100 0.4 1.2 1.9 1.2 5.5 89.6 1
2 100 1.4 4.3 11.2 26.0 50.4 6.8 2
3 100 1.1 12.0 21.4 42.3 21.8 1.4 3
4 100 1.7 24.0 41.2 20.6 11.9 0.7 4
5 100 5.3 54.4 20.4 8.6 9.8 1.5 5
Al Wakra الوكرة
1 100 0.0 0.0 0.0 2.8 10.6 86.6 1
2 100 0.0 2.1 2.8 23.9 60.6 10.6 2
3 100 0.0 11.3 32.4 37.3 17.6 1.4 3
4 100 0.0 23.9 38.7 26.8 9.2 1.4 4
5 100 0.7 62.0 26.1 9.2 2.1 0.0 5
األلم استخذايب (5)، ... األكثر استخذايب إنى (1)انتىزغ انسج نألسر زست انجهذخ واستخذايبد انكهرثبء يرتجخ ي
Percent Distribution of Households by Municipality and the Uses of Electricity
Sorted by (1) Most Commonly Used to ... , (5) Least Used
Cont .. Table No (33) (33)خذول رلى ..تبثغ
2017
Municipality / Sort
استخدامات الكهرباء
الترتب/ البلـدة
Uses of Electricity
- 69 -
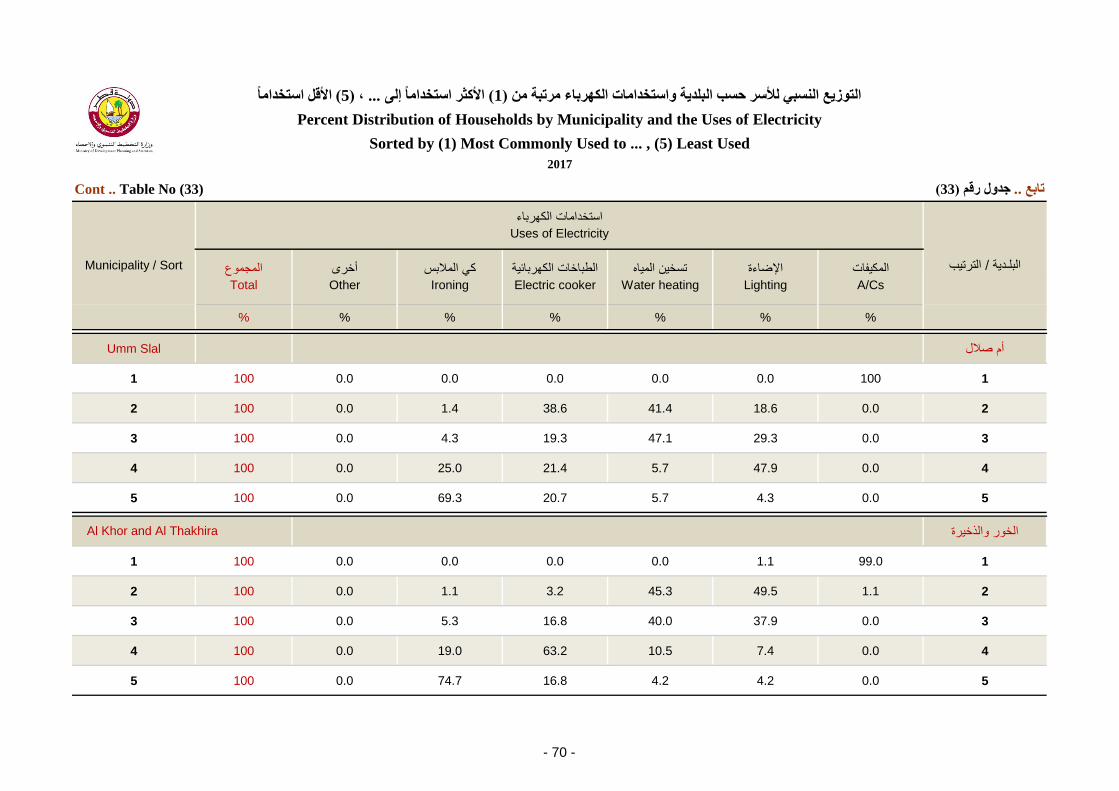
المجموع أخرى ك المالبس الطباخات الكهربائة تسخن الماه اإلضاءة المكفات
Total Other Ironing Electric cooker Water heating Lighting A/Cs
% % % % % % %
Umm Slal أم صالل
1 100 0.0 0.0 0.0 0.0 0.0 100 1
2 100 0.0 1.4 38.6 41.4 18.6 0.0 2
3 100 0.0 4.3 19.3 47.1 29.3 0.0 3
4 100 0.0 25.0 21.4 5.7 47.9 0.0 4
5 100 0.0 69.3 20.7 5.7 4.3 0.0 5
الخور والذخرة
1 100 0.0 0.0 0.0 0.0 1.1 99.0 1
2 100 0.0 1.1 3.2 45.3 49.5 1.1 2
3 100 0.0 5.3 16.8 40.0 37.9 0.0 3
4 100 0.0 19.0 63.2 10.5 7.4 0.0 4
5 100 0.0 74.7 16.8 4.2 4.2 0.0 5
األلم استخذايب (5)، ... األكثر استخذايب إنى (1)انتىزغ انسج نألسر زست انجهذخ واستخذايبد انكهرثبء يرتجخ ي
Percent Distribution of Households by Municipality and the Uses of Electricity
Sorted by (1) Most Commonly Used to ... , (5) Least Used
Cont .. Table No (33)
Municipality / Sort
استخدامات الكهرباء
الترتب/ البلـدة
Uses of Electricity
(33)خذول رلى ..تبثغ
2017
Al Khor and Al Thakhira
- 70 -
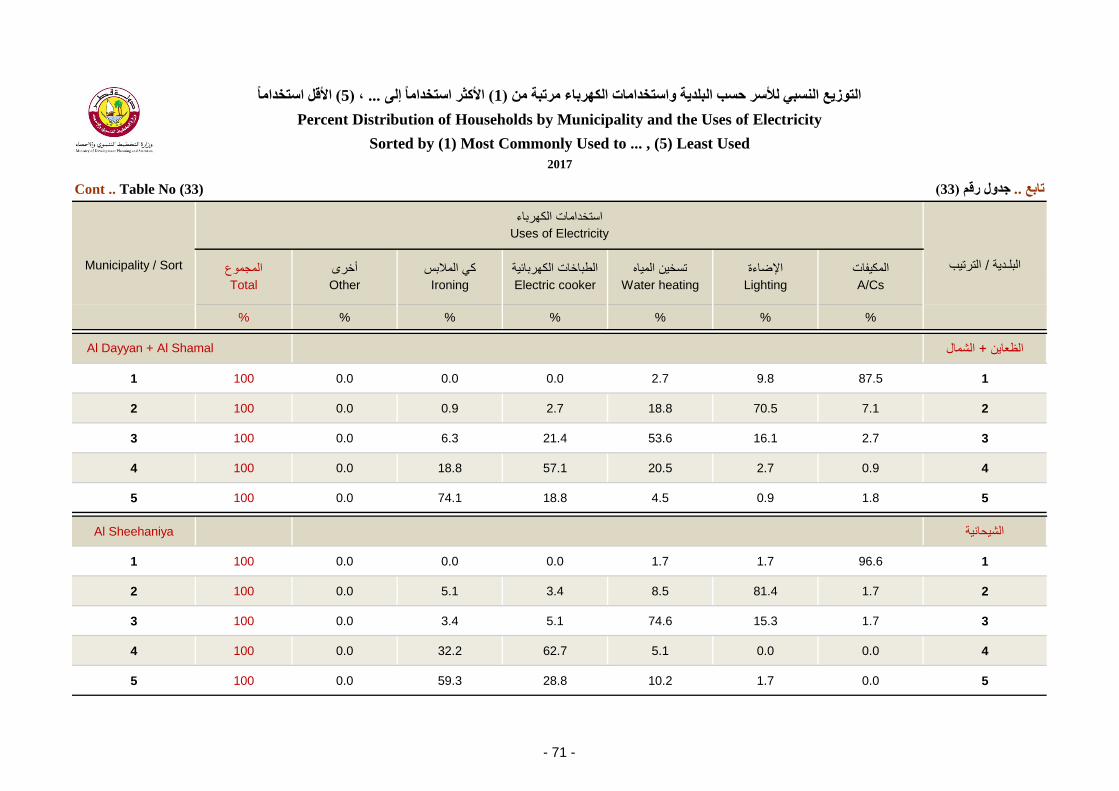
المجموع أخرى ك المالبس الطباخات الكهربائة تسخن الماه اإلضاءة المكفات
Total Other Ironing Electric cooker Water heating Lighting A/Cs
% % % % % % %
الشمال+ الظعان
1 100 0.0 0.0 0.0 2.7 9.8 87.5 1
2 100 0.0 0.9 2.7 18.8 70.5 7.1 2
3 100 0.0 6.3 21.4 53.6 16.1 2.7 3
4 100 0.0 18.8 57.1 20.5 2.7 0.9 4
5 100 0.0 74.1 18.8 4.5 0.9 1.8 5
Al Sheehaniya الشحانة
1 100 0.0 0.0 0.0 1.7 1.7 96.6 1
2 100 0.0 5.1 3.4 8.5 81.4 1.7 2
3 100 0.0 3.4 5.1 74.6 15.3 1.7 3
4 100 0.0 32.2 62.7 5.1 0.0 0.0 4
5 100 0.0 59.3 28.8 10.2 1.7 0.0 5
Municipality / Sort
استخدامات الكهرباء
الترتب/ البلـدة
Uses of Electricity
Al Dayyan + Al Shamal
األلم استخذايب (5)، ... األكثر استخذايب إنى (1)انتىزغ انسج نألسر زست انجهذخ واستخذايبد انكهرثبء يرتجخ ي
Percent Distribution of Households by Municipality and the Uses of Electricity
Sorted by (1) Most Commonly Used to ... , (5) Least Used
Cont .. Table No (33) (33)خذول رلى ..تبثغ
2017
- 71 -
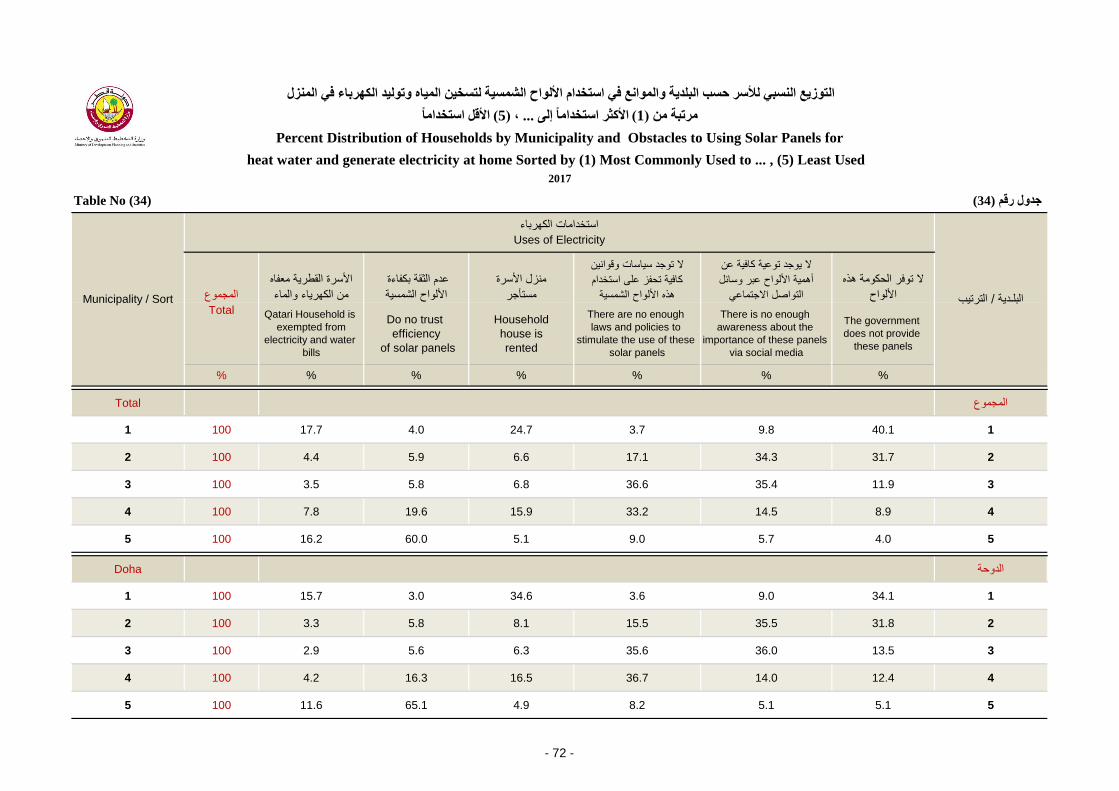
Table No (34) خذول رلى (34)
المجموع
األسرة القطرة معفاه
من الكهراء والماء
عدم الثقة بكفاءة
األلواح الشمسة
منزل األسرة
مستؤجر
ال توجد ساسات وقوانن
كافة تحفز على استخدام
هذه األلواح الشمسة
ال وجد توعة كافة عن
أهمة األلواح عبر وسائل
التواصل االجتماع
ال توفر الحكومة هذه
األلواح
Total Qatari Household is
exempted from
electricity and water
bills
Do no trust
efficiency
of solar panels
Household
house is
rented
There are no enough
laws and policies to
stimulate the use of these
solar panels
There is no enough
awareness about the
importance of these panels
via social media
The government
does not provide
these panels
% % % % % % %
Total المجموع
1 100 17.7 4.0 24.7 3.7 9.8 40.1 1
2 100 4.4 5.9 6.6 17.1 34.3 31.7 2
3 100 3.5 5.8 6.8 36.6 35.4 11.9 3
4 100 7.8 19.6 15.9 33.2 14.5 8.9 4
5 100 16.2 60.0 5.1 9.0 5.7 4.0 5
Doha الدوحة
1 100 15.7 3.0 34.6 3.6 9.0 34.1 1
2 100 3.3 5.8 8.1 15.5 35.5 31.8 2
3 100 2.9 5.6 6.3 35.6 36.0 13.5 3
4 100 4.2 16.3 16.5 36.7 14.0 12.4 4
5 100 11.6 65.1 4.9 8.2 5.1 5.1 5
انتىزغ انسج نألسر زست انجهذخ وانىاغ ف استخذاو األنىاذ انشسخ نتسخ انب وتىنذ انكهرثبء ف انسل
Percent Distribution of Households by Municipality and Obstacles to Using Solar Panels for
heat water and generate electricity at home Sorted by (1) Most Commonly Used to ... , (5) Least Used
Municipality / Sort
استخدامات الكهرباء
الترتب/ البلـدة
Uses of Electricity
األلم استخذايب (5)، ... األكثر استخذايب إنى (1)يرتجخ ي
2017
- 72 -

المجموع
األسرة القطرة معفاه
من الكهراء والماء
عدم الثقة بكفاءة
األلواح الشمسة
منزل األسرة
مستؤجر
ال توجد ساسات وقوانن
كافة تحفز على استخدام
هذه األلواح الشمسة
ال وجد توعة كافة عن
أهمة األلواح عبر وسائل
التواصل االجتماع
ال توفر الحكومة هذه
األلواح
Total Qatari Household is
exempted from
electricity and water
bills
Do no trust
efficiency
of solar panels
Household
house is
rented
There are no enough
laws and policies to
stimulate the use of these
solar panels
There is no enough
awareness about the
importance of these panels
via social media
The government
does not provide
these panels
% % % % % % %
Al Rayyan الران
1 100 9.9 5.5 16.7 2.8 14.9 50.1 1
2 100 5.8 5.1 5.9 19.2 37.2 26.8 2
3 100 5.7 5.5 9.3 39.1 32.2 8.3 3
4 100 12.0 22.2 18.4 29.4 11.9 6.1 4
5 100 24.6 54.4 5.0 9.1 3.9 3.0 5
Al Wakra الوكرة
1 100 7.0 7.8 45.8 0.0 2.8 36.6 1
2 100 4.9 4.9 3.5 15.5 24.7 46.5 2
3 100 0.7 0.7 3.5 31.0 50.7 13.4 3
4 100 3.5 23.2 2.1 48.6 19.0 3.5 4
5 100 26.8 62.7 2.8 4.9 2.8 0.0 5
Municipality / Sort
استخدامات الكهرباء
الترتب/ البلـدة
Uses of Electricity
انتىزغ انسج نألسر زست انجهذخ وانىاغ ف استخذاو األنىاذ انشسخ نتسخ انب وتىنذ انكهرثبء ف انسل
Percent Distribution of Households by Municipality and Obstacles to Using Solar Panels for
heat water and generate electricity at home Sorted by (1) Most Commonly Used to ... , (5) Least Used
Cont .. Table No (34)
األلم استخذايب (5)، ... األكثر استخذايب إنى (1)يرتجخ ي
(34)خذول رلى ..تبثغ
2017
- 73 -
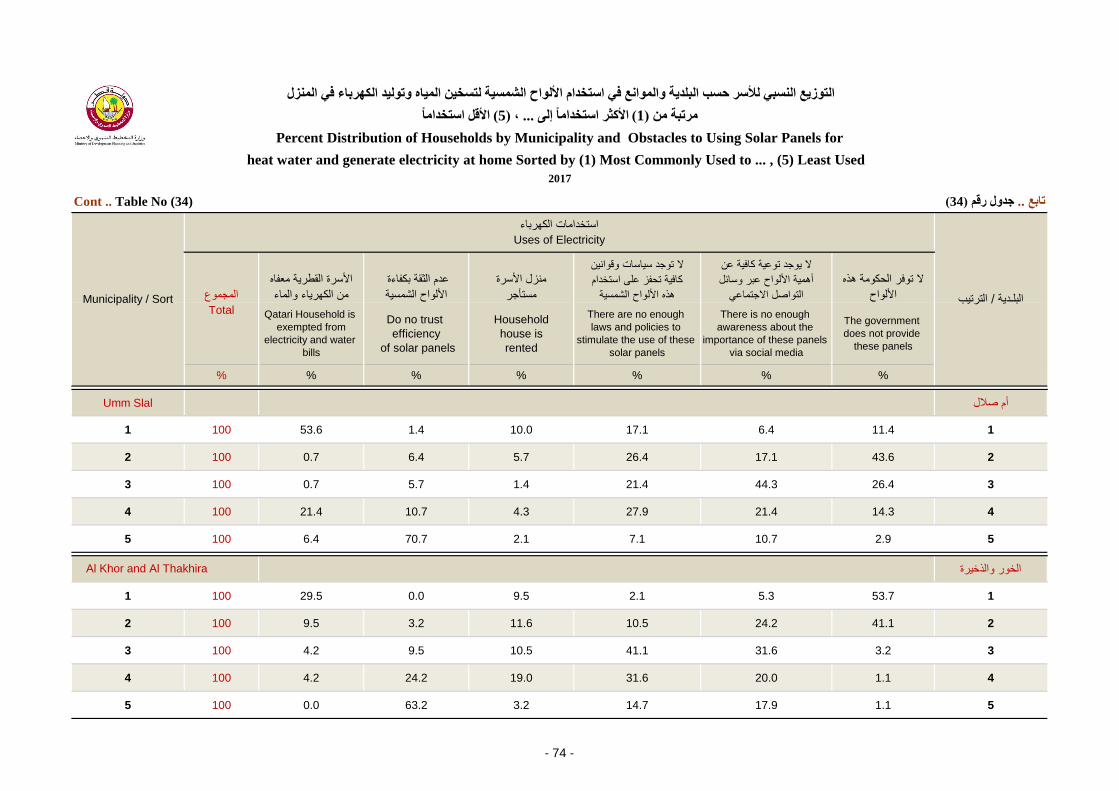
المجموع
األسرة القطرة معفاه
من الكهراء والماء
عدم الثقة بكفاءة
األلواح الشمسة
منزل األسرة
مستؤجر
ال توجد ساسات وقوانن
كافة تحفز على استخدام
هذه األلواح الشمسة
ال وجد توعة كافة عن
أهمة األلواح عبر وسائل
التواصل االجتماع
ال توفر الحكومة هذه
األلواح
Total Qatari Household is
exempted from
electricity and water
bills
Do no trust
efficiency
of solar panels
Household
house is
rented
There are no enough
laws and policies to
stimulate the use of these
solar panels
There is no enough
awareness about the
importance of these panels
via social media
The government
does not provide
these panels
% % % % % % %
Umm Slal أم صالل
1 100 53.6 1.4 10.0 17.1 6.4 11.4 1
2 100 0.7 6.4 5.7 26.4 17.1 43.6 2
3 100 0.7 5.7 1.4 21.4 44.3 26.4 3
4 100 21.4 10.7 4.3 27.9 21.4 14.3 4
5 100 6.4 70.7 2.1 7.1 10.7 2.9 5
الخور والذخرة
1 100 29.5 0.0 9.5 2.1 5.3 53.7 1
2 100 9.5 3.2 11.6 10.5 24.2 41.1 2
3 100 4.2 9.5 10.5 41.1 31.6 3.2 3
4 100 4.2 24.2 19.0 31.6 20.0 1.1 4
5 100 0.0 63.2 3.2 14.7 17.9 1.1 5
األلم استخذايب (5)، ... األكثر استخذايب إنى (1)يرتجخ ي
Percent Distribution of Households by Municipality and Obstacles to Using Solar Panels for
heat water and generate electricity at home Sorted by (1) Most Commonly Used to ... , (5) Least Used
Cont .. Table No (34)
Municipality / Sort
استخدامات الكهرباء
الترتب/ البلـدة
Uses of Electricity
(34)خذول رلى ..تبثغ
2017
Al Khor and Al Thakhira
انتىزغ انسج نألسر زست انجهذخ وانىاغ ف استخذاو األنىاذ انشسخ نتسخ انب وتىنذ انكهرثبء ف انسل
- 74 -
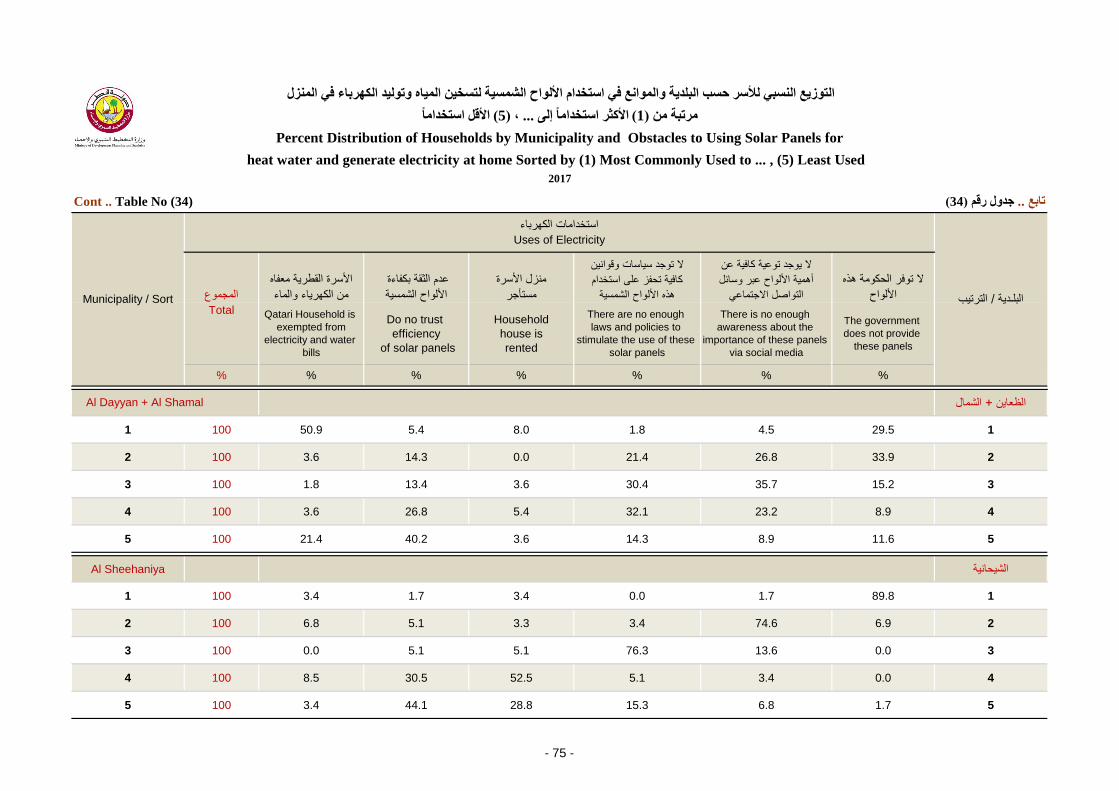
المجموع
األسرة القطرة معفاه
من الكهراء والماء
عدم الثقة بكفاءة
األلواح الشمسة
منزل األسرة
مستؤجر
ال توجد ساسات وقوانن
كافة تحفز على استخدام
هذه األلواح الشمسة
ال وجد توعة كافة عن
أهمة األلواح عبر وسائل
التواصل االجتماع
ال توفر الحكومة هذه
األلواح
Total Qatari Household is
exempted from
electricity and water
bills
Do no trust
efficiency
of solar panels
Household
house is
rented
There are no enough
laws and policies to
stimulate the use of these
solar panels
There is no enough
awareness about the
importance of these panels
via social media
The government
does not provide
these panels
% % % % % % %
الشمال+ الظعان
1 100 50.9 5.4 8.0 1.8 4.5 29.5 1
2 100 3.6 14.3 0.0 21.4 26.8 33.9 2
3 100 1.8 13.4 3.6 30.4 35.7 15.2 3
4 100 3.6 26.8 5.4 32.1 23.2 8.9 4
5 100 21.4 40.2 3.6 14.3 8.9 11.6 5
Al Sheehaniya الشحانة
1 100 3.4 1.7 3.4 0.0 1.7 89.8 1
2 100 6.8 5.1 3.3 3.4 74.6 6.9 2
3 100 0.0 5.1 5.1 76.3 13.6 0.0 3
4 100 8.5 30.5 52.5 5.1 3.4 0.0 4
5 100 3.4 44.1 28.8 15.3 6.8 1.7 5
األلم استخذايب (5)، ... األكثر استخذايب إنى (1)يرتجخ ي
Municipality / Sort
استخدامات الكهرباء
الترتب/ البلـدة
Uses of Electricity
Al Dayyan + Al Shamal
انتىزغ انسج نألسر زست انجهذخ وانىاغ ف استخذاو األنىاذ انشسخ نتسخ انب وتىنذ انكهرثبء ف انسل
Percent Distribution of Households by Municipality and Obstacles to Using Solar Panels for
heat water and generate electricity at home Sorted by (1) Most Commonly Used to ... , (5) Least Used
Cont .. Table No (34) (34)خذول رلى ..تبثغ
2017
- 75 -
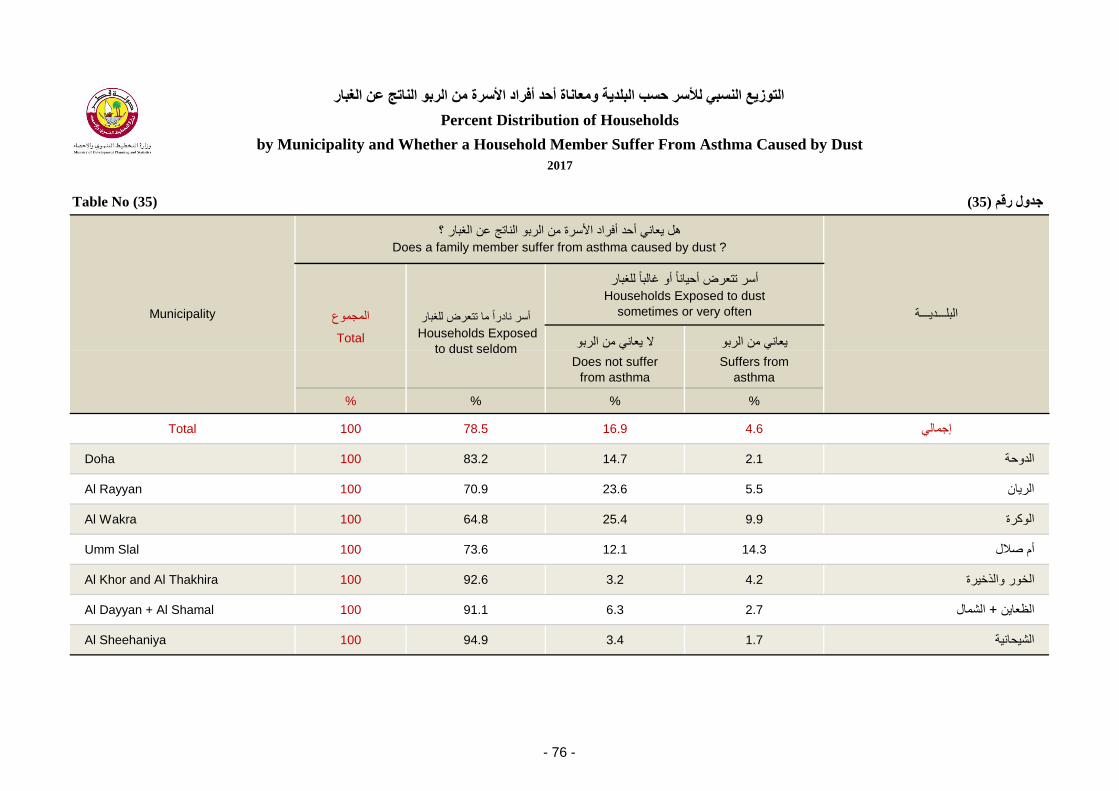
Table No (35) خذول رلى (35)
المجموع
Total ال عان من الربو عان من الربو
Does not suffer
from asthma
Suffers from
asthma
% % % %
Total 100 78.5 16.9 4.6 إجمال
Doha 100 83.2 14.7 2.1 الدوحة
Al Rayyan 100 70.9 23.6 5.5 الران
Al Wakra 100 64.8 25.4 9.9 الوكرة
Umm Slal 100 73.6 12.1 14.3 أم صالل
Al Khor and Al Thakhira 100 92.6 3.2 4.2 الخور والذخرة
Al Dayyan + Al Shamal 100 91.1 6.3 2.7 الشمال+ الظعان
Al Sheehaniya 100 94.9 3.4 1.7 الشحانة
2017
أسر نادرا ما تتعرض للغبار
Households Exposed
to dust seldom
انتىزغ انسج نألسر زست انجهذخ ويؼببح أزذ أفراد األسرح ي انرثى انبتح ػ انغجبر
Percent Distribution of Households
by Municipality and Whether a Household Member Suffer From Asthma Caused by Dust
Municipality
هل عان أحد أفراد األسرة من الربو الناتج عن الغبار ؟
البلـــدـــة
Does a family member suffer from asthma caused by dust ?
Households Exposed to dust
sometimes or very often
أسر تتعرض أحانا أو غالبا للغبار
- 76 -

Table No (36) خذول رلى (36)
المجموع ال تستخدم فلترة الهواء تستخدم فلترة الهواء
TotalDoes not use
air filtrationUse air filtration
% % %
Total 100 68.2 31.8 إجمال
Doha 100 70.5 29.5 الدوحة
Al Rayyan 100 58.7 41.3 الران
Al Wakra 100 81.7 18.3 الوكرة
Umm Slal 100 86.4 13.6 أم صالل
Al Khor and Al Thakhira 100 97.8 2.2 الخور والذخرة
Al Dayyan + Al Shamal 100 75.0 25.0 الشمال+ الظعان
Al Sheehaniya 100 11.9 88.1 الشحانة
ف انسل (فهترح انهىاء )انتىزغ انسج نألسر زست انجهذخ واستخذاو األسرح
Percent Distribution of Households
by Municipality and Whether The Household Use Air Filtration at Home
Municipality
ف المنزل ؟ (فلترة الهواء )هل تستخدم
البلـــدـــة
Do you use air filtration at home ?
2017
- 77 -

Table No (37) خذول رلى (37)
المجموع ال تم إجراء الصانة تم إجراء الصانة
Total maintenance is not Perform Maintenance is performed
% % %
Total 100 8.7 91.3 إجمال
Doha 100 8.7 91.3 الدوحة
Al Rayyan 100 7.6 92.4 الران
Al Wakra 100 4.9 95.1 الوكرة
Umm Slal 100 1.4 98.6 أم صالل
Al Khor and Al Thakhira 100 22.1 77.9 الخور والذخرة
Al Dayyan + Al Shamal 100 10.7 89.3 الشمال+ الظعان
Al Sheehaniya 100 22.0 78.0 الشحانة
انتىزغ انسج نألسر زست انجهذخ وإخراء األسرح نهصبخ انذورخ نهكفبد
Percent Distribution of Households
by Municipality and Whether The Household Perform Periodic Maintenance for A/Cs
Municipality
هل تم إجراء الصانة الدورة للمكفات ؟
البلـــدـــة
Is there any periodic maintenance for A/Cs ?
2017
- 78 -

Table No (38) خذول رلى (38)
المجموع ال تم ضبط درجة الحرارة تم ضبط درجة الحرارة
Total Not Adjust temperature Adjust temperature
% % %
Total 100 53.5 46.5 إجمال
Doha 100 46.9 53.1 الدوحة
Al Rayyan 100 51.8 48.2 الران
Al Wakra 100 81.7 18.3 الوكرة
Umm Slal 100 68.6 31.4 أم صالل
Al Khor and Al Thakhira 100 87.4 12.6 الخور والذخرة
Al Dayyan + Al Shamal 100 50.9 49.1 الشمال+ الظعان
Al Sheehaniya 100 27.1 72.9 الشحانة
درخخ24انتىزغ انسج نألسر زست انجهذخ وظجػ األسرح نذرخخ زرارح تريىستبد انكف ػذ
Percent Distribution of Households
by Municipality and Whether The Household Set the Air Conditioners' Thermostat at 24 Degrees
Municipality
درجة ؟24هل تم ضبط درجات حرارة ترموستات المكف عند
البلـــدـــة
Is the air conditioners' thermostat set at 24 degrees ?
2017
- 79 -
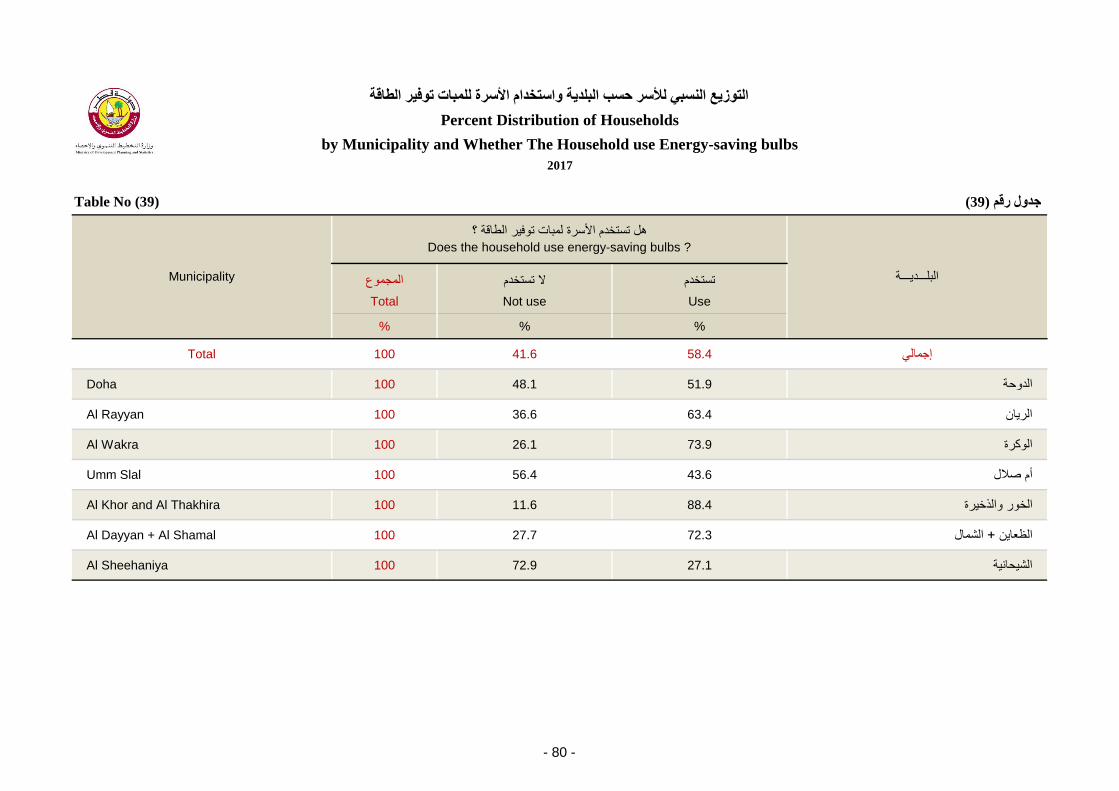
Table No (39) خذول رلى (39)
المجموع ال تستخدم تستخدم
Total Not use Use
% % %
Total 100 41.6 58.4 إجمال
Doha 100 48.1 51.9 الدوحة
Al Rayyan 100 36.6 63.4 الران
Al Wakra 100 26.1 73.9 الوكرة
Umm Slal 100 56.4 43.6 أم صالل
Al Khor and Al Thakhira 100 11.6 88.4 الخور والذخرة
Al Dayyan + Al Shamal 100 27.7 72.3 الشمال+ الظعان
Al Sheehaniya 100 72.9 27.1 الشحانة
انتىزغ انسج نألسر زست انجهذخ واستخذاو األسرح نهجبد تىفر انطبلخ
Percent Distribution of Households
by Municipality and Whether The Household use Energy-saving bulbs
Municipality
هل تستخدم األسرة لمبات توفر الطاقة ؟
البلـــدـــة
Does the household use energy-saving bulbs ?
2017
- 80 -
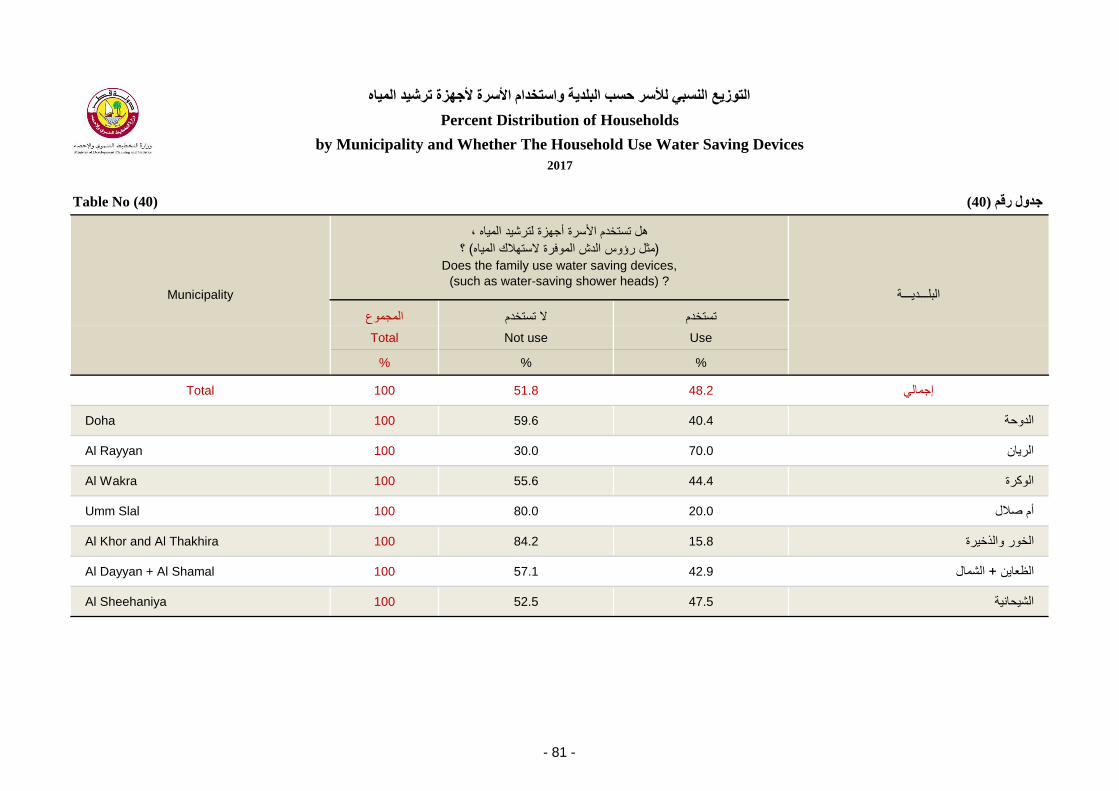
Table No (40) خذول رلى (40)
المجموع ال تستخدم تستخدم
Total Not use Use
% % %
Total 100 51.8 48.2 إجمال
Doha 100 59.6 40.4 الدوحة
Al Rayyan 100 30.0 70.0 الران
Al Wakra 100 55.6 44.4 الوكرة
Umm Slal 100 80.0 20.0 أم صالل
Al Khor and Al Thakhira 100 84.2 15.8 الخور والذخرة
Al Dayyan + Al Shamal 100 57.1 42.9 الشمال+ الظعان
Al Sheehaniya 100 52.5 47.5 الشحانة
انتىزغ انسج نألسر زست انجهذخ واستخذاو األسرح ألخهسح ترشذ انب
Percent Distribution of Households
by Municipality and Whether The Household Use Water Saving Devices
Municipality
هل تستخدم األسرة أجهزة لترشد الماه ،
؟ (مثل رإوس الدش الموفرة الستهالك الماه)
البلـــدـــة
Does the family use water saving devices,
(such as water-saving shower heads) ?
2017
- 81 -

Table No (41) خذول رلى (41)
المجموع لم شارك شارك
Total Did not Participated Participated
% % %
Total 100 92.5 7.5 إجمال
Doha 100 90.8 9.2 الدوحة
Al Rayyan 100 94.1 5.9 الران
Al Wakra 100 93.7 6.3 الوكرة
Umm Slal 100 87.1 12.9 أم صالل
Al Khor and Al Thakhira 100 99.0 1.1 الخور والذخرة
Al Dayyan + Al Shamal 100 94.6 5.4 الشمال+ الظعان
Al Sheehaniya 100 96.6 3.4 الشحانة
انتىزغ انسج نألسر زست انجهذخ ويشبركخ أزذ أفراد األسرح ف أي زهخ تىػخ زىل تىػخ انجئخ سبثمب
Percent Distribution of Households by Municipality
and Whether a Household Member Participated in Any Environment Awareness Campaign Previously
Municipality
هل ساهم أحد أفراد األسرة أو حضر أو
شارك ف أي حملة توعة حول توعة البئة سابقا ؟
البلـــدـــة
Does a family member contributed to, attended or participated in
any environment awareness campaign previously ?
2017
- 82 -
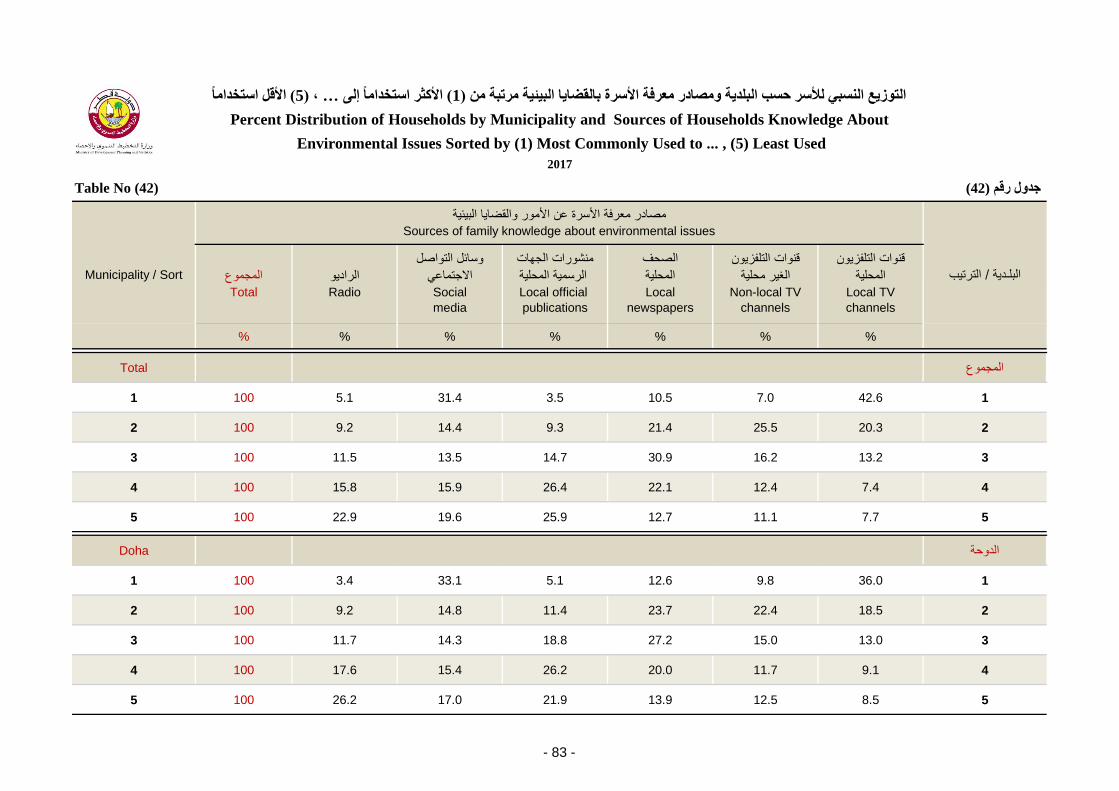
Table No (42) خذول رلى (42)
المجموع الرادو
وسائل التواصل
االجتماع
منشورات الجهات
الرسمة المحلة
الصحف
المحلة
قنوات التلفزون
الغر محلة
قنوات التلفزون
المحلة
Total Radio Social
media
Local official
publications
Local
newspapers
Non-local TV
channels
Local TV
channels
% % % % % % %
Total المجموع
1 100 5.1 31.4 3.5 10.5 7.0 42.6 1
2 100 9.2 14.4 9.3 21.4 25.5 20.3 2
3 100 11.5 13.5 14.7 30.9 16.2 13.2 3
4 100 15.8 15.9 26.4 22.1 12.4 7.4 4
5 100 22.9 19.6 25.9 12.7 11.1 7.7 5
Doha الدوحة
1 100 3.4 33.1 5.1 12.6 9.8 36.0 1
2 100 9.2 14.8 11.4 23.7 22.4 18.5 2
3 100 11.7 14.3 18.8 27.2 15.0 13.0 3
4 100 17.6 15.4 26.2 20.0 11.7 9.1 4
5 100 26.2 17.0 21.9 13.9 12.5 8.5 5
األلم استخذايب (5)، … األكثر استخذايب إنى (1)انتىزغ انسج نألسر زست انجهذخ ويصبدر يؼرفخ األسرح ثبنمعبب انجئخ يرتجخ ي
Percent Distribution of Households by Municipality and Sources of Households Knowledge About
Environmental Issues Sorted by (1) Most Commonly Used to ... , (5) Least Used
Municipality / Sort
مصادر معرفة األسرة عن األمور والقضاا البئة
الترتب/ البلـدة
Sources of family knowledge about environmental issues
2017
- 83 -

المجموع الرادو
وسائل التواصل
االجتماع
منشورات الجهات
الرسمة المحلة
الصحف
المحلة
قنوات التلفزون
الغر محلة
قنوات التلفزون
المحلة
Total Radio Social
media
Local official
publications
Local
newspapers
Non-local TV
channels
Local TV
channels
% % % % % % %
Al Rayyan الران
1 100 7.6 30.4 1.8 6.1 6.5 47.7 1
2 100 7.7 13.1 5.4 17.5 34.8 21.4 2
3 100 12.6 10.9 7.2 36.6 19.3 13.4 3
4 100 15.5 12.6 27.2 26.2 14.2 4.3 4
5 100 18.8 26.2 24.5 11.2 12.0 7.3 5
Al Wakra الوكرة
1 100 2.8 41.5 1.4 9.9 2.8 41.6 1
2 100 9.2 23.9 8.5 24.7 8.5 25.4 2
3 100 15.5 14.8 16.9 34.5 12.0 6.3 3
4 100 23.9 11.3 32.4 14.8 7.8 9.9 4
5 100 30.3 6.3 37.3 11.3 2.8 12.0 5
2017
األلم استخذايب (5)، … األكثر استخذايب إنى (1)انتىزغ انسج نألسر زست انجهذخ ويصبدر يؼرفخ األسرح ثبنمعبب انجئخ يرتجخ ي
مصادر معرفة األسرة عن األمور والقضاا البئة
Percent Distribution of Households by Municipality and Sources of Households Knowledge About
Environmental Issues Sorted by (1) Most Commonly Used to ... , (5) Least Used
Municipality / Sort الترتب/ البلـدة
Sources of family knowledge about environmental issues
Cont .. Table No (42) (42)خذول رلى ..تبثغ
- 84 -
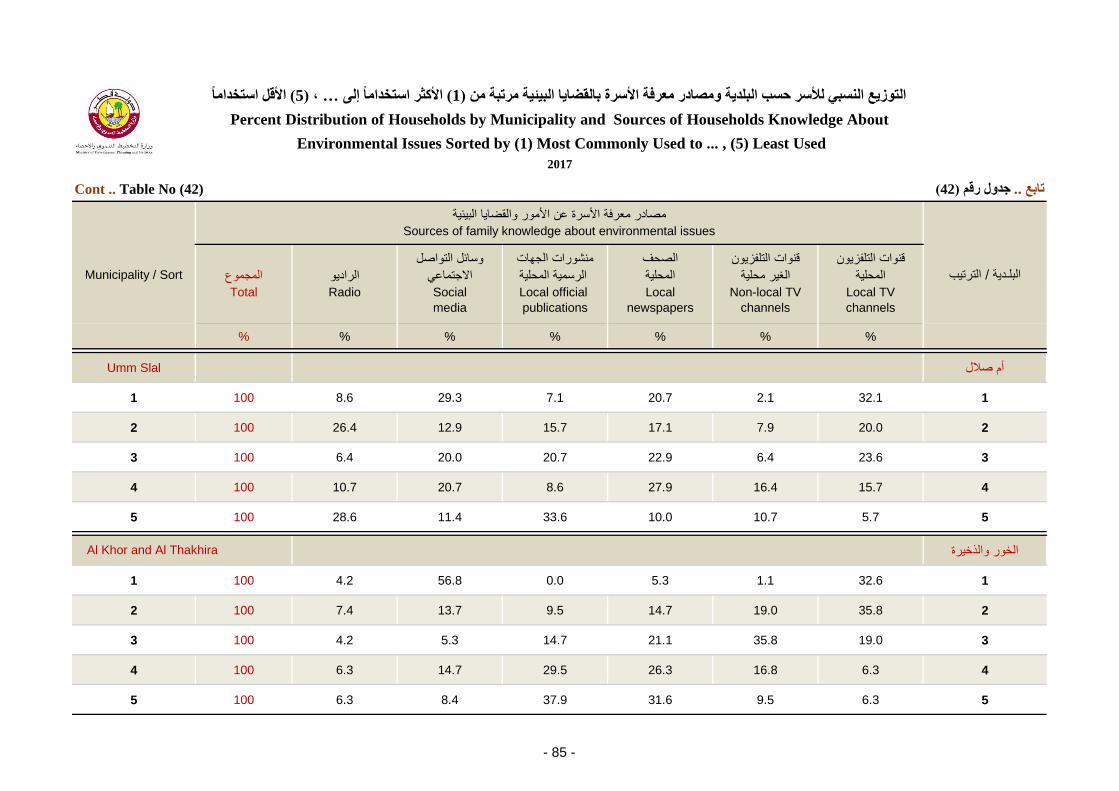
المجموع الرادو
وسائل التواصل
االجتماع
منشورات الجهات
الرسمة المحلة
الصحف
المحلة
قنوات التلفزون
الغر محلة
قنوات التلفزون
المحلة
Total Radio Social
media
Local official
publications
Local
newspapers
Non-local TV
channels
Local TV
channels
% % % % % % %
Umm Slal أم صالل
1 100 8.6 29.3 7.1 20.7 2.1 32.1 1
2 100 26.4 12.9 15.7 17.1 7.9 20.0 2
3 100 6.4 20.0 20.7 22.9 6.4 23.6 3
4 100 10.7 20.7 8.6 27.9 16.4 15.7 4
5 100 28.6 11.4 33.6 10.0 10.7 5.7 5
الخور والذخرة
1 100 4.2 56.8 0.0 5.3 1.1 32.6 1
2 100 7.4 13.7 9.5 14.7 19.0 35.8 2
3 100 4.2 5.3 14.7 21.1 35.8 19.0 3
4 100 6.3 14.7 29.5 26.3 16.8 6.3 4
5 100 6.3 8.4 37.9 31.6 9.5 6.3 5
Environmental Issues Sorted by (1) Most Commonly Used to ... , (5) Least Used
Municipality / Sort
Cont .. Table No (42)
Al Khor and Al Thakhira
(42)خذول رلى ..تبثغ
مصادر معرفة األسرة عن األمور والقضاا البئة
الترتب/ البلـدة
Sources of family knowledge about environmental issues
األلم استخذايب (5)، … األكثر استخذايب إنى (1)انتىزغ انسج نألسر زست انجهذخ ويصبدر يؼرفخ األسرح ثبنمعبب انجئخ يرتجخ ي
2017
Percent Distribution of Households by Municipality and Sources of Households Knowledge About
- 85 -
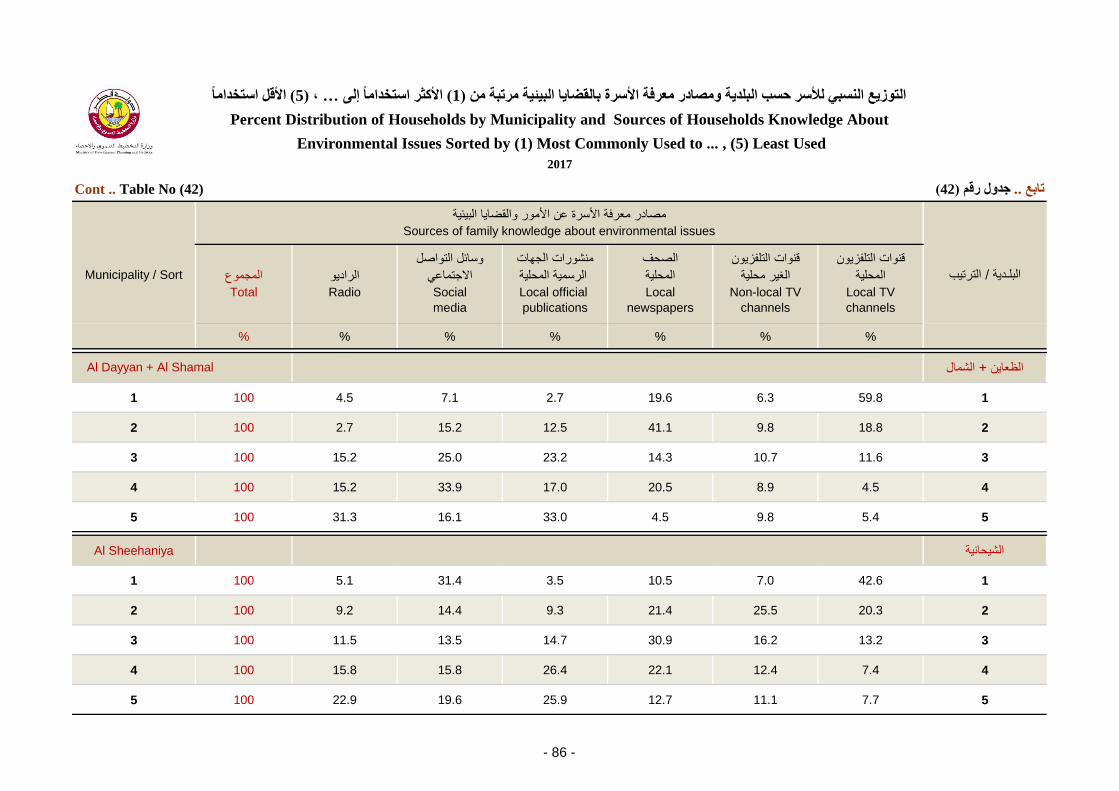
المجموع الرادو
وسائل التواصل
االجتماع
منشورات الجهات
الرسمة المحلة
الصحف
المحلة
قنوات التلفزون
الغر محلة
قنوات التلفزون
المحلة
Total Radio Social
media
Local official
publications
Local
newspapers
Non-local TV
channels
Local TV
channels
% % % % % % %
الشمال+ الظعان
1 100 4.5 7.1 2.7 19.6 6.3 59.8 1
2 100 2.7 15.2 12.5 41.1 9.8 18.8 2
3 100 15.2 25.0 23.2 14.3 10.7 11.6 3
4 100 15.2 33.9 17.0 20.5 8.9 4.5 4
5 100 31.3 16.1 33.0 4.5 9.8 5.4 5
Al Sheehaniya الشحانة
1 100 5.1 31.4 3.5 10.5 7.0 42.6 1
2 100 9.2 14.4 9.3 21.4 25.5 20.3 2
3 100 11.5 13.5 14.7 30.9 16.2 13.2 3
4 100 15.8 15.8 26.4 22.1 12.4 7.4 4
5 100 22.9 19.6 25.9 12.7 11.1 7.7 5
Al Dayyan + Al Shamal
األلم استخذايب (5)، … األكثر استخذايب إنى (1)انتىزغ انسج نألسر زست انجهذخ ويصبدر يؼرفخ األسرح ثبنمعبب انجئخ يرتجخ ي
Percent Distribution of Households by Municipality and Sources of Households Knowledge About
Environmental Issues Sorted by (1) Most Commonly Used to ... , (5) Least Used
Cont .. Table No (42)
Municipality / Sort
مصادر معرفة األسرة عن األمور والقضاا البئة
الترتب/ البلـدة
Sources of family knowledge about environmental issues
(42)خذول رلى ..تبثغ
2017
- 86 -

Table No (43) خذول رلى (43)
المجموع
التؤثر بحمالت التوعة
حول المشاكل البئة
ضمان ظروف معشة بئة
سلمة لألجال القادمة
من األبناء واألحفاد
العش ضمن ظروف بئة
سلمة وبعدة عن مشاكل
التلوث و األمراض
الوازع األخالق
والثقاف الوازع الدن
Total Vulnerability by the
environment
awareness
campaigns
Environmental living
conditions for future
generations of children
and grandchildren
Living in a sound
environmenal conditions
that are pollution and
disease free
Morals and
culture
Religion
% % % % % %
Total المجموع
1 100 2.2 3.4 8.8 11.3 74.4 1
2 100 2.0 9.7 13.0 66.9 8.5 2
3 100 5.0 15.0 62.9 11.5 5.7 3
4 100 9.8 64.8 12.4 8.2 4.7 4
5 100 81.0 7.2 2.9 2.2 6.8 5
Doha الدوحة
1 100 1.7 2.2 11.6 13.0 71.6 1
2 100 1.0 10.6 13.0 67.9 7.5 2
3 100 5.9 15.1 62.1 10.1 6.9 3
4 100 11.0 64.7 10.6 7.8 5.9 4
5 100 80.4 7.5 2.7 1.3 8.2 5
األلم استخذايب (5)، ... األكثر استخذايب إنى (1)انتىزغ انسج نألسر زست انجهذخ وانؼىايم انسفسح نسبخ انجئخ يرتجخ ي
Percent Distribution of Households by Municipality and Motivating Factors to Protect The Environment
Sorted by (1) Most Commonly Used to ... , (5) Least Used
Municipality / Sort
العوامل المحفزة لحماة البئة
الترتب/ البلـدة
Motivating Factors to protect the environment
2017
- 87 -

المجموع
التؤثر بحمالت التوعة
حول المشاكل البئة
ضمان ظروف معشة بئة
سلمة لألجال القادمة
من األبناء واألحفاد
العش ضمن ظروف بئة
سلمة وبعدة عن مشاكل
التلوث و األمراض
الوازع األخالق
والثقاف الوازع الدن
Total Vulnerability by the
environment
awareness
campaigns
Environmental living
conditions for future
generations of children
and grandchildren
Living in a sound
environmenal conditions
that are pollution and
disease free
Morals and
culture
Religion
% % % % % %
Al Rayyan الران
1 100 4.0 3.9 9.1 11.5 71.6 1
2 100 3.5 7.2 12.7 65.5 11.2 2
3 100 4.8 14.9 61.3 13.3 5.7 3
4 100 6.8 68.0 14.0 6.9 4.4 4
5 100 80.9 6.1 2.9 2.9 7.2 5
Al Wakra الوكرة
1 100 0.7 4.9 5.6 20.4 68.3 1
2 100 1.4 7.0 16.2 66.9 8.5 2
3 100 4.9 26.1 59.9 6.3 2.8 3
4 100 15.5 59.2 14.1 3.5 7.8 4
5 100 77.5 2.8 4.2 2.8 12.7 5
األلم استخذايب (5)، ... األكثر استخذايب إنى (1)انتىزغ انسج نألسر زست انجهذخ وانؼىايم انسفسح نسبخ انجئخ يرتجخ ي
Percent Distribution of Households by Municipality and Motivating Factors to Protect The Environment
Sorted by (1) Most Commonly Used to ... , (5) Least Used
Cont .. Table No (43) (43)خذول رلى ..تبثغ
2017
Municipality / Sort
العوامل المحفزة لحماة البئة
الترتب/ البلـدة
Motivating Factors to protect the environment
- 88 -

المجموع
التؤثر بحمالت التوعة
حول المشاكل البئة
ضمان ظروف معشة بئة
سلمة لألجال القادمة
من األبناء واألحفاد
العش ضمن ظروف بئة
سلمة وبعدة عن مشاكل
التلوث و األمراض
الوازع األخالق
والثقاف الوازع الدن
Total Vulnerability by the
environment
awareness
campaigns
Environmental living
conditions for future
generations of children
and grandchildren
Living in a sound
environmenal conditions
that are pollution and
disease free
Morals and
culture
Religion
% % % % % %
Umm Slal أم صالل
1 100 0.0 9.3 2.9 2.1 85.7 1
2 100 3.6 25.0 17.9 48.6 5.0 2
3 100 3.6 12.9 58.6 19.3 5.7 3
4 100 2.9 50.7 19.3 24.3 2.9 4
5 100 90.0 2.1 1.4 5.7 0.7 5
الخور والذخرة
1 100 0.0 3.2 3.2 6.3 87.4 1
2 100 0.0 7.4 3.2 79.0 10.5 2
3 100 1.1 10.5 76.8 9.5 2.1 3
4 100 2.1 75.8 16.8 5.3 0.0 4
5 100 96.8 3.2 0.0 0.0 0.0 5
األلم استخذايب (5)، ... األكثر استخذايب إنى (1)انتىزغ انسج نألسر زست انجهذخ وانؼىايم انسفسح نسبخ انجئخ يرتجخ ي
Percent Distribution of Households by Municipality and Motivating Factors to Protect The Environment
Sorted by (1) Most Commonly Used to ... , (5) Least Used
Cont .. Table No (43)
Municipality / Sort
العوامل المحفزة لحماة البئة
الترتب/ البلـدة
Motivating Factors to protect the environment
(43)خذول رلى ..تبثغ
2017
Al Khor and Al Thakhira
- 89 -
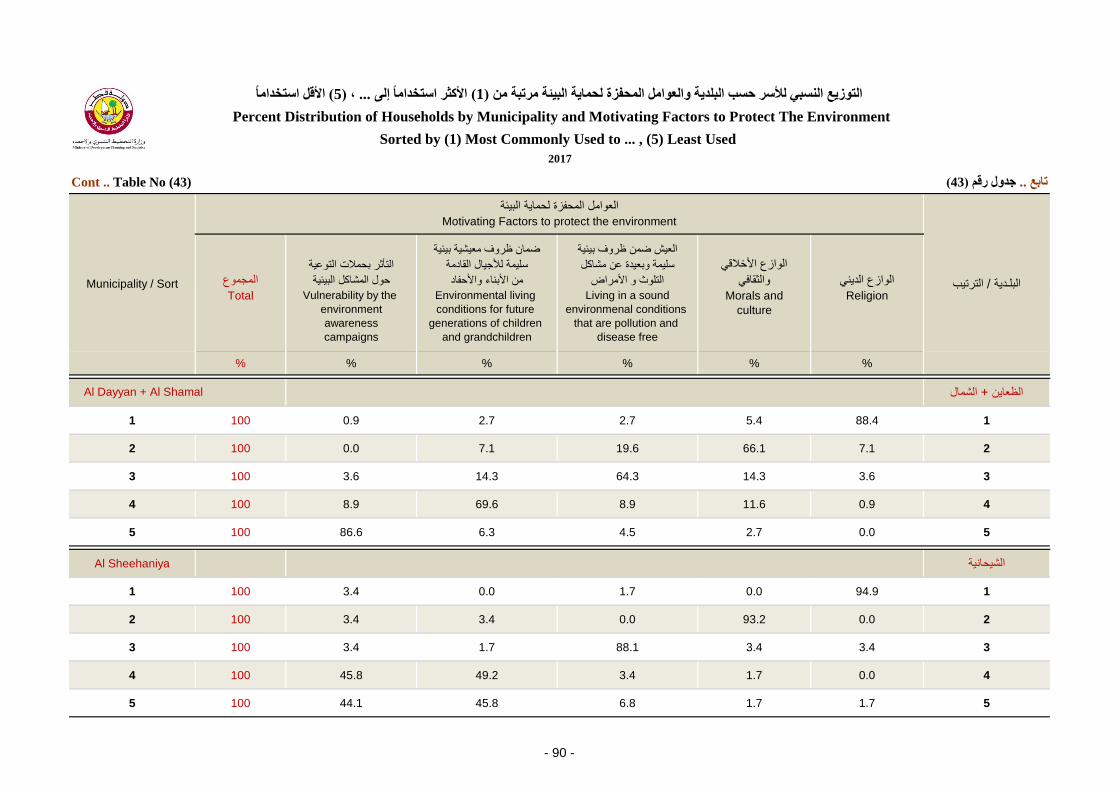
المجموع
التؤثر بحمالت التوعة
حول المشاكل البئة
ضمان ظروف معشة بئة
سلمة لألجال القادمة
من األبناء واألحفاد
العش ضمن ظروف بئة
سلمة وبعدة عن مشاكل
التلوث و األمراض
الوازع األخالق
والثقاف الوازع الدن
Total Vulnerability by the
environment
awareness
campaigns
Environmental living
conditions for future
generations of children
and grandchildren
Living in a sound
environmenal conditions
that are pollution and
disease free
Morals and
culture
Religion
% % % % % %
الشمال+ الظعان
1 100 0.9 2.7 2.7 5.4 88.4 1
2 100 0.0 7.1 19.6 66.1 7.1 2
3 100 3.6 14.3 64.3 14.3 3.6 3
4 100 8.9 69.6 8.9 11.6 0.9 4
5 100 86.6 6.3 4.5 2.7 0.0 5
Al Sheehaniya الشحانة
1 100 3.4 0.0 1.7 0.0 94.9 1
2 100 3.4 3.4 0.0 93.2 0.0 2
3 100 3.4 1.7 88.1 3.4 3.4 3
4 100 45.8 49.2 3.4 1.7 0.0 4
5 100 44.1 45.8 6.8 1.7 1.7 5
Municipality / Sort
العوامل المحفزة لحماة البئة
الترتب/ البلـدة
Motivating Factors to protect the environment
Al Dayyan + Al Shamal
األلم استخذايب (5)، ... األكثر استخذايب إنى (1)انتىزغ انسج نألسر زست انجهذخ وانؼىايم انسفسح نسبخ انجئخ يرتجخ ي
Percent Distribution of Households by Municipality and Motivating Factors to Protect The Environment
Sorted by (1) Most Commonly Used to ... , (5) Least Used
Cont .. Table No (43) (43)خذول رلى ..تبثغ
2017
- 90 -

Table No (44) خذول رلى (44)
المجموع أخرى
تخفض استهالك
الكهرباء
تقلل استهالك
الماه
تقلل الفاقد
من األغذة
فرز المواد المراد التخلص منها
مثل البالستك والورق والمعادن
قبل إلقائها ف النفااتTotal Others Reducing electricity
consumption
Reducing water
consumption
Reducing food
wastage
Sorting the materials to be
disposed of, such as plastic,
paper and metals, before
dumping them
% % % % % %
Total المجموع
1 100 0.9 27.7 17.2 21.5 32.8 1
2 100 0.1 20.6 39.9 30.3 9.1 2
3 100 0.0 20.3 35.4 34.5 9.7 3
4 100 0.6 31.4 7.5 13.5 47.0 4
Doha الدوحة
1 100 0.5 24.3 14.9 24.2 36.1 1
2 100 0.1 17.2 43.2 31.1 8.4 2
3 100 0.0 24.0 35.6 33.3 7.0 3
4 100 0.1 34.4 6.2 11.3 47.8 4
األلم استخذايب (4)، ... األكثر استخذايب إنى (1)انتىزغ انسج نألسر زست انجهذخ وإخراءاد زبخ انجئخ انت تستؼذ األسرح التخبرهب يرتجخ ي
Percent Distribution of Households by Municipality and Environmental Protection Procedures
The Household Willing to Take Sorted by (1) Most Commonly Used to ... , (4) Least Used
Municipality / Sort
اجراءات األسرة لحماة البئة
الترتب/ البلـدة
Environmental protection procedures that the family is willing to do
2017
- 91 -

المجموع أخرى
تخفض استهالك
الكهرباء
تقلل استهالك
الماه
تقلل الفاقد
من األغذة
فرز المواد المراد التخلص منها
مثل البالستك والورق والمعادن
قبل إلقائها ف النفااتTotal Others Reducing electricity
consumption
Reducing water
consumption
Reducing food
wastage
Sorting the materials to be
disposed of, such as plastic,
paper and metals, before
dumping them
% % % % % %
Al Rayyan الران
1 100 2.1 31.1 17.4 18.1 31.4 1
2 100 0.3 23.3 36.9 29.4 10.1 2
3 100 0.0 17.1 37.3 35.6 9.9 3
4 100 1.7 28.3 8.4 16.4 44.9 4
Al Wakra الوكرة
1 100 0.0 36.6 18.3 14.8 30.3 1
2 100 0.0 22.5 43.7 30.3 3.5 2
3 100 0.0 20.4 26.8 34.5 18.3 3
4 100 0.0 20.4 11.3 20.4 47.9 4
األلم استخذايب (4)، ... األكثر استخذايب إنى (1)انتىزغ انسج نألسر زست انجهذخ وإخراءاد زبخ انجئخ انت تستؼذ األسرح التخبرهب يرتجخ ي
Percent Distribution of Households by Municipality and Environmental Protection Procedures
The Household Willing to Take Sorted by (1) Most Commonly Used to ... , (4) Least Used
Cont .. Table No (44) (44)خذول رلى ..تبثغ
2017
Municipality / Sort
اجراءات األسرة لحماة البئة
الترتب/ البلـدة
Environmental protection procedures that the family is willing to do
- 92 -

المجموع أخرى
تخفض استهالك
الكهرباء
تقلل استهالك
الماه
تقلل الفاقد
من األغذة
فرز المواد المراد التخلص منها
مثل البالستك والورق والمعادن
قبل إلقائها ف النفااتTotal Others Reducing electricity
consumption
Reducing water
consumption
Reducing food
wastage
Sorting the materials to be
disposed of, such as plastic,
paper and metals, before
dumping them
% % % % % %
Umm Slal أم صالل
1 100 0.0 16.4 42.9 30.7 10.0 1
2 100 0.0 35.0 35.7 14.3 15.0 2
3 100 0.0 25.7 13.6 43.6 17.1 3
4 100 0.7 22.9 7.9 11.4 57.1 4
الخور والذخرة
1 100 0.0 43.2 20.0 19.0 17.9 1
2 100 0.0 24.2 48.4 20.0 7.4 2
3 100 0.0 16.8 22.1 46.3 14.7 3
4 100 0.0 15.8 9.5 14.7 60.0 4
األلم استخذايب (4)، ... األكثر استخذايب إنى (1)انتىزغ انسج نألسر زست انجهذخ وإخراءاد زبخ انجئخ انت تستؼذ األسرح التخبرهب يرتجخ ي
(44)خذول رلى ..تبثغ
Percent Distribution of Households by Municipality and Environmental Protection Procedures
The Household Willing to Take Sorted by (1) Most Commonly Used to ... , (4) Least Used
Cont .. Table No (44)
2017
Municipality / Sort
اجراءات األسرة لحماة البئة
الترتب/ البلـدة
Environmental protection procedures that the family is willing to do
Al Khor and Al Thakhira
- 93 -
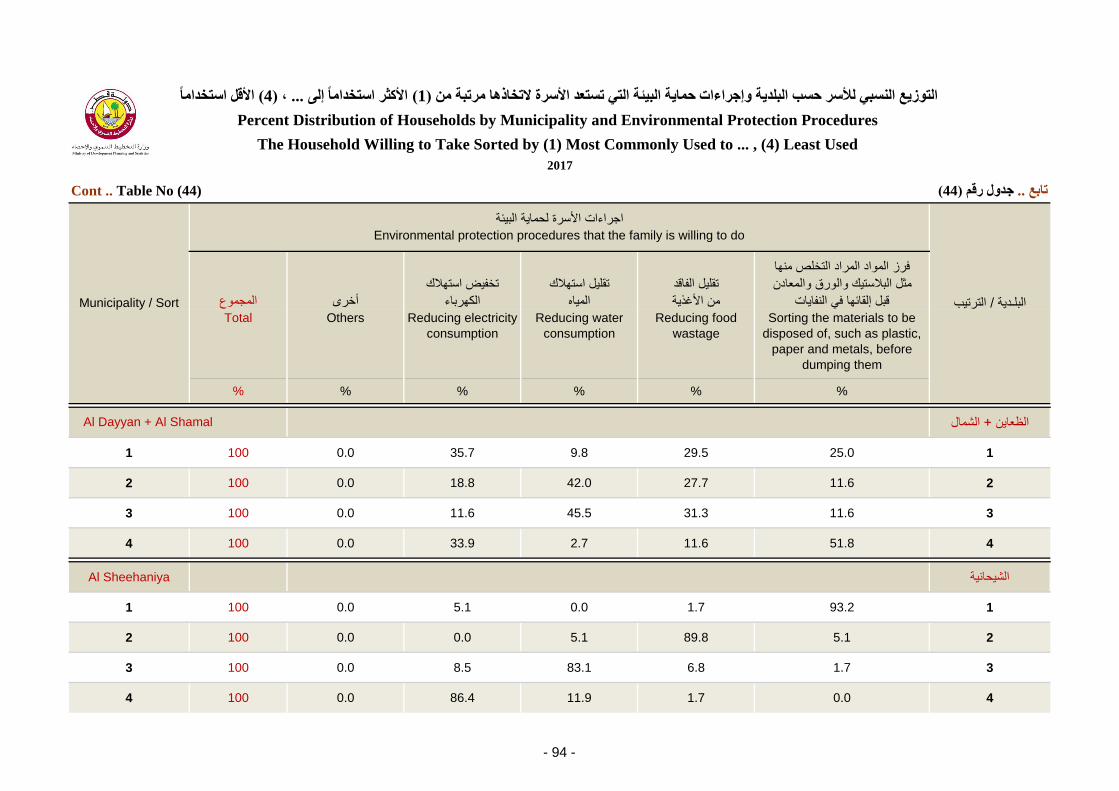
المجموع أخرى
تخفض استهالك
الكهرباء
تقلل استهالك
الماه
تقلل الفاقد
من األغذة
فرز المواد المراد التخلص منها
مثل البالستك والورق والمعادن
قبل إلقائها ف النفااتTotal Others Reducing electricity
consumption
Reducing water
consumption
Reducing food
wastage
Sorting the materials to be
disposed of, such as plastic,
paper and metals, before
dumping them
% % % % % %
الشمال+ الظعان
1 100 0.0 35.7 9.8 29.5 25.0 1
2 100 0.0 18.8 42.0 27.7 11.6 2
3 100 0.0 11.6 45.5 31.3 11.6 3
4 100 0.0 33.9 2.7 11.6 51.8 4
Al Sheehaniya الشحانة
1 100 0.0 5.1 0.0 1.7 93.2 1
2 100 0.0 0.0 5.1 89.8 5.1 2
3 100 0.0 8.5 83.1 6.8 1.7 3
4 100 0.0 86.4 11.9 1.7 0.0 4
األلم استخذايب (4)، ... األكثر استخذايب إنى (1)انتىزغ انسج نألسر زست انجهذخ وإخراءاد زبخ انجئخ انت تستؼذ األسرح التخبرهب يرتجخ ي
Al Dayyan + Al Shamal
Percent Distribution of Households by Municipality and Environmental Protection Procedures
The Household Willing to Take Sorted by (1) Most Commonly Used to ... , (4) Least Used
Cont .. Table No (44) (44)خذول رلى ..تبثغ
Municipality / Sort
اجراءات األسرة لحماة البئة
الترتب/ البلـدة
Environmental protection procedures that the family is willing to do
2017
- 94 -
يهسك
(استبراد انسر )
Appendix
( Survey Questionnaires )


: مسلسل األسرة بالعنة : رقم البلدة للمبنى
: عــدد أفراد األسرة :رقــم الكهـرباء
: مسلسل األسرة داخل الممز : اسم الشارع
: رقم العنقود : رقم المربـع
: مسلسل األسرة داخل العنقود : رقم الشارع
: ممـز العنقود : رقم المنطقة
State of Qatarدولــة قطـــر
وزارة التخطيط التنموي
واإلحصاء
ministry of Development
Planning And Statistics
: اســم ورقـم البـلدة
ستمارة مسـح البيئة المنزليةا
: رقم التلفون : ســــم البـــــاحـــــــث ا
: رقم التلفون : سم رئيس المجموعة ا
: رقم التلفون : ســــم المفتـــــــــــش ا
:رقم التلفون : بالبيانات المدليســم ا : نتـيجـة المـقابلـة : الزيـارة تاريـخ : شــهر الزيــارة
- 97 -

- 98 -

زجاج-6بالستك-5المكون األول
...............................................أخرى ، حدد -8(نباتة أو حوانة)نفاات زراعة -7
المكون الثان
كرتون/ ورق
(األول شر لألكثر أهمة )حدد/ علب ألمونوم -4حفاظات أطفال-3
اختر بالترتب أهم مكونن للنفاات المنزلة حسب الكمة ؟8-2مخلفات طعام-1
متر500أقل من - 400-6 متر400أقل من - 5-300
متر فأكثر7-500
متر100أقل من - 50
متر300أقل من - 200-4 متر200أقل من - 100-3(حاوة صغرة أو كبرة )
-2 متر50أقل من -1كم بعد أقرب مكان لجمع النفاات عن المنزل ؟7
مرةكم مرة تم التخلص من النفاات المنزلة األسبوع الماض ؟5
كغمما هو تقدرك لكمة النفاات الت تم التخلص منها ف المرة الواحدة ؟6
(إلخ .. طعام حوانات ، سماد )استخدامها ألغراض معنة -5الطرقة الثانة
....................................................................................................................................أخرى ، حدد -6(ف حالة عدم وجود مصدرن مكن إختار مصدر واحد )
حرقها
(محرقة )إلقائها ف مكب للنفاات -3الطرقة األولى
إلقائها بشكل عشوائ-4
....................................................................................................................................أخرى ، حدد -4
اختر أهم طرقتن بالترتب تستخدمهما األسرة للتخلص 4
:من النفاات المنزلة
إلقائها ف أقرب حاوة-1
2-
( 5إنتقل إلى )البلدة -2
أحد أفراد األسرة باإلضافة إلى البلدة-3
هنالك بعض اللون أو الطعم أو الرائحة أو الرواسب ولكنها مقبولة: متوسطة -2
هنالك لون أو طعم أو رائحة أو رواسب بشكل كبر: سئة -3ماه االستخدام المنزل ؟
أحد أفراد األسرة-1من قوم بعملة جمع النفاات المنزلة والتخلص منها ؟3
....................................................................................................................................أخرى ، حدد -5
ماه االستخدام المنزل ؟
:كف تجد نوعة 2عدمة اللون والطعم والرائحة والرواسب: جدة -1
ماه الشرب ؟
ماه معدنة-4ماه صحة معبأة-3ماه الشرب ؟
اكتب رقم اإلجابة ف المربع الخال
:ما هو المصدر الرئس للحصول على 1تنكر من مصادر عامة-2شبكة موصلة-1
- 99 -
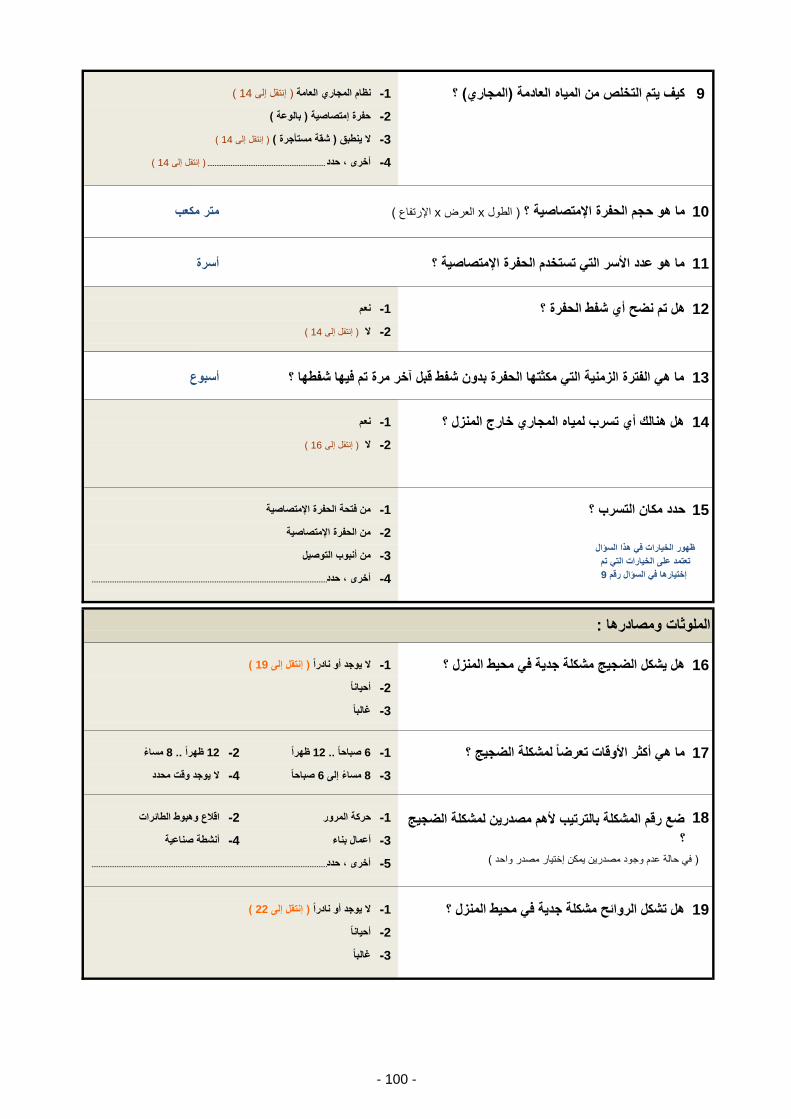
2- أحانا
3- غالبا
....................................................................................................................................أخرى ، حدد -5
( 22إنتقل إلى )ال وجد أو نادرا -1هل تشكل الروائح مشكلة جدة ف محط المنزل ؟19
(ف حالة عدم وجود مصدرن مكن إختار مصدر واحد )
أنشطة صناعة-4أعمال بناء-3
ضع رقم المشكلة بالترتب ألهم مصدرن لمشكلة الضجج 18
؟
-2حركة المرور-1
مساء8.. ظهرا 12
6 مساء إلى 3-8 ال وجد وقت محدد-4 صباحا
اقالع وهبوط الطائرات
2- أحانا
3- غالبا
-2 ظهرا12.. صباحا 6-1ما ه أكثر األوقات تعرضا لمشكلة الضجج ؟17
:الملوثات ومصادرها
( 19إنتقل إلى )ال وجد أو نادرا -1هل شكل الضجج مشكلة جدة ف محط المنزل ؟16
من الحفرة اإلمتصاصة-2
ظهور الخارات ف هذا السؤال
تعتمد على الخارات الت تم
9إختارها ف السؤال رقم
من أنبوب التوصل-3
....................................................................................................................................أخرى ، حدد -4
من فتحة الحفرة اإلمتصاصة-1حدد مكان التسرب ؟15
نعم-1هل هنالك أي تسرب لماه المجاري خارج المنزل ؟14
( 16إنتقل إلى )ال -2
أسبوعما ه الفترة الزمنة الت مكثتها الحفرة بدون شفط قبل آخر مرة تم فها شفطها ؟13
أسرةما هو عدد األسر الت تستخدم الحفرة اإلمتصاصة ؟11
نعم-1هل تم نضح أي شفط الحفرة ؟12
( 14إنتقل إلى ).................................................................. أخرى ، حدد -4
متر مكعب( اإلرتفاع x العرض xالطول )ما هو حجم الحفرة اإلمتصاصة ؟ 10
( 14إنتقل إلى )ال -2
( 14إنتقل إلى )نظام المجاري العامة -1؟ (المجاري)كف تم التخلص من الماه العادمة 9
(بالوعة )حفرة إمتصاصة -2
( 14إنتقل إلى ) (شقة مستأجرة )ال نطبق -3
- 100 -
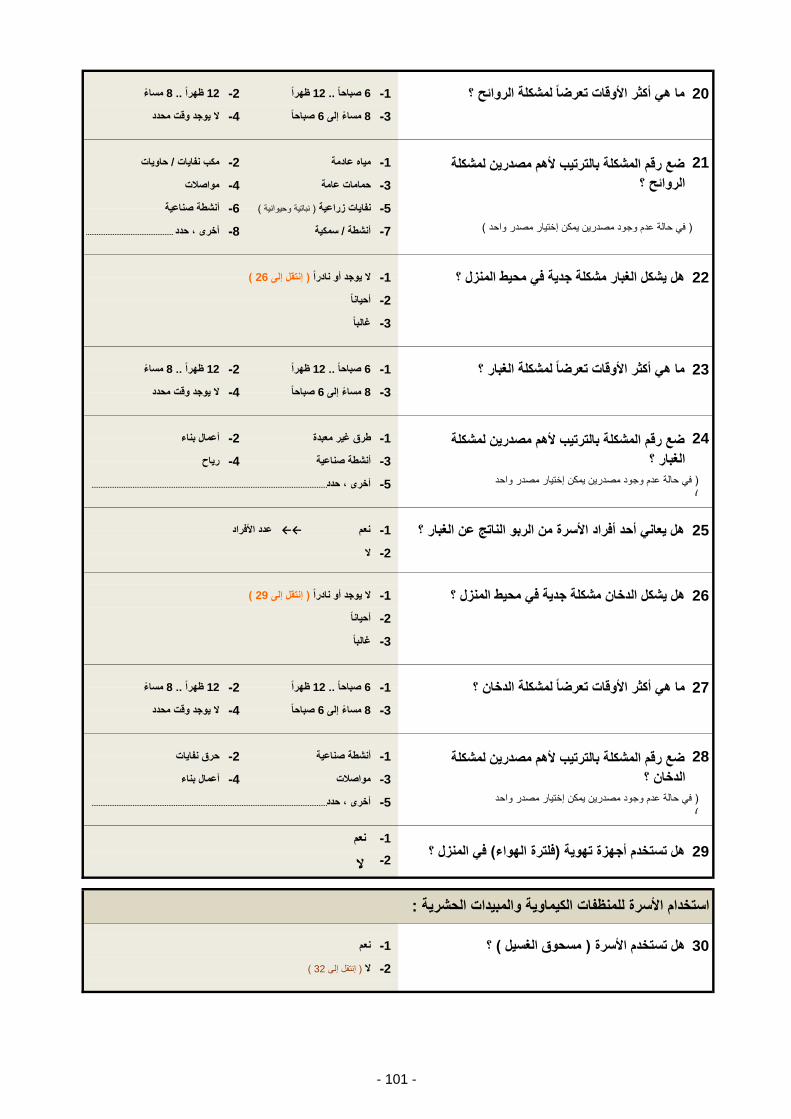
( 32إنتقل إلى )ال -2
ال-2
:استخدام األسرة للمنظفات الكماوة والمبدات الحشرة
نعم-1؟ (مسحوق الغسل )هل تستخدم األسرة 30
ف حالة عدم وجود مصدرن مكن إختار مصدر واحد )
)....................................................................................................................................أخرى ، حدد -5
نعم-1ف المنزل ؟ (فلترة الهواء)هل تستخدم أجهزة تهوة 29
أعمال بناء-4مواصالت-3
ضع رقم المشكلة بالترتب ألهم مصدرن لمشكلة28
الدخان ؟
-2أنشطة صناعة-1
مساء8.. ظهرا 12
6 مساء إلى 3-8 ال وجد وقت محدد-4 صباحا
حرق نفاات
2- أحانا
3- غالبا
-2 ظهرا12.. صباحا 6-1ما ه أكثر األوقات تعرضا لمشكلة الدخان ؟27
ال-2
( 29إنتقل إلى )ال وجد أو نادرا -1هل شكل الدخان مشكلة جدة ف محط المنزل ؟26
ف حالة عدم وجود مصدرن مكن إختار مصدر واحد )
)....................................................................................................................................أخرى ، حدد -5
عدد األفراد ←←نعم -1هل عان أحد أفراد األسرة من الربو الناتج عن الغبار ؟25
راح-4أنشطة صناعة-3
ضع رقم المشكلة بالترتب ألهم مصدرن لمشكلة24
الغبار ؟
-2طرق غر معبدة-1
مساء8.. ظهرا 12
6 مساء إلى 3-8 ال وجد وقت محدد-4 صباحا
أعمال بناء
2- أحانا
3- غالبا
-2 ظهرا12.. صباحا 6-1ما ه أكثر األوقات تعرضا لمشكلة الغبار ؟23
.................................................أخرى ، حدد -8سمكة/ أنشطة -7(ف حالة عدم وجود مصدرن مكن إختار مصدر واحد )
( 26إنتقل إلى )ال وجد أو نادرا -1هل شكل الغبار مشكلة جدة ف محط المنزل ؟22
حاوات/ مكب نفاات
مواصالت-4حمامات عامة-3
أنشطة صناعة-6(نباتة وحوانة )نفاات زراعة -5
ضع رقم المشكلة بالترتب ألهم مصدرن لمشكلة 21
الروائح ؟
-2ماه عادمة-1
مساء8.. ظهرا 12
6 مساء إلى 3-8 ال وجد وقت محدد-4 صباحا
-2 ظهرا12.. صباحا 6-1ما ه أكثر األوقات تعرضا لمشكلة الروائح ؟20
- 101 -

ال وجد-4األهل و األصدقاء-3
....................................................................................................................................أخرى ، حدد -5
غرام فأكثر4-1500
42السعر-2اإلعالنات-1ما ه العوامل المؤثرة الختار األسرة للمبدات ؟
ما ه الكمة المستخدمة من المبدات الحشرة على شكل مسحوق أسبوعا ؟41
غرام1500 وأقل من 1000-3 غرام1000 وأقل من من 500-2 غرام500أقل من -1
مللتر فأكثر1500-4 مللتر1500 وأقل من 1000
( 42إنتقل إلى )ال نعم؟ (المبدات الحشرة على شكل مسحوق )هل تستخدم األسرة 40
1-
البخاخ أسبوعا ؟- ما ه الكمة المستخدمة من المبدات الحشرة السائلة 39
-3 مللتر1000 وأقل من من 500-2 مللتر500أقل من -1
(البخاخ - المبدات الحشرة السائلة )هل تستخدم األسرة 38
؟نعم-1
( 40إنتقل إلى )ال -2
لتر3 وأقل من 2-3 لتر2 وأقل من 1-2أقل من لتر
( 38إنتقل إلى )ال -2
لتر فأكثر4-3
ما ه الكمة المستخدمة من المطهرات الصناعة أسبوعا ؟37
لتر فأكثر4-3
نعم-1؟ (المطهرات الصناعة )هل تستخدم األسرة 36
لتر3 وأقل من 2-3 لتر2 وأقل من 1-2أقل من لتر-1
( 36إنتقل إلى )ال -2
ما ه الكمة المستخدمة من المبض أسبوعا ؟35
لتر فأكثر4-3
نعم-1؟ (المبض )هل تستخدم األسرة 34
لتر3 وأقل من 2-3 لتر2 وأقل من 1-2أقل من لتر-1
( 34إنتقل إلى )ال -2
ما ه الكمة المستخدمة من الصابون السائل أسبوعا ؟33
كغم فأكثر3
نعم-1؟ (الصابون السائل للتنظف )هل تستخدم األسرة 32
كغم3 وأقل من 2 كغم2 وأقل من 1أقل من كغم
ما ه الكمة المستخدمة من مسحوق الغسل أسبوعا ؟31
- 102 -
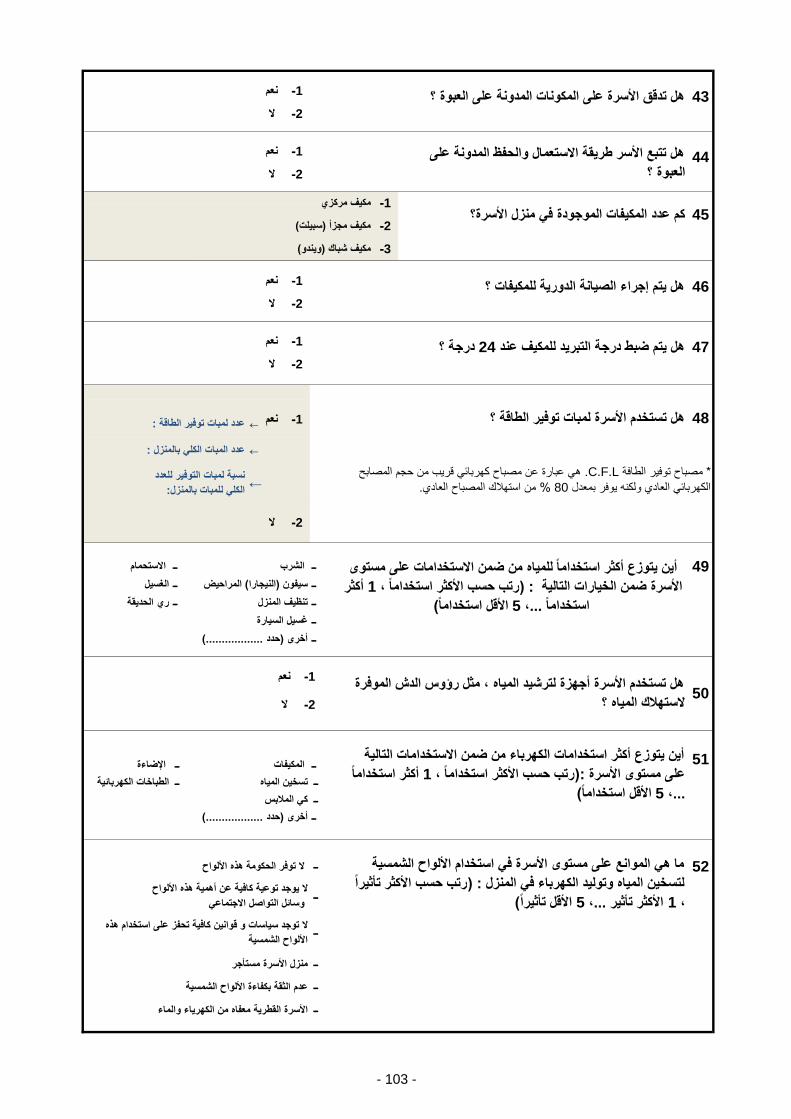
←←
←←
←
ــــ
ــــ
ــــ
ــ
ــ
ــــ
ــــ
ــ
ــ
ــ
األسرة القطرة معفاه من الكهراء والماءــ
ــال توجد ساسات و قوانن كافة تحفز على استخدام هذه
األلواح الشمسة
منزل األسرة مستأجرــ
عدم الثقة بكفاءة األلواح الشمسةــ
(..................حدد )أخرى
ما ه الموانع على مستوى األسرة ف استخدام األلواح الشمسة 52
رتب حسب األكثر تأثرا ): لتسخن الماه وتولد الكهرباء ف المنزل
( األقل تأثرا5، ... األكثر تأثر 1،
ال توفر الحكومة هذه األلواحــ
ال وجد توعة كافة عن أهمة هذه األلواح
وسائل التواصل االجتماع
أن توزع أكثر استخدامات الكهرباء من ضمن االستخدامات التالة 51
أكثر استخداما 1رتب حسب األكثر استخداما ، ):على مستوى األسرة
... ،5 ( األقل استخداما
اإلضاءة المكفات
الطباخات الكهربائةتسخن الماه
ك المالبس
(..................حدد )أخرى
50هل تستخدم األسرة أجهزة لترشد الماه ، مثل رؤوس الدش الموفرة
الستهالك الماه ؟
نعم-1
ال-2
ه عبارة عن مصباح كهربائ قرب من حجم المصابح . C.F.Lمصباح توفر الطافة *
.من استهالك المصباح العادي % 80الكهربائ العادي ولكنه وفر بمعدل نسبة لمبات التوفر للعدد
:الكل للمبات بالمنزل
ال-2
ال-2
أن توزع أكثر استخداما للماه من ضمن االستخدامات على مستوى 49
أكثر 1رتب حسب األكثر استخداما ، ): األسرة ضمن الخارات التالة
5، ...استخداما ( األقل استخداما
االستحمام الشرب
الغسلالمراحض (النجارا)سفون
ري الحدقةتنظف المنزل
غسل السارة
(وندو)مكف شباك -3
نعم-1هل تم إجراء الصانة الدورة للمكفات ؟46
نعم-1هل تستخدم األسرة لمبات توفر الطاقة ؟48
ال-2
نعم-1 درجة ؟24هل تم ضبط درجة التبرد للمكف عند 47
:عدد لمبات توفر الطاقة
:عدد المبات الكل بالمنزل
مكف مركزي-1كم عدد المكفات الموجودة ف منزل األسرة؟45
(سبلت)مكف مجزأ -2
هل تتبع األسر طرقة االستعمال والحفظ المدونة على 44
العبوة ؟
نعم-1
ال-2
نعم-1هل تدقق األسرة على المكونات المدونة على العبوة ؟43
ال-2
- 103 -
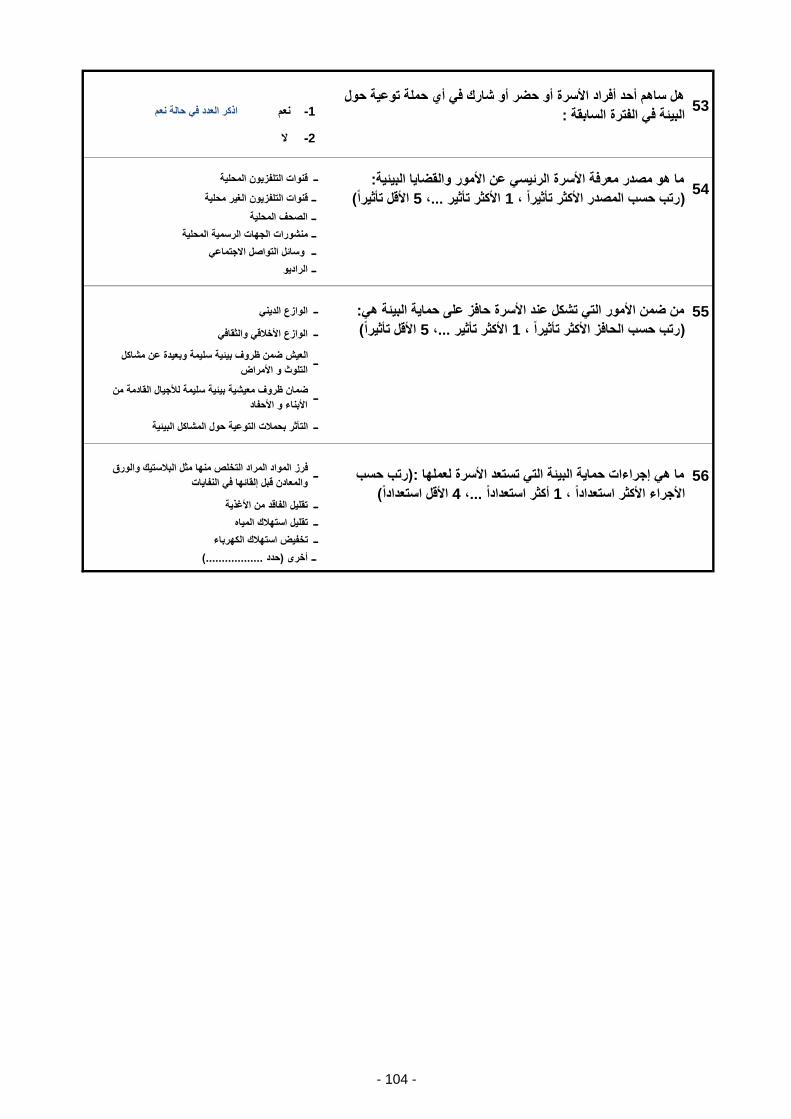
ــ
ــ
ــ
ــ
ــ
ــ
ــ
ــ
ــ
تقلل استهالك الماه
تخفض استهالك الكهرباء
(..................حدد )أخرى
رتب حسب ):ما ه إجراءات حماة البئة الت تستعد األسرة لعملها 56
( األقل استعدادا4، ... أكثر استعدادا 1األجراء األكثر استعدادا ،
ــفرز المواد المراد التخلص منها مثل البالستك والورق
والمعادن قبل إلقائها ف النفاات
تقلل الفاقد من األغذة
ــالعش ضمن ظروف بئة سلمة وبعدة عن مشاكل
التلوث و األمراض
ــضمان ظروف معشة بئة سلمة لألجال القادمة من
األبناء و األحفاد
التأثر بحمالت التوعة حول المشاكل البئةــ
وسائل التواصل االجتماع
الرادو
: من ضمن األمور الت تشكل عند األسرة حافز على حماة البئة ه55
( األقل تأثرا5، ... األكثر تأثر 1رتب حسب الحافز األكثر تأثرا ، )
الوازع الدنــ
الوازع األخالق والثقافــ
ال-2
54: ما هو مصدر معرفة األسرة الرئس عن األمور والقضاا البئة
( األقل تأثرا5، ... األكثر تأثر 1رتب حسب المصدر األكثر تأثرا ، )
قنوات التلفزون المحلةــ
قنوات التلفزون الغر محلة
الصحف المحلة
منشورات الجهات الرسمة المحلة
53هل ساهم أحد أفراد األسرة أو حضر أو شارك ف أي حملة توعة حول
اذكر العدد ف حالة نعمنعم-1:البئة ف الفترة السابقة
- 104 -

Household serial by sample :
Electricity No. : No. of household members :
Block No. : Cluster No.
Street No. :Household serial inside the cluster :
Street Name :Household serial inside the type :
Municipality Building No. :
Zone No. : Cluster Type
State of Qatar
Ministry of Development
Planning and Statistics
Municipality Name and No. :
Interviee Name : Phone No. : Phone No.:
Month of Visit : Date of Visit: Interview Result:
Name of Researcher : Phone No. :
Name of Head of Group : Phone No. :
Name of Inspector : Phone No. :
Questionnaire
The Household environment survey (HES)
- 105 -

- 106 -

1st component 5- Plastic 6- Glass
7-Agricultural waste
(plant/animal)8- Others, specify………………
2nd component
Paper/cardboard
(The first indicates the most important)
3- Diapers 4- Aluminum/iron cans
8
Choose consecutively the most important two
components of household waste in terms of
quantity? 1- Remnants of food 2-
5- 300 - less than 400m 6- 400 - less than 500m
7- 500m or more
5 How many times household waste was disposed last week? Time/s
2- 50 - less than 100m
3- 100 - less than 200m 4- 200 - less than 300m(Small or large container)
6 What is your estimate of the amount of waste disposed each time? Kg
7 How far is the nearest place to dump waste
from home?1- Less than 50m
1st Method 4- Dump randomly
4- Others, specify.......................................................................................
5-Use for specific purposes (animal food, fertiliser,
etc.)2nd Method6- Others, specify.......................................................................................
Water for domestic
use?3- Bad: There is color, taste, smell or sediment heavily
3 Who collects and disposes the household
waste?1- A family member
4 Select the most important two methods used
by the family to get rid of household waste:1- Dump into the nearest garbage container
2-
2- Municipality (skip to No. 5)
3- A family members in addition to the municipality
Burn
3- Dump in the dumpster (incenerator)
5- Others, specify......................................................................................Water for domestic
use?
2 How do you find the quality of:1- Good: colorless, tasteless, odorless and no sediments
Drinking water? 2-Moderate: There is some color, taste, odor or sediment,
but acceptable
Drinking water? 3- Bottled Water 4- Mineral Water
Write your answer in the empty box
1 What is the main source of:1- Water Network 2-
Tanker from Public
Sources
- 107 -
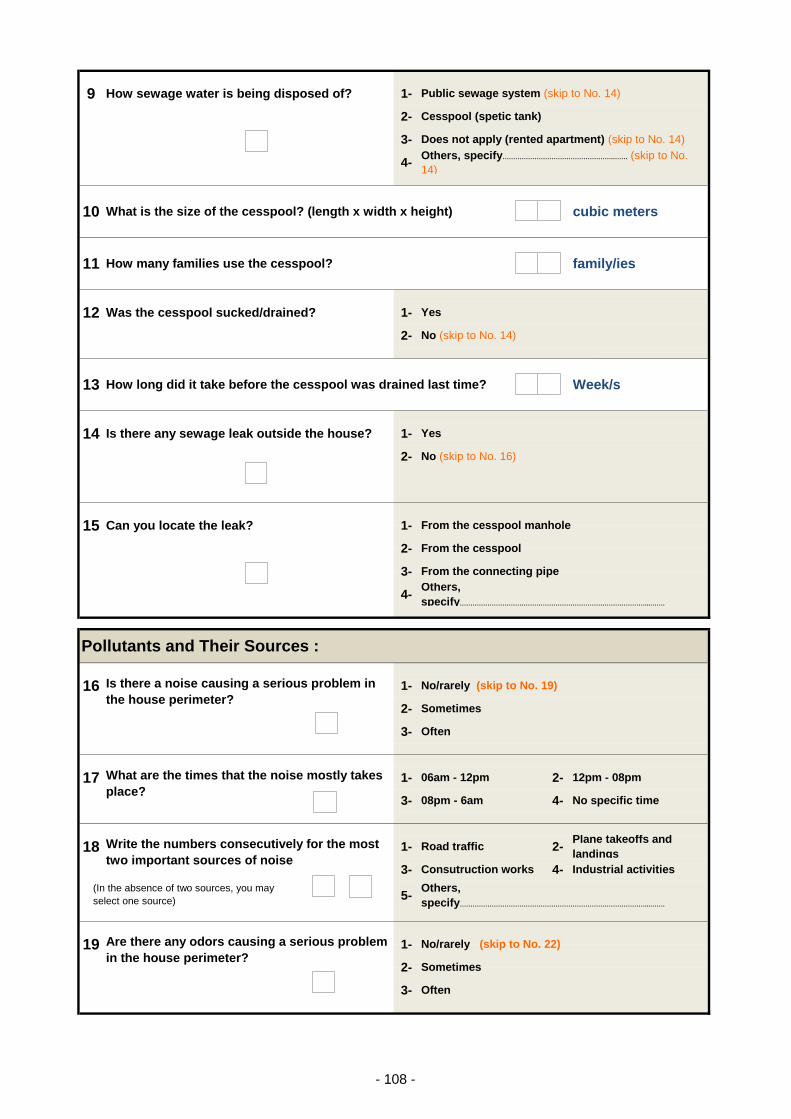
3- Often
(In the absence of two sources, you may
select one source) 5-Others,
specify……………………………………………………………………………...…….
19 Are there any odors causing a serious problem
in the house perimeter?1- No/rarely (skip to No. 22)
2- Sometimes
Plane takeoffs and
landings
3- Consutruction works 4- Industrial activities
18 Write the numbers consecutively for the most
two important sources of noise1- Road traffic 2-
3- 08pm - 6am 4- No specific time
Sometimes
3- Often
17 What are the times that the noise mostly takes
place?1- 06am - 12pm 2- 12pm - 08pm
4-Others,
specify……………………………………………………………………………...…….
Pollutants and Their Sources :
16 Is there a noise causing a serious problem in
the house perimeter?1- No/rarely (skip to No. 19)
2-
2- From the cesspool
3- From the connecting pipe
15 Can you locate the leak? 1- From the cesspool manhole
2- No (skip to No. 16)
2- No (skip to No. 14)
13 How long did it take before the cesspool was drained last time? Week/s
12 Was the cesspool sucked/drained? 1- Yes
14 Is there any sewage leak outside the house? 1- Yes
4-Others, specify…………………………………………….……. (skip to No.
14)
10 What is the size of the cesspool? (length x width x height) cubic meters
11 How many families use the cesspool? family/ies
9 How sewage water is being disposed of? 1- Public sewage system (skip to No. 14)
2- Cesspool (spetic tank)
3- Does not apply (rented apartment) (skip to No. 14)
- 108 -
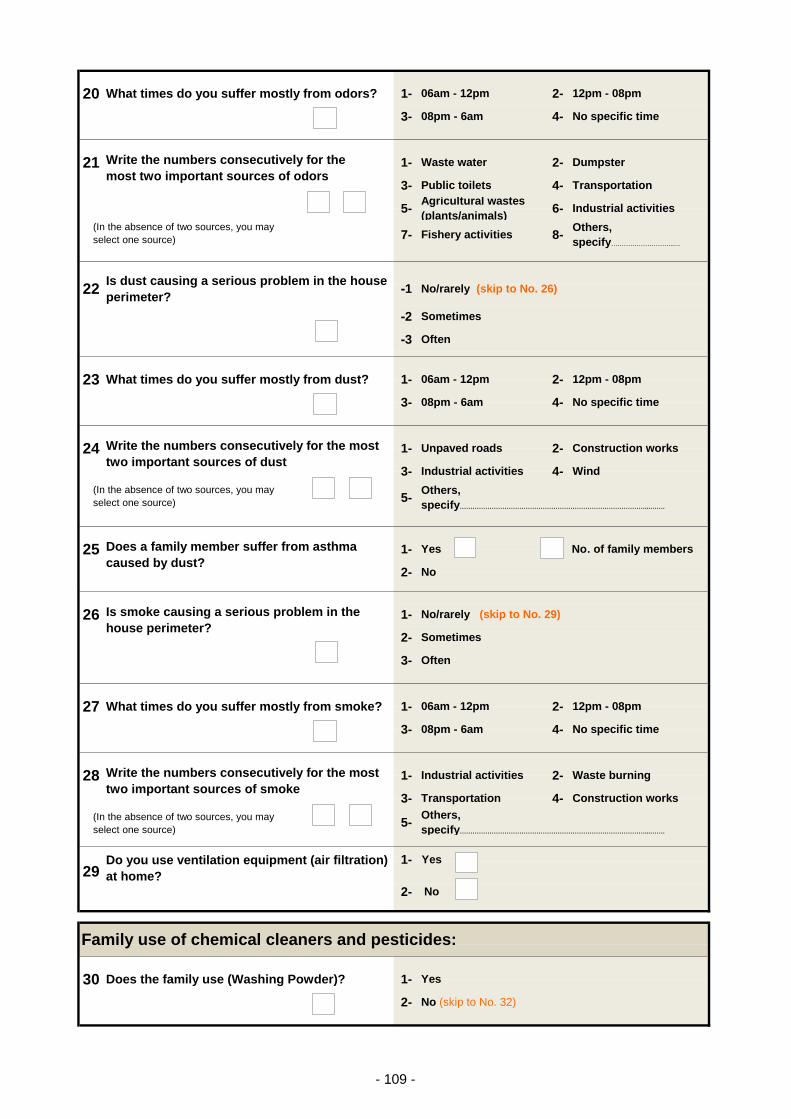
2- No (skip to No. 32)
Family use of chemical cleaners and pesticides:
30 Does the family use (Washing Powder)? 1- Yes
29
2- No
(In the absence of two sources, you may
select one source)5-
Others,
specify……………………………………………………………………………...…….
Do you use ventilation equipment (air filtration)
at home?
1- Yes
Waste burning
3- Transportation 4- Construction works
28 Write the numbers consecutively for the most
two important sources of smoke1- Industrial activities 2-
3- 08pm - 6am 4- No specific time
3- Often
27 What times do you suffer mostly from smoke? 1- 06am - 12pm 2- 12pm - 08pm
26 Is smoke causing a serious problem in the
house perimeter?1- No/rarely (skip to No. 29)
2- Sometimes
(In the absence of two sources, you may
select one source) 5-Others,
specify……………………………………………………………………………...…….
25 Does a family member suffer from asthma
caused by dust?1- Yes No. of family members
2- No
3- Industrial activities 4- Wind
24 Write the numbers consecutively for the most
two important sources of dust1- Unpaved roads 2-
12pm - 08pm
3- 08pm - 6am 4- No specific time
Construction works
2- Sometimes
3- Often
23 What times do you suffer mostly from dust? 1- 06am - 12pm 2-
(In the absence of two sources, you may
select one source) 7- Fishery activities 8-Others,
specify………………………...…
22Is dust causing a serious problem in the house
perimeter?1- No/rarely (skip to No. 26)
Dumpster
3- Public toilets 4- Transportation
5-Agricultural wastes
(plants/animals)6- Industrial activities
21 Write the numbers consecutively for the
most two important sources of odors1- Waste water 2-
3- 08pm - 6am 4- No specific time
20 What times do you suffer mostly from odors? 1- 06am - 12pm 2- 12pm - 08pm
- 109 -

3- Family and friends 4- None
5-Others,
specify……………………………………………………………………………...…….
4- 1500GM or more
42 What are the factors influencing the
family choice of pesticides above? 1- Ads 2- Price
41 What is the amount used of powder pesticides per week?
1-Less than
500GM2- 500 less than 1000GM 3-
1000 less than
1500GM
40 Does the family use (powder pesticides)? Yes No (skip to No.45)
1-Less than
500ML2- 500 less than 1000ML 3- 1000 less than 1500ML
2- No (skip to No. 40)
39 What is the amount used of liquid/spray pesticides per week?
4- 1500ML or more
4- 3 liters or more
38 Does the family use (liquid/spray pesticides)? 1- Yes
1- Less than 1 liter 2- 1 less than 2 liters 3- 2 Less than 3 liters
2- No (skip to No. 38)
37 What is the amount used of industrial disinfectants per week?
4- 3 liters or more
36 Does the family use (industrial disinfectants)? 1- Yes
1- Less than 1 liter 2- 1 less than 2 liters 3- 2 - Less than 3 liters
2- No (skip to No. 36)
35 What is the amount used of bleacher per week?
4- 3 liters or more
34 Does the family use (bleacher)? 1- Yes
1- Less than 1 liter 2- 1 less than 2 liters 3- 2 Less than 3 liters
2- No (skip to No. 34)
33 What is the amount used of liquid soap per week?
3 Kgs or more
32 Does the family use (liquid soap)? 1- Yes
Less than 1 Kg 1 less than 2 Kgs 2 Less than 3 Kgs
31 What is the amount used of washing powder a week?
- 110 -
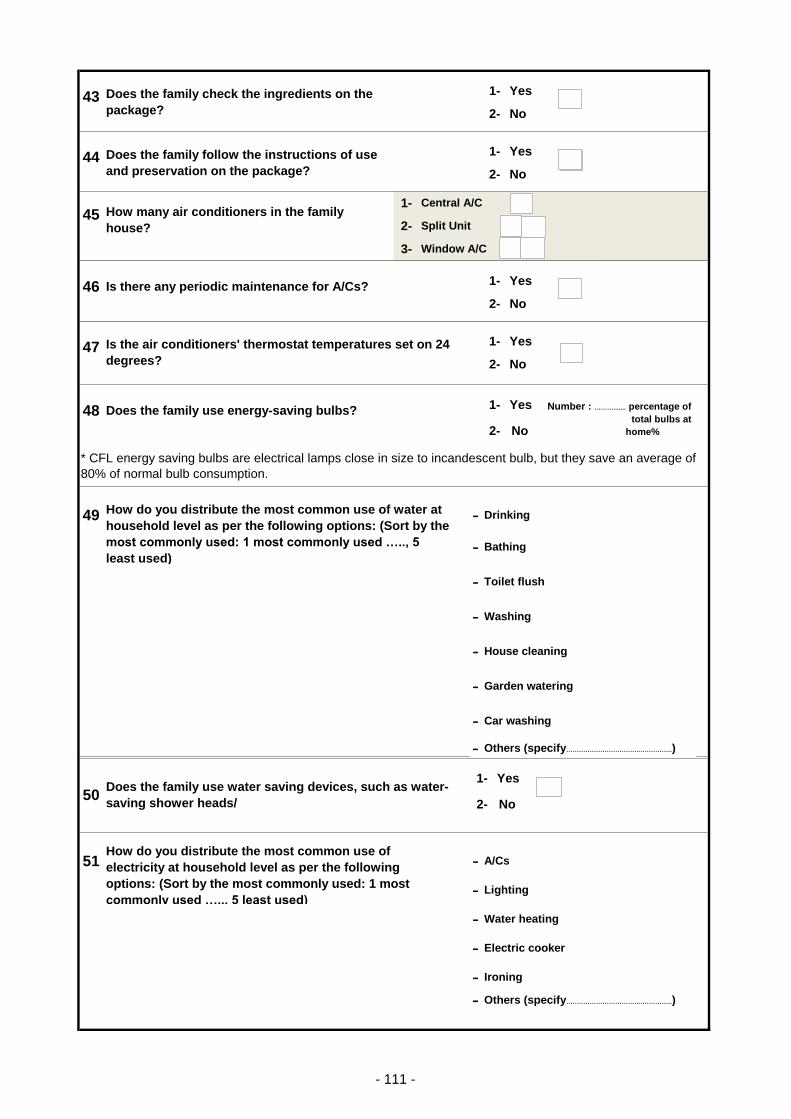
ــ Others (specify…………………………….…………….)
ــ Water heating
ــ Electric cooker
ــ Ironing
51How do you distribute the most common use of
electricity at household level as per the following
options: (Sort by the most commonly used: 1 most
commonly used ….., 5 least used(
ــ A/Cs
ــ Lighting
50Does the family use water saving devices, such as water-
saving shower heads/
1- Yes
2- No
ــ Garden watering
ــ Car washing
ــ Others (specify…………………………….…………….)
ــ Toilet flush
ــ Washing
ــ House cleaning
Number : ………....... percentage of
total bulbs at
home%2- No
* CFL energy saving bulbs are electrical lamps close in size to incandescent bulb, but they save an average of
80% of normal bulb consumption.
47 Is the air conditioners' thermostat temperatures set on 24
degrees?
1- Yes
2-
49 How do you distribute the most common use of water at
household level as per the following options: (Sort by the
most commonly used: 1 most commonly used ….., 5
least used)
ــ Drinking
ــ
No
48 Does the family use energy-saving bulbs? 1- Yes
Bathing
3- Window A/C
46 Is there any periodic maintenance for A/Cs? 1- Yes
2- No
1- Central A/C45 How many air conditioners in the family
house? 2- Split Unit
44 Does the family follow the instructions of use
and preservation on the package?
1- Yes
2- No
43 Does the family check the ingredients on the
package?
1- Yes
2- No
- 111 -

ــ
ــ
ــ
ــ
ــ
ــ
ــ
ــ Others (specify………………….…………….)
ــ Reducing food wastage
ــ Reducing water consumption
ــ Reducing electricity consumption
Living in a sound environmenal
conditions away from pollution and
diseases
ــ Ensuring sound environmental living
conditions for future generations
ــ Vulnerability to environment
awareness campaigns
56 What are the environmental protection measures that the
family is willing to take: (Sort by most willing: 1 most
willing ...., 5 least willing)
ــ Sorting the disposed materials such
as plastic, paper and metals, before
dumping them.
Local newspapers
Local official publications
Social media
Radio
55 Among the things that motivate the family to protect the
environment are: (Sort by most influential incentive: 1
most influential …...., 5 least influential(
ــ Religion
Morals and culture
2- No
54What is the main source of family knowledge about
environmental issues: (Sort by most influential source:
1 most influential ….., 5 least influential(
ــ Local TV channels
Non-local TV channels
ــ Qatari Family is exempted from
electricity and water bills
53Did a family member contributed to, attended or
participated in any environment awareness campaign
previously?1- Yes
If Yes, state number
of campaigns
ــ There are no enough laws and
policies to stimulate the use of these
solar panels
ــ Family house is rented
ــ Do no trust efficiency of solar panels
52What are the barriers at household level for the use of
solar panels to heat water and generate electricity at
home: (Sort by most influential: 1 most influential
………, 5 least influential(?
ــ The government does not provide
these panels
ــ There is no enough awareness about
the importance of these panels via
social media"
- 112 -