Embed Size (px)
Citation preview
Financial Crisis Report
For Financial Crisis Inquire Commission
by
Markus K. Brunnermeier
Part I: Deciphering the Liquidity and Credit Crunch (based on JEP article)
Part II: Special Section on
Derivatives, Collateralized Lending and
Complex Financial Instruments
Deciphering the Liquidity and Credit Crunch 2007-08
Markus K. Brunnermeier*
Abstract:
This paper summarizes and explains the main events of the liquidity and credit crunch in 2007-08.
Starting with the trends leading up to the crisis, I explain how these events unfolded and how four
different amplification mechanisms magnified losses in the mortgage market into large dislocations and
turmoil in financial markets.
* My views were shaped by conversations with Viral Acharya, Tobias Adrian, Franklin Allen, Patrick Bolton, Michael
Brennan, Smita Brunnermeier, Sylvain Champonnois, Ing-Haw Cheng, John Cochrane, Doug Diamond, Jacob
Goldfield, Joel Hasbrouck, John Kambhu, Arvind Krishnamurthy, Augustin Landier, David Lando, Jamie McAndrews,
Konstantin Milbradt, Stefan Nagel, Filippos Papakonstantinou, Lasse Pedersen, Lucas van Praag, Raghu Rajan,
Ricardo Reis, José Scheinkman, Til Schuermann, Hyun Shin, James Vickery, Glen Weyl, Wei Xiong, and Moto Yogo.
Special thanks go to the editors, James Hines, Andrei Shleifer, Jeremy Stein, and Timothy Taylor, and also to Martin
Oehmke. Rachel Goodwin, Martin Schmalz, and Hao Wu provided excellent research assistance. I am grateful for
financial support from the Alfred P. Sloan Foundation.
The financial market turmoil in 2007 and 2008 has led to the most severe financial crisis since
the Great Depression and threatens to have large repercussions on the real economy. The bursting of
the housing bubble forced banks to write down several hundred billion dollars in bad loans caused by
mortgage delinquencies. At the same time, the stock market capitalization of the major banks declined
by more than twice as much. While the overall mortgage losses are large on an absolute scale, they are
still relatively modest compared to the $8 trillion of U.S. stock market wealth lost between October
2007, when the stock market reached an all-time high, and October 2008. This paper attempts to
explain the economic mechanisms that caused losses in the mortgage market to amplify into such large
dislocations and turmoil in the financial markets, and describes common economic threads that explain
the plethora of market declines, liquidity dry-ups, defaults and bailouts that occurred after the crisis
broke in summer 2007.
To understand these threads, it is useful to recall some key factors leading up to the housing
bubble. The U.S. economy was experiencing a low interest-rate environment, both because of large
capital inflows from abroad, especially from Asian countries, and because the Federal Reserve had
adopted a lax interest rate policy. Asian countries bought U.S. securities both to peg the exchange rates
on an export-friendly level and to hedge against a depreciation of their own currency against the dollar,
a lesson learned from South-East Asia crisis in the late 1990s. The Federal Reserve Bank feared a
deflationary period after the bursting of the Internet bubble and thus did not counteract the buildup of
the housing bubble. At the same time, the banking system underwent an important transformation. The
traditional banking model, in which the issuing banks hold loans until they are repaid, was replaced by
the “originate and distribute” banking model, in which loans are pooled, tranched and then resold via
securitization. The creation of new securities facilitated the large capital inflows from abroad. The first
part of the paper describes this trend towards the “originate and distribute” model and how it
ultimately led to a decline in lending standards. Financial innovation that had supposedly made the
banking system more stable by transferring risk to those most able to bear it led to an unprecedented
credit expansion that helped feed the boom in housing prices.
The second part of the paper provides an event logbook of the financial market turmoil in 2007-
08, ending with the start of the coordinated international bailout in October 2008. The third part
explores four economic mechanisms through which the mortgage crisis amplified into a severe financial
crisis: 1) Borrowers’ balance sheet effects cause two “liquidity spirals.” When asset prices drop financial
institutions’ capital erodes and, at the same time, lending standards and margins tighten. Both effects
cause fire-sales, pushing down prices and tightening funding even further. 2) The Lending channel can
dry up when banks become concerned about their future access to capital markets and start hoarding
funds (even if the creditworthiness of borrowers does not change). 3) Runs on financial institutions, like
those that occurred at Bear Stearns, Lehman Brothers, and Washington Mutual, can cause a sudden
erosion of bank capital. 4) Network effects can arise when financial institutions are lenders and
borrowers at the same time. In particular, a gridlock can occur in which multiple trading parties fail to
cancel out offsetting positions because of concerns about counterparty credit risk. To protect
themselves against the risks that are not netted out, each party has to hold additional funds.
Banking Industry Trends Leading Up to the Liquidity Squeeze
Two trends in the banking industry contributed significantly to the lending boom and housing
frenzy that laid the foundations for the crisis. First, instead of holding loans on banks’ balance sheets,
banks moved to an “originate and distribute” model. Banks repackaged loans and passed them on to
various other financial investors, thereby off-loading risk. Second, banks increasingly financed their asset
holdings with shorter maturity instruments. This change left banks particularly exposed to a dry-up in
funding liquidity.
Securitization: Credit Protection, Pooling, and Tranching Risk
To offload risk, banks typically create “structured” products often referred to as collateralized
debt obligations (CDOs). The first step is to form diversified portfolios of mortgages and other types of
loans, corporate bonds, and other assets like credit card receivables. The next step is to slice these
portfolios into different tranches. These tranches are then sold to investor groups with different
appetites for risk. The safest tranche—known as the “super senior tranche”—offers investors a
(relatively) low interest rate, but it is the first to be paid out of the cash flows of the portfolio. In
contrast, the most junior tranche—referred to as the “equity tranche” or “toxic waste”—will be paid
only after all other tranches have been paid. The mezzanine tranches are between these extremes.
Legally, the portfolio is usually transferred to a “special purpose vehicle,” a financial entity whose sole
purpose is to collect principal and interest cash flows from the underlying assets and pass them on to
the owners of the various tranches.
The exact cutoffs between the tranches are typically chosen to ensure a specific rating for each
tranche. For example, the top tranches are constructed to receive a AAA rating. The more senior
tranches are then sold to various investors, while the toxic waste is usually (but not always) held by the
issuing bank, to ensure that it adequately monitors the loans.
Buyers of these tranches or regular bonds can also protect themselves by purchasing credit
default swaps (CDS), which are contracts insuring against the default of a particular bond or tranche. The
buyer of these contracts pays a periodic fixed fee in exchange for a contingent payment in the event of
credit default. Estimates of the gross notional amount of outstanding credit default swaps in 2007 range
from $45 trillion to $62 trillion. One can also directly trade indices that consist of portfolios of credit
default swaps, such as the CDX in the United States or iTraxx in Europe. Anyone who purchased a AAA-
rated tranche of a collateralized debt obligation, combined with a credit default swap, had reason to
believe that the investment had low risk, because the probability of the CDS counterparty defaulting
was considered to be small.
Shortening the Maturity Structure to Tap Into Demand from Money Market Funds
Most investors prefer assets with short maturities, such as short-term money market funds. It
allows them to withdraw funds at short notice to accommodate their own funding needs (for example,
Diamond and Dybvig, 1983; Allen and Gale, 2007) or it can serve as a commitment device to discipline
banks with the threat of possible withdrawals (as in Calomiris and Kahn, 1991; Diamond and Rajan,
2001). Funds might also opt for short-term financing to signal their confidence in their ability to perform
(Stein, 2005). On the other hand, most investment projects and mortgages have maturities measured in
years or even decades. In the traditional banking model, commercial banks financed these loans with
deposits that could be withdrawn at short notice.
The same maturity mismatch was transferred to a “shadow” banking system consisting of off-
balance-sheet investment vehicles and conduits. These structured investment vehicles raise funds by
selling short-term asset-backed commercial paper with an average maturity of 90 days and medium-
term notes with an average maturity of just over one year, primarily to money market funds. The short-
term assets are called “asset backed” because they are backed by a pool of mortgages or other loans as
collateral. In the case of default, owners of the asset-backed commercial paper have the power to seize
and sell the underlying collateral assets. Asset-backed commercial paper had become the dominant
form of outstanding commercial paper by the start of 2006.
The strategy of off-balance-sheet vehicles—investing in long-term assets and borrowing with
short-term paper—exposes the banks to funding liquidity risk: Investors might suddenly stop buying
asset-backed commercial paper, preventing these vehicles from rolling over their short-term debt. To
ensure funding liquidity for the vehicle, the sponsoring bank grants a credit line to the vehicles, called a
“liquidity backstop.” As a result, the banking system still bears the liquidity risk from holding long-term
assets and making short-term loans even though it does not appear on the banks’ balance sheets.
Another important trend was that the maturity mismatch on the balance sheet of investment
banks increased. This change was the result of a move towards financing balance sheets with short-term
repurchase agreements, or “repos.” In a repo contract, a firm borrows funds by selling a collateral asset
today and promising to repurchase it at a later date. The growth in repo financing as a fraction of
investment banks' total assets is mostly due to an increase in overnight repos. The fraction of total
investment bank assets were financed by overnight repos roughly doubled from 2000 to 2007. Term
repos with a maturity of up to three months have stayed roughly constant at as a fraction of total assets.
This greater reliance on overnight financing required investment banks to roll over a large part of their
funding on a daily basis.
In summary, leading up to the crisis, commercial and investment banks were heavily exposed to
maturity mismatch both through granting liquidity backstops to their off-balance sheet vehicles and
through their increased reliance on repo financing. Any reduction in funding liquidity could thus lead to
significant stress for the financial system, as we witnessed starting in the summer of 2007.
Rise in Popularity of Securitized and Structured Products
Structured financial products can cater to the needs of different investor groups. Risk can be
shifted to those who wish to bear it, and it can be widely spread among many market participants. This
allows for lower mortgage rates and lower interest rates on corporate and other types of loans. Besides
lower interest rates, securitization allows certain institutional investors to hold assets (indirectly) that
they were previously prevented from holding by regulatory requirements. For example, certain money
market and pension funds that were allowed to invest only in AAA-rated fixed-income securities could
now also invest in a AAA-rated senior tranche of a portfolio constructed from BBB-rated securities.
However, a large part of the credit risk never left the banking system, since banks, including
sophisticated investment banks, were among the most active buyers of structured products (see for
example, Duffie, 2008). This suggests that other, perhaps less worthy motives were also at work in
encouraging the creation and purchase of these assets.
In hindsight, it is clear that one distorting force leading to the popularity of structured
investment vehicles was regulatory and ratings arbitrage. The Basel I accord (an international
agreement that sets guidelines for bank regulation) required that banks hold capital of at least 8 percent
of the loans on their balance sheets; this capital requirement (called a “capital charge”) was much lower
for contractual credit lines. Moreover, there was no capital charge at all for “reputational” credit lines—
noncontractual liquidity backstops that sponsoring banks provided to structured investment vehicles to
maintain their reputation. Thus, moving a pool of loans into off-balance-sheet vehicles, and then
granting a credit line to that pool to ensure a AAA-rating, allowed banks to reduce the amount of capital
they needed to hold to conform with Basel I regulations while the risk for the bank remained essentially
unchanged. The subsequent Basel II accord, which went into effect on January 1, 2007, in Europe but is
yet to be fully implemented in the United States, took some steps to correct this preferential treatment
of noncontractual credit lines, but with little effect. While Basel II implemented capital charges based on
asset ratings, banks were able to reduce their capital charges by pooling loans in off-balance-sheet
vehicles. Because of the reduction of idiosyncratic risk through diversification, assets issued by these
vehicles received a better rating than did the individual securities in the pool.1 In addition, issuing short-
term assets improved the overall rating even further, since banks sponsoring these structured
investment vehicles were not sufficiently downgraded for granting liquidity backstops.
Moreover, in retrospect, the statistical models of many professional investors and credit-rating
agencies provided overly optimistic forecasts about structured finance products. One reason is that
these models were based on historically low mortgage default and delinquency rates. More importantly,
past downturns in housing prices were primarily regional phenomena—the United States had not
1 To see this, consider a bank that hypothetically holds two perfectly negatively correlated BBB-rated assets. If it
were to hold the assets directly on its books it would face a high capital charge. On the other hand, if it were to
bundle both assets in an SIV, the SIV could issue essentially risk-free AAA-rated assets which the bank can hold on
its books at near zero capital charge.
experienced a nationwide decline in housing prices in the period following World War II. The assumed
low cross-regional correlation of house prices generated a perceived diversification benefit that
especially boosted the valuations of AAA-rated tranches, as explained in Coval, Jurek, and Stafford
(2009).
In addition, structured products may have received more favorable ratings compared to
corporate bonds because rating agencies collected higher fees for structured products. ''Rating at the
edge'' might also have contributed to favorable ratings of structured products versus corporate bonds.
While a AAA-rated bond represents a band of risk ranging from a near-zero default risk to a risk that just
makes it into the AAA-rated group, banks worked closely with the rating agencies to ensure that AAA
tranches were always sliced in such a way that they just crossed the dividing line to reach the AAA
rating. As a consequence, CDO tranches must be downgraded when an incremental change in the
underlying default probabilities or correlations occurs. Fund managers “searching for yield” were
attracted to buying structured products because they seemingly offered high expected high returns with
a small probability of catastrophic loss. When the risk-free interest rate is low, this type of investment
will be especially attractive to fund managers, whose compensations are linked to a percentage share of
the upside but do not become negative in the event of losses.2 In addition, some fund managers may
have favored the relatively illiquid junior tranches precisely because they trade so infrequently and were
therefore hard to value. These managers could make their monthly returns appear attractively smooth
over time because they had some flexibility with regard to when they could revalue their portfolios.
Consequences: Cheap Credit and the Housing Boom
The rise in popularity of securitized products ultimately led to a flood of cheap credit, and
lending standards fell. Because a substantial part of the risk will be borne by other financial institutions,
banks essentially faced only the “pipeline risk” of holding a loan for some months until the risks were
passed on, so they had little incentive to take particular care in approving loan applications and
monitoring loans. Keys et al. (2008) offer empirical evidence that increased securitization led to a
decline in credit quality. Mortgage brokers offered teaser rates, no-documentation mortgages,
2 The risk-free rate determines the position of the kink of this call-option-like payoff structure. In an environment
with a high risk-free interest rate, the fund manager can essentially guarantee a positive payoff just by investing in
the risk-free asset. By following a riskier strategy, he puts this payoff at risk. When the interest rate is close to zero,
this “guaranteed payoff” is very small, so the manager has less to lose from taking on the additional risk.
piggyback mortgages (a combination of two mortgages that eliminates the need for a down payment),
and NINJA (“no income, no job or assets”) loans. All these mortgages were granted under the premise
that background checks are unnecessary because house prices could only rise, and a borrower could
thus always refinance a loan using the increased value of the house.
This combination of cheap credit and low lending standards resulted in the housing frenzy that
laid the foundations for the crisis. By early 2007, many observers were concerned about the risk of a
“liquidity bubble” or “credit bubble” (for example, Berman, 2007). However, they were reluctant to bet
against the bubble. As in the theoretical model of Abreu and Brunnermeier (2002, 2003), it was
perceived to be more profitable to ride the wave than to lean against it. Nevertheless, there was a
widespread feeling that the day of reckoning would eventually come. Citigroup’s former chief executive
officer, Chuck Prince, summed up the situation on July 10, 2007 by referring to Keynes’s analogy
between bubbles and musical chairs (Nakamoto and Wighton, 2007): “When the music stops, in terms
of liquidity, things will be complicated. But as long as the music is playing, you’ve got to get up and
dance. We’re still dancing.” This game of musical chairs, combined with the vulnerability of banks to
dry-ups in funding liquidity, ultimately unfolded into the crisis that began in 2007.
The Unfolding of the Crisis: Event Logbook
The Subprime Mortgage Crisis
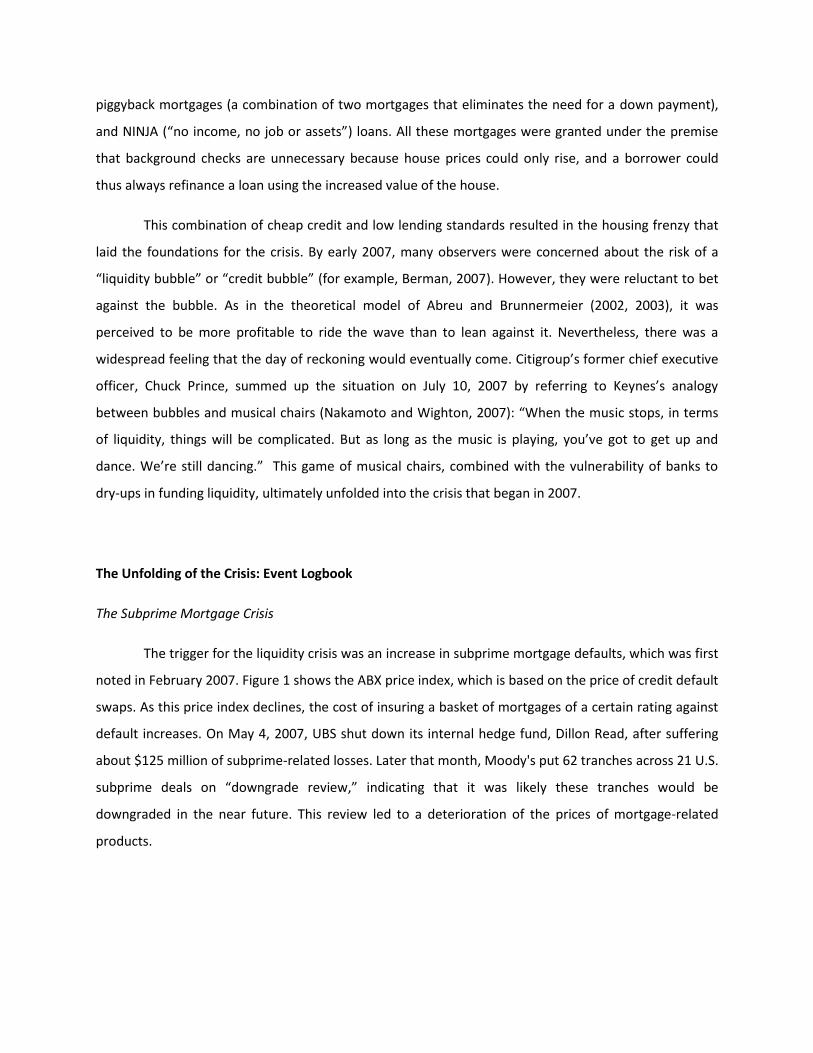
The trigger for the liquidity crisis was an increase in subprime mortgage defaults, which was first
noted in February 2007. Figure 1 shows the ABX price index, which is based on the price of credit default
swaps. As this price index declines, the cost of insuring a basket of mortgages of a certain rating against
default increases. On May 4, 2007, UBS shut down its internal hedge fund, Dillon Read, after suffering
about $125 million of subprime-related losses. Later that month, Moody's put 62 tranches across 21 U.S.
subprime deals on “downgrade review,” indicating that it was likely these tranches would be
downgraded in the near future. This review led to a deterioration of the prices of mortgage-related
products.
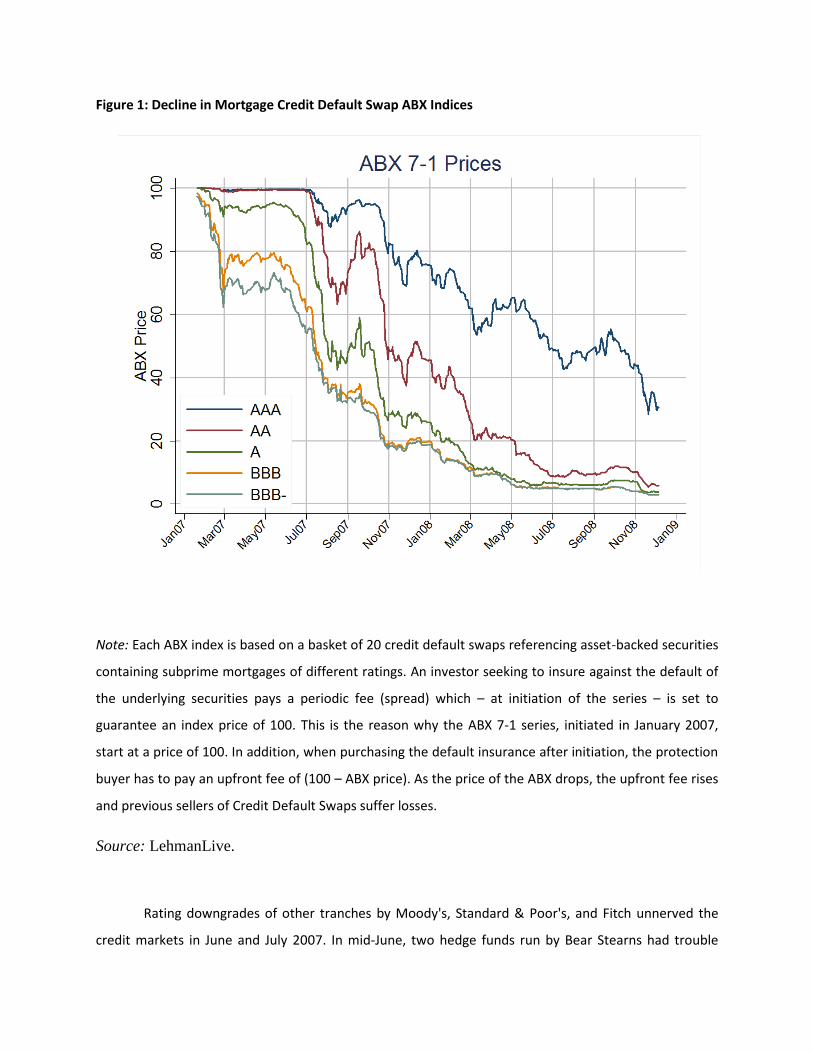
Figure 1: Decline in Mortgage Credit Default Swap ABX Indices
Note: Each ABX index is based on a basket of 20 credit default swaps referencing asset-backed securities
containing subprime mortgages of different ratings. An investor seeking to insure against the default of
the underlying securities pays a periodic fee (spread) which – at initiation of the series – is set to
guarantee an index price of 100. This is the reason why the ABX 7-1 series, initiated in January 2007,
start at a price of 100. In addition, when purchasing the default insurance after initiation, the protection
buyer has to pay an upfront fee of (100 – ABX price). As the price of the ABX drops, the upfront fee rises
and previous sellers of Credit Default Swaps suffer losses.
Source: LehmanLive.
Rating downgrades of other tranches by Moody's, Standard & Poor's, and Fitch unnerved the
credit markets in June and July 2007. In mid-June, two hedge funds run by Bear Stearns had trouble
meeting margin calls, leading Bear Stearns to inject $3.2 billion in order to protect its reputation. Then a
major U.S. home loan lender, Countrywide Financial Corp., announced an earnings drop on July 24. And
on July 26, an index from the National Association of Home Builders revealed that new home sales had
declined 6.6 percent year-on-year, and the largest U.S. homebuilder reported a loss in that quarter.
From then through late in 2008, house prices and sales continued to drop.
Asset-Backed Commercial Paper
In July 2007, amid widespread concern about how to value structured products and an erosion
of confidence in the reliability of ratings, the market for short-term asset-backed commercial paper
began to dry up. As Figure 2 shows, the market for non-asset-backed commercial paper (be it financial
or nonfinancial) during this time was affected only slightly—which suggests that the turmoil was driven
primarily by mortgage-backed securities.
IKB, a small German bank, was the first European victim of the subprime crisis. In July 2007, its
conduit was unable to roll over asset-backed commercial paper and IKB proved unable to provide the
promised credit line. After hectic negotiations, a €3.5 billion rescue package involving public and private
banks was announced. On July 31, American Home Mortgage Investment Corp. announced its inability
to fund lending obligations, and it subsequently declared bankruptcy on August 6. On August 9, 2007,
the French bank BNP Paribas froze redemptions for three investment funds, citing its inability to value
structured products.
Figure 2: Outstanding asset-backed commercial paper and unsecured commercial paper.
Source: Federal Reserve Board.
Following this event, a variety of market signals showed that money market participants had
become reluctant to lend to each other. For example, the average quoted interest rate on asset-backed
commercial paper jumped from 5.39 percent to 6.14 percent over the period August 8-10, 2007. All
through August 2007, rating agencies continued to downgrade various conduits and structured
investment vehicles.
The LIBOR, Repo, and Federal Funds Markets
In addition to the commercial paper market, banks use the repo market, the federal funds
market, and the interbank market to finance themselves. Repurchase agreements, or “repos,” allow
market participants to obtain collateralized funding by selling their own or their clients’ securities and
agreeing to repurchase them when the loan matures. The U.S. federal funds rate is the overnight
interest rate at which banks lend reserves to each other to meet the central bank’s reserve
requirements. In the interbank or LIBOR (London Interbank Offered Rate) market, banks make
unsecured, short-term (typically overnight to three-month) loans to each other. The interest rate is
individually agreed upon. LIBOR is an average indicative interest rate quote for such loans.
An interest rate spread measures the difference in interest rates between two bonds of
different risk. These credit spreads had shrunk to historically low levels during the “liquidity bubble” but
they began to surge upward in the summer of 2007. Historically, many market observers focused on the
TED spread, the difference between the risky LIBOR rate and the risk-free U.S. Treasury bill rate. In times
of uncertainty, banks charge higher interest for unsecured loans, which increases the LIBOR rate.
Further, banks want to get first-rate collateral, which makes holding Treasury bonds more attractive and
pushes down the Treasury bond rate. For both reasons, the TED spread widens in times of crises, as
shown by the sum of the shaded areas in Figure 3. The LIBOR-OIS spread abstracts from the fact that
Treasuries are especially sought after collateral in times crisis. This “collateral effect” can also shows up
in the MBS-GC repos spread, the spread between the repo rate one has to pay using mortgage-backed
securities as collateral compared to the repo rate using Treasury bonds as collateral. Another commonly
viewed credit spread is the one between 30-year “agency bonds”, issued by the government-sponsored
enterprises Fannie Mae and Freddie Mac, and 30-year Treasury bonds. This spread also moved in a
similar fashion – sometimes peaking before the TED spread.
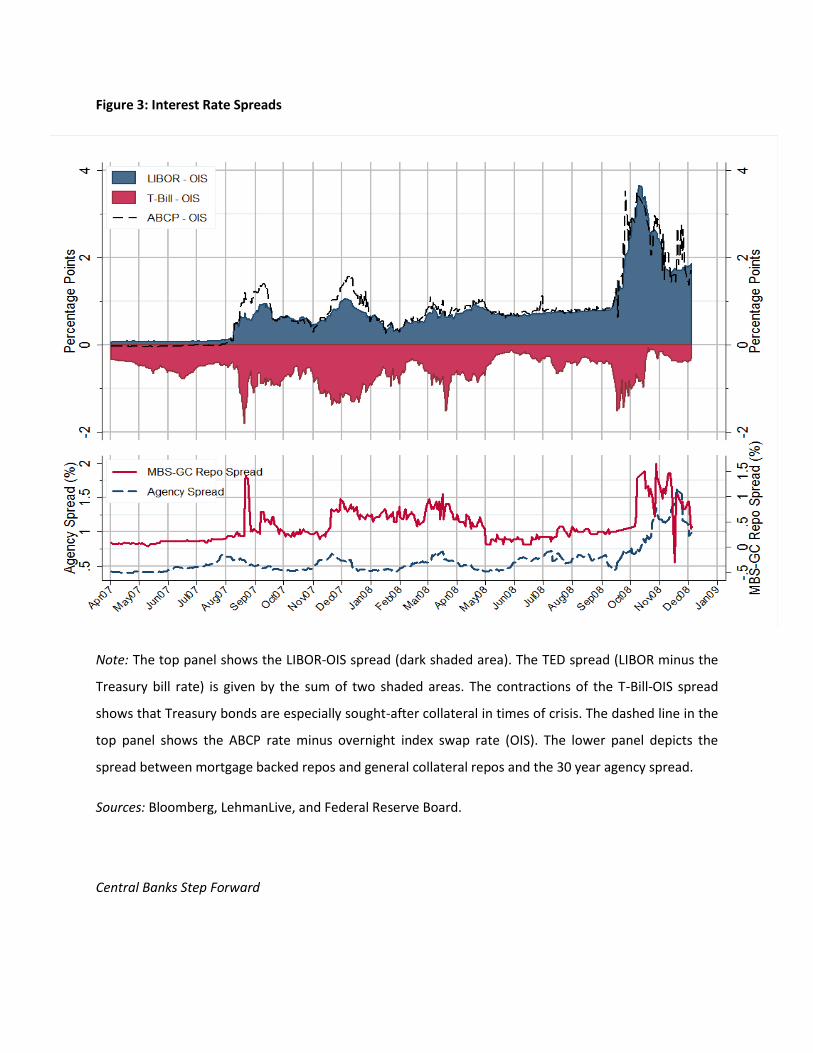
Figure 3: Interest Rate Spreads
Note: The top panel shows the LIBOR-OIS spread (dark shaded area). The TED spread (LIBOR minus the
Treasury bill rate) is given by the sum of two shaded areas. The contractions of the T-Bill-OIS spread
shows that Treasury bonds are especially sought-after collateral in times of crisis. The dashed line in the
top panel shows the ABCP rate minus overnight index swap rate (OIS). The lower panel depicts the
spread between mortgage backed repos and general collateral repos and the 30 year agency spread.
Sources: Bloomberg, LehmanLive, and Federal Reserve Board.
Central Banks Step Forward
In the period August 1-9, 2007, many quantitative hedge funds, which use trading strategies
based on statistical models, suffered large losses, triggering margin calls and fire sales. Crowded trades
caused high correlation across quant trading strategies (for details, see Brunnermeier, 2008a; Khandani
and Lo, 2007). The first “illiquidity wave” on the interbank market started on August 9. At that time, the
perceived default and liquidity risks of banks rose significantly, driving up the LIBOR. In response to the
freezing up of the interbank market on August 9, the European Central Bank injected €95 billion in
overnight credit into the interbank market. The U.S. Federal Reserve followed suit, injecting $24 billion.
To alleviate the liquidity crunch, the Federal Reserve reduced the discount rate by half a
percentage point to 5.75 percent on August 17, 2007, broadened the type of collateral that banks could
post, and lengthened the lending horizon to 30 days. However, the 7,000 or so banks that can borrow at
the Fed's discount window are historically reluctant to do so because of the stigma associated with it—
that is, the fear that discount window borrowing might signal a lack of creditworthiness on the interbank
market. On September 18, the Fed lowered the federal funds rate by half a percentage point (50 basis
points) to 4.75 percent and the discount rate to 5.25 percent. The U.K. bank Northern Rock was
subsequently unable to finance its operations through the interbank market and received a temporary
liquidity support facility from the Bank of England. Northern Rock ultimately fell victim to the first bank
run in the United Kingdom for more than a century as discussed in Shin (2009).
Continuing Write-downs of Mortgage-related Securities
October 2007 was characterized by a series of write-downs. For a time, major international
banks seemed to have cleaned their books. The Fed's liquidity injections appeared effective. Also,
various sovereign wealth funds invested a total of more than $38 billion in equity from November 2007
until mid-January 2008 in major U.S. banks (IMF, 2008).
But matters worsened again starting in November 2007, when it became clear that an earlier
estimate of the total loss in the mortgage markets, around $200 billion, had to be revised upward. Many
banks were forced to take additional, larger write-downs. The TED spread widened again as the LIBOR
peaked in mid-December of 2007 (Figure 3). This change convinced the Fed to cut the federal funds rate
by 0.25 percentage point on December 11, 2007.
At this point, the Federal Reserve had discerned that broad cuts in the federal funds rate and
the discount rate were not reaching the banks caught in the liquidity crunch. On December 12, 2007, the
Fed announced the creation of the Term Auction Facility (TAF), through which commercial banks could
bid anonymously for 28-day loans against a broad set of collateral, including various mortgage-backed
securities. For banks, the effect was quite similar to borrowing from the discount window—except it
could be done anonymously. This step helped resuscitate interbank lending.
The Monoline Insurers
Amid ongoing bank write-downs, the investment community's primary worry by January and
early February 2008 was the potential downgrading of the “monoline insurers.” Unlike insurance
companies which are active in many business lines, monoline insurers focused completely on one
product, insuring municipal bonds against default (in order to guarantee a AAA-rating). More recently,
however, the thinly capitalized monoline insurers had also extended guarantees to mortgage-backed
securities and other structured finance products.
As losses in the mortgage market mounted, the monoline insurers were on the verge of being
downgraded by all three major rating agencies. This change would have led to a loss of AAA-insurance
for hundreds of municipal bonds, corporate bonds, and structured products, resulting in a sweeping
rating downgrade across financial instruments with a face value of $2.4 trillion and a subsequent severe
sell-off of these securities. To appreciate the importance, note that money market funds pledge never to
“break the buck”—that is, they promise to maintain the value of every dollar invested and hence
demand that underwriters of assets agree to buy back the assets if needed. However, this buy-back
guarantee is conditional on the underlying assets being AAA-rated. Consequently, a rating downgrade
would have triggered a huge sell-off of these assets by money market funds.
On January 19, 2008, the rating agency Fitch downgraded one of the monoline insurers, Ambac,
unnerving worldwide financial markets. While U.S. financial markets were closed for Martin Luther King
Day, share prices dropped precipitously worldwide. Emerging markets in Asia lost about 15 percent, and
Japanese and European markets were down around 5 percent. The sell-off continued in the morning of
Tuesday, January 22, in Asia and Europe. Dow Jones and Nasdaq futures were down 5 to 6 percent,
indicating a large drop in the U.S. equity market as well. Given this environment, the Fed decided to cut
the federal funds rate by 0.75 percentage point to 3.5 percent—the Fed's first “emergency cut” since
1982. As it turned out, however, part of the downturn can be attributed to the aggressive unwinding of
Societe Generale’s €49.9 billion position that rogue trader Jérôme Kerviel had secretly acquired in
unauthorized trading. At its regular meeting on January 30, the Federal Open Market Committee cut the
federal funds rate another 0.5 percentage point. The potential downgrade of monoline insurers also
created significant selling pressure on municipal bond market and other so-called auction rated
securities (ARS) that are traded in an auction at regular intervals. Since ARS brokers were reluctant to
commit capital and make markets, many rate-setting auctions failed, sales were rationed, and the
remaining transactions occurred at prespecified penalty interest rate. In February 2008 about 80
percent of the auctions failed.
Bear Stearns
In early March 2008, events put pressure on the investment bank Bear Stearns. First, the credit
spreads between agency bonds (issued by Freddie Mac and Fannie Mae) and Treasury bonds started to
widen again. The widening spreads hurt Carlyle Capital, an Amsterdam-listed hedge fund, which was
heavily invested in agency bonds. When Carlyle could not meet its margin calls, its collateral assets were
seized and partially liquidated. This action depressed the price of agency bonds further. Not only did
Bear Stearns hold large amounts of agency paper on its own, but it was also one of the creditors to
Carlyle.
A second event was that of March 11, 2008, when the Federal Reserve announced its $200
billion Term Securities Lending Facility. This program allowed investment banks to swap agency and
other mortgage-related bonds for Treasury bonds for up to 28 days. To avoid stigmatization, the extent
to which investment banks made use of this facility was to be kept secret. However, some market
participants might have (mistakenly) interpreted this move as a sign that the Fed knew that some
investment bank might be in difficulty. Naturally, they pointed to the smallest, most leveraged
investment bank with large mortgage exposure: Bear Stearns.
Moreover, after trading hours ended on March 11, 2008, a hedge fund sent Goldman Sachs an
e-mail asking it to step into a contractual relationship that would increase Goldman’s direct exposure to
Bear Stearns. Given the late request, Goldman only “novated” (accepted) the new contract only on the
morning of March 12. In the meantime, the late acceptance was (wrongly) interpreted as a refusal and
was leaked to the media, causing unease among Bear Stearns’s hedge fund clients. This incident might
have contributed to the run on Bear by its hedge fund clients and other counterparties. Bear's liquidity
situation worsened dramatically the next day as it was suddenly unable to secure funding on the repo
market.
Bear Stearns had about 150 million trades spread across various counterparties. It was
therefore considered “too interconnected” to be allowed to fail suddenly. Some big party had to step in
to minimize counterparty credit risk. Over the weekend, officials from the Federal Reserve Bank of New
York helped broker a deal, through which JPMorgan Chase would acquire Bear Stearns for $236 million,
or $2 per share. By comparison, Bear Stearns's shares had traded at around $150 less than a year
before. The New York Fed also agreed to grant a $30 billion loan to JPMorgan Chase. On Sunday night,
the Fed cut the discount rate from 3.5 percent to 3.25 percent and for the first time opened the
discount window to investment banks, via the new Primary Dealer Credit Facility (PDCF), an overnight
funding facility for investment banks. This step temporarily eased the liquidity problems of the other
investment banks, including Lehman Brothers.
Overall, the market valued the deal positively for JPMorgan Chase. Its shares gained 2.7 percent
the Monday after the deal was announced. However, under the deal, Bear Stearns's equity-holders lost
almost everything, while its debt-holders did not lose anything. In addition, some political opposition to
the loan surfaced. Indeed, the hostility among many equity-holders was such that uncertainty about the
completion of the deal remained, which led to a continued bleeding of Bear Stearns's customer base. In
response, JPMorgan Chase increased its offer to $10 per share—and also agreed to assume the first $1
billion in losses from the loan, to overcome political opposition.
Government-Sponsored Enterprises: Fannie Mae and Freddie Mac
Mortgage delinquency rates continued to increase in the subsequent months. By mid-June
2008, the interest rate spread between “agency bonds” of the government-sponsored enterprises
Fannie Mae and Freddie Mac and Treasury bonds had widened again. Fannie Mae and Freddie Mac at
that time were two publicly traded but government-chartered institutions that securitized a large
fraction of U.S. mortgages and had about $1.5 trillion in bonds outstanding. After IndyMac, a large
private mortgage broker, was put in conservatorship by the Federal Deposit Insurance Corporation
(FDIC) on Friday, July 11, problems at Fannie and Freddie flared up, prompting Treasury Secretary Henry
Paulson on the evening of Sunday, July 13, to announce plans to make their implicit government
guarantee explicit. Despite this support, the stock prices of Fannie and Freddie slid further in the
subsequent weeks, ultimately forcing government officials to put them in federal conservatorship on
September 7. This step constituted a “credit event” for a large number of outstanding credit default
swaps, triggering large payments to those who had bought these swaps. Note that Ginnie Mae, the third
Government-Sponsored Enterprise, always enjoyed full government guarantee.
Lehman Brothers, Merrill Lynch, and AIG
Unlike Bear Stearns, Lehman Brothers had survived the fallout in March 2008, but only narrowly.
It subsequently made heavy use of the Fed’s new Primary Dealer Credit Facility, but did not issue
enough new equity to strengthen its balance sheet. It felt that stepping forward as a single bank to issue
new shares (without a concerted effort across all banks) would be very costly, because it would be
perceived as a signal of desperation. As Lehman’s share price eroded, and especially as it became clear
on September 9, 2008, that the state-controlled Korea Development Bank would not buy the firm,
Lehman’s shares plunged. Timothy Geithner, president of the Federal Reserve Bank of New York,
convened a weekend meeting with all major banks’ most senior executives on September 12-14 to
secure Lehman’s future. Initially, Barclays and Bank of America were named as possible suitors.
However, they refused to take over Lehman without a government guarantee. Eventually, Treasury and
Fed officials decided not to offer a guarantee funded by taxpayers, especially since Lehman, as well as its
clients and counterparties, had had ample time to prepare for the liquidity shortage. Already on Sunday
afternoon, the International Swaps and Derivatives Association (ISDA) offered an exceptional trading
session to net various offsetting Lehman positions, conditional on Lehman filing for bankruptcy at
midnight. Consequently, Lehman had to declare bankruptcy early Monday morning. In the meantime,
reading the signs, Merrill Lynch had already announced on Sunday that it had sold itself to Bank of
America for $50 billion.
The effects of Lehman’s bankruptcy would ripple throughout the global financial markets, but
not before AIG, a large international insurance company, disclosed that they faced a serious liquidity
shortage. Like investment banks, AIG had been increasingly active in the credit derivatives business,
including credit default swaps. On Tuesday, September 16, 2008, AIG’s stock price fell more than 90
percent, capping off a large decline from the previous days. Owing to AIG’s interconnectedness in the
credit derivatives business, the Federal Reserve quickly organized a bailout of $85 billion in exchange for
an 80 percent equity stake. The AIG bailout was extended by a further $37 billion in October and
another $40 billion in November.
The ripple effects of Lehman’s demise were difficult to predict, because Lehman had
counterparties across the globe. First, and most importantly, many money market funds suffered losses.
Some “broke the buck”—their share price dropped below $1—while others supported their funds via
cash injections. To avoid the broad repercussions of a run on money market funds, the U.S. Treasury set
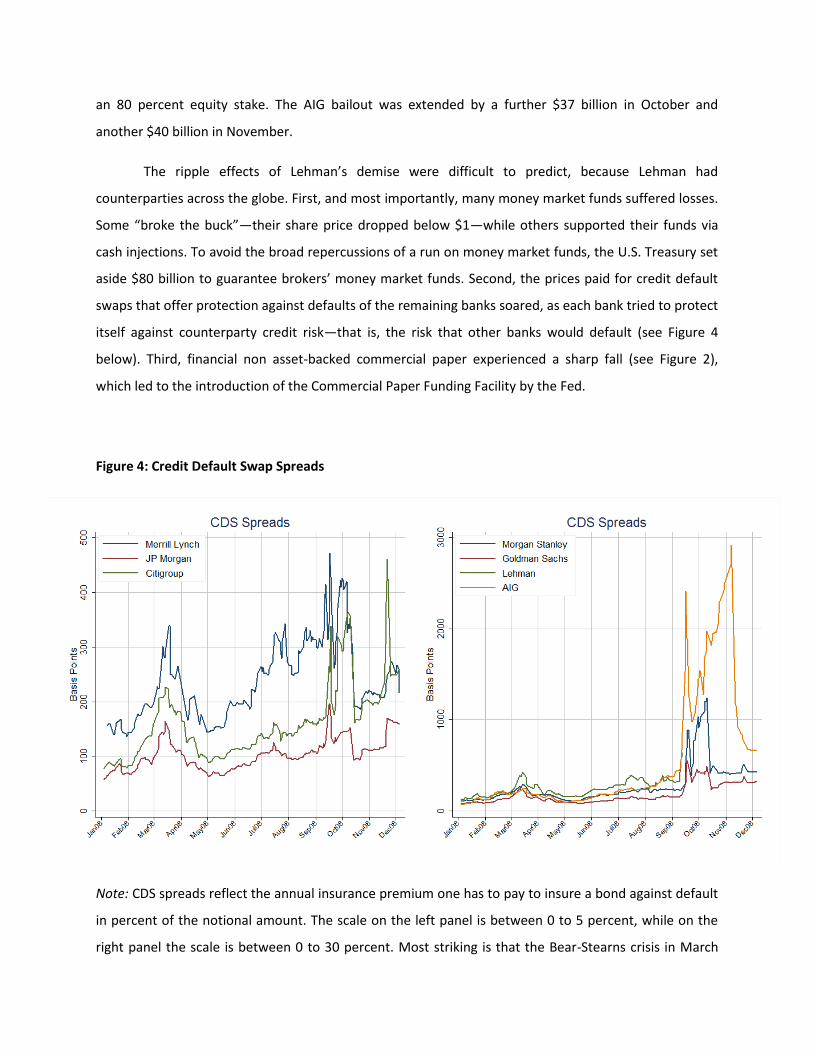
aside $80 billion to guarantee brokers’ money market funds. Second, the prices paid for credit default
swaps that offer protection against defaults of the remaining banks soared, as each bank tried to protect
itself against counterparty credit risk—that is, the risk that other banks would default (see Figure 4
below). Third, financial non asset-backed commercial paper experienced a sharp fall (see Figure 2),
which led to the introduction of the Commercial Paper Funding Facility by the Fed.
Figure 4: Credit Default Swap Spreads
Note: CDS spreads reflect the annual insurance premium one has to pay to insure a bond against default
in percent of the notional amount. The scale on the left panel is between 0 to 5 percent, while on the
right panel the scale is between 0 to 30 percent. Most striking is that the Bear-Stearns crisis in March
2008 was relatively modest compared to the fall-out of Lehman’s failure in September 2008. Investment
banks and AIG were particularly hit.
Coordinated Bailout, Stock Market Decline, Washington Mutual, Wachovia, and Citibank
As can be seen by the extreme spike in the TED spread in Figure 3, the credit markets
deteriorated significantly in subsequent weeks.3 Washington Mutual suffered a “silent” bank run.
Instead of publicly queuing in front of bank tellers, customers and fund managers withdrew funds
electronically. Soon afterwards, Washington Mutual was placed in receivership by the Federal Deposit
Insurance Corporation (FDIC), and then sold to JPMorgan Chase. In a move also facilitated by the FDIC,
Wachovia announced on September 29 that it was selling its banking operation to Citibank, but after a
bidding contest, Wachovia ultimately fell into the hands of Wells Fargo.
The overall stock market fell off a cliff, losing about $8 trillion in the year after its peak in
October 2007. More importantly, Wall Street’s problems seemed to spill over to Main Street. Credit for
firms and local and state governments tightened, infecting the global economy. It became more and
more clear that a proactive, coordinated action across all solvent banks had to replace the reactive
piecemeal approach. After news broke on September 19, 2008, that the Treasury Secretary would
propose a $700 billion bailout plan, a political quarrel started and ultimately led to a bailout plan that
included foreclosure-mitigation elements for homeowners, provisions to purchase troubled mortgage
assets, and a coordinated forced recapitalization of banks. Despite this, Citibank needed additional
support in November (see also its CDS spread in Figure 4), and several facilities were established that
enabled the Fed to buy commercial paper and almost any type of asset-backed security and agency
paper. The Fed’s balance sheet roughly doubled from about $1.2 trillion in November 2007 to about
$2.3 trillion in December 2008. On December 16, 2008 the Fed set its target interest rate range between
zero and a quarter percent.
Economic events and political actions and reactions have continued to unfold. But for the
purposes of this paper, the key question is how the original loss of several hundred billion dollars in the
3 Focusing on the TED spread here is somewhat misleading since part of the rise in LIBOR is due to central banks’
increase in collateralized lending. Collateralized lending enjoys seniority and hence makes the more junior
unsecured LIBOR lending more risky and therefore more expensive.
mortgage market was sufficient to trigger such an extraordinary series of worldwide financial and
economic consequences.
Amplifying Mechanisms and Recurring Themes
The sequence of events described above is a vivid reminder of how shocks can get amplified to a
full-blown financial crisis when liquidity evaporates. Liquidity dries up when frictions limit optimal risk
sharing and hinder flows of funds to expert investors (i.e., funds are separated from expertise). It is
useful to divide the concept of liquidity into two categories: funding liquidity and market liquidity
(Brunnermeier and Pedersen, 2009).
Funding liquidity describes the ease with which expert investors and arbitrageurs can obtain
funding from (possibly less informed) financiers. Funding liquidity is high—and markets are said to be
“awash with liquidity”—when it is easy to raise money. Typically, when a leveraged trader, such as a
dealer, hedge fund, or investment bank, purchases an asset, he uses the purchased asset as collateral
and borrows (short-term) against it. However, he cannot borrow the entire price. The difference
between the security's price and its value as collateral—the margin or haircut —must be financed by the
trader's own equity capital. Margin lending is short-term since margins and haircuts can be adapted to
market conditions on a daily basis. Outside equity or long-term debt financing is typically more
expensive and difficult to obtain when the trader suffers from the debt-overhang problem.4 As a
consequence, traders tend not to carry much excess capital and thus increasing margins and haircuts
force traders to de-leverage their positions (that is, to sell part of their assets).
Financial institutions that rely substantially on short-term (commercial) paper or repo contracts
have to roll over their debt. An inability to roll over this debt—if, for example, the market for
commercial paper dries up—is equivalent to margins increasing to 100 percent, because the firm
becomes unable to use the asset as a basis for raising funds. Similarly, withdrawals of demand deposits
or capital redemptions from an investment fund have the same effect as an increase in margins. Funding
liquidity risk can thus take three forms: 1) margin/haircut funding risk, or the risk that margins and
4 The debt-overhang problem arises when even informed financiers refrain from injecting additional equity since the
proceeds of the investment are primarily going to existing debt-holders rather than the new equity holders (Myers
1977).

haircuts will change; 2) rollover risk, or the risk that it will be more costly or impossible to roll over short-
term borrowing; and 3) redemption risk, or the risk that demand depositors of banks or even equity
holders of e.g. hedge funds withdraw funds. All three incarnations of funding liquidity risk are only
detrimental when the assets can be sold only at fire-sale prices—that is, when market liquidity is low.
Market liquidity is low when it is difficult to raise money by selling the asset (instead of by
borrowing against it). In other words, market liquidity is low when selling the asset depresses the sale
price and hence it becomes very costly to shrink the balance sheet. Market liquidity is equivalent to the
relative ease of finding somebody who takes on the other side of the trade. The literature distinguishes
between three sub-forms of market liquidity (Kyle, 1985): 1) the bid-ask spread, which measures how
much traders lose if they sell one unit of an asset and then buy it back right away; 2) market depth,
which shows how many units traders can sell or buy at the current bid or ask price without moving the
price; and 3) market resiliency, which tells us how long it will take for prices that have temporarily fallen
to bounce back. While a single trader might move the price a bit, large price swings occur when
“crowded trades” are unwound—that is, when a number of traders attempt to exit from identical
positions in unison.
At an abstract level, we can think about market liquidity and funding liquidity in the following
way. Market liquidity refers to the transfer of the asset with its entire cash flow, while funding liquidity
is like issuing debt, equity, or any other financial contract against a cash flow generated by an asset or
trading strategy.
The mechanisms that explain why liquidity can suddenly evaporate operate through the
interaction of market liquidity and funding liquidity. Through these mechanisms, a relatively small shock
can cause liquidity to dry up suddenly and carry the potential for a full-blown financial crisis. This section
outlines several mechanisms that amplify the initial shock.
Borrower's Balance Sheet Effects: Loss Spiral and Margin Spiral
A loss spiral arises for leveraged investors since a decline in assets value erodes their net worth
much faster than their gross worth (because of their leverage) and the amount that they can borrow
falls. For example, consider an investor who buys $100 million worth of assets on 10 percent margin.
This investor finances only $10 million with its own capital and borrows $90 million. The leverage ratio is
10. Now suppose that the value of the acquired asset declines temporarily to $95 million. The investor,
who started out with $10 million in capital, now has lost $5 million and has only $5 million of its own
capital remaining. Holding the leverage ratio constant at 10, this investor is forced to reduce the overall
position to $50 million—which means selling assets worth $45 million exactly when the price is low.
These sales depress the price further, inducing more selling and so on. This loss spiral arises as an
equilibrium because some other potential buyers with expertise may face similar constraints at the time
(as pointed out in the seminal paper by Shleifer and Vishny, 1992) and also because other potential
buyers find it more profitable to wait out the loss spiral before reentering the market. In more extreme
cases, other traders might even engage in “predatory trading”, deliberately forcing others to liquidate
their positions at fire-sale prices. (Brunnermeier and Pedersen, 2005).
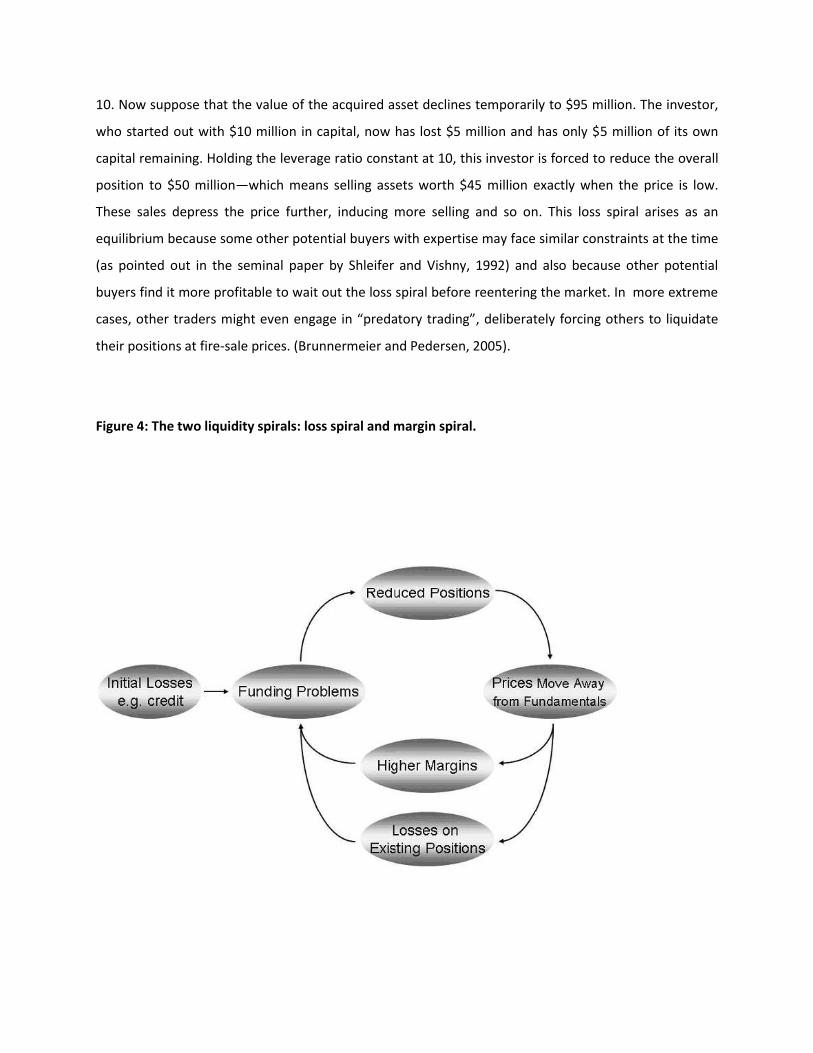
Figure 4: The two liquidity spirals: loss spiral and margin spiral.
Note: Funding problems force leveraged investors to unwind their positions causing 1) more losses and
2) higher margins and haircuts, which in turn exacerbates the funding problems and so on.
Source: Brunnermeier and Pedersen (2009).
The margin/haircut spiral reinforces the loss spiral, as shown in Figure 5. As margins or haircuts rise, the
investor has to sell even more because the investor needs to reduce its leverage ratio (which was held
constant in the loss spiral). Margins and haircuts spike in times of large price drops leading to a general
tightening of lending. Brunnermeier and Pedersen (2009) show that a vicious cycle emerges, where
higher margins and haircuts force de-leveraging and more sales, which increase margins further and
force more sales, leading to the possibility of multiple equilibria. Adrian and Shin (2009) confirm this
spiral empirically for investment banks.
The documented fact that margins and haircuts, as well as lending standards, increase after
large price drops seems counterintuitive, because a price reduction that results from a lack of liquidity is
likely to be temporary, and investors with the necessary expertise face a great buying opportunity.
Hence, one might think that lenders would be willing to lend more freely by lowering margins after
prices have dropped.
There are at least three reasons why exactly the opposite is true.5 First, unexpected price shocks
may be a harbinger of higher future volatility (Brunnermeier and Pedersen, 2009). And when volatility
increases, margins and haircuts increase. An extreme example was the situation in August 2007, when
the asset-backed commercial paper market dried up completely. Prior to the crisis, asset-backed
commercial paper was almost risk-free because of overcollateralization. However, in August 2007, the
overcollateralization cushion evaporated, making the assets much more risky. Consequently, investors
were unwilling to let structured investment vehicles roll-over their debt. The second reason why
margins increase when prices drop suddenly is that asymmetric-information frictions emerge. Financiers
become especially careful about accepting assets as collateral if they fear receiving a particularly bad
5 A number of academic papers focus on the loss spiral. Most models produce a cushioning effect of margins and
haircuts since margins decrease at times of crisis in these models (for example, Gromb and Vayanos, 2002; He and
Krishnamurthy, 2008). In Kiyotaki and Moore (1997) the ratio between asset value and credit limit is constant. In
Bernanke and Gertler (1989) and Fisher (1933) lending standards deteriorate, in Geanakoplos (2003) margins
increase during crises.

selection of assets. They might, for example, be worried that structure investment vehicles sold the
good, “sellable” assets and left as collateral only the bad, less valuable, “lemons.” Finally, if lenders
naively estimate future volatility using past data, then a large price drop leads to higher volatility
estimates and higher margins—even though a price drop potentially reflects a great buying opportunity.
It is individually rational to expose oneself to the risk of getting caught in a liquidity spiral by
holding highly levered positions with a mismatch in asset-liability maturities, although it can be socially
costly. Each individual speculator takes future prices as given and hence does not take into account that
unloading assets will cause some adverse effects on other speculators by forcing them to sell their
positions as well. This “fire-sale externality” is the primary reason for bank regulation.6
The loss spiral is more pronounced for stocks with low market liquidity, because selling them at
a time of financial distress will bring about a greater price drop than selling a more liquid asset would.
For many structured finance products, market liquidity is so low that no reliable price exists because no
trade takes place. As a consequence, owners have considerable discretion in what value to place on the
asset. Selling some of these assets in a financial crisis would establish a low price and force the holder to
mark down remaining holdings. Hence, investors are reluctant to do this—and instead prefer to sell
assets with higher market liquidity first.7
Lending Channel
So far, we have focused on the balance sheets of the borrowers and have assumed that lenders
have deep pockets. When lenders also have limited capital, they restrict their lending as their own
financial situation worsens. We can distinguish two main mechanisms: moral hazard in monitoring and
precautionary hoarding.
6 While most current risk measures like Value-at-Risk (VaR) focus on the risk of an individual financial institution,
Adrian and Brunnermeier (2008) develop a new risk measure, “CoVaR,” that explicitly takes the risk spillovers into
account.
7 Funding constraints need not be binding for liquidity spirals to arise. Simply the fear that funding constraints
might be binding in the future makes speculators and arbitrageurs reluctant to invest in a way that will correct
mispricing and provide market liquidity. This idea is similar to the concept of the “limits to arbitrage” explored in
Shleifer and Vishny (1997).
Most lending is intermediated by banks that have expertise in monitoring a borrower's
investment decisions. For intermediators to exert sufficient effort in monitoring, they must have a
sufficiently high stake of their own. Moral hazard arises when the net worth of the intermediaries’ stake
falls because intermediaries may then reduce their monitoring effort, forcing the market to fall back to
direct lending without monitoring (Holmström and Tirole, 1997, 1998).
Precautionary hoarding arises if lenders are afraid that they might suffer from interim shocks
and that they will need funds for their own projects and trading strategies. Precautionary hoarding
therefore increases when 1) the likelihood of interim shocks increases, and 2) outside funds are
expected to be difficult to obtain.
The troubles in the interbank lending market in 2007-08 are a textbook example of
precautionary hoarding by individual banks. As it became apparent that conduits, structured investment
vehicles, and other off-balance-sheet vehicles would likely draw on credit lines extended by their
sponsored bank, each bank's uncertainty about its own funding needs skyrocketed. At the same time, it
became more uncertain whether banks could tap into the interbank market after a potential interim
shock, since it was not known to what extent other banks faced similar problems. These effects led to
sharp spikes in the interbank market interest rate, LIBOR, relative to the Treasury bill interest rate.8
Runs on Financial Institutions
In the days before deposit insurance, everybody had an incentive to be the first to withdraw
funds from a possibly troubled bank, because those who withdraw their money early get their full
amount while those who move late might not. Late movers receive less for two reasons: 1) if the run
occurred for fundamental reasons—say, the bank invested in bad projects—there may not be enough
asset value left to pay those who withdraw late, and 2) if the run occurred for funding-liquidity reasons,
early withdrawals force a bank to liquidate long-maturity assets at fire-sale prices because market
8 While the above described mechanisms rely on financial frictions and lack of expertise, Caballero and
Krishnamurthy (2008) argue that investors have a difficult time assigning probabilities to the different possible
outcomes in times of crises. This argument seems reasonable, especially for structured products, since only limited
historical data is available for forecasting. Thus, investors become even more wary than the observed increase in
volatility might seem to justify, and they will demand an additional uncertainty premium for holding potentially
risky assets.

liquidity for those assets is low. The sale of long-maturity assets below their fair value leads to an
erosion of the bank's wealth and thus leaves less for those who withdraw their money late. Under both
scenarios, every investor has an incentive to preempt others and run to the bank.9 A first-mover
advantage triggers a dynamic preemption motive, which can lead to socially inefficient outcomes.
Deposit insurance has made bank runs almost obsolete, but runs can occur on other financial
institutions. Not rolling over commercial paper is, in effect, a run on the issuer of asset-backed
commercial paper. Furthermore, Bear Stearns essentially experienced a bank run in March 2008 when
hedge funds, which typically park a sizable amount of liquid wealth with their prime brokers, pulled out
those funds. In September 2008, AIG faced a “margin run” as explained in Gorton (2008). Several
counterparties requested additional collateral from AIG for its credit default swap positions. These
requests would have brought the firm down if the Fed had not injected additional funds.
While classic models of bank runs focus on debt-holders, one may argue that the problem also
extends to equity-holders, such as investors in a hedge fund or mutual funds (Shleifer and Vishny, 1997).
Equity-holders who withdraw their capital receive a share of the hedge fund's net asset value. In this
case, an early-mover advantage arises to the extent that fund managers sell liquid assets first. To see
this point, consider a fund that holds $50 million in highly liquid cash and $50 million in hard-to-sell
illiquid securities that at short notice can be sold for only $30 million. If the fund services early
withdrawals using its cash cushion, then early withdrawers receive their full share of the mark-to-market
net asset value of $100 million. But once the fund has to sell the illiquid assets under pressure to pay out
the remaining investors, net asset value declines and late withdrawers receive only a percentage share
of the sale price of the remaining assets, which is $30 million, not $50 million. In sum, a first-mover
advantage can make financial institutions in general, not only banks, subject to runs.
Network Effects: Counterparty Credit Risk and Gridlock Risk
All our settings so far have assumed a distinct lending sector that lends to a distinct borrowing
sector. In reality, however, most financial institutions are lenders and borrowers at the same time.
9 Diamond and Dybvig (1983) is the seminal paper on bank runs. Allen and Gale (2007) and Freixas and Rochet
(1997), and references therein, are further useful starting points. Bernardo and Welch (2004) and Morris and Shin
(2004) study runs on financial markets.

Modern financial architecture consists of an interwoven network of financial obligations.10 In this
section, we show how an increase in counterparty credit risk can create additional funding needs and
potential systemic risk.
Network risk is best illustrated by an example related to the Bear Stearns crisis in March 2008.
Imagine a hedge fund that has an interest rate swap agreement with Goldman Sachs—that is, both
parties had agreed to swap the difference between a floating interest rate and a fixed interest rate. Now
suppose that the hedge fund offsets its obligation through another swap with Bear Stearns. In the
absence of counterparty credit risk, the two swap agreements can be viewed as reduced to a single one
between Goldman and Bear Stearns. However, it would be unwise for Goldman to renew the contract if
it fears that Bear might default on its commitment. As noted earlier, Goldman was asked to increase its
direct exposure to Bear after the trading hours on March 11, 2008. Goldman’s responsible manager did
renew the contract in the morning of March 12, but what looked like a delay in response was mistakenly
interpreted as a hesitation on Goldman’s behalf and thus as a sign that Goldman was afraid Bear Stearns
might be in trouble. This misinterpretation was leaked to the media and might have contributed to the
run on Bear Stearns.
10
One piece of evidence is that the number of outstanding derivatives contracts vastly exceeds the number of
underlying securities. For example, the notional amount of credit default swap contracts totaled between $45 and
$62 trillion in 2007, while the value of the underlying corporate bond market was only $5 trillion. The discrepancy
arises because many of the outstanding obligations between financial institutions would be netted out in
multilateral agreements.
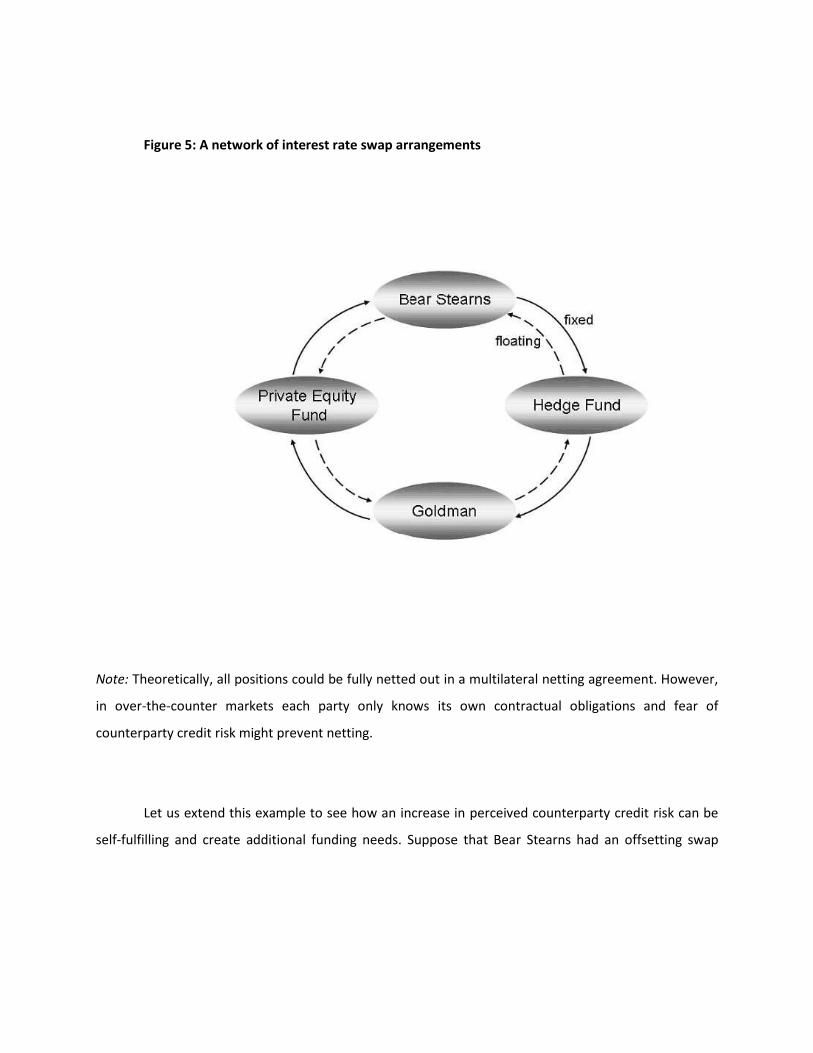
Figure 5: A network of interest rate swap arrangements
Note: Theoretically, all positions could be fully netted out in a multilateral netting agreement. However,
in over-the-counter markets each party only knows its own contractual obligations and fear of
counterparty credit risk might prevent netting.
Let us extend this example to see how an increase in perceived counterparty credit risk can be
self-fulfilling and create additional funding needs. Suppose that Bear Stearns had an offsetting swap
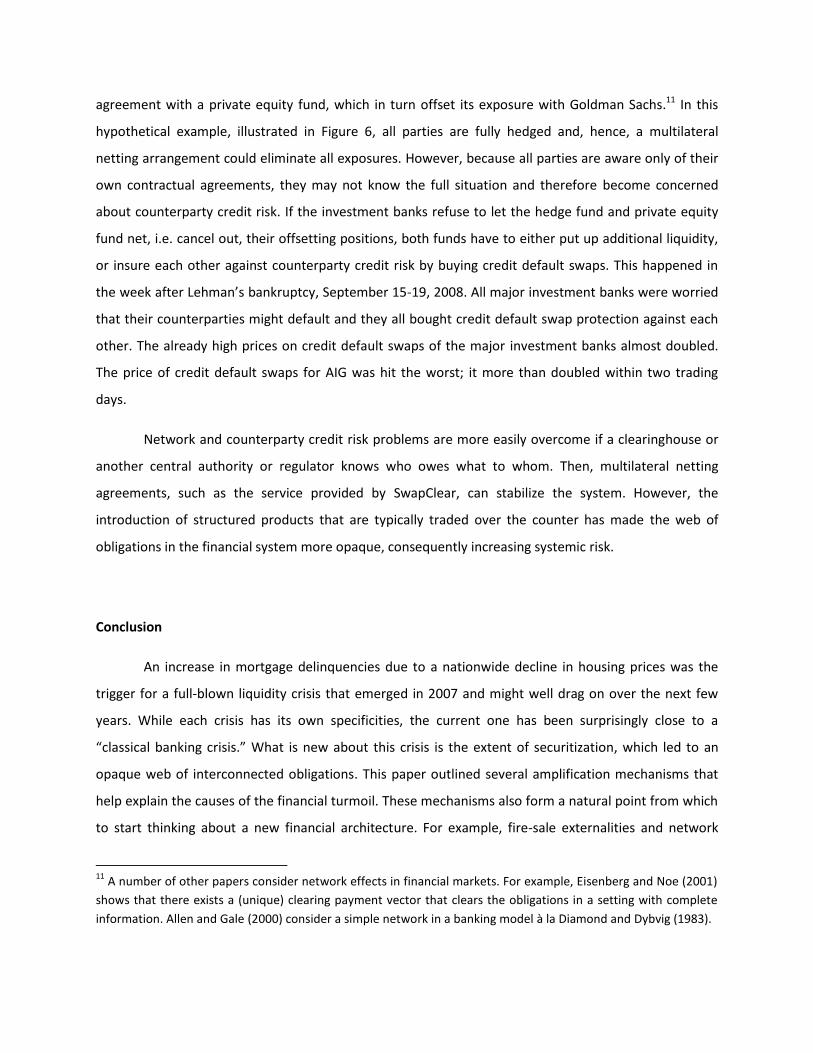
agreement with a private equity fund, which in turn offset its exposure with Goldman Sachs.11 In this
hypothetical example, illustrated in Figure 6, all parties are fully hedged and, hence, a multilateral
netting arrangement could eliminate all exposures. However, because all parties are aware only of their
own contractual agreements, they may not know the full situation and therefore become concerned
about counterparty credit risk. If the investment banks refuse to let the hedge fund and private equity
fund net, i.e. cancel out, their offsetting positions, both funds have to either put up additional liquidity,
or insure each other against counterparty credit risk by buying credit default swaps. This happened in
the week after Lehman’s bankruptcy, September 15-19, 2008. All major investment banks were worried
that their counterparties might default and they all bought credit default swap protection against each
other. The already high prices on credit default swaps of the major investment banks almost doubled.
The price of credit default swaps for AIG was hit the worst; it more than doubled within two trading
days.
Network and counterparty credit risk problems are more easily overcome if a clearinghouse or
another central authority or regulator knows who owes what to whom. Then, multilateral netting
agreements, such as the service provided by SwapClear, can stabilize the system. However, the
introduction of structured products that are typically traded over the counter has made the web of
obligations in the financial system more opaque, consequently increasing systemic risk.
Conclusion
An increase in mortgage delinquencies due to a nationwide decline in housing prices was the
trigger for a full-blown liquidity crisis that emerged in 2007 and might well drag on over the next few
years. While each crisis has its own specificities, the current one has been surprisingly close to a
“classical banking crisis.” What is new about this crisis is the extent of securitization, which led to an
opaque web of interconnected obligations. This paper outlined several amplification mechanisms that
help explain the causes of the financial turmoil. These mechanisms also form a natural point from which
to start thinking about a new financial architecture. For example, fire-sale externalities and network
11
A number of other papers consider network effects in financial markets. For example, Eisenberg and Noe (2001)
shows that there exists a (unique) clearing payment vector that clears the obligations in a setting with complete
information. Allen and Gale (2000) consider a simple network in a banking model à la Diamond and Dybvig (1983).
effects suggest that financial institutions have an individual incentive to take on too much leverage, to
have excessive mismatch in asset-liability maturities, and to be too interconnected. In Brunnermeier
(2008b), I discuss the possible direction of future financial regulation using measures of risk that take
these domino effects into account.
References
Abreu, D. and Brunnermeier, M. K. (2002), ‘Synchronization risk and delayed arbitrage’, Journal of
Financial Economics 66(2-3), 341–360.
Abreu, D. and Brunnermeier, M. K. (2003), ‘Bubbles and Crashes’, Econometrica 71(1), 173–204.
Adrian, T. and Brunnermeier, M. K. (2008), ‘CoVaR’, working paper. At
<http://www.princeton.edu/~markus/research/papers/CoVaR>.
Adrian, T. and Shin, H. S. (2009), ‘Liquidity and leverage’, Journal of Financial Intermediation,
(forthcoming).
Allen, F. and Gale, D. (2000), ‘Financial contagion’, Journal of Political Economy 108(1), 1–33.
Allen, F. and Gale, D. (2004), ‘Financial intermediaries and markets’, Econometrica 72(4), 1023–1061.
Allen, F. and Gale, D. (2007), Understanding Financial Crises, Oxford University Press, Oxford, U.K.
(Clarendon Lectures in Economics).
Berman, Dennis K. 2007. “Sketchy Loans Abound with Capital Plentiful, Debt Buyers Take Subprime-Type
Risk,” Wall Street Journal. March 27, page C1.
Bernanke, B. and Gertler, M. (1989), ‘Agency Costs, Net Worth, and Business Fluctuations’, American
Economic Review 79(1), 14-31.
Bernanke, B., Gertler, M. and Gilchrist, S. G. (1996), ‘The financial accelerator and the flight to quality’,
Review of Economics and Statistics 78(1), 1–15.
Bernardo, A. E. and Welch, I. (2004), ‘Liquidity and financial markets run’, Quarterly Journal of
Economics 119(1), 135–158.
Brunnermeier, M. K., (2008a) ‘Deciphering the 2007-08 Liquidity and Credit Crunch’, working paper
version. At <http://www.princeton.edu/~markus/research/papers/liquidity_credit_crunch_WP>.
Brunnermeier, M. K., (2008b) ‘Thoughts on the New Financial Architecture’, work in progress.
Brunnermeier, M. K. and Pedersen, L. H. (2005), ‘Predatory trading’, Journal of Finance 60(4), 1825–
1863.
Brunnermeier, M. K. and Pedersen, L. H. (2009), ‘Market liquidity and funding liquidity’, Review of
Financial Studies (forthcoming).
Caballero, R. J. and Krishnamurthy, A. (2008), ‘Collective risk management in a flight to quality episode’,
Journal of Finance 63(5), 2195-2230.
Calomiris, C. and Kahn, C. (1991), ‘The role of demandable debt in structuring optimal banking
arrangements’, American Economic Review 81(3), 497–513.
Coval, J., Jurek, J. and Stafford, E. (2009), ‘The Economics of Structured Finance’, Journal of Economic
Perspectives 23(1), forthcoming.
Diamond, D. and Dybvig, P. (1983), ‘Bank runs, deposit insurance, and liquidity’, Journal of Political
Economy 91(3), 401–419.
Diamond, D. W. and Rajan, R. G. (2000), ‘A theory of bank capital’, Journal of Finance 55(6), 2431–2465.
Diamond, D. W. and Rajan, R. G. (2001), ‘Liquidity risk, liquidity creation and financial fragility: A theory
of banking’, Journal of Political Economy 109(2), 287–327.
Diamond, D. W. and Rajan, R. G. (2005), ‘Liquidity shortage and banking crisis’, Journal of Finance 60(2),
615–647.
Duffie, D. (2008), ‘Innovations in credit risk transfer: Implications for financial stability’, BIS Working
Paper 255, At <http://www.bis.org/publ/work255.pdf>.
Eisenberg, L. K. and Noe, T. H. (2001), ‘Systemic risk in financial systems’, Management Science 47(2),
236–249.
Fisher, I. (1933), ‘The debt-deflation theory of great depression’, Econometrica, 1(4), 337-357.
Freixas, X. and Rochet, J.-C. (1997), Microeconomics of Banking, MIT Press, Cambridge, MA.
Geanakoplos, J. (2003), Liquidity, default and crashes: Endogenous contracts in general equilibrium, in
M. Dewatripont, L. P. Hansen & S. J. Turnovsky, eds, ‘Advances in Economics and Econometrics: Theory
and Applications II, Econometric Society Monographs: Eighth World Congress’, Vol. 2, Cambridge
University Press, Cambridge, UK, pp. 170–205.
Gorton, G. (2008), ‘The Panic of 2007’, Federal Reserve Bank of Kansas City Symposium 2008, At
<http://www.kc.frb.org/publicat/sympos/2008/Gorton.10.04.08.pdf>.
Gromb, D. and Vayanos, D. (2002), ‘Equilibrium and welfare in markets with financially constrained
arbitrageurs’, Journal of Financial Economics 66(2-3), 361–407.
He, Z. and Krishnamurthy, A. (2008), ‘Intermediated asset prices’, Working Paper, Northwestern
University, At <http://www.kellogg.northwestern.edu/faculty/krisharvind/htm/work.html.
Holmström, B. and Tirole, J. (1997), ‘Financial intermediation, loanable funds, and the real sector’,
Quarterly Journal of Economics 112(1), 35–52.
Holmström, B. and Tirole, J. (1998), ‘Private and public supply of liquidity’, Journal of Political Economy
106(1), 1–39.
International Monetary Fund (2008), Global Financial Stability Report. April.
Keys, B. J., Mukherjee, T. K., Seru, A. & Vig, V. (2008), ‘Did securitization lead to lax screening? Evidence
from subprime loans’, Working Paper .
Khandani, A. E. and Lo, A. W. (2007), ‘What happened to the quants in august 2007?’, Journal of
Investment Management 5, 5-54.
Kyle, A. S. (1985), ‘Continuous auctions and insider trading’, Econometrica 53, 1315–1335.
Mitchell, M., Pulvino, T. and Pedersen, L. H. (2007), ‘Slow moving capital’, American Economic Review
(Papers & Proceedings) 97(2), 215–220.
Morris, S. and Shin, H. (2004), ‘Liquidity black holes’, Review of Finance 8(1), 1–18.
Myers S. (1977), ‘Determinants of Corporate Borrowing’, Journal of Financial Economics, 5, 147-75.
Nakamoto, M. and D. Wighton. 2007. “Citigroup chief stays bullish on buy-outs.” Financial Times, July 9,
2007. At <http://www.ft.com/cms/s/0/80e2987a-2e50-11dc-821c-0000779fd2ac.html>.
Shin, H. S. (2009), ‘Reflections on Modern Bank Runs: A Case Study of Northern Rock’, Journal of
Economic Perspectives 23(1), forthcoming.
Shleifer, A. and Vishny, R. W. (1992), ‘Liquidation values and debt capacity: A market equilibrium
approach’, Journal of Finance 47(4), 1343–1366.
Shleifer, A. and Vishny, R. W. (1997), ‘The limits of arbitrage’, Journal of Finance 52(1), 35–55.
Stein, J. C. (2005), ‘Why are most funds open-end? Competition and the limits of arbitrage’, Quarterly
Journal of Economics 120(1), 247–272.
UBS (2008), Shareholder Report on UBS’s Write-Downs. April, 18. At
<http://www.ubs.com/1/e/investors/shareholderreport.html>.
February 25th, 2010
Special Section:
Derivatives, Collateralized Lending and
Complex Financial Instruments
Supplementary Material: “Are Derivatives Integral?”
Markus K. Brunnermeier*
Manuscript prepared for
Hearing at the Financial Crisis Inquiry Commission, February 26/27th, 2010.
*I am grateful for discussion with Patrick Bolton, Michael Gibson, Arvind Krishnamurthy, Bob Lockner,
Jonathan Parker, Martin Schmalz and especially Martin Oehmke. Disclaimer: This article is written from
an economists’ perspective. While I have tried to incorporate legal details when necessary, this
manuscript clearly does not reflect all legal intricacies.
1. Introduction
Most financial crises are preceded by lending booms, which are characterized by an increase in leverage
and maturity mismatch12 as funding becomes increasingly short-term. Moreover, in the run-up to the
current crisis, financial innovations in credit markets played a critical role. Tranching, CDOs, repos, CDS,
swaps, and off-balance sheet vehicles all became increasingly important. They were crucial in the shift
from a traditional banking model, in which the issuing banks hold loans until they are repaid, to an
“originate and distribute” banking model, in which loans are pooled, tranched and then resold via
securitization. Among these newly created securities, derivatives and securities contracts deserve
special attention, as they give their holders special provisions not enjoyed by regular collateral lending.
This may have emboldened “securities contracts lenders” to lend more aggressively in spite of
significant maturity mismatch. At the same time, the valuation of these products became much more
complex and worldwide financial market players became more interconnected.
In 2007, it became commonly known that the credit boom and the associated real estate bubble were
no longer sustainable, and the financial system started to grumble. Several amplification mechanisms
exacerbated a simple price correction to a major fallout.
Table 1, taken from the BIS quarterly report of December 2009, illustrates the sheer size of the over-the-
counter securities contracts and derivative markets.
12
A situation of assets with long maturities funded with short-term liabilities is referred to as maturity mismatch.
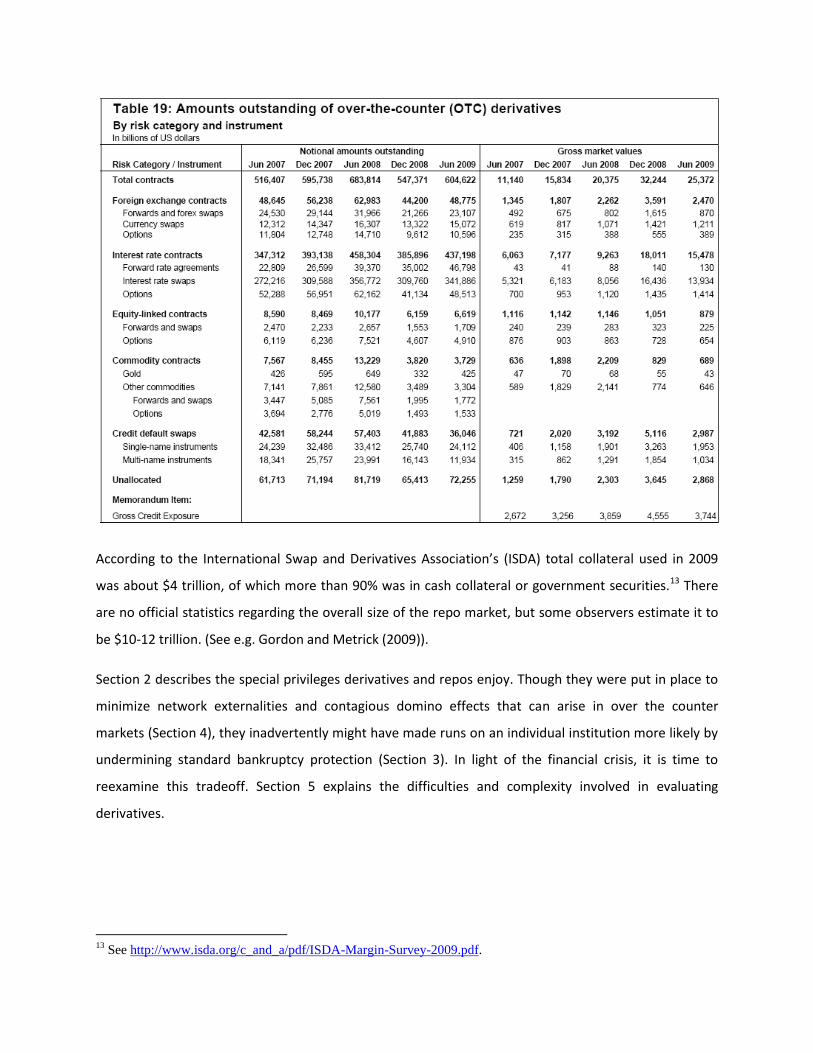
According to the International Swap and Derivatives Association’s (ISDA) total collateral used in 2009
was about $4 trillion, of which more than 90% was in cash collateral or government securities.13 There
are no official statistics regarding the overall size of the repo market, but some observers estimate it to
be $10-12 trillion. (See e.g. Gordon and Metrick (2009)).
Section 2 describes the special privileges derivatives and repos enjoy. Though they were put in place to
minimize network externalities and contagious domino effects that can arise in over the counter
markets (Section 4), they inadvertently might have made runs on an individual institution more likely by
undermining standard bankruptcy protection (Section 3). In light of the financial crisis, it is time to
reexamine this tradeoff. Section 5 explains the difficulties and complexity involved in evaluating
derivatives.
13
See http://www.isda.org/c_and_a/pdf/ISDA-Margin-Survey-2009.pdf.
2. The Privileged Treatment of Derivatives and Other Securities
Contracts
Derivatives, repos, and other “protected” trading arrangements enjoy special treatment compared to
many other (even collateralized) liabilities. Many of these features are standardized in master
agreements provided by ISDA, who also lobbied to enshrine some of these features into law. According
to ISDA’s 2009 survey of 151,000 collateral agreements, about 87% are ISDA agreements. This section
highlights some of these special features. They form the basis for the analysis of the subsequent
sections, which study the main amplification mechanisms present at the current crisis. Our list includes:
Collateral - Rehypothecation
Collateral can be either physical capital, such as real estate or machines, or financial securities. Physical
collateral stays with the borrower since it is more productive in the borrowers’ hands. For derivative
contracts, most collateral assets are financial securities, which change hands from the borrower to the
lender. The lender can even reuse - rehypothecate - this collateral further to refinance its position. At
the end, a single collateral asset can be used for a whole string of lending activities.
Mark-to-market
For derivative contracts there is no clear alternative to marking to market, as their value can fluctuate
wildly within short time intervals. This increases transparency and reduces asymmetric information
problems. However, during the crisis, many derivatives markets became illiquid, making marking to
market more challenging.
Netting
Netting (or more generally “set-off”) allows two counterparties with off-setting claims to collapse their
multiple claims to a single claim. Netting is especially important for security transactions since they
typically involve off setting positions which are less common for regular business transactions. Netting
effectively gives the netting counterparties priority over all other counterparties. This can reduce the
aggregate amount of credit risk, but it also shifts risks to third parties (most likely general creditors).
Netting has the advantage that it saves on collateral, since both netting parties’ collateral only has to
cover the net position. Of course, third counterparties, who suffer an externality from this netting, might
have to pledge more collateral. Most derivatives, especially those that are traded on an exchange, are
marked to market and netted on a daily basis. Depending on the price movement, extra collateral has to
be delivered by, or is returned to, a particular counterparty.

Close out netting/termination privileges
In case of bankruptcy, general creditors typically have to wait for several months for their claims to be
settled. For derivatives and repo counterparties, netting without close out right would imply that the
netted amount would stay in bankruptcy and the claim could vary in value until it is ultimately settled.
Since the total recovery value is not known, this makes it difficult to hedge this position – especially if
the position is just one leg of a multi-leg hedging position. The “close out right” grants the derivative or
repo holder the right to immediately close the position and freeze the exposure when a credit event
occurs. This includes the right to immediately seize the collateral and sell it to the market. If the
proceeds from selling the collateral fall short of what is owed, the derivative holder has a regular
bankruptcy claim for the remaining amount. In addition to repos, swaps and other derivatives,
warehouse loans are also protected from automatic stay in case of bankruptcy.14
Close out rights are contingent on a specific event, such as bankruptcy or a credit rating downgrade.
Close out netting rights are very powerful since they essentially grant seniority and make the liability
very short-term. For example, a rating downgrade can suddenly shorten the liability structure, leading to
a much more severe maturity mismatch.
As a result of the special treatment of derivatives, banks can have significant incentives to structure
loans in terms of derivatives (e. g. swaps). For example, when a debt contract is structured through a
total return swap, it can be closed out immediately when the lender defaults or the credit rating drops
below a certain level. In other words, if such an adverse state of the world were to materialize, this
“effective debt contract” would become very short-term and get highest priority. Enron supposedly
used this “trick” in its final stage to obtain extra financing. A more recent example is a proposed total
return swap agreement between Goldman and CIT, backed by CIT’s investment-grade asset-backed
securities. This allowed Goldman to obtain a higher seniority, which helped to overcome CIT’s debt
overhang problem.15 Derivative contracts can also be used to outmaneuver regulatory hurdles. For
example, Greece used swap deals in 2002 instead of straight debt to hide the fact that it had received
extra funding.
14
American Home experienced this during its bankruptcy case in 2007,
http://www.bloomberg.com/apps/news?pid=20601087&sid=ayarn96oE_kw. 15
See for example http://blogs.wsj.com/deals/2008/06/13/goldman-sachss-strategy-to-save-cit/tab/article/ or
http://blogs.reuters.com/rolfe-winkler/2009/10/06/why-privilege-derivatives/.
3. Liquidity Spirals and Fire-sale externality
Liquidity spirals emerge when investors hold long-term securities with low market liquidity, financed
with short-term liabilities that need to be rolled over. Positions funded with derivatives with close out
provisions are especially susceptible to such spirals since the counterparty can suddenly terminate the
funding if the default event occurs.
Loss-spiral:
A loss spiral can arise for leveraged investors since a decline in asset value erodes their mark-to-market
net worth much faster than their gross worth, and the amount they can borrow falls. (See outer spiral of
Figure 1.) For example, consider an investor who buys $100 million worth of assets on a 10 percent
margin. This investor finances only $10 million with its own capital and borrows $90 million. The
leverage ratio is 10. Now suppose that the value of the acquired asset declines temporarily to $95
million. The investor, who started out with $10 million in capital, has now lost $5 million and has only $5
million of its own capital remaining. If the investor, possibly as required by legislation, holds the leverage
ratio constant at 10, this investor is forced to reduce the overall position to $50 million—which means
selling assets worth $45 million, exactly when the price is, possibly temporarily, low. However, these
sales depress the price further, inducing more selling and so on.
The loss spiral is especially pronounced for assets and derivatives with low market liquidity, as selling
them at a time of financial distress brings about a greater price drop than selling a more liquid asset. For
many structured finance products, market liquidity is so low that no reliable price even exists because
no trade takes place. As a consequence, owners have considerable discretion in what value to place on
the asset. Selling some of these assets in a financial crisis would establish a low price and force the
holder to mark down remaining holdings. Hence, investors are reluctant to do this and, instead, prefer
to sell assets with higher market liquidity first.
The loss spiral is largest in a mark-to-market environment since any price drop translates into a mark-to-
market wealth reduction, even if it just reflects a temporary liquidity drop. Recall that most derivatives
are usually marked-to-market.
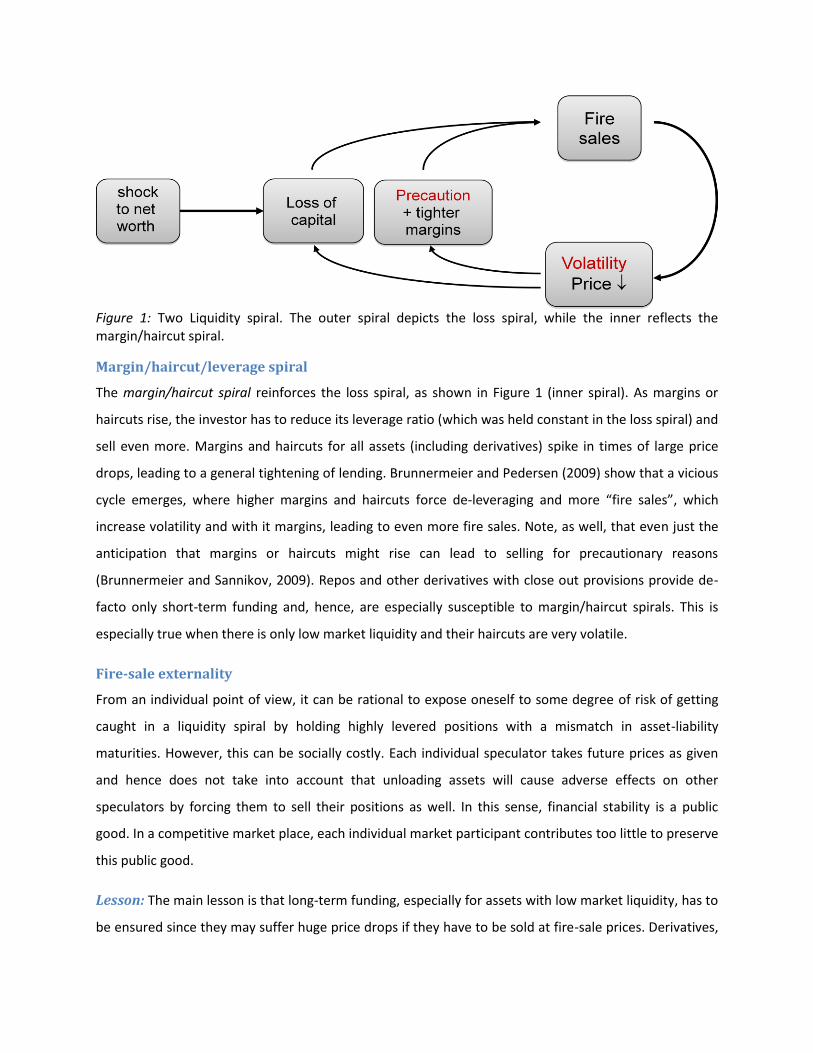
Figure 1: Two Liquidity spiral. The outer spiral depicts the loss spiral, while the inner reflects the margin/haircut spiral.
Margin/haircut/leverage spiral
The margin/haircut spiral reinforces the loss spiral, as shown in Figure 1 (inner spiral). As margins or
haircuts rise, the investor has to reduce its leverage ratio (which was held constant in the loss spiral) and
sell even more. Margins and haircuts for all assets (including derivatives) spike in times of large price
drops, leading to a general tightening of lending. Brunnermeier and Pedersen (2009) show that a vicious
cycle emerges, where higher margins and haircuts force de-leveraging and more “fire sales”, which
increase volatility and with it margins, leading to even more fire sales. Note, as well, that even just the
anticipation that margins or haircuts might rise can lead to selling for precautionary reasons
(Brunnermeier and Sannikov, 2009). Repos and other derivatives with close out provisions provide de-
facto only short-term funding and, hence, are especially susceptible to margin/haircut spirals. This is
especially true when there is only low market liquidity and their haircuts are very volatile.
Fire-sale externality
From an individual point of view, it can be rational to expose oneself to some degree of risk of getting
caught in a liquidity spiral by holding highly levered positions with a mismatch in asset-liability
maturities. However, this can be socially costly. Each individual speculator takes future prices as given
and hence does not take into account that unloading assets will cause adverse effects on other
speculators by forcing them to sell their positions as well. In this sense, financial stability is a public
good. In a competitive market place, each individual market participant contributes too little to preserve
this public good.
Lesson: The main lesson is that long-term funding, especially for assets with low market liquidity, has to
be ensured since they may suffer huge price drops if they have to be sold at fire-sale prices. Derivatives,

even if they are structured for the long term, are often essentially only short-term funding instruments.
Margin lending is essentially overnight since the margins can be adjusted on a daily basis. Haircut and
margins are too low in normal times, but can be suddenly and excessively increased in times of crises.
The tri-party repo market is another example where a creditor (in this case the clearing bank) can come
in after a firm enters a liquidity spiral and achieves “de facto seniority”. For a firm that funds itself with
triparty repo, loss of access to the repo market would be a catastrophic event. The firm will hence go to
great lengths to meet any collateral demand of its clearing bank. Knowing that it can hike margins, this
allows the clearing bank to impose very lax collateral requirements during normal times. This introduces
a procyclicality.
4. Run externality – undermining bankruptcy protection
Financial institutions and markets may be subject to runs that lead to socially inefficient outcomes.
Consider a simple example of a firm which owes each of its 100 creditors $1. Suppose that the going
concern value of this firm drops to $99 and the liquidation value is only $80. Though the firm is
insolvent, but its liquidation would be socially inefficient. If creditors are served sequentially, i.e.
creditors who run first receive their full dollar while the remaining creditors receive what is left, then all
creditors will start running. Consequently, the firm will start liquidating its assets and will pay the first 80
creditors $1 each, while the last 20 creditors will receive nothing. Essentially, the first 80 creditors cause
a negative externality on the last 20 creditors.
Lesson: To avoid runs (or speculative attacks) on firms, an elaborate bankruptcy protection code was
established that ensures that the firm can keep on running such that each of the 100 creditor receives a
claim worth cent 99.
Most creditors’ debt is subject to a so-called “automatic stay” in case of bankruptcy in order to ensure
an orderly liquidation or to preserve going concern values. Additionally, for commercial banks, a deposit
insurance facility was put in place. However, as mentioned above, most derivative contracts enjoy “close
out privileges” and, consequently, are exempt from automatic stays.
Non-collateralized “derivative obligations”
A creditor can net and close out early his derivative obligation with other obligations. He thereby gains
an advantage at the expense of other creditors. Anticipating this, other unsecured creditors will also net
and close out their derivative positions early or simply refuse to rollover their debt. As a consequence, a
struggling firm is more likely to go through an expensive bankruptcy procedure. Since some long-term
derivative contracts are terminated early, the bankruptcy protection is partially undermined.
Collateralized obligations
Most derivative contracts and (almost) all exchange-traded derivatives and repos are collateralized.
Hence, it is natural to compare them with regular collateralized loans. Unlike for derivatives, for regular
collateralized loans the underlying collateral automatically stays with the firm in case of bankruptcy (and
the firm can continue using it etc.). Hence, bankruptcy itself does not damage the going concern value of
a firm. This is in sharp contrast to collateral for derivative contracts, repos and even warehouse loans,
which can be immediately seized in case of bankruptcy (or even if pre-specified in case of a rating
downgrade).
Lesson: Since any collateralized loans can be restructured as a swap agreement, in the future each
individual creditor will have an incentive to opt for a derivative contract instead of a collateralized loan.
This has the potential to undermine the spirit of the bankruptcy code and to reintroduce runs.
Arguably, the realization by many ordinary bond and commercial paper holders that derivative contracts
allow others to overturn the seniority structure might have contributed to the sudden increase in
spreads.
However, one might argue that, for derivatives and repo, collateral consists primarily of financial
securities instead of physical assets like real estate and machines. As a consequence, the argument goes,
seizing the collateral might not impair the functioning of a non-financial corporation. However, financial
firms have often rehypothecated collateral securities, making for a more efficient use of the same
collateral. In other words, the value of collateral within a financial firm is higher than with a retail
investor. Hence, just the fear of a bankruptcy may trigger a whole chain reaction of liquidation. Fearing
such a chain reaction, investors have an incentive to run even before it is started.
Asking a struggling counterparty for more collateral drains its collateral pool and might even drive it into
bankruptcy. This is especially the case for financial firms that rely on collateral financing. Arguably, Bear
Stearns’ counterparties confronted Bear Stearns with trades that transferred collateral away from its
books (Duffie 2009). Bear Stearns was essentially forced to execute these trades in order to signal that it
was financially sound. In contrast, lenders using regular collateralized loans might be reluctant to push
for more financial securities as collateral, since they know that this might drive the borrower into
bankruptcy. In the case of bankruptcy, their collateral would be subject to an automatic stay and they
would have to go through a lengthy bankruptcy procedure in order to obtain it. In contrast, collateral for
derivative and repo positions is not subject to the automatic stay. Each individual investor is not
concerned about closing out the collateral positions even if this means driving a firm into bankruptcy.
Furthermore, if the market liquidity of the underlying collateral is low, each individual derivative holder
may have an incentive to close out and liquidate the collateral before others do and before the
liquidation price is depressed. Many securities markets turned out to be surprisingly illiquid during the
recent financial crisis. Each investor foreseeing this has an incentive to run early.16 Recognizing that a
fire-sale of collateral might depress prices and induce runs, the law known as FIRREA introduced so
called “qualified financial contracts” (QFCs), which includes derivatives, repos and other trading
instruments. This law grants the Federal Deposit Insurance Corporation (FDIC) an extra day to find a
solvent bank which is willing to take on an entire trading book. That is, creditors cannot close out their
position for one day. However this rule only applies to commercial banks and not to broker/dealers,
insurance companies or hedge funds.17Also, if the collateral value drops so much such that it does not
fully cover the obligation and the borrower does not come up with new collateral asset, each individual
counterparty has an incentive to close out the position right away and dump the collateral on the
market. This, of course, depresses the collateral value even further, enhancing the incentive to run even
more.
Finally, it is important to note that observing runs in collateralized markets does not indicate that they
are especially prone to runs. Exactly the opposite is the case. Uncollaterallized debt markets would be
even more subject to runs were it not for the bankruptcy code. We only observe collateral runs more
often because collateralized funding is the only available source of funding at the onset of a crisis –
unsecured funding typically dries up long before. In sum, even though collateralization makes markets
less prone to runs, runs can still emerge and hence should be serious concern.
Naked CDS
Buying protection against a credit event without holding the underlying corporate bond – i.e., holding a
naked CDS – allows investors to benefit from a firm’s default. Hence, the holder of the credit derivative
has more to gain by pushing a struggling firm into bankruptcy rather than by helping to rescue it.
Owners of CDS contracts might be especially reluctant to agree to costly restructuring plans. Of course,
16
Unsecured lenders and lenders who do not enjoy the special close-out provision have an even stronger incentive to
run. 17
Treasury proposed and the House bill's special “dissolution” authority includes this QFC provision for any special
resolutions in the new law.
one might argue that naked CDS do not pose a problem since they are not linked with control rights and,
hence, CDS holders cannot vote and influence companies’ positions. However, nothing prevents holders
of large naked CDS positions from acquiring a small controlling stake to ensure a favorable outcome. For
a more detailed discussion of the empty creditor problem see Black and Hu (2006) as well as Bolton and
Oehmke (2010). 18
On the other hand, allowing investors to take on naked CDS positions has one big advantage. It allows
speculators to take a view and to speculate against too low credit spreads. This helps to make the price
signal more informative. Banning naked CDS trades would make it impossible for investors to express
their opinion that CDS spreads are too low. Since the informational role of prices and spreads is so
important, regulation should focus on transparency and regulating voting procedures instead.
5. Network Externality – Market Structure
Modern financial markets consist of a network of interwoven obligations. The purpose of the special
rules for derivatives laid out above was to reduce the complexity of financial networks and to thereby
reduce systemic risk, especially contagious domino effects. While partially successful in this dimension,
they also made individual institutions more exposed to runs. A simple way to reduce the complexity of
the network structure is to establish a central clearing house, which acts as a central counterparty for all
investors.
5.1. Over the counter markets
Derivatives, which are primarily traded over the counter (OTC), require the special privileges discussed
above to ensure that the network is not getting out of hand despite its adverse side effects.
Novating and multi-lateral netting
Novating of contracts reduces the number of claims across several parties. The process of novating is
best illustrated with an example. Imagine a hedge fund that has an interest rate swap agreement with
investment bank A—that is, both parties had agreed to swap the difference between a floating interest
18
It might seem at first sight paradoxical that investors are more willing to lend money when default is very painful
for the borrower. Just ensuring that default is painless in the bad outcome might hurt ex-ante ability to raise funds.
CDS might make ex-post renegotiation more difficult and hence increase ex-ante efficiency.
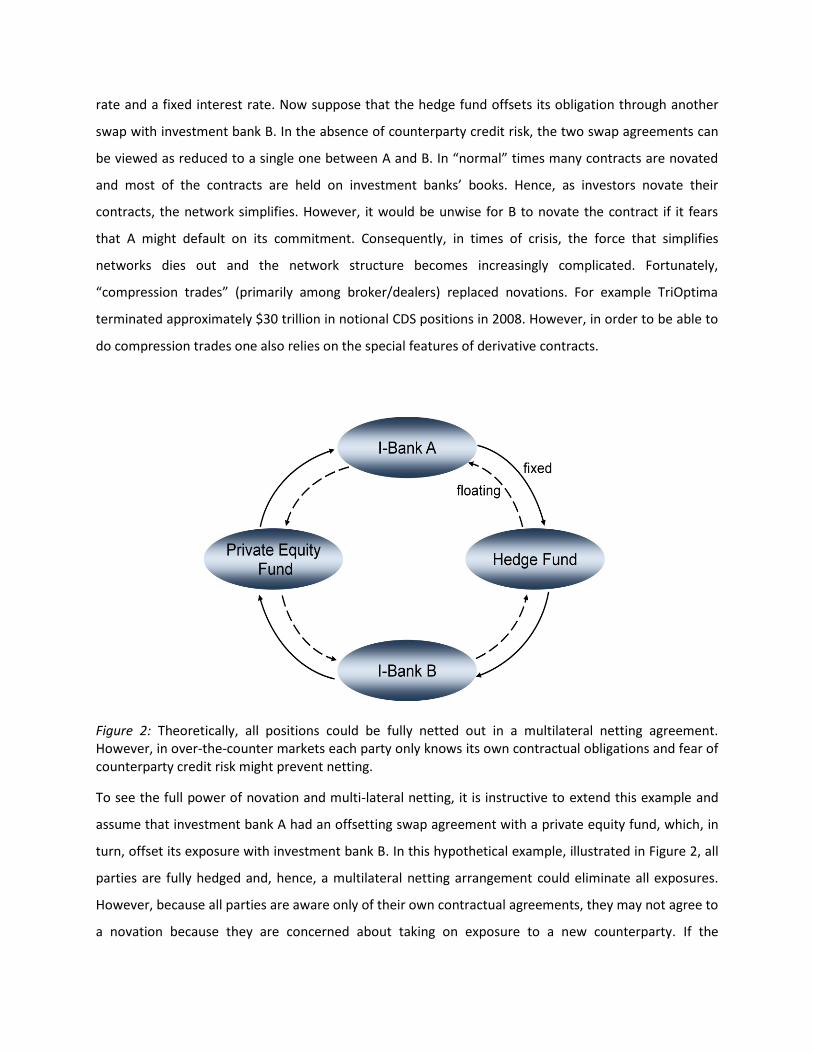
rate and a fixed interest rate. Now suppose that the hedge fund offsets its obligation through another
swap with investment bank B. In the absence of counterparty credit risk, the two swap agreements can
be viewed as reduced to a single one between A and B. In “normal” times many contracts are novated
and most of the contracts are held on investment banks’ books. Hence, as investors novate their
contracts, the network simplifies. However, it would be unwise for B to novate the contract if it fears
that A might default on its commitment. Consequently, in times of crisis, the force that simplifies
networks dies out and the network structure becomes increasingly complicated. Fortunately,
“compression trades” (primarily among broker/dealers) replaced novations. For example TriOptima
terminated approximately $30 trillion in notional CDS positions in 2008. However, in order to be able to
do compression trades one also relies on the special features of derivative contracts.
Figure 2: Theoretically, all positions could be fully netted out in a multilateral netting agreement. However, in over-the-counter markets each party only knows its own contractual obligations and fear of counterparty credit risk might prevent netting.
To see the full power of novation and multi-lateral netting, it is instructive to extend this example and
assume that investment bank A had an offsetting swap agreement with a private equity fund, which, in
turn, offset its exposure with investment bank B. In this hypothetical example, illustrated in Figure 2, all
parties are fully hedged and, hence, a multilateral netting arrangement could eliminate all exposures.
However, because all parties are aware only of their own contractual agreements, they may not agree to
a novation because they are concerned about taking on exposure to a new counterparty. If the
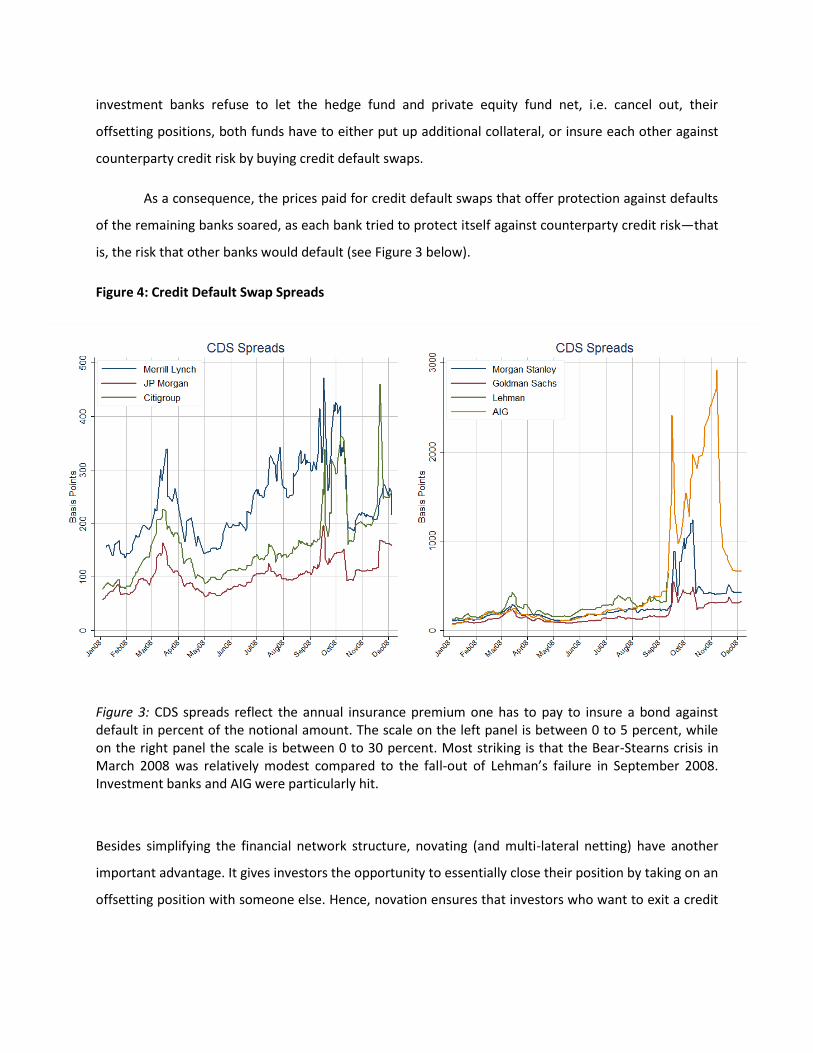
investment banks refuse to let the hedge fund and private equity fund net, i.e. cancel out, their
offsetting positions, both funds have to either put up additional collateral, or insure each other against
counterparty credit risk by buying credit default swaps.
As a consequence, the prices paid for credit default swaps that offer protection against defaults
of the remaining banks soared, as each bank tried to protect itself against counterparty credit risk—that
is, the risk that other banks would default (see Figure 3 below).
Figure 4: Credit Default Swap Spreads
Figure 3: CDS spreads reflect the annual insurance premium one has to pay to insure a bond against default in percent of the notional amount. The scale on the left panel is between 0 to 5 percent, while on the right panel the scale is between 0 to 30 percent. Most striking is that the Bear-Stearns crisis in March 2008 was relatively modest compared to the fall-out of Lehman’s failure in September 2008. Investment banks and AIG were particularly hit.
Besides simplifying the financial network structure, novating (and multi-lateral netting) have another
important advantage. It gives investors the opportunity to essentially close their position by taking on an
offsetting position with someone else. Hence, novation ensures that investors who want to exit a credit
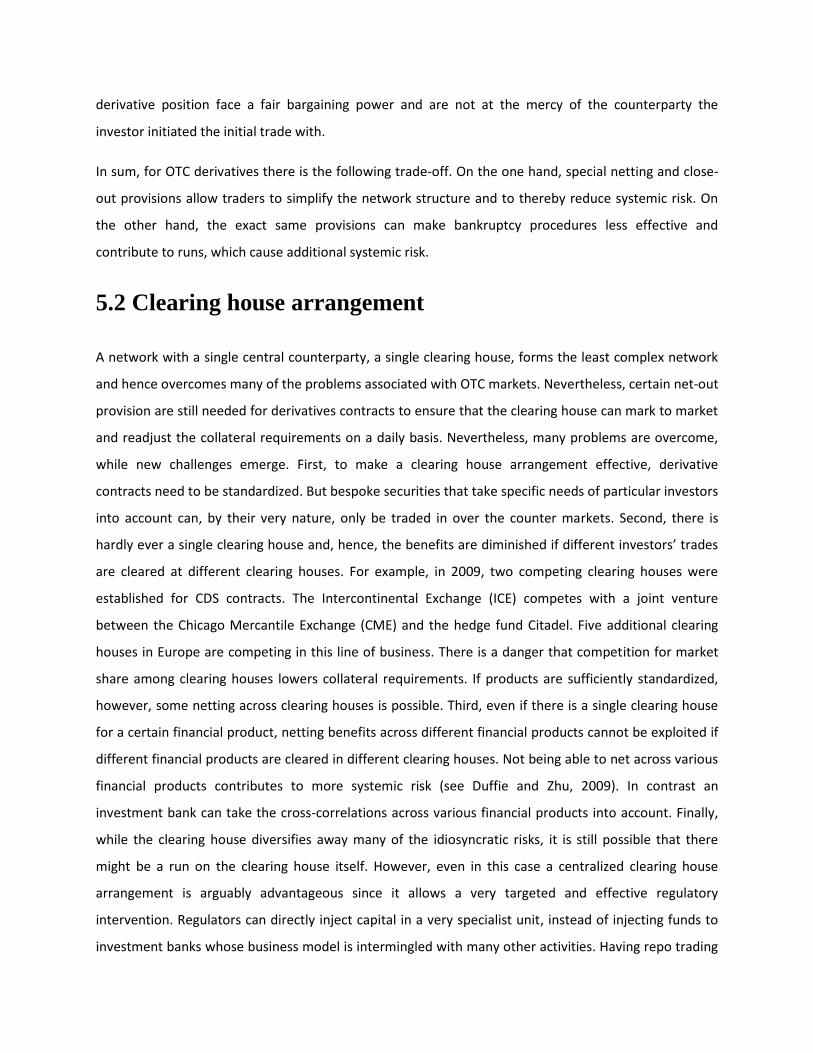
derivative position face a fair bargaining power and are not at the mercy of the counterparty the
investor initiated the initial trade with.
In sum, for OTC derivatives there is the following trade-off. On the one hand, special netting and close-
out provisions allow traders to simplify the network structure and to thereby reduce systemic risk. On
the other hand, the exact same provisions can make bankruptcy procedures less effective and
contribute to runs, which cause additional systemic risk.
5.2 Clearing house arrangement
A network with a single central counterparty, a single clearing house, forms the least complex network
and hence overcomes many of the problems associated with OTC markets. Nevertheless, certain net-out
provision are still needed for derivatives contracts to ensure that the clearing house can mark to market
and readjust the collateral requirements on a daily basis. Nevertheless, many problems are overcome,
while new challenges emerge. First, to make a clearing house arrangement effective, derivative
contracts need to be standardized. But bespoke securities that take specific needs of particular investors
into account can, by their very nature, only be traded in over the counter markets. Second, there is
hardly ever a single clearing house and, hence, the benefits are diminished if different investors’ trades
are cleared at different clearing houses. For example, in 2009, two competing clearing houses were
established for CDS contracts. The Intercontinental Exchange (ICE) competes with a joint venture
between the Chicago Mercantile Exchange (CME) and the hedge fund Citadel. Five additional clearing
houses in Europe are competing in this line of business. There is a danger that competition for market
share among clearing houses lowers collateral requirements. If products are sufficiently standardized,
however, some netting across clearing houses is possible. Third, even if there is a single clearing house
for a certain financial product, netting benefits across different financial products cannot be exploited if
different financial products are cleared in different clearing houses. Not being able to net across various
financial products contributes to more systemic risk (see Duffie and Zhu, 2009). In contrast an
investment bank can take the cross-correlations across various financial products into account. Finally,
while the clearing house diversifies away many of the idiosyncratic risks, it is still possible that there
might be a run on the clearing house itself. However, even in this case a centralized clearing house
arrangement is arguably advantageous since it allows a very targeted and effective regulatory
intervention. Regulators can directly inject capital in a very specialist unit, instead of injecting funds to
investment banks whose business model is intermingled with many other activities. Having repo trading
cleared at a separate and independent unit is therefore a desirable market structure. Overall, a clearing
house arrangement is not a substitute for careful supervision by regulatory authorities and it is not clear
whether it would have avoided the AIG debacle. AIG held a large portfolio of bespoke and customized
derivatives which are difficult to clear through a central counter party.
Requiring CDS contracts to be traded on an exchange goes beyond a clearing house arrangement, since
it would, in addition, provide improved price transparency. This would enhance the efficiency of the
market place for these securities even further beyond simply reducing counterparty credit risk.
Lesson: It is important to give financial institutions an incentive to create and prefer standardized
contracts that can be cleared. OTC positions should be subject to higher capital requirements and it is
essential to impose strict disclosure requirements in order to identify concentration risks.
6. Complexity Many of the securities and derivatives traded are considered to be complex. During the run-up of the
credit bubble investors did not fully appreciate the complexity of these securities. Defining the
complexity of a security is surprisingly difficult.
Complexity due to network: As outlined above, not only is the valuation of the payoff stream of these
assets complex, but so is the trading structure and its aggregate implications. This is the case since the
whole network structure is not commonly known and hence domino effects and counterparty credit risk
is subject to huge uncertainty.
Bottom-up modeling: Modeling securities such as CDOs from first principles requires complicated
mathematical models based on simplifying assumptions. Many of these models are highly sensitive to
changes in parameter values, which are themselves very difficult to estimate. For example, the value of
a CDO tranche depends crucially on the correlation of the assets in the underlying investment pool. If all
assets are highly correlated then the senior tranche is not very protected. When a negative shock hits,
all assets will suffer and hence both top and bottom tranches lose value. On the other hand, if the assets
are not correlated, some assets might default, while others perform well. In this case, the top tranche is
protected since it is very unlikely that the whole pool of assets will perform so poorly that the top
tranche is affected. Unfortunately, the correlations of the underlying securities are often very difficult to
estimate. In addition, a small change in correlation can have large pricing implications, especially for the
senior tranches of CDOs. In other words, the true correlations are likely to turn out to be different from
the estimated correlations, causing the prices of senior tranches to fluctuate wildly.
In applying valuation models for CDOs, various mistakes were made: (i) to keep the bottom-up approach
tractable, simplifying model assumptions were made that distorted the valuation formulas. (ii) Models
were fed with past data and thus implicitly relied on the assumption that future statistical relationships
will be the same as those observed in the past. However, the fact that there had never before been a
nationwide decline in nominal house prices does not imply that the same will be true in the future. (iii)
Further, international data (e.g. data on the Japanese real estate bubble) would have been helpful in
identifying the build-up of the bubble earlier. (This would have led to much lower valuations of the
senior tranches.) (iv) Derivatives are priced relative to other assets. Hence, the mispricing of a few
underlying assets can distort the prices of a whole set of derivatives written on that underlying.
Price revelation through liquid trading: If one were to value an investment bank “bottom-up”, i.e. by
considering each of its businesses, their positions, projected cash flows and their risk profile, the
resulting exercise would likely be at least as complex as coming up with a price for the tranche of a CDO.
In fact, since an investment bank holds a multitude of complex financial securities, including CDOs, on its
balance sheet, finding a bottom-up price for Goldman’s equity is arguably even more complex than
finding a value for a single CDO tranche. Note that this argument pertains not necessarily only to
financial firms. A similar logic holds for valuing companies outside the financial sector. Coming up with a
bottom-up valuation for General Electric, for example, would involve modeling all of GE’s businesses,
their projects, the resulting cash flows, cash flow risks, and correlations. For a conglomerate like GE this
is a similarly formidable task and, once again, not necessarily simpler than valuing a CDO. Nevertheless,
evaluating the stock of firms is considered significantly less complex. The reason may be that daily prices
revealed through liquid markets provide a sufficient signal to reduce the level of complexity.
Standardization: Finally, complexity can be reduced via standardization or regulation through a third
party. Standardization of contractual terms reduces complexity by clearly defining the ‘rules of the
game’ to market participants. A good example of this type of standardization is the set of rules outlined
by the International Swaps and Derivatives Association (ISDA) for the swaps and derivatives markets.
These contractual standards reduce complexity since they can be fixed for an entire set of securities
(leading to homogenization) and do not have to be agreed upon every single time two parties want to
trade (leading to commoditization).19 Securities that adhere to such clear and simple standards of this
type are often referred to as plain vanilla.
In addition to direct standardization of contractual terms, standardization can also occur when a
number of investors use the same or similar models to price securities. We call this effect
standardization through (commonly used) models. Once a model becomes popular enough to be
considered standard by market participants, it also becomes easier to sell the security before expiry. This
standardization happened quickly in the case of the Black-Scholes model, partly because the formula
was available on programmable calculators. Being able to sell an option contract before expiry is
valuable in the presence of liquidity shocks. A trader who, at time t, enters into an options contract with
expiry at time T may be forced to liquidate his position at time x< T. Standardization of valuation models
facilitates the liquidation of a position before maturity, because the valuations of potential buyers using
similar models are likely to be relatively close to the seller’s valuation. In other words, standardization
reduces the potential for mispricing before expiry. This standardization effect of models is in addition to
the direct effect, which allows investors to price options assuming that they will hold them until
maturity, independently of whether other investors use the same pricing model.
Reference:
Bliss and Kaufmann (2005), “Derivatives and Systemic Risk: Netting, Collateral, and Closeout”, Federal
Reserve Bank of Chicago Working Paper 2005-03.
Bolton and Oehmke (2010), “Credit Default Swaps and the Empty Creditor Problem”, Columbia Business
School Working Paper.
Brunnermeier (2009), “Deciphering the Liquidity and Credit Crunch 2007-08”, Journal of Economic
Perspectives.
Brunnermeier and Oehmke (2009), “Complexity in Financial Markets”, Princeton University Working
Paper.
Brunnermeier and Pedersen (2009), “Market Liquidity and Funding Liquidity”, Review of Financial
Studies.
19
For a more formal treatment of the standardization of securities, a good starting point is Gale (1992).
Brunnermeier and Sannikov (2009), “A Macroeconomic Model with a Financial Sector”, Princeton
University Working Paper.
Duffie (2009), “Policy Issues Facing the Market for Credit Derivatives”, in “The Road Ahead for the Fed”
edited by John D. Ciorciari and John B. Taylor.
Duffie (2010), “The Failure Mechanics of Dealer Banks”, Journal of Economic Perspectives,
(forthcoming).
Duffie and Zhu (2009), “Does a Central Clearing Counterparty Reduce Counterparty Risk?”, Stanford
University Working Paper.
Krishnamurthy (2010), “How Debt Markets Have Malfunctioned in the Crisis”, Journal of Economic
Perspectives.
Fleming and Garbade (2003), “The Repurchase Agreement Refined: GCF Repo”, Federal Reserve Bank of
New York Current Issues in Economics and Finance.
Gordon and Metrick (2009), “Securitized Banking and the Run on Repo”, Working paper NBER 15223.
Hu and Black (2006), “The New vote buying: Empty Voting and Hidden (Morphable) Ownership”
Southern California Law Review, 79, 811-908.
Zawadowski (2009), “Entangled Financial Systems”, Princeton University Working Paper.