Embed Size (px)
Citation preview
European Journal of Research and Reflection in Management Sciences Vol. 4 No. 1, 2016 ISSN 2056-5992
Progressive Academic Publishing, UK Page 14 www.idpublications.org
FINANCIAL LEVERAGE AND FIRMS’ VALUE: A STUDY OF SELECTED FIRMS
IN NIGERIA
ADENUGBA, Adesoji Adetunji
Department of Accounting & Finance,
Crawford University, Igbesa, Ogun State, NIGERIA
IGE, Abayomi Akinyemi
Department of Accounting & Finance
Crawford University, Igbesa Ogun State, NIGERIA
&
KESINRO, Olalekan Rasheed
Department of Administration and Management
Crawford University, Igbesa Ogun State, NIGERIA
ABSTRACT
The main objective of this study is to determine the relationship between financial leverage
and firms’ value, as well as evaluate the effect of financial leverage on firms’ value. A sample
of 5 firms listed on Nigerian Stock Exchange (NSE) for a period of 6 years from2007-2012
was used. Data were sourced from annual reports of selected firms. The Ordinary Least Square
(OLS) statistical technique was used for data analysis and hypothesis testing. The study
revealed that there is significant relationship between financial leverage and firms’ value and
that financial leverage has significant effect on firms’ value. The study concludes that financial
leverage is a better source of finance than equity to firms when there is need to finance long-
term projects. However, various economic factors may have despicable effects on the
profitability of Nigerian firms, as such the use of debt financing in such firms may yield
negative impact such as bankruptcy as well as low firm value. The study therefore recommends
that financial leverage be optimized by firms to aid maximization of firms’ value.
Keywords: Financial Leverage, Firms’ Value, Financing, Profitability.
INTRODUCTION
Every firm whether small scale firms or large scale firms need funds to operate; especially
large scale firms, they need funds to expand their operations and activities. The motive of every
firm is to make profit, maximize owner’s wealth, and to achieve this motive they need to source
for fund in order to finance their operations and activities. Firms have multiple financing
sources to finance their investment. Basically, financing sources can be categorized into two;
the internal financing sources which include reserves and retained earnings; external financing
which includes long-term loans, bond issuance, ordinary and preferred stock issuance. (These
sources are long-term sources of finance).
Firms must choose the best financing sources to reach the optimal capital structure so that they
can make suitable financing decision that would enable them achieve positive returns. Financial
leverage is the extent to which fixed income securities (debt) are used in a firm’s capital
structure. A firm’s capital structure is the composition or structure of its liabilities.
Furthermore, financial leverage reflects the amount of debt used in capital structure of the firm.
Debt carries fixed obligation of interest payment. Thus, financial leverage increases as the fixed
financial expenses of a firm increases i.e. interest expenses increases as higher amount of debt
is incurred. Also with a high level of debt relative to equity, a small percentage change in
earnings before interest and tax (EBIT) will lead to a large percentage change in net income.
European Journal of Research and Reflection in Management Sciences Vol. 4 No. 1, 2016 ISSN 2056-5992
Progressive Academic Publishing, UK Page 15 www.idpublications.org
Technically, financial leverage is defined as the percentage change in earning after tax (EAT)
divided by percentage change in EBIT. An example of financial leverage is when a firm is
financed with #100,000 having a capital structure of #20,000 owner equity and #80,000 loan
debt having an interest rate of 5% annually. A firm can be either highly levered (having more
debt than equity than debt in its capital structure) or lowly levered (having more equity than
debt in its capital structure). Furthermore, having debt in a firm’s capital structure is beneficial
to a firm; this is because a firm with debt in its capital structure enjoys tax savings as interest
is paid before tax is deducted from the firm’s income. Financial experts also stated that financial
leverage is a financial tool that is widely used to improve a firm’s rate of return and its value.
However, financial leverage irrespective of its benefit to a firm, also creates financial risk such
as risk to the company; if a highly levered firm is unable to make sufficient EBIT, such firm
might go into liquidation as it may not be able to meet its interest obligations and also finance
other expenses of the firm.
Another risk is to the stockholder; if the firm incurs losses, this will cause greater volatility in
earning and therefore greater volatility in the stock price and also such firm may not be able to
pay any dividend to its ordinary stockholders as it would have to pay preferred stockholders
prior to ordinary shareholders. However, the objective of a firm according to James C. Van
Horne (1974) is to maximize its value to its shareholders. Value of a firm is represented by the
market value of the company’s ordinary shares, which in turn is a reflection of the firm’s
investment, financing and dividend decisions. And since financial leverage affects the cost of
capital of a firm, it will also affect the value of the firm.
It should be noted that, maximizing earnings per share usually is not the same as maximizing
market price per share. The market price of a firm’s stock represents the value which the market
participants place on it. Also, a firm creates value when the expected returns exceed the returns
required by the financial market. The study will examine the relationship between financial
leverage and firms’ value by providing answers to the following questions:
1. Is there any relationship between financial leverage and a firm’s value?
2. What is the effect of financial leverage on a firm’s leverage?
Statement of hypotheses
To determine whether there is a relationship between financial leverage and firms’ value, the
following hypothesis would be tested:
H0: There is no significant relationship between financial leverage and firms’ value.
H1: There is significant relationship between financial leverage and firms’ value.
H0: Financial leverage has no effect on a firm’s value.
H1: Financial leverage has effect on a firm’s value.
FINANCIAL LEVERAGE
In general context, financial leverage is the use of debt in a firm's capital structure. In finance,
capital structure refers to the way a corporation finances its assets through combination of
equity, debt or hybrid securities. A firm's capital structure is then the composition of its
liabilities. For example, a firm that sells N20 billion in equity and N80 billion in debt, is said
to be 20% equity financed and the firm's ratio of debt to total financing 80% in this example is
referred to as the firm's leverage. Hence, a firm's capital structure is an indicator of the
proportion of debt to equity.

European Journal of Research and Reflection in Management Sciences Vol. 4 No. 1, 2016 ISSN 2056-5992
Progressive Academic Publishing, UK Page 16 www.idpublications.org
Ross, Westerfield and Jordan (1998), retreated that the use of debt in a firm's capital structure
is called financial leverage. The more debt a firm has, the greater is its degree of financial
leverage. To them (Ross et al 1998), debt acts as a lever in the sense that using it can greatly
magnify both gains and losses. Hence, financial leverage increases the potential rewards to
shareholders, but it also increases the potential for financial distress and business failures.
According to Horne (2002), the change in capital structure that is caused by an increase or
decrease in the ratio of debt to equity is referred to as financial leverage. When a firm includes
debt as a proportion of funds employed to finance its project, financial leverage is brought into
being. Financial leverage is a company practice of the acquisition of part assets of the company
with fixed interest capital with the hope of increasing ends results of the common stock holders.
(Oloyede, 2000).
BENEFITS OF DEBT IN A CAPITAL STRUCTURE (ADVANTAGES OF
FINANCIAL LEVERAGE)
The following are advantages a firm enjoys in using debt to finance its assets:
1. Interest on debt is tax deductible and as such the cost of debt is reduced.
2. Debt holders are limited to a fixed return, so stockholders do not have to share profits if the
business does exceptionally well.
3. Debt holders do not have voting right over the company.
4. Financial leverage maximizes returns.
However, the use of high debt ratio leads to greater risk (financial risk) and higher required
interest rates (to compensate for the additional risk). Also financial leverage increases
shareholder risk as it concentrates the firm’s business risk on the shareholders, because debt-
holders who receive fixed interest payments bear none of the business risk. However, financial
leverage will enhance shareholders’ returns on the condition that the fixed charges funds (such
as the loan, debentures) can be obtained at a cost lower than the firm's rate of return on net
assets (ROWA or ROI).
DEGREE OF FINANCIAL LEVERAGE.
In finance, degree of financial leverage (DFL) is a ratio that measures the sensitivity of
company's earnings per share (EPS) to fluctuation in its operating income, as a result of changes
in capital structure. Degree of financial leverage (DFL) measures the percentage change in EPS
for a unit change in earnings before interest and tax (EBIT). DFL is superimposed on operating
leverage, changes in EBIT will have positive effect on both net income available to common
stock holders and EPS.vTherefore, if a company uses a considerable amount of both operating
and financial leverage, a small change in the level of sales will result in wide fluctuation in net
income and EPS.vHowever the main motive of firms using financial leverage is to increase
shareholders return under favourable condition (Pandy, 2003).vFinancial risk is the additional
variability of earnings induced by leverage. However, the impact of financial leverage given
the relative assumption that uncertainty prevails can be reduced to three alternatives:
1. Situation in which leverage increase risk, but at the same time decreases expected EPS.
2. Neutral situation in which the increase in risk following the introduction of leverage leaves
EPS unchanged.
3. Situation in which the introduction of leverage increases expected EPS and risk
simultaneously.

European Journal of Research and Reflection in Management Sciences Vol. 4 No. 1, 2016 ISSN 2056-5992
Progressive Academic Publishing, UK Page 17 www.idpublications.org
Furthermore, DFL is a change in EPS caused by the use of fixed payment securities to finance
a company's operations. DFL is the change in proposition of the earnings per share relative to
EBIT.
It is mathematically represented as:
DFL= % change in EPS
% change in EBIT
It can also be represented by the equation below:
DFL= EBIT
EBIT - Interest
I.e. DFL = Q (p-vc)-fc
Q (p-vc)-fc-I
Where Q= quantity
P= price per unit
fc= fixed cost
vc= variable cost per unit
I= interest
This ratio shows that the higher the degree of financial leverage, the more volatile is EPS. Since
interest is a fixed expense, leverage magnifies returns and EPS, which is good when operating
income is rising. But it can be a problem during tough economic times when operating income
is under pressure. Therefore, financial leverage is a two-edged sword which could either be
favourable or unfavourable.
COMMON MISCONCEPTIONS ABOUT FINANCIAL LEVERAGE
1. One popular prejudice against leverage is that people who borrow a lot of money often end
up badly. However, this is incorrect because this is not leveraging, it’s simply money borrowed
for consumption.
In finance, the general point of leverage is to borrow money to buy asset with a higher return
than interest on debt.
2. Another misconception is that the fact that collapsing firms often have lot of leverage.
However, this does not mean that leverage always causes collapses
FIRMS’ VALUE
Maximizing shareholders’ wealth is one of the corporate goals that cannot be ignored. The
market value of a firm is an important measure of the shareholders’ wealth.
Firm’s valuation is essential for deriving stock prices, an item of significance in many models
(keys and Briggs, 1990).
Determining a Firm’s Value
According to Biggs (1978), stock price sometimes, is the sole measure of performance in the
model. More commonly it is a major component of a weighted average that includes other
measure. The value of a firm can be obtained through different measures, each of which is
likely to give a value that differs from that obtained by another. The first and most readily
available measure of the value of a firm is its accounting net worth or book value. This measure
is however problematic, because the accounting rule in a model may be at variance (in
divergence) with generally accepted principles of financial accounting. This is because
conformance with some generally accepted principles such as historical cost and conservatism,

European Journal of Research and Reflection in Management Sciences Vol. 4 No. 1, 2016 ISSN 2056-5992
Progressive Academic Publishing, UK Page 18 www.idpublications.org
can lead to values that are far from what is reasonable. The second measure is the market value
of all its outstanding shares. This is a popular everyday- world method of valuating public
corporations. It application however requires an efficient real market for shares. This condition
is not met in models that do not allow participants to trade shares, and even when such trading
is allowed, the trades are generally too few and too infrequent for reliable valuation. The third
measure the capitalized value of its projected future performance. Modigliani and Miller (1961)
pointed out that although four distinct method of capitalization can be applied for this purpose,
all four give rise to precisely the same valuation when the markets are perfect. People are
completely rational, and the future is known with perfect certainty. However, the capitalized
valued measure has a problem as it requires at least one arbitrary parameter (m), if the Goosen’s
method is applied. The fourth measure is the deductive application of human judgment. With
this method, firms are rated along a psychometric scale. The results are then converted by
formula to monetary values. The problem of this measure is that it requires subjective
judgment. The fifth measure is the firm’s accounting net worth adjusted for intangible and the
idiosyncrasies of accounting rules used in the simulation. Although general principle could be
laid out for the adjustment, the specific principle must depend upon the particulars of the model.
Though, the adjusted net worth measure avoids both problems; it does not require arbitrary
parameter and can be completely objective. It problem however, is that it requires detailed
knowledge of imitation used in any particular model. However, the market value measure of
determining firms’ value is the most reliable and straightforward way of determining a firm's
value, it is also known as market capitalization i.e. total value of all shares outstanding. It
should be noted that this method only works for publicly traded companies, were shares value
can be easily determined. The market capitalization (market value) of a firm can be determined
by multiplying the number of outstanding shares by the current stock price. For example,
consider Dynamics enterprises a publicly traded manufacturing company with 5,000,000
shares outstanding. If her shares are currently traded at 50k per share, dynamics' market
capitalization is 5,000,000 x 0.50; which equals N2, 500,000. The above illustration shows that
the major rider of a firm’s value using this measure is the stock price. And this measure of
determining a firm's value was adopted in this study.
Equity and Firms’ Value:
Equity unlike long-term debt includes paid-up capital, share-premium, reserves and surplus or
retained earnings. Igben (2004) defines paid-up capital as the portion of called-up capital which
has been paid-up by shareholders. He defined reserves as the amount set aside out of profit
earned by the company, which are not designed to meet any liability, contingency, commitment
or reduction in value of assets known to exist in the balance sheet.
Furthermore, reserves may be voluntarily created by directors or statutorily required by law.
Share premium is the excess amount derived from the issue of shares at a price that is above
its par value. And finally, retained earnings are profit invested back into the business in order
to create more resources for operations and invariably increase the value of the firm. From the
above explanation, he (Igben) thus, opined that there is no relationship between firm's value
and equity.
Long- Term Debt and Firms’ Value
Leland and Toft (1991) states that, the value of a firm is the value of its assets plus the value
of tax benefits enjoyed as a result of debt minus the value of bankruptcy cost associated with
debt. Modigliani (1980) points out that, the value of the firm is the sum of its debt and equity

European Journal of Research and Reflection in Management Sciences Vol. 4 No. 1, 2016 ISSN 2056-5992
Progressive Academic Publishing, UK Page 19 www.idpublications.org
and this depends only on the income stream generated by its assets. The value of the firm’s
equity is the discounted value of its shareholders earnings called net income. That is, the net
income divided by the equity capitalization rate or expected rate of return on equity. The net
income is obtained by subtracting interest on debt from net operating income. On the other
hand, the value of debt is the discounted value of interest on debt. Jensen (1986) suggests that,
when firms have more internally generated funds than positive net present value (NPV)
projects, debt forces the managers to pay out funds that might otherwise have been invested in
negative net present value projects. This over-investment problem can be lessened if managers
are forced to pay out excess funds for servicing debt, therefore enhancing the firms’ value.
Myers (1993) suggests that, a firm with outstanding debt may have the incentive to reject
projects that have positive NPV if the benefits from accepting the project accrue to the
bondholders without also increasing shareholders wealth. McConnell and Servas (1995) posit
that, seeds of under-investment problem lie in the solution of over- investment of U.S firms.
They discovered that for firms with high P/E ratios or for high-growth firms, value is negatively
related to leverage and those firms with low P/E ratios or for low- growth firms, value is
positively related to leverage. Their evidence supports the contentions that for low-growth
firms, leverage acts as a monitoring mechanism to enhance firm value. Whereas for high-
growth firms, leverage cause under investment and destroys the value of the firm. The above
empirical studies show that there is a relationship between debt and firms’ value.
Theoretical framework.
Kumar (2007) since 1958, at least eight theories and theoretical frameworks have been
developed relating to a firm’s financial leverage. These are:
1. Irrelevance theory by Modigliani and miller (M&M) in 1958.
2. Static trade-off theory (STT) by Myers and Majluf in 1984.
3. Asymmetric information signalling framework by Ross in 1977.
4. Model based on agency cost by Jensen and Mecking in 1976.
5. Pecking Order framework (POF) by Majluf and Meyers in 1984.
6. The legal environment framework of capital structure by La porta et. Al in 1997
7. Target leverage framework or Mean revision theory by Fisher et al in 1989.
8. Transaction cost framework by Williamson in 1988.
However, the irrelevance theory of M & M, STT and POF of Myers and Majluf basically forms
the theories of financial leverage.
The study of capital structure initialling the Myers studies of capital structure and financial
leverage. As the nature of knowledge that is always dynamic, Myers found that the theory of
Modigliani and Miller (M&M) is not always appropriate. As such Myers and Majluf together
studied the capital structure puzzle and then initiated the ‘Static trade-off theory’ and ‘Pecking
order theory’ which are used as the theoretical basis of financial leverage toward capital
structure. Furthermore, in his paper titled “The Capital Structure Puzzle” Myer (1984) divides
the contemporary thinking on capital structure into two theories; Static trade-off theory and the
Pecking order framework.
Irrelevance Theory by M&M (1958)
The theory of business finance in modern sense starts with the Modigliani and Miller (1958)
capital structure irrelevance propositions. Before Modigliani and Miller, there was no generally
European Journal of Research and Reflection in Management Sciences Vol. 4 No. 1, 2016 ISSN 2056-5992
Progressive Academic Publishing, UK Page 20 www.idpublications.org
accepted theory of capital structure. They (M&M), started by assuming that the firm has a
particular set of expected cash flow. When the firm chooses a certain proportion of debt and
equity to finance its assets, all that it does is to divide up the cash flows among investors.
Investors and firms are assumed to have equal access to financial markets, which allows for
home-made leverage (the use of personal borrowing of investors to change the amount of
financial leverage of a firm). The investors can create any leverage that was wanted but not
offered, or investors can get rid of any leverage that the firm took on but was not wanted. As a
result, the leverage of the firm has no effect on the market value of the firm.
As a matter of fact, their paper led subsequently to both clarity and controversy and this theory
can be proved under range of circumstances (Frank and Goyal, 2005).
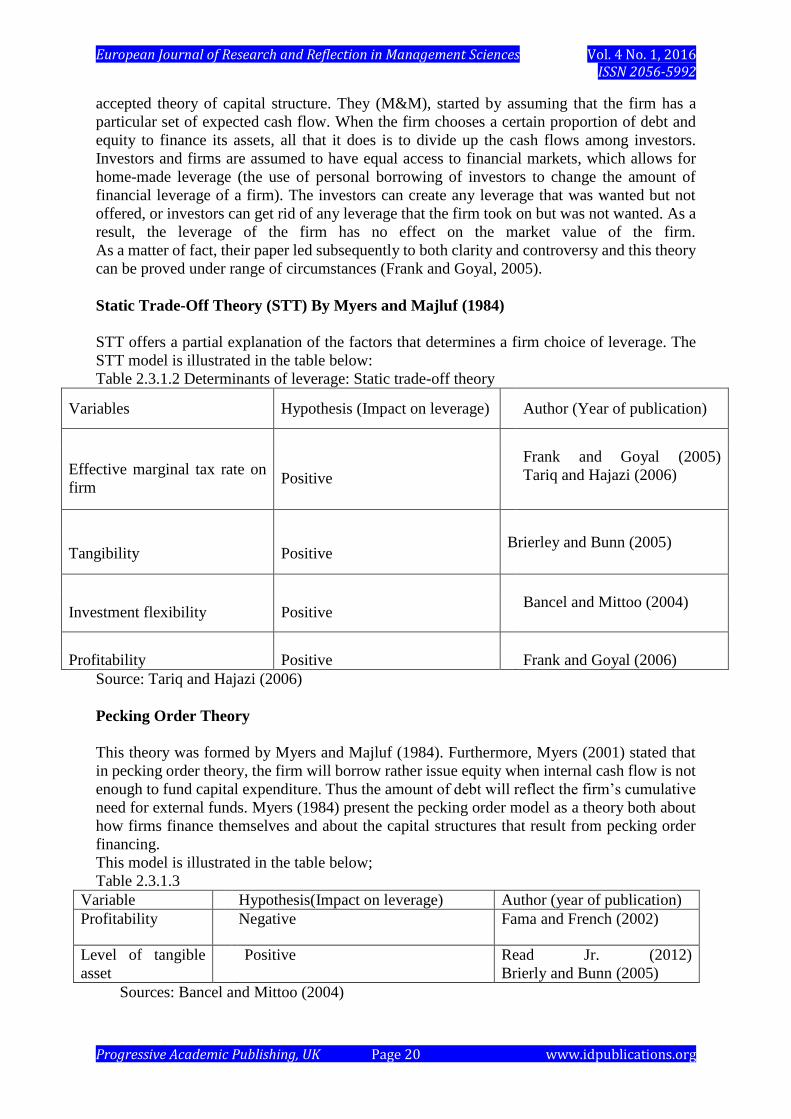
Static Trade-Off Theory (STT) By Myers and Majluf (1984)
STT offers a partial explanation of the factors that determines a firm choice of leverage. The
STT model is illustrated in the table below:
Table 2.3.1.2 Determinants of leverage: Static trade-off theory
Variables Hypothesis (Impact on leverage) Author (Year of publication)
Effective marginal tax rate on
firm Positive
Frank and Goyal (2005)
Tariq and Hajazi (2006)
Tangibility Positive Brierley and Bunn (2005)
Investment flexibility Positive Bancel and Mittoo (2004)
Profitability Positive Frank and Goyal (2006)
Source: Tariq and Hajazi (2006)
Pecking Order Theory
This theory was formed by Myers and Majluf (1984). Furthermore, Myers (2001) stated that
in pecking order theory, the firm will borrow rather issue equity when internal cash flow is not
enough to fund capital expenditure. Thus the amount of debt will reflect the firm’s cumulative
need for external funds. Myers (1984) present the pecking order model as a theory both about
how firms finance themselves and about the capital structures that result from pecking order
financing.
This model is illustrated in the table below;
Table 2.3.1.3
Variable Hypothesis(Impact on leverage) Author (year of publication)
Profitability Negative Fama and French (2002)
Level of tangible
asset
Positive Read Jr. (2012)
Brierly and Bunn (2005)
Sources: Bancel and Mittoo (2004)

European Journal of Research and Reflection in Management Sciences Vol. 4 No. 1, 2016 ISSN 2056-5992
Progressive Academic Publishing, UK Page 21 www.idpublications.org
However, Bastos and Ramalho (2010) argued that pecking order theory due to information
irregularities between firms’ managers and potential outside financiers, firm tends to adopt a
perfect hierarchical order of financing; first, internal funds (retained earnings) are used. Next,
in cases where external financing is needed, low-risk debt is issued, and only as a lender of last
resort, when firms are no longer able to issue safe debt, they issue new shares. Frank and Goyal
(2002) also found out that under the pecking order theory, one might expect that firms with
few tangible assets would have asymmetric information problems. Thus, firms with few
tangible assets will tend to accumulate more debt overtime and become more highly levered.
THEORY OF CAPITAL STRUCTURE: EFFECT OF FINANCIAL LEVERAGE
There are two main theories of capital structure as to the effect of financial leverage or financial
gearing (debt financing) on cost of capital and hence market value of a firm. The two main
theories are:
1. Traditionalist theory
2. Modigliani and Miller theory (M&M)
The Traditional View
The traditional theory states that as a company gearing increases above zero, the weighted
average cost of capital (WACC) will fall initially, because of the higher proportion of lower
cost debt capital in the firm’s capital structure, but eventually increase when gearing gets above
a certain level because of the rising cost of equity offsets the higher proportion of low cost debt.
According to this view, a judicious mix of debt and equity capital can increase the value of the
firm by reducing the WACC up to certain level of debt. A firm has an optimum capital structure
when the WACC is at minimum and thereby maximizing the value of the firm. However, the
traditional theory was criticized for inferring that investors value levered firms than unlevered
firms. This means that they pay premium for the shares of levered firms. The contention of the
traditional theory that moderate amount of debt does not really add very much to the riskiness
of the share is not defensible. There does not exist sufficient justification for the assumption
that investor’s perception about risk of leverage is sufficient at different levels leverage.
Modigliani and Miller (M&M) Theory
M&M did not agree with traditional view. They argued based on the following assumption:
1. Perfect capital market.
2. No taxation.
3. No transaction cost.
With this assumption, they debated that a firm’s value and cost of capital remains invariant to
the changes in the capital structure i.e. the capital structure does not affect the firms’ value and
its WACC. They indicated that the value of the firm depends on the earnings and risk of its
assets (business risk) rather than the way it finances it assets. Since the form of financing (debt
or equity) can neither change the firm’s net operating income nor its operating risk, the value
of levered firm and unlevered firm ought to be same. They also stated that financing changes
the way in which the net operating income is distributed between equity holders and debt
holders and concluded that firms with identical net operating income and operating risk, but
different capital structure should have same total value. However, M&M reversed their
decision with the introduction of tax. Also, both theories agreed that:

European Journal of Research and Reflection in Management Sciences Vol. 4 No. 1, 2016 ISSN 2056-5992
Progressive Academic Publishing, UK Page 22 www.idpublications.org
1. The cost of equity is higher than the cost of debt; this is because of the higher investment
risk.
2. The cost of equity will increase as a company’s level of financial gearing rises, because
of the higher financial risk as debt rises.
EMPIRICAL REVIEWS
Kajola (2008), higher financial leverage decrease firm value by increasing bankruptcy risk.
Therefore, an optimal capital structure is necessary for every firm to enhance the market value
the firm. Gill, Biger and Mathur(2011), an optimal capital structure includes some debt, but
not 100% debt. It is a ‘best’ debt/equity ratio for the firm that minimizes the cost of financing
and reduces the chances of bankruptcy. Cuong and Canh (2012) found that the optimal debt
ratio (total debt to total assets ratio) should not exceed 59.27% because a higher debt ratio will
have negative impacts on firm value. Financial leverage plays an important role in increasing
market value of the firm (Black 2001, Gompers et al 2003, Gill and Mathur 2011). Bancel and
Mittoo (2004) found in their sample survey of managers from 16 Europeans countries that over
40% of the managers issued debt when interest rate are low or when the firm’s equity is
undervalued by the market. These findings suggest that managers use windows of opportunity
to raise capital. They further reasoned that managers issue convertible debt because it is less
expensive than straight debt, or to attract investors who are unsure about the riskiness of the
firm. Nolan {2002}, in his study of leverage changes of UK adopted what can be regarded as
a behavioural approach to leverage behaviour using the framework of Stein (1989). He claimed
to have used managerial utility function in his model. Implicit in his model is that a low debt
(D) implies that the cost of short run behaviour is low.
At low debt (D), he opined that the extra probability of going bankrupt is low also. As the debt
level rises, the loss should also rise. According to Pandy (2008), the variance and covariance
and therefore beta depend on three fundamental factors:
1. The nature of the business.
2. The operating leverage.
3. The financial leverage.
As suggested by their names, operating leverage and financial leverage are comparable
concepts. In his words, operating leverage is the use of fixed costs, the degree of which is
defined as the change in a company’s earnings before interest and tax (EBIT) due to change in
sales. Going by his words on the other hand, financial leverage is seen as the existence of debt
in a firm’s capital structure. Hence, a levered firm is the one that has debt in its capital structure.
He also opined that financial leverage increases the firm’s (financial) risk and hence, the equity
beta of the firm. Ojo (2012) in his study of financial leverage on corporate performance in
Nigerian firms, opined that financial leverage causes variability in the returns of shareholders,
thus, adds financial risk. Consequently, beta (risk) of a levered firm’s equity will increase as
debt is introduced in the firm’s capital structure.
Firms can finance their assets through a combination of debt and equity. The higher the
proportion of debt in the capital structure of a firm, the higher it is default risk because debt
carries a fixed cost which has to be paid irrespective of its operations performance. Thus, a
high proportion of debt makes a firm vulnerable of default, with a slight decline in operations
performance. It is therefore important to be clear what figures are being taken from a firm’s
financial statements for computing this correlation (Zubairi 2010). Rajan and Zingales (1995)
believe that firms with high market-to-book ratio have higher costs of financial distress which
European Journal of Research and Reflection in Management Sciences Vol. 4 No. 1, 2016 ISSN 2056-5992
Progressive Academic Publishing, UK Page 23 www.idpublications.org
is why they expect a negative correlation. But, there may be other potential reasons for why
the market-to-book ratio is negatively correlated with leverage.
For instance, the shares of firms in financial distress {high leverage} may be discounted at a
higher rate because of distress risk and price [as suggested by Fama and French 2002]. If this
is the dominant explanation, the negative correlation should be driven largely by firms with
low market-to-book ratios. But in fact, the negative correlation appears to be driven by firms
with high market-to-book ratios rather than by firms with low market-to-book ratios. It is
unlikely that financial distress is responsible for the observed correlation. Read, Jr and Myers
{2012} explained; by following the trade-off theory that the tangibility of asset have a positive
sign towards debt ratios in the cross sectional test and this result seem reasonable. Large firms
ought to borrow more; they are presumably safer and more likely to pay taxes. Firms with more
tangible assets are less likely to be damaged in financial distress and should therefore have
higher target debt ratios. According to Tariq and Hijazi (2006) Interest payment are tax-
deductible expense and decrease the tax liability thus providing cash savings. Therefore firms
will use a higher level of debt to take advantage of tax benefits if the tax rates are higher. If the
firm incurs losses, this tax benefit will fade away. So, if its operating earnings are enough to
meet the interest expense, then firms will get the benefit of tax deductibility of interest
expenses.
Also, the chance of default increases as the level of debt increases, so there exists an optimal
level of debt. If the firm goes beyond this optimal point, it is more likely that the firm will
default on the repayment of the loan. Sharma (2006) took a sample of Indian manufacturing
firms and found that there is a direct relationship between firm’s value and financial leverage.
Adeyemi and Oboh (2011) took a sample size of 90 firms from Nigeria and found that the
market value of a firm is positively influenced by its choice of capital structure (financial
leverage). Cheng and Tzeng (2011) collected data from 645 companies listed in the Taiwan
Securities Exchange (TSE) from 2000 – 2009 and found a positive relationship between
leverage and firm value. A recent study on the relationship between financial leverage and
financial crisis in Nigeria using co-integration technique, vector error correction mechanism
(VECM), Granger causality and exponential generalized autoregressive conditional
heteroscedascity (EGARCH) methodology shows that there is an equilibrium relationship
between macro-economic financial leverage and the financial soundness.
It was recognized that the underinvestment problem by noting that shareholders of firms with
risky debt will invest only when or up to the point at which, the expected return on investment
is at least as great as the promised payment to bondholders. When the expected return is less
than the promised payment, shareholders fail to exercise the investment option or invest less
than the optimal amount, which reduces firm value. It is this decline in firm value which limits
the amount of debt a given firm can issue (Myers, 1977).
METHODOLOGY
Research Design
This is a non experimental research setting based on survey design. It involves the gathering
of information about the relationship between financial leverage and firms’ value. The study
population used in this research was taken from the manufacturing sector of the Nigerian
economy. Data considered for the study were selected mainly from secondary sources. The
data were collected from annual reports and statement of account of the companies under
consideration covering a period of 6years from 2007-2012. The sample size of 5 firms from

European Journal of Research and Reflection in Management Sciences Vol. 4 No. 1, 2016 ISSN 2056-5992
Progressive Academic Publishing, UK Page 24 www.idpublications.org
the manufacturing sector listed on the Nigerian Stock Exchange. The study covered a period
of 6years from 2007-2012. Simple random sampling method was adopted in selecting the
sample size of 5 firms. This method was adopted because it is easy, cost less and understanding.
Method of Data Analysis
Data gathered were analyzed using regression analysis method. Regression analysis is a
statistical tool for estimating relationships among variable especially when focus is on the
relationship between a dependent variable and one or more independent variables. Regression
is also used to understand if the independent variable is related to the dependent variable and
to explore the form of this relationship and also infer the causal relationship (effect) between
the variables (dependent and independent). However, the simple linear regression method was
specifically employed, using the Ordinary Least Squares (OLS) method to estimate the
parameters. The Ordinary Least Squares (OLS) method was employed because it is the best
linear unbiased estimator.
Model Specification
The model to be regressed in this study is presented in a relation form as follows:
Firm value = F [Debt/Financial leverage]
Linear expression of the model=>
F-val= b0+b1Lev+e
I.e. Yi= β0+β1x1+ε
Lev= Total debt/Total equity
Y= Dependent variable i.e. Firms’ value.
X1= Independent variable i.e. Financial leverage.
β0 andβ1 are parameters to be estimated.
ε= Error term.
Firm value= Market value of firm’s shares.
Financial leverage= Total debt/Total equity
A priori Expectation
Considering the empirical studies by past financial analysts, it was expected that financial
leverage has a significant relationship with firm’s value and also that financial leverage has
significant impact on firm’s value.
Statistical Criteria
It is necessary to check the goodness of fit of the model and the statistical significance of the
estimated parameter; the statistical criterion used to check the goodness of fit was the
coefficient of determination (R2) and the T-test, Durbin Watson and F-test were the criteria
used to check the statistical significance of the estimated parameters. The criteria are further
explained below:
1. T- Test: This test was used to test the significance of the parameters estimated at (n-k)
degree of freedom, where n= number of observations and k= parameters.
2. Coefficient of Determination (R2): This shows the percentage of the total variation of
the dependent variable the can be explained by the independent variable(s). R2 shows

European Journal of Research and Reflection in Management Sciences Vol. 4 No. 1, 2016 ISSN 2056-5992
Progressive Academic Publishing, UK Page 25 www.idpublications.org
the extent to which the independent variable influences the dependent variable. A high
value shows a high degree of influence and vice versa.
R2= Explained variation =RSS
Total Variation TSS
3. F-test: This is used to test the significance of R2 and thus test the significance of the
model as a whole. It is always at F0.05 at the degree of freedom of F table with
V1= (k-1). V2=
(N-K)
If F-calculated is greater than F-tabulated, reject the H0 and if F-calculated is less than
F-tabulated accept H0 at 5% level of significance.
4. Durbin- Watson statistic: This is mostly relevant when using time series data. This
criterion was used to tests whether there is any evidence of autocorrelation in the
residuals of the time series regression. The statistics ranges from zero to four, a value of
two or close to two indicates no autocorrelation in the sample. A value far less than two
indicate positive correlation while a value greater than two indicate negative correlation.
5. Data presentation
Below, are the data used for the analysis of this study. Financial leverage connoted by
(LEV) is estimated by total debt/total equity, and its value is given in ratio. Firms’ value
connoted by (FVAL) is estimated using market value of the shares of sampled firms,
and its value is given in kobo.
European Journal of Research and Reflection in Management Sciences Vol. 4 No. 1, 2016 ISSN 2056-5992
Progressive Academic Publishing, UK Page 26 www.idpublications.org
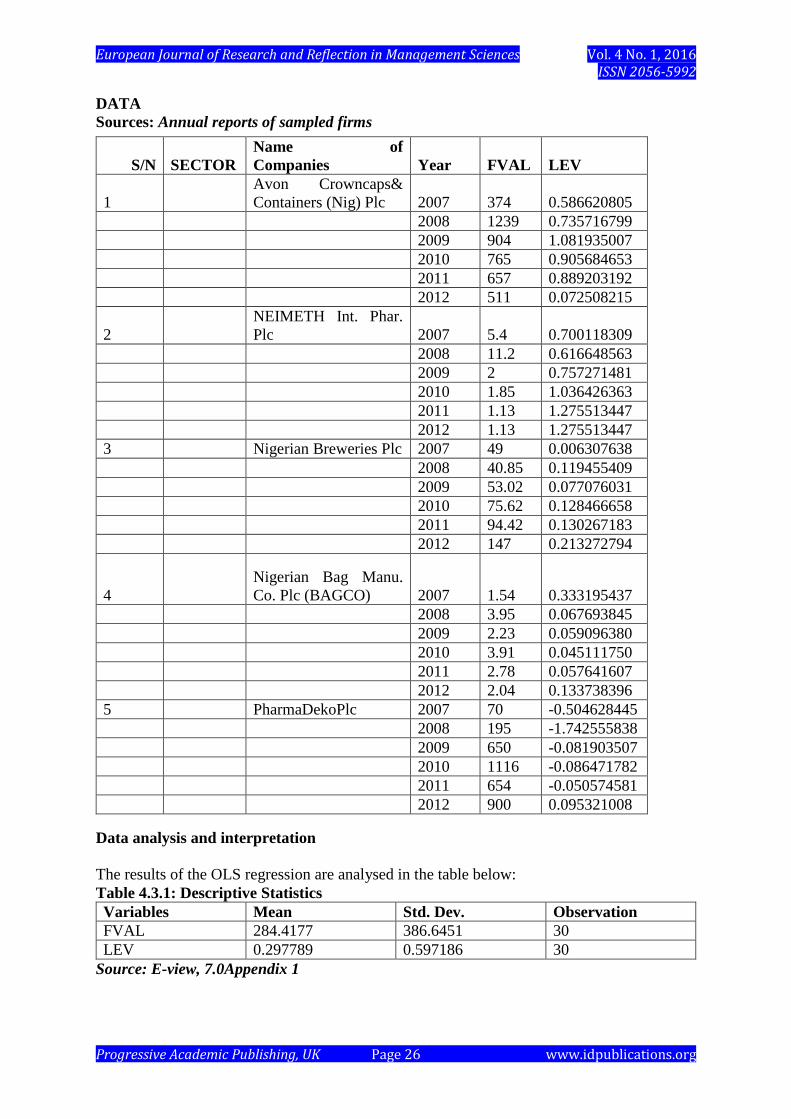
DATA
Sources: Annual reports of sampled firms
Data analysis and interpretation
The results of the OLS regression are analysed in the table below:
Table 4.3.1: Descriptive Statistics
Variables Mean Std. Dev. Observation
FVAL 284.4177 386.6451 30
LEV 0.297789 0.597186 30
Source: E-view, 7.0Appendix 1
S/N SECTOR
Name of
Companies Year FVAL LEV
1
Avon Crowncaps&
Containers (Nig) Plc 2007 374 0.586620805
2008 1239 0.735716799
2009 904 1.081935007
2010 765 0.905684653
2011 657 0.889203192
2012 511 0.072508215
2
NEIMETH Int. Phar.
Plc 2007 5.4 0.700118309
2008 11.2 0.616648563
2009 2 0.757271481
2010 1.85 1.036426363
2011 1.13 1.275513447
2012 1.13 1.275513447
3 Nigerian Breweries Plc 2007 49 0.006307638
2008 40.85 0.119455409
2009 53.02 0.077076031
2010 75.62 0.128466658
2011 94.42 0.130267183
2012 147 0.213272794
4
Nigerian Bag Manu.
Co. Plc (BAGCO) 2007 1.54 0.333195437
2008 3.95 0.067693845
2009 2.23 0.059096380
2010 3.91 0.045111750
2011 2.78 0.057641607
2012 2.04 0.133738396
5 PharmaDekoPlc 2007 70 -0.504628445
2008 195 -1.742555838
2009 650 -0.081903507
2010 1116 -0.086471782
2011 654 -0.050574581
2012 900 0.095321008

European Journal of Research and Reflection in Management Sciences Vol. 4 No. 1, 2016 ISSN 2056-5992
Progressive Academic Publishing, UK Page 27 www.idpublications.org
Interpretation
Table 4.1 above highlights descriptive statistics of variables. Firm Value (FVAL) which is the
dependent variable has a mean of284.4177 and a standard deviation value of 386.6451.
The mean value of Leverage (LEV) stood at0.297789 and a standard deviation of 0.597186.
The last column represents the number of samples in our observation.
Table 4.3.2: Correlations of Variable
FVAL LEV
FVAL 1.000000
LEV 0.573287 1.000000
Source: E-view, 7.0Appendix 1
Interpretation
The table shows that the co-efficient of correlation of a variable with respect to itself is 1.000.
This indicates that there exists a perfect Correlation between a variable with respect to itself.
The correlation co-efficient between the dependent variable and independent variables are
discussed below:
The result showed that there exist a positive relationship between Leverage (LEV) and Firm
Value (FVAL). The correlation co-efficient between Leverage (LEV) and Firm Value (FVAL)
is about with a value of0.073287 which means the strength of relationship between them is
about 0.57% which shows anaverage positive relationship between Leverage (LEV) and Firm
Value (FVAL).
MODEL SUMMARY AND ANALYSIS OF RESULT
The result obtained from the preliminary ordinary least square estimation technique is
presented below:
Table 4.4.1 Ordinary Least Square Regression Result (Initial Output)
Dependent
Variable
Independent Coefficient Standard
Error
T-Stat. Prob.
FVAL C 270.2878 80.33592 3.364470 0.0022
LEV 47.44923 122.0266 0.388843 0.7003
Source: E-views software (Appendix 1)
R-Squared = 0.05
R-Bar Squared = 0.03
F-Stat. = 0.15
DW-Statistic = 0.44
Interpretation of Result
The coefficient of determination (R2) with a value of 0.05 shows that about 0.05% of the total
systematic variations in the dependent variable (FVAL) have been explained by the
explanatory variables taken together. The adjusted R-Square shows that after adjusting for the
degree of freedom, the model could still explain about 0.03% of the total systematic variations
in Firm Value (FVAL), while about 97% of the systematic variation in Firm Value (FVAL)
European Journal of Research and Reflection in Management Sciences Vol. 4 No. 1, 2016 ISSN 2056-5992
Progressive Academic Publishing, UK Page 28 www.idpublications.org
was left unaccounted for, which has been captured by the stochastic disturbance term in the
model. This indicates a low fit of the regression line and also the model has a low forecasting
power. On the basis of the overall statistical significance of the model as indicated by the F-
statistic, it was observed that the overall model was statistically significant since the calculated
F-value of 0.15is less than the critical F– value of 4.17 at 5% level of significance. This implies
that there no significant linear relationship between Firm Value (FVAL) and the independent
variables Leverage (LEV). On the basis of the individual statistical significance, as shown by
the t-statistic, it was observed that Leverage (LEV) is positive but highly insignificant, since
its calculated t-value of 0.38 is lessthan the critical t-value of 1.701 at 5% level of significance.
The DW-statistics of 0.44 showed that there is the presence of first order auto-correlation in
the model. Hence the model was re-estimated.
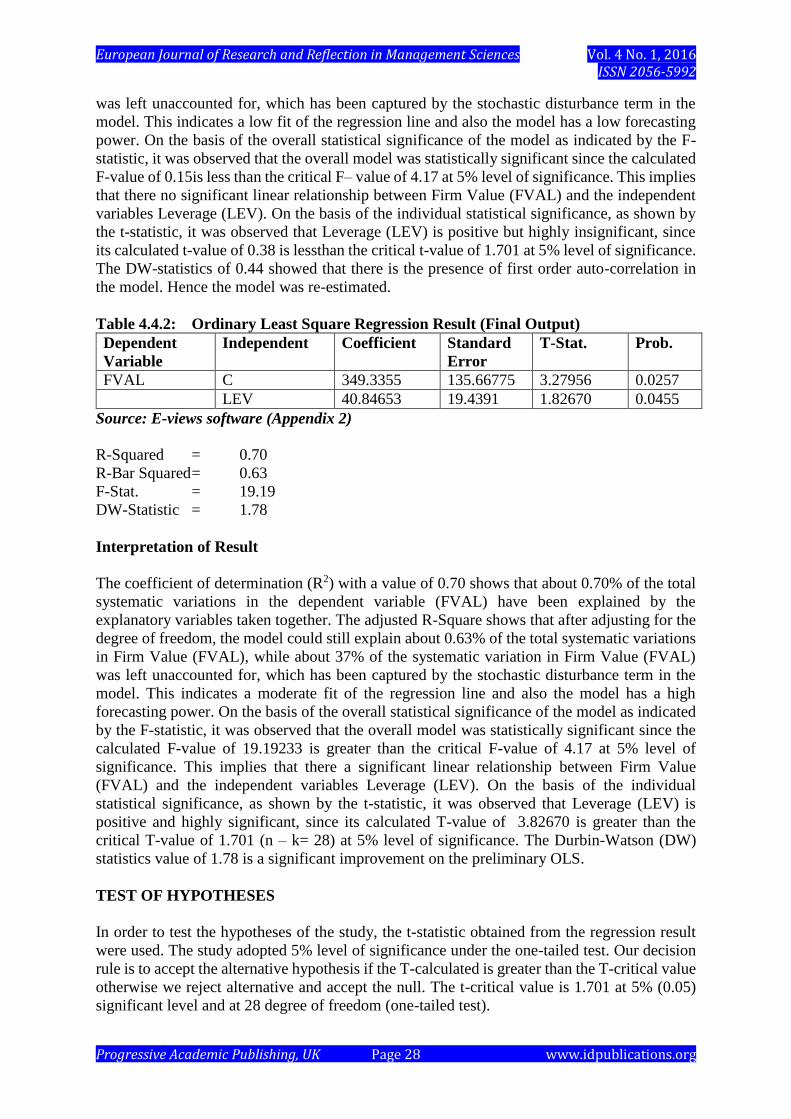
Table 4.4.2: Ordinary Least Square Regression Result (Final Output)
Dependent
Variable
Independent Coefficient Standard
Error
T-Stat. Prob.
FVAL C 349.3355 135.66775 3.27956 0.0257
LEV 40.84653 19.4391 1.82670 0.0455
Source: E-views software (Appendix 2)
R-Squared = 0.70
R-Bar Squared = 0.63
F-Stat. = 19.19
DW-Statistic = 1.78
Interpretation of Result
The coefficient of determination (R2) with a value of 0.70 shows that about 0.70% of the total
systematic variations in the dependent variable (FVAL) have been explained by the
explanatory variables taken together. The adjusted R-Square shows that after adjusting for the
degree of freedom, the model could still explain about 0.63% of the total systematic variations
in Firm Value (FVAL), while about 37% of the systematic variation in Firm Value (FVAL)
was left unaccounted for, which has been captured by the stochastic disturbance term in the
model. This indicates a moderate fit of the regression line and also the model has a high
forecasting power. On the basis of the overall statistical significance of the model as indicated
by the F-statistic, it was observed that the overall model was statistically significant since the
calculated F-value of 19.19233 is greater than the critical F-value of 4.17 at 5% level of
significance. This implies that there a significant linear relationship between Firm Value
(FVAL) and the independent variables Leverage (LEV). On the basis of the individual
statistical significance, as shown by the t-statistic, it was observed that Leverage (LEV) is
positive and highly significant, since its calculated T-value of 3.82670 is greater than the
critical T-value of 1.701 (n – k= 28) at 5% level of significance. The Durbin-Watson (DW)
statistics value of 1.78 is a significant improvement on the preliminary OLS.
TEST OF HYPOTHESES
In order to test the hypotheses of the study, the t-statistic obtained from the regression result
were used. The study adopted 5% level of significance under the one-tailed test. Our decision
rule is to accept the alternative hypothesis if the T-calculated is greater than the T-critical value
otherwise we reject alternative and accept the null. The t-critical value is 1.701 at 5% (0.05)
significant level and at 28 degree of freedom (one-tailed test).

European Journal of Research and Reflection in Management Sciences Vol. 4 No. 1, 2016 ISSN 2056-5992
Progressive Academic Publishing, UK Page 29 www.idpublications.org
Hypothesis 1:
H0: There is no significant relationship between Leverage and Firm Value.
H1: There is a significant relationship between Leverage and Firm Value
From the empirical analysis it was observed that Leverage with a calculated t-value of 3.82670
is greater than the critical t-values of 1.701 at 5% level of significance.
We therefore reject the null hypothesis and accept the alternative hypothesis which states that
there is significant relationship between Leverage and Firm Value.
Hypothesis 2:
H0: Financial leverage has no effect on a firm’s value.
H1: Financial leverage has effect on a firm’s value.
The empirical analysis shows that financial leveragewith a calculated t-value of 3.82670 is
greaterthan the critical t-value of 1.701 at 5% level of significance. We therefore reject the null
hypothesis and accept the alternative hypothesis which means that financial leverage has effect
on a firm’s value.
SUMMARYOF FINDINGS
The research work examined the relationship between financial leverage and firms’ value,
using 5 selected firms from the manufacturing sector for the year 2007- 2012.
With the result of the analysis and the hypotheses tested, the following were the findings:
1. It was observed that there is a significant relationship between financial leverage and
firms’ value. Since the t-test calculated is greater than the t-test tabulated at 5% level
of significance.
2. It was also found that the level of debt a firm has in its capital structure is a factor that
will affect its value. Since the second hypothesis “financial leverage has no effect on a
firm’s value” was found to be negative.
3. Also the data above showed that while some of the sampled firms had high market
value of their shares as the leverage ratio increase, for other firms, as the leverage ratio
increases the market value of their shares decreases.
CONCLUSION
The main objective of the study was to find out the relationship between financial leverage and
firms’ value. Financial leverage (debt) is a good source of finance to firms as it enables firms
to carry out long- term projects and also reduce the tax payable by the firm. It has also been
observed that the large amount of debt (high leverage ratio) have negative effect on firms that
makes low profit, thus the investors may receive little or no earnings (dividend). Investors’
faith in both the companies and the capital market is shaken; hence the market value of firms’
shares will fall same as its value. This study has however established that there is a relationship
between financial leverage and firms’ value and also financial leverage has effect on firms’
value, both positive and negative effects.
However, the researcher is hoping that if companies/firms can implement the recommendations
stated below, it is expected that they would be able to enjoy the positive effects of financial
leverage and avoid the negative effects of financial leverage.

European Journal of Research and Reflection in Management Sciences Vol. 4 No. 1, 2016 ISSN 2056-5992
Progressive Academic Publishing, UK Page 30 www.idpublications.org
RECOMMENDATIONS
Based on this research work, the researcher made the following recommendations:
Corporate financial decision makers (in large firms) should employ more of long-term-debt
than equity in their financial option. This is in line with the pecking order theory. Also firms
are strongly advised to always compare the marginal benefit of using long-term-debt to the
marginal costs of long-term-debt before concluding on using it in financing their operations.
This is because as shown by this work, long-term-debt has impact on firms’ value. Also, firms
should ensure to use optimal level of debt in their capital structure, as this will lead to optimum
capital structure and thus maximization in firms’ value.
Finally, traditional theory states that as a company gearing increases above zero, the weighted
average cost of capital (WACC) will fall initially, because of the higher proportion of lower
cost debt capital in the firm’s capital structure, but eventually increases when gearing gets
above a certain level because of the rising cost of equity which offsets the higher proportion of
low cost debt. The researcher advises companies to reduce their use of debt at the point where
the weighted average cost of capital begins to increase, thus making the firms’ value to fall.
APPENDIX ONE
Dependent Variable: FVAL
Method: Least Squares
Date: 05/29/14 Time: 03:41
Sample: 1 30
Included observations: 30
Variable Coefficien
t
Std. Error t-Statistic Prob.
C 270.2878 80.33592 3.364470 0.0022
LEV 47.44923 122.0266 0.388843 0.7003
R-squared 0.005371 Mean dependent var. 284.4177
Adjusted R-squared -0.030151 S.D. dependent var. 386.6451
S.E. of regression 392.4308 Akaike info criterion 14.84694
Sum squared resid 4312053. Schwarz criterion 14.94035
Log likelihood -220.7041 F-statistic 0.151199
Durbin-Watson stat 0.440670 Prob.(F-statistic) 0.700333
CORRELATION
FVAL LEV
FVAL 1.000000 0.073287
LEV 0.073287 1.000000
APPENDIX TWO
Dependent Variable: FVAL
Method: Least Squares
Date: 05/29/14 Time: 03:41
Sample(adjusted): 2 30
Included observations: 29 after adjusting endpoints
Convergence achieved after 8 iterations

European Journal of Research and Reflection in Management Sciences Vol. 4 No. 1, 2016 ISSN 2056-5992
Progressive Academic Publishing, UK Page 31 www.idpublications.org
Variable Coefficien
t
Std. Error t-Statistic Prob.
C 349.3355 263.0626 3.27956 0.0257
LEV 40.84653 19.4391 1.82670 0.0455
AR(1) 0.809015 0.132842 6.090065 0.0000
R-squared 0.706215 Mean dependent var. 281.3286
Adjusted R-squared 0.632154 S.D. dependent var. 393.1120
S.E. of regression 259.2292 Akaike info criterion 14.05100
Sum squared resid 1747194. Schwarz criterion 14.19244
Log likelihood -200.7395 F-statistic 19.19233
Durbin-Watson stat 1.782197 Prob.(F-statistic) 0.000008
Inverted AR Roots .81
REFRENCES
Adeyemi, S.B. and C.S. Oboh, 2011. “Perceived Relationship Between Corporate Capital
Structure and Firm Value in Nigeria”, International Journal of Business and Social
Science, 2(19).
Bancel, F., & Mittoo, U.R., 2004. Cross-Country Determinants of Capital Structure Choice:
A Survey of European Firms. Financial Management, 33(4)
Bastors, J.A.,& Ramalho J.J. (2010, September). CEMAPRE – the Centre for Applied
Mathematics and Economics. Retrieved March 30,2013, from ISEG-Technical
University of Lisbon: http://evunix.uevora.pt/~jsr/
Cheng, M.C, and Z.C. Tzeng,2011. “The Effect of Leverage on Firm Value and How the
Firm Financially Qualify Influence on This Effect”. World Journal of Management,
3(2).
Cuong, N.T and N.T. Canh, 2012. “The Effect of Capital Structure on Firm Value for
Vietnam’s seafood processing enterprises”, International Research Journal of Finance
and Economics, 89.
Eugene, B.F, (1995). Fundamentals of Financial Management.
Fama, E.F., & French, K.R. (2002). Testing Trade-Off and Pecking Order Predictions about
Dividends and Debt. The Society for Financial Studies vol. 15.
Frank, M.Z., & Goyal, V.K. (2005). Trade-Off and Pecking Order of Debt. In B.E.Eckbo,
Handbook of Corporate Finance: Empirical (Chapter 7). North Holland: Elsevier.
Gill, A. and N. Mathur, 2011b. “Factors that Influence Financial Leverage of Canadian
firms”, Journal of Applied Finance and Banking, 1(2).
Gujarati,D.M. (1995), “Basic Econometrics,Third Edition”, New York, McGraw-Hill.
Understanding regression analysis and model specification in regression analysis, 1997.
Horne J.C.V (2002). Financial Management and Policy. Pretence Hall Ltd , India.
http://www.investopedia.com/terms/a/optimal-capital-structure.asp
http://www.en.wikipedia.org/wiki/leverage (finance)
Igben, R.O. (2004), “Financial Accounting made Simple”.vol.1.ROL publishers, Lagos State.
Jensen, M.C.(1986), Agency Cost of Free Cashflow, Corporate Finance and Take Overs.
American Economic Review, vol 26.
Kajola, S.O.,2008, “Corporate Governance and Firm Performance:The case of Nigerian listed
firms”, European Journal of Economics, Finance and Administrative Sciences, 14
Kumar, R. (2007, August 15), “Determinant of Firm’s Financial Leverage: A Critical Review.
3.

European Journal of Research and Reflection in Management Sciences Vol. 4 No. 1, 2016 ISSN 2056-5992
Progressive Academic Publishing, UK Page 32 www.idpublications.org
Leland, H.E. and K.Toft. (1991), “Optimal Capital Structure, Endogenous Bankruptcy, and
the Term Structure of credit spreads, 51.
Mc Connel, J.J. and H. Servas (1995), “Equity Ownership and the two Faces of Debt”,
Journal of Financial Economics 39.
Modigliani, F. (1980), Introduction in an Abel (ed), The Collected Paper of Franco
Modigliani, vol. 3 Cambridge, Massachusetts. MIT Press.
Modigliani, F. and M. Miller (1958), “The cost of capital structure, corporatipn finance and
the theory of Investment”, The American Economic Review, 448(3)
Myers, S.C. and N.S. Majluf (1984), “Corporate Financing and Investment Decision when
Firms have Information that Investors do not have”. Journal of Financial Economics,
13.
Nolan D. (2002), “Capital Structure and Short Term Decisions. Oxford Economic Papers,
54(3).
Obradovich, John and Gill, Amarjit (2013), “The Impact of Corporate Goverance anf
Financial Leverage on the Value of American Firms” Faculty Publications and
presentations. Paper 25, 4.14.
Ojo, A.S. (2012), “The Effect of Financial Leverage on Corporate Performance of Some
Selected Companies in Nigeria. Canadian Social Sciences.
Oloyede, B. (2000), Principles of Financial Management, Forthright Educational Publishers,
Lagos.
Pandey I.M. (2008), “ Financial Management. Vikas Publishing House PVT. Ltd.
Rajan, R.G., & Zingales, L. (1995), “What do you know about Capital Structure? Some
Evidence from International Data. The Journal of Finance.
Read, Jr., J.A. (2012), “Real Options, Taxes and Financial Leverage”. National Bureau of
Economics 18(184).
Ross, A.S. Westerfield, W.R., Jordan, B (2004), “Essentials of Corporate Finance”, McGraw
Hill Inc. Boston.
Manufacturing Sector Firm in India”. The Business Review, 6(2).
Tariq, Y.B., & Hajazi, S.T. (2006), “Determinant of Capital Structure: A Case for the
Pakistani Cement Industry”. The Lahore Journal of Economics.
Van Horne, J.C., (1974), “Financial Management and Policy”.
www.cies.org/.../project statement sample…
www.sagepub.com/booksprodDesc-nav?....
Zubairi, H.J., (2010), Social Science Network Retrieved March 20, 2013 from
papers: Http://papers.ssrn.com/so13/papers.cfm?abstract id=1534186/