Embed Size (px)
Citation preview

Financial Results Q3FY18
14 February
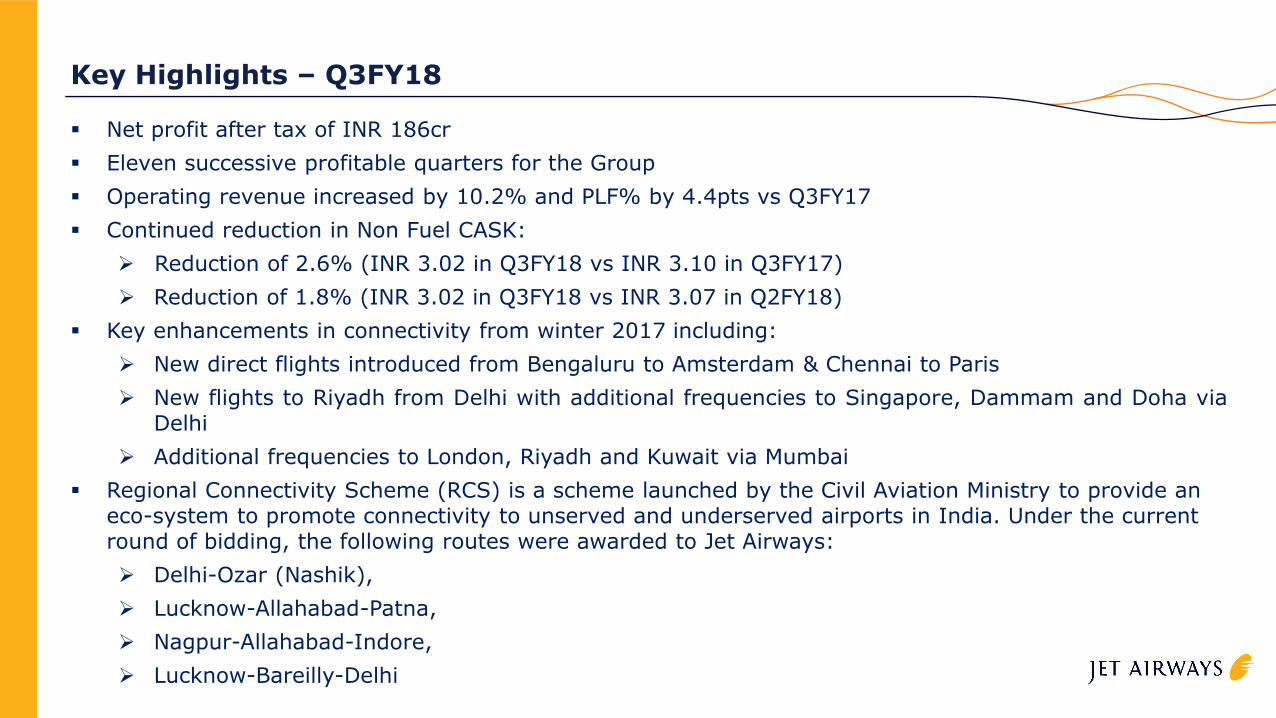
Key Highlights – Q3FY18
Net profit after tax of INR 186cr
Eleven successive profitable quarters for the Group
Operating revenue increased by 10.2% and PLF% by 4.4pts vs Q3FY17
Continued reduction in Non Fuel CASK:
Reduction of 2.6% (INR 3.02 in Q3FY18 vs INR 3.10 in Q3FY17)
Reduction of 1.8% (INR 3.02 in Q3FY18 vs INR 3.07 in Q2FY18)
Key enhancements in connectivity from winter 2017 including:
New direct flights introduced from Bengaluru to Amsterdam & Chennai to Paris
New flights to Riyadh from Delhi with additional frequencies to Singapore, Dammam and Doha viaDelhi
Additional frequencies to London, Riyadh and Kuwait via Mumbai
Regional Connectivity Scheme (RCS) is a scheme launched by the Civil Aviation Ministry to provide an eco-system to promote connectivity to unserved and underserved airports in India. Under the current round of bidding, the following routes were awarded to Jet Airways:
Delhi-Ozar (Nashik),
Lucknow-Allahabad-Patna,
Nagpur-Allahabad-Indore,
Lucknow-Bareilly-Delhi
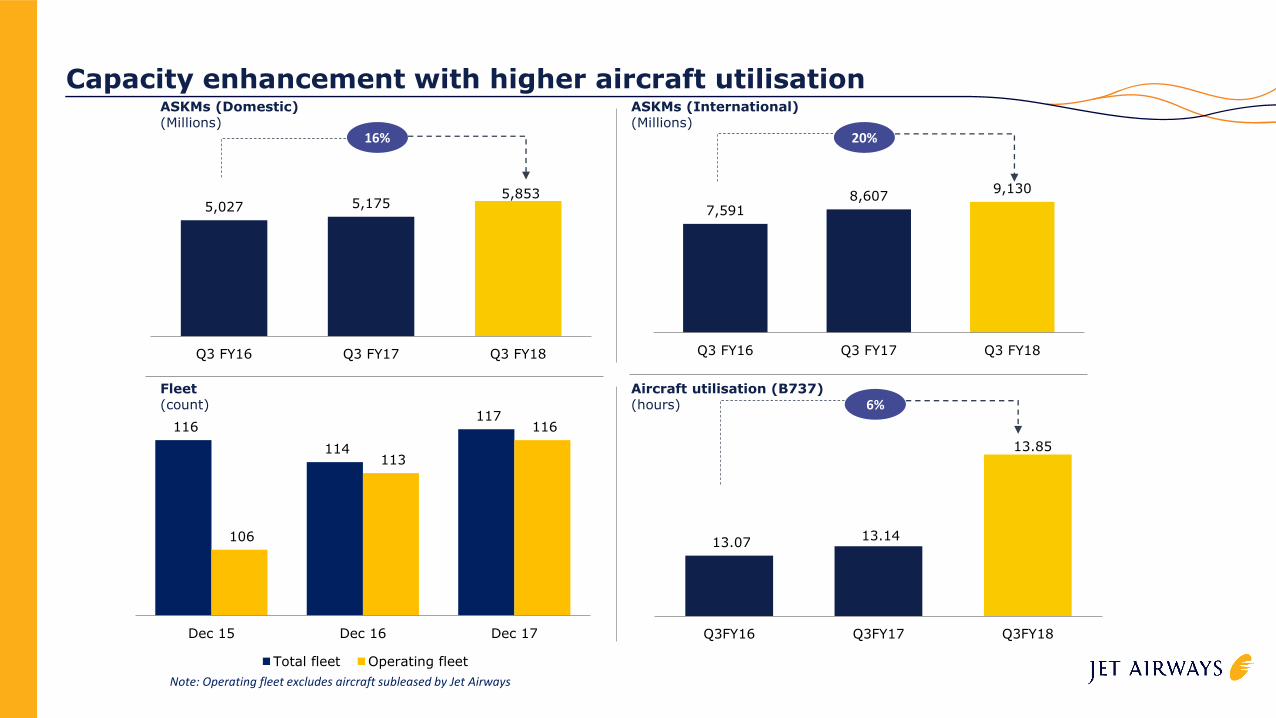
13.07 13.14
13.85
Q3FY16 Q3FY17 Q3FY18
5,027 5,175 5,853
Q3 FY16 Q3 FY17 Q3 FY18
Capacity enhancement with higher aircraft utilisationASKMs (Domestic)(Millions)
ASKMs (International)(Millions)
Fleet(count)
Aircraft utilisation (B737)(hours)
16% 20%
6%
7,591 8,607
9,130
Q3 FY16 Q3 FY17 Q3 FY18
Note: Operating fleet excludes aircraft subleased by Jet Airways
116
114
117
106
113
116
Dec 15 Dec 16 Dec 17
Total fleet Operating fleet
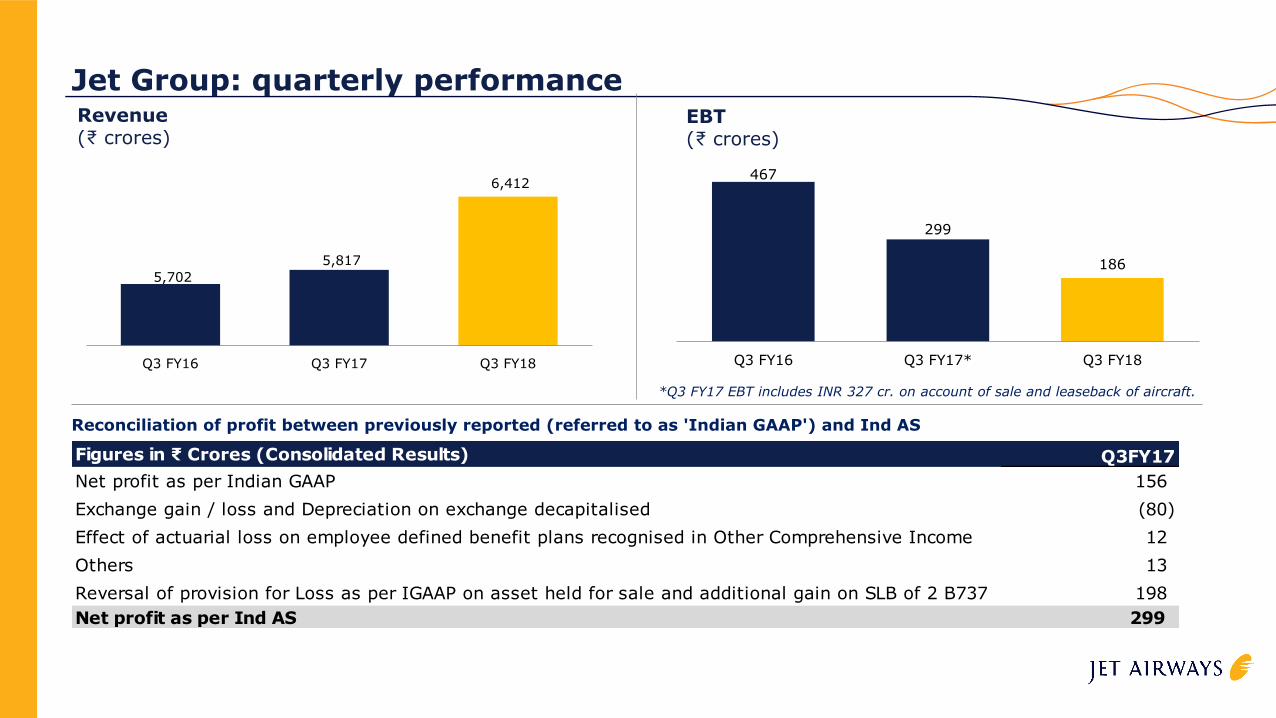
Jet Group: quarterly performanceRevenue(₹ crores)
EBT(₹ crores)
5,702
5,817
6,412
Q3 FY16 Q3 FY17 Q3 FY18
467
299
186
Q3 FY16 Q3 FY17* Q3 FY18
Reconciliation of profit between previously reported (referred to as 'Indian GAAP') and Ind AS
*Q3 FY17 EBT includes INR 327 cr. on account of sale and leaseback of aircraft.
Figures in ₹ Crores (Consolidated Results) Q3FY17
Net profit as per Indian GAAP 156
Exchange gain / loss and Depreciation on exchange decapitalised (80)
Effect of actuarial loss on employee defined benefit plans recognised in Other Comprehensive Income 12
Others 13
Reversal of provision for Loss as per IGAAP on asset held for sale and additional gain on SLB of 2 B737 198
Net profit as per Ind AS 299
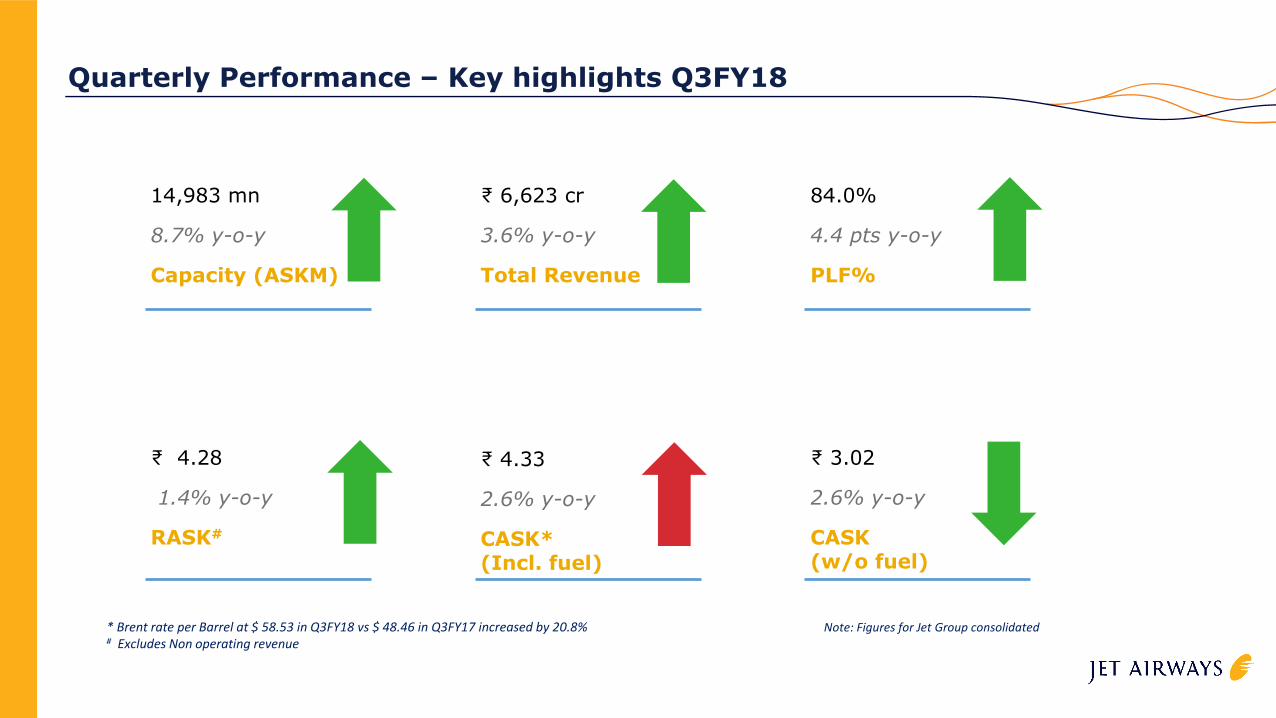
Quarterly Performance – Key highlights Q3FY18
14,983 mn
8.7% y-o-y
Capacity (ASKM)
₹ 6,623 cr
3.6% y-o-y
Total Revenue
84.0%
4.4 pts y-o-y
PLF%
₹ 4.28
1.4% y-o-y
RASK#
₹ 4.33
2.6% y-o-y
CASK*(Incl. fuel)
₹ 3.02
2.6% y-o-y
CASK (w/o fuel)
Note: Figures for Jet Group consolidated* Brent rate per Barrel at $ 58.53 in Q3FY18 vs $ 48.46 in Q3FY17 increased by 20.8%# Excludes Non operating revenue
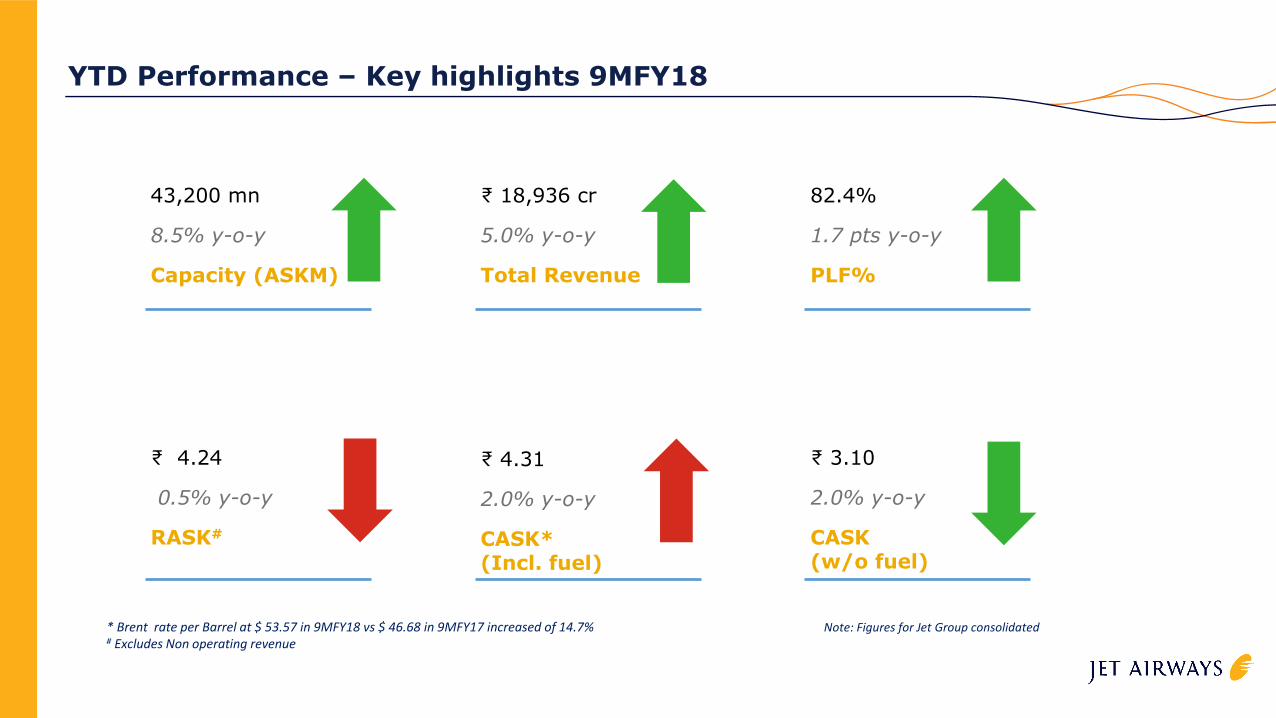
YTD Performance – Key highlights 9MFY18
43,200 mn
8.5% y-o-y
Capacity (ASKM)
₹ 18,936 cr
5.0% y-o-y
Total Revenue
₹ 4.24
0.5% y-o-y
RASK#
₹ 4.31
2.0% y-o-y
CASK*(Incl. fuel)
₹ 3.10
2.0% y-o-y
CASK (w/o fuel)
Note: Figures for Jet Group consolidated* Brent rate per Barrel at $ 53.57 in 9MFY18 vs $ 46.68 in 9MFY17 increased of 14.7%# Excludes Non operating revenue
82.4%
1.7 pts y-o-y
PLF%
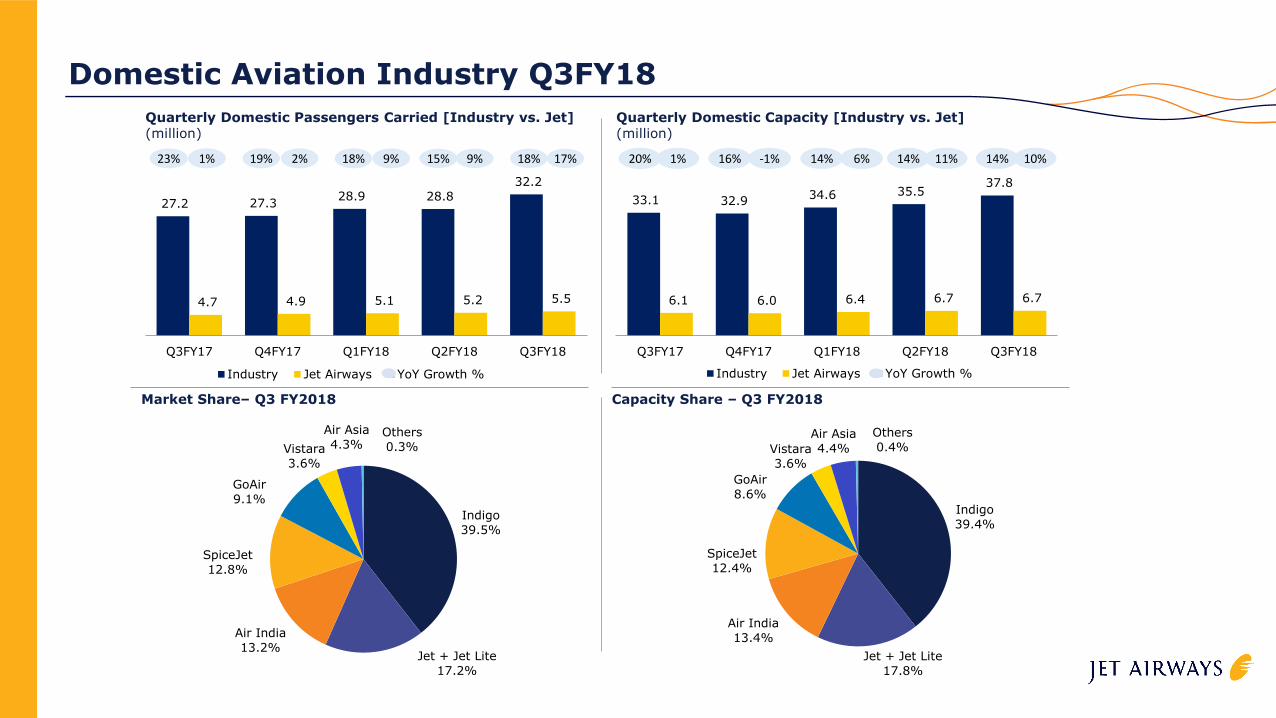
Domestic Aviation Industry Q3FY18
Indigo
39.4%
Jet + Jet Lite
17.8%
Air India
13.4%
SpiceJet
12.4%
GoAir
8.6%
Vistara
3.6%
Air Asia
4.4%
Others
0.4%
Quarterly Domestic Passengers Carried [Industry vs. Jet](million)
27.2 27.3 28.9 28.8
32.2
4.7 4.9 5.1 5.2 5.5
Q3FY17 Q4FY17 Q1FY18 Q2FY18 Q3FY18
Industry Jet Airways YoY Growth %
Capacity Share – Q3 FY2018
19% 2%
Quarterly Domestic Capacity [Industry vs. Jet](million)
33.1 32.9 34.6 35.5
37.8
6.1 6.0 6.4 6.7 6.7
Q3FY17 Q4FY17 Q1FY18 Q2FY18 Q3FY18
Industry Jet Airways YoY Growth %
16% -1%
Indigo
39.5%
Jet + Jet Lite
17.2%
Air India
13.2%
SpiceJet
12.8%
GoAir
9.1%
Vistara
3.6%
Air Asia
4.3%Others
0.3%
Market Share– Q3 FY2018
15% 9% 18% 17% 14% 11% 14% 10%23% 1% 20% 1%18% 9% 14% 6%
Jet Group - Performance Highlights
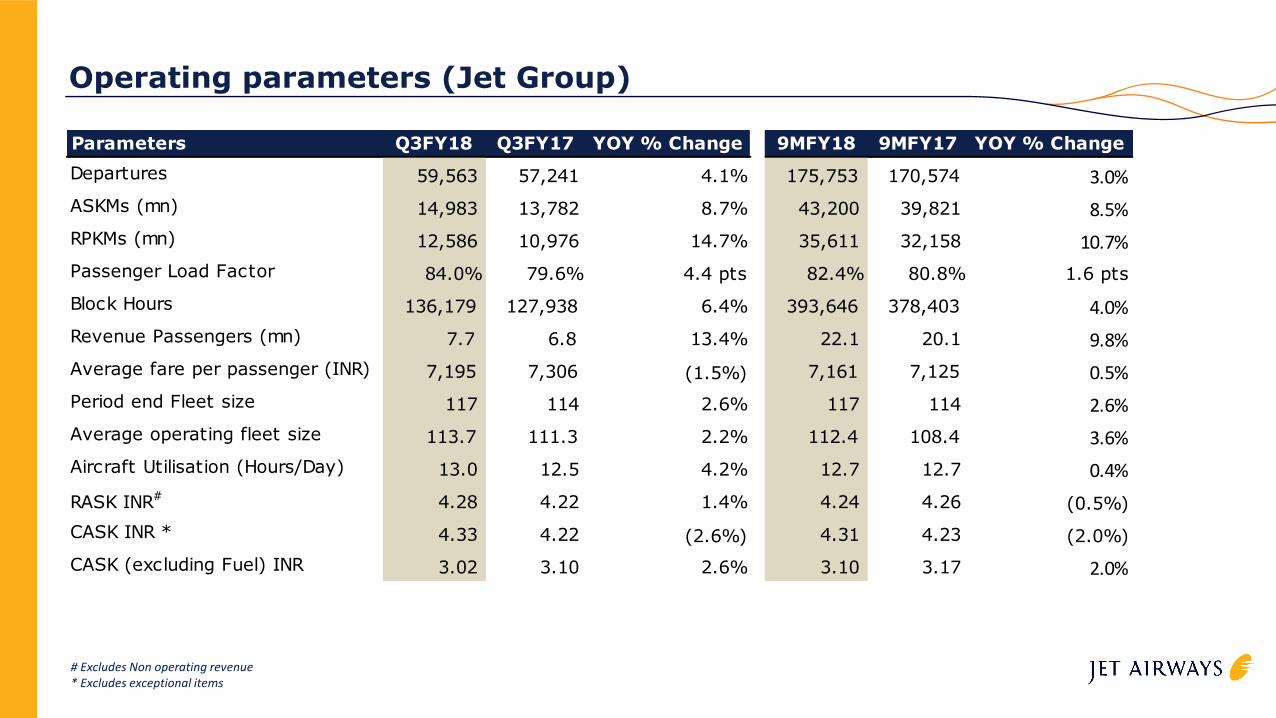
Operating parameters (Jet Group)
# Excludes Non operating revenue * Excludes exceptional items
Parameters Q3FY18 Q3FY17 YOY % Change 9MFY18 9MFY17 YOY % Change
Departures 59,563 57,241 4.1% 175,753 170,574 3.0%
ASKMs (mn) 14,983 13,782 8.7% 43,200 39,821 8.5%
RPKMs (mn) 12,586 10,976 14.7% 35,611 32,158 10.7%
Passenger Load Factor 84.0% 79.6% 4.4 pts 82.4% 80.8% 1.6 pts
Block Hours 136,179 127,938 6.4% 393,646 378,403 4.0%
Revenue Passengers (mn) 7.7 6.8 13.4% 22.1 20.1 9.8%
Average fare per passenger (INR) 7,195 7,306 (1.5%) 7,161 7,125 0.5%
Period end Fleet size 117 114 2.6% 117 114 2.6%
Average operating fleet size 113.7 111.3 2.2% 112.4 108.4 3.6%
Aircraft Utilisation (Hours/Day) 13.0 12.5 4.2% 12.7 12.7 0.4%
RASK INR# 4.28 4.22 1.4% 4.24 4.26 (0.5%)
CASK INR * 4.33 4.22 (2.6%) 4.31 4.23 (2.0%)
CASK (excluding Fuel) INR 3.02 3.10 2.6% 3.10 3.17 2.0%
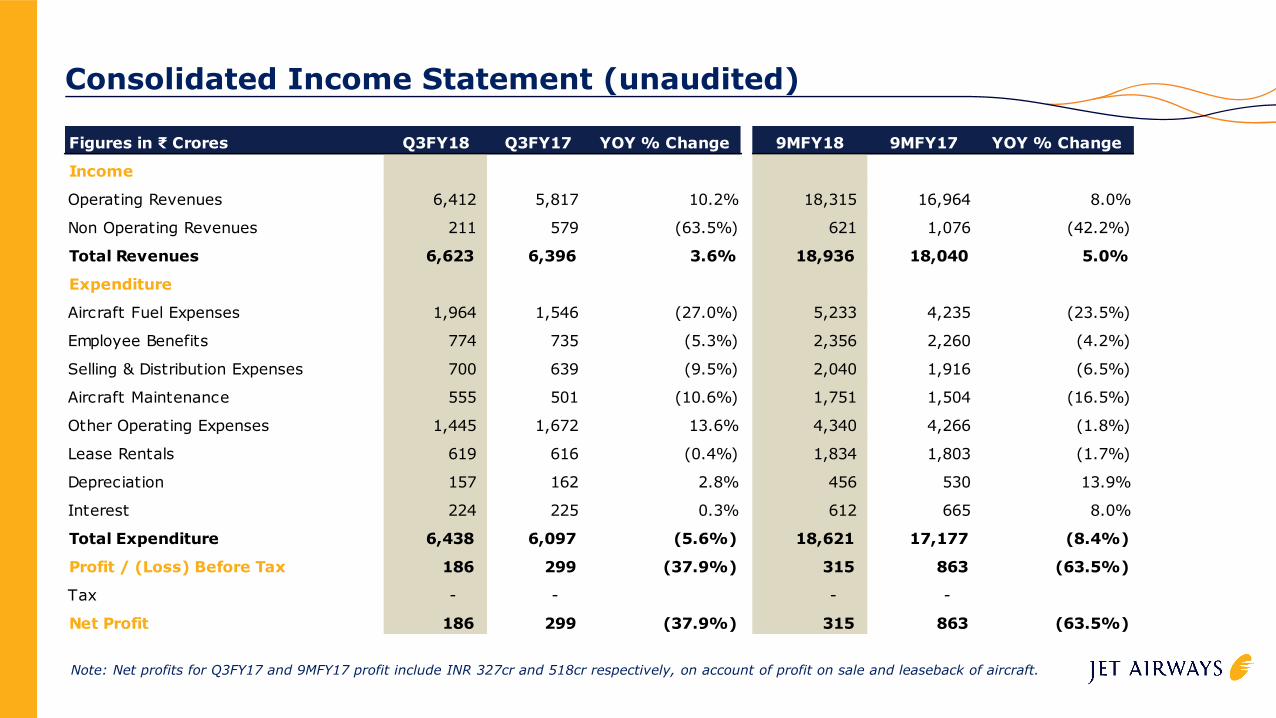
Consolidated Income Statement (unaudited)
Figures in ₹ Crores Q3FY18 Q3FY17 YOY % Change 9MFY18 9MFY17 YOY % Change
Income
Operating Revenues 6,412 5,817 10.2% 18,315 16,964 8.0%
Non Operating Revenues 211 579 (63.5%) 621 1,076 (42.2%)
Total Revenues 6,623 6,396 3.6% 18,936 18,040 5.0%
Expenditure
Aircraft Fuel Expenses 1,964 1,546 (27.0%) 5,233 4,235 (23.5%)
Employee Benefits 774 735 (5.3%) 2,356 2,260 (4.2%)
Selling & Distribution Expenses 700 639 (9.5%) 2,040 1,916 (6.5%)
Aircraft Maintenance 555 501 (10.6%) 1,751 1,504 (16.5%)
Other Operating Expenses 1,445 1,672 13.6% 4,340 4,266 (1.8%)
Lease Rentals 619 616 (0.4%) 1,834 1,803 (1.7%)
Depreciation 157 162 2.8% 456 530 13.9%
Interest 224 225 0.3% 612 665 8.0%
Total Expenditure 6,438 6,097 (5.6%) 18,621 17,177 (8.4%)
Profit / (Loss) Before Tax 186 299 (37.9%) 315 863 (63.5%)
Tax - - - -
Net Profit 186 299 (37.9%) 315 863 (63.5%)
Note: Net profits for Q3FY17 and 9MFY17 profit include INR 327cr and 518cr respectively, on account of profit on sale and leaseback of aircraft.
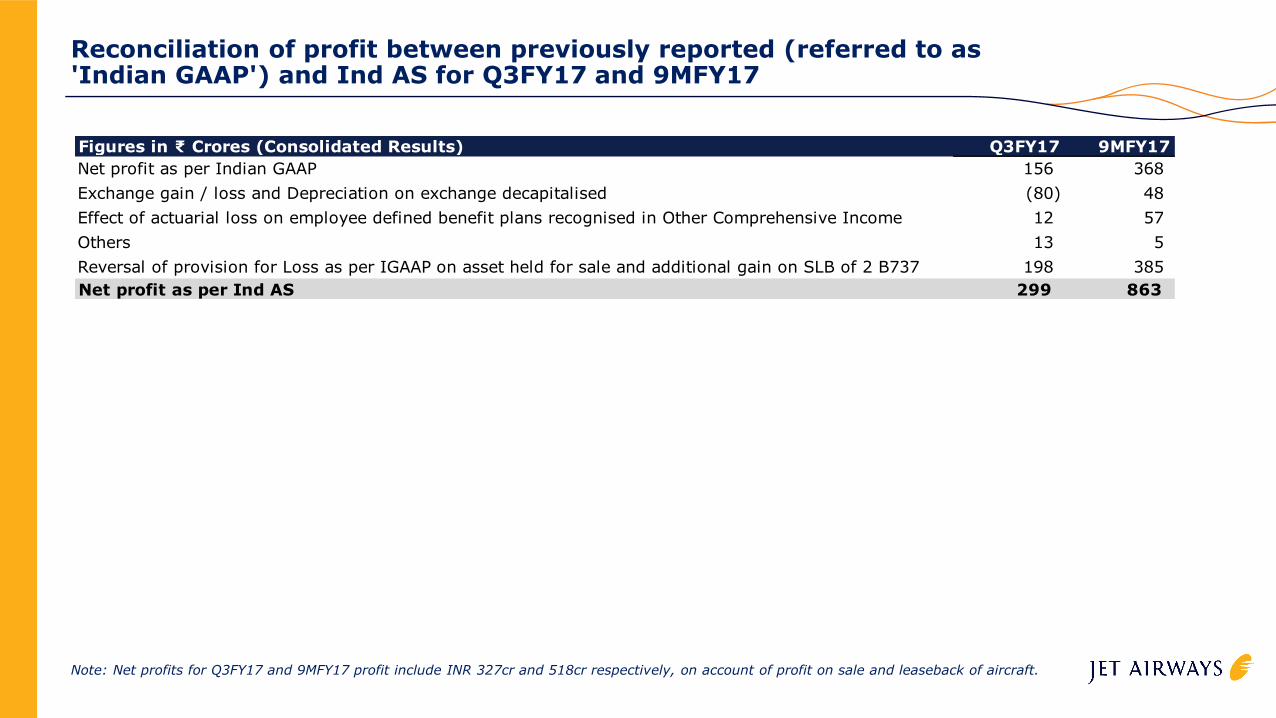
Reconciliation of profit between previously reported (referred to as 'Indian GAAP') and Ind AS for Q3FY17 and 9MFY17
Note: Net profits for Q3FY17 and 9MFY17 profit include INR 327cr and 518cr respectively, on account of profit on sale and leaseback of aircraft.
Figures in ₹ Crores (Consolidated Results) Q3FY17 9MFY17
Net profit as per Indian GAAP 156 368
Exchange gain / loss and Depreciation on exchange decapitalised (80) 48
Effect of actuarial loss on employee defined benefit plans recognised in Other Comprehensive Income 12 57
Others 13 5
Reversal of provision for Loss as per IGAAP on asset held for sale and additional gain on SLB of 2 B737 198 385
Net profit as per Ind AS 299 863
Jet Airways - Standalone Performance Highlights
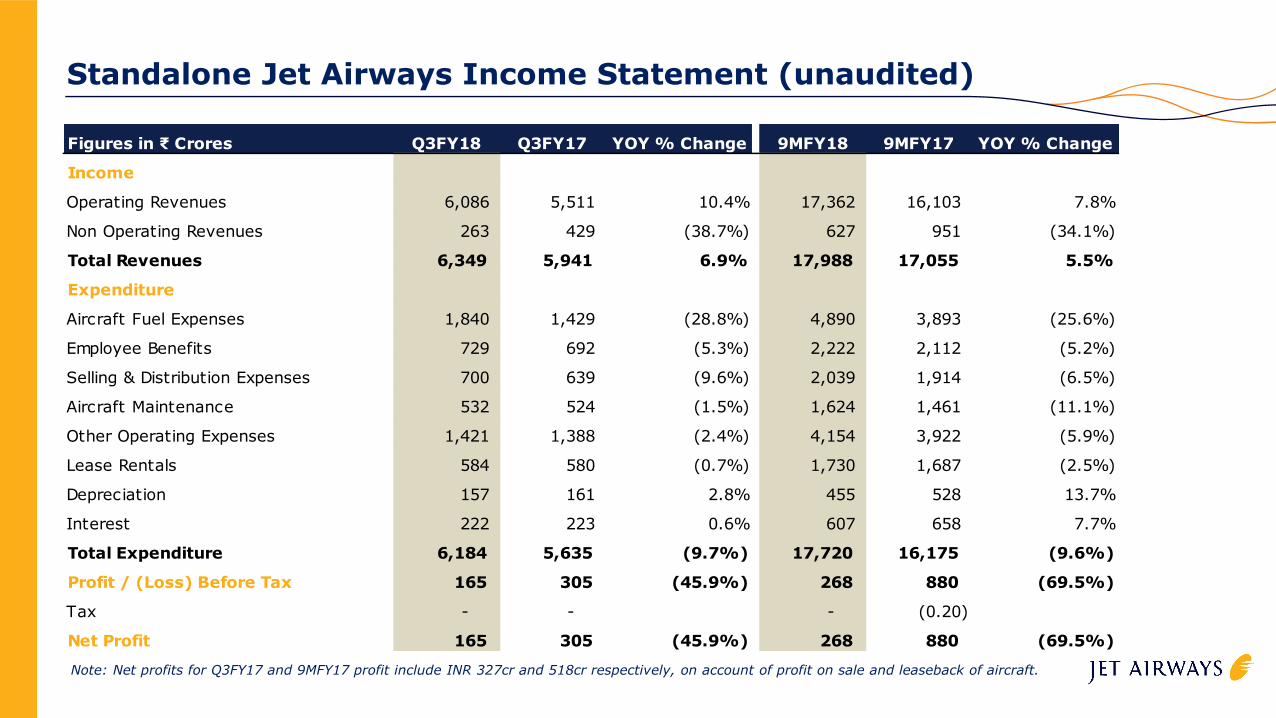
Standalone Jet Airways Income Statement (unaudited)
Figures in ₹ Crores Q3FY18 Q3FY17 YOY % Change 9MFY18 9MFY17 YOY % Change
Income
Operating Revenues 6,086 5,511 10.4% 17,362 16,103 7.8%
Non Operating Revenues 263 429 (38.7%) 627 951 (34.1%)
Total Revenues 6,349 5,941 6.9% 17,988 17,055 5.5%
Expenditure
Aircraft Fuel Expenses 1,840 1,429 (28.8%) 4,890 3,893 (25.6%)
Employee Benefits 729 692 (5.3%) 2,222 2,112 (5.2%)
Selling & Distribution Expenses 700 639 (9.6%) 2,039 1,914 (6.5%)
Aircraft Maintenance 532 524 (1.5%) 1,624 1,461 (11.1%)
Other Operating Expenses 1,421 1,388 (2.4%) 4,154 3,922 (5.9%)
Lease Rentals 584 580 (0.7%) 1,730 1,687 (2.5%)
Depreciation 157 161 2.8% 455 528 13.7%
Interest 222 223 0.6% 607 658 7.7%
Total Expenditure 6,184 5,635 (9.7%) 17,720 16,175 (9.6%)
Profit / (Loss) Before Tax 165 305 (45.9%) 268 880 (69.5%)
Tax - - - (0.20)
Net Profit 165 305 (45.9%) 268 880 (69.5%)
Note: Net profits for Q3FY17 and 9MFY17 profit include INR 327cr and 518cr respectively, on account of profit on sale and leaseback of aircraft.
Thank You
Certain statements in this release concerning Jet Airways’ future growth prospects are forward-looking statements, which involve a number of risks, and uncertainties that could cause actual results to differ
materially from those in such forward-looking statements. The risks and uncertainties relating to these statements include, but are not limited to, risks and uncertainties regarding fluctuations in earnings, our ability
to manage growth, intense competition in the aviation business including those factors which may affect our cost advantage, wage increases, our ability to attract and retain professionals, time and cost overruns on
various parameters, our ability to manage our international operations, liability for damages, withdrawal of governmental fiscal incentives, political instability, legal restrictions on raising capital, and general economic
conditions affecting our industry. Jet Airways may, from time to time, make additional written and oral forward-looking statements, including our reports to shareholders. Jet Airways does not undertake to update any
forward-looking statement that may be made from time to time by or on behalf of the company.
Disclaimer