Embed Size (px)
Citation preview

57 SFS Group AG | Annual report 2020 | Consolidated financial statements SFS Group
Financial report
Financial statements SFS Group
Consolidated income statement 58
Consolidated balance sheet 59
Consolidated statementof changes in equity 60
Consolidated cashflow statement 61
Notes 63
Auditor's report 93
Financial statementsSFS Group AG 99
Information forshareholders 108

58 SFS Group AG | Annual report 2020 | Consolidated financial statements SFS Group
Consolidated income statement
In CHF million Notes 2020 % 2019 % +/–%
Net sales 2.2 1,707.1 100.0% 1,782.1 100.0% –4.2%Other operating income 2.3 17.4 32.6
Change in work in progress and finished goods –9.9 –3.7Material expenses –636.3 –641.2
Contribution margin 1,078.3 63.2% 1,169.8 65.6% –7.8%
Personnel expenses 2.4 –495.1 –550.6
Other operating expenses 2.5 –255.6 –287.5
Depreciation property, plant and equipment 3.4 –96.5 –91.9Amortization of intangible assets 3.5 –3.7 –3.5
Total operating expenses –850.9 –49.9% –933.5 –52.3% –8.8%
Operating profit (EBIT) 227.4 13.3% 236.3 13.3% –3.8%
Financial result 2.6 –7.6 –6.5Share of profit/(loss) from associates/joint ventures 0.5 –0.1
Earnings before tax 220.3 12.9% 229.7 12.9% –4.1%
Income taxes 2.7 –35.5 –23.2
Net income 184.8 10.8% 206.5 11.6% –10.5%
Attributable to non-controlling interests 0.9 1.2Attributable to owners of SFS Group AG 183.9 205.3
Earnings per share of the owners of SFS Group (in CHF)basic and diluted
4.6 4.90 5.47 –10.4%
The notes on pages 63 to 92 are an integral part of these consolidated financial statements.
59 SFS Group AG | Annual report 2020 | Consolidated financial statements SFS Group
Consolidated balance sheet
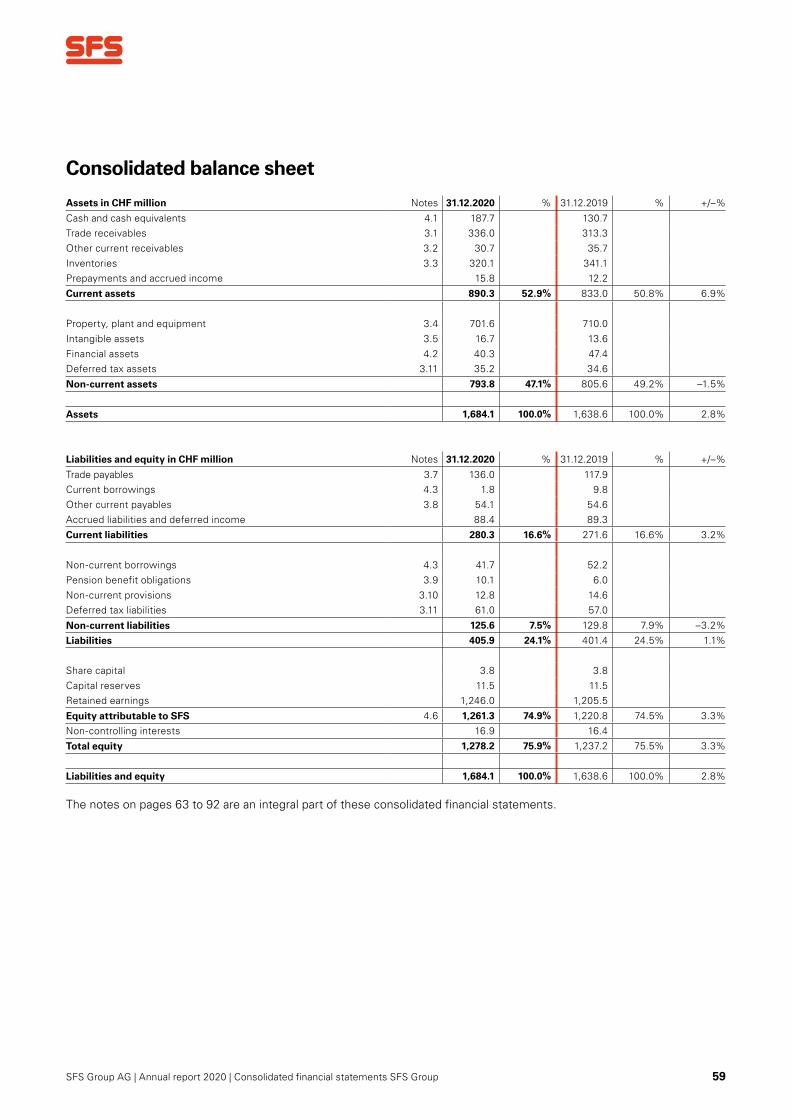
Assets in CHF million Notes 31.12.2020 % 31.12.2019 % +/–%
Cash and cash equivalents 4.1 187.7 130.7Trade receivables 3.1 336.0 313.3
Other current receivables 3.2 30.7 35.7
Inventories 3.3 320.1 341.1Prepayments and accrued income 15.8 12.2
Current assets 890.3 52.9% 833.0 50.8% 6.9%
Property, plant and equipment 3.4 701.6 710.0
Intangible assets 3.5 16.7 13.6
Financial assets 4.2 40.3 47.4Deferred tax assets 3.11 35.2 34.6
Non-current assets 793.8 47.1% 805.6 49.2% –1.5%
Assets 1,684.1 100.0% 1,638.6 100.0% 2.8%
Liabilities and equity in CHF million Notes 31.12.2020 % 31.12.2019 % +/–%
Trade payables 3.7 136.0 117.9Current borrowings 4.3 1.8 9.8
Other current payables 3.8 54.1 54.6Accrued liabilities and deferred income 88.4 89.3
Current liabilities 280.3 16.6% 271.6 16.6% 3.2%
Non-current borrowings 4.3 41.7 52.2
Pension benefit obligations 3.9 10.1 6.0
Non-current provisions 3.10 12.8 14.6Deferred tax liabilities 3.11 61.0 57.0
Non-current liabilities 125.6 7.5% 129.8 7.9% –3.2%
Liabilities 405.9 24.1% 401.4 24.5% 1.1%
Share capital 3.8 3.8
Capital reserves 11.5 11.5Retained earnings 1,246.0 1,205.5
Equity attributable to SFS 4.6 1,261.3 74.9% 1,220.8 74.5% 3.3%
Non-controlling interests 16.9 16.4
Total equity 1,278.2 75.9% 1,237.2 75.5% 3.3%
Liabilities and equity 1,684.1 100.0% 1,638.6 100.0% 2.8%
The notes on pages 63 to 92 are an integral part of these consolidated financial statements.

60 SFS Group AG | Annual report 2020 | Consolidated financial statements SFS Group
Consolidated statement of changes in equity
In CHF million Not
es
Sh
are
cap
ital
Cap
ital
res
erve
s
Goo
dwill
off
set
agai
nst
equi
ty
Cas
h flo
w h
edgi
ng
Cur
renc
y tr
ansl
atio
n ad
just
men
ts
Oth
er r
etai
ned
earn
ings
Ret
ain
ed e
arn
ing
s
Eq
uit
y at
trib
uta
ble
to S
FS
No
n-c
on
tro
llin
gin
tere
sts
Tota
l eq
uit
y
Balance as at 1.1.2019 3.8 73.8 –912.8 1.2 –11.1 2,027.2 1,104.5 1,182.1 22.5 1,204.6
Changes of cash flow hedges – – – –0.5 – – –0.5 –0.5 – –0.5
Acquisitions 5.1 – – –70.0 – – – –70.0 –70.0 – –70.0
Change of minorities 5.1 – – –1.9 – – 3.5 1.6 1.6 –5.4 –3.8
Currency translation adjustments – – – – –21.0 – –21.0 –21.0 –0.3 –21.3
Net income – – – – – 205.3 205.3 205.3 1.2 206.5
Dividend for 2018 – –62.3 – – – –12.7 –12.7 –75.0 –1.6 –76.6
Other changes – – – – – –1.7 –1.7 –1.7 – –1.7
Balance as at 31.12.2019 3.8 11.5 –984.7 0.7 –32.1 2,221.6 1,205.5 1,220.8 16.4 1,237.2
Changes of cash flow hedges – – – –0.3 – – –0.3 –0.3 – –0.3
Acquisitions 5.1 – – –29.7 – – – –29.7 –29.7 – –29.7
Change of minorities 5.1 – – –1.2 – – – –1.2 –1.2 0.0 –1.2
Currency translation adjustments – – – – –44.6 – –44.6 –44.6 –0.1 –44.7
Net income – – – – – 183.9 183.9 183.9 0.9 184.8
Dividend for 2019 – – – – – –67.5 –67.5 –67.5 –0.3 –67.8
Other changes – – – – – –0.1 –0.1 –0.1 – –0.1
Balance as at 31.12.2020 3.8 11.5 –1,015.6 0.4 –76.7 2,337.9 1,246.0 1,261.3 16.9 1,278.2
The notes on pages 63 to 92 are an integral part of these consolidated financial statements.
The capital reserves stem from the capital contribution reserves of SFS Group AG.

61 SFS Group AG | Annual report 2020 | Consolidated financial statements SFS Group
Consolidated cash flow statement
In CHF million Notes 2020 2019 +/–%
Net income 184.8 206.5Income taxes 35.5 23.2
Financial result 7.1 6.5
Depreciation/amortization 3.4/3.5 100.2 95.4
Interest paid 2.6 –1.9 –5.0
Income tax paid –31.8 –44.5
Changes in provisions and allowances 8.9 –0.6
Other non-cash expenses/income –0.2 1.6Profit (–)/loss (+) from disposal of property, plant and equipment –3.6 –15.6
Cash flow before changes in net working capital 299.0 267.5 11.8%
Changes in trade receivables –29.3 2.8
Changes in other receivables and prepayments and accrued income –1.7 –0.7
Changes in inventories 12.3 7.3
Changes in trade payables 21.0 –5.1Changes in other current liabilities, accrued liabilities and deferred income –4.9 5.8
Changes in net working capital –2.6 10.1
Cash flow from operating activities 296.4 277.6 6.8%
Purchases of property, plant and equipment 3.4 -98.4 –114.5
Proceeds from sale of property, plant and equipment 6.6 21.7
Purchases of intangible assets 3.5 -5.7 –2.2
Acquisition of subsidiaries, net of cash acquired 5.1 –59.5 –95.4
Changes in loans granted 8.2 0.7
Investment in/dividends from associates/joint ventures 0.2 –2.5Proceeds from interest and securities 1.0 1.6
Cash flow from investing activities –147.6 –190.6 –22.6%
Proceeds/repayment from/of current borrowings –7.8 –11.2
Proceeds/repayment from/of non-current borrowings –10.5 4.0
Dividends to the shareholders –67.5 –75.0Dividends to non-controlling interests – –1.6
Cash flow from financing activities –85.8 –83.8
Translation adjustment on cash and cash equivalents –6.0 –2.2
Changes in cash and cash equivalents 57.0 1.0
Cash and cash equivalents at beginning of period 4.1 130.7 129.7
Cash and cash equivalents at end of period 4.1 187.7 130.7
The notes on pages 63 to 92 are an integral part of these consolidated financial statements.

62 SFS Group AG | Annual report 2020 | Consolidated financial statements SFS Group

63 SFS Group AG | Annual report 2020 | Consolidated financial statements SFS Group
Notes
1 General information 64 1.1 Summary of significant accounting policies 641.2 Consolidation principles and 64 currency conversion1.3 Critical accounting estimates and judgments 65 1.4 COVID-19 Pandemic 652 Performance 652.1 Segment information 652.2 Net sales 702.3 Other operating income 702.4 Personnel expenses 712.5 Other operating expenses 712.6 Financial result 722.7 Income taxes 723 Capital employed 733.1 Trade receivables 733.2 Other current receivables 743.3 Inventories 743.4 Property, plant and equipment 753.5 Intangible assets 773.6 Theoretical goodwill 783.7 Trade payables 793.8 Other current payables 793.9 Pension benefit obligations 793.10 Non-current provisions 813.11 Deferred tax assets/liabilities 824 Financing and risk management 834.1 Cash and cash equivalents 834.2 Financial assets 844.3 Borrowings 844.4 Leasing 864.5 Off-balance sheet transactions 864.6 Equity and earnings per share 874.7 Derivative financial instruments 884.8 Exchange rates 885 Group structure 895.1 Changes in scope of consolidation 895.2 Group companies 905.3 Transactions with related parties 926 Events after the balance sheet date 92

64 SFS Group AG | Annual report 2020 | Consolidated financial statements SFS Group
1 General information
SFS Group AG is a limited company according to Swiss law, incorporated and domiciled in Heerbrugg, municipality of Wid-nau/SG, Switzerland. SFS Group AG is the parent company of all SFS Group companies and therefore the ultimate holding company of the SFS Group.
All amounts are in CHF million unless otherwise stated and refer to 31 December for balance sheet items and to the finan-cial year from 1 January to 31 December for items of the income statement.
The structure of the notes is as follows:1 General information2 Performance3 Capital employed4 Financing and risk management5 Group structure6 Events after the balance sheet date
1.1 Summary of significant accounting policiesThe consolidated financial statements have been prepared in accordance with all of the existing guidelines of the accoun-ting and reporting recommendations of Swiss GAAP FER. Swiss GAAP FER provides a true and fair view of the financial position of the SFS Group and of its financial performance. The financial statements are based on the principle of historical acquisition costs (except for securities and derivative financial instruments recognized at fair value) and are based on the going concern principle. The consolidated financial statements for the year ended 31 December comprise the company and its subsidiaries and the group's interest in associates and joint ventures. The directives under the accounting standards (Swiss GAAP FER) have not changed in the reporting period.
1.2 Consolidation principles and currency conversionThe consolidated financial statements include the financial statements of SFS Group AG and all its Swiss and foreign subsidia-ries. Using the full consolidation method, all assets and liabilities as well as the expenses and income of the subsidiaries con-trolled by SFS Group AG are included in the consolidated financial statements. Control is assumed when SFS Group AG directly or indirectly holds more than 50% of the voting rights of a subsidiary. Equity and profit or loss attributable to third par-ties are presented as separate line items in the consolidated balance sheet and consolidated income statement. The consolida-ted financial statements have been prepared based on the financial statements of the Group companies, which have been pre-pared in accordance with uniform Group accounting policies as of 31 December.
Intercompany transactions, balances, income and expenses between Group companies are eliminated. Intercompany pro-fits arising from inventories supplied within the Group and disposal of assets are eliminated.
The acquisition method is used to account for business combinations. Under this method, the acquiree's net assets and liabilities are measured at their fair values using uniform Group accounting policies. Any excess of consideration transferred over the fair value of the net assets acquired is offset against equity. In case of disposal, acquired goodwill offset with equity at an earlier date is to be considered at original cost to determine the profit or loss recognized in the income state-ment.
Subsidiaries are fully consolidated from the date on which control is transferred to the Group. They are deconsolidated from the date that control ceases. Related entities are all entities over which the Group has significant influence, but no control. These are divided into joint ventures and associates. Joint control of joint ventures is established by contractual agreement. Strategic, financial and operating decisions require unanimous consent. Associates are those entities in which the Group exerts significant influence, but does not control the financial and operating policies. Significant influence is pre-sumed to exist when the Group holds, directly or indirectly, between 20% and 50% of the voting rights. SFS is entitled to its proportional share of the net assets. Goodwill (if any) is offset against equity.
Items included in the financial statements of each of the SFS Group’s entities are measured using the currency of the pri-mary economic environment in which the entity operates. Foreign currency transactions are translated into the functional currency using the exchange rates prevailing at the dates of the transactions. Foreign exchange gains and losses resulting from the settlement of such transactions and from the translation at year-end exchange rates of monetary assets and liabi-lities denominated in foreign currencies are recognized in the income statement, except when deferred in equity as qua-lifying cash flow hedges.

65 SFS Group AG | Annual report 2020 | Consolidated financial statements SFS Group
The consolidated financial statements are presented in Swiss francs (CHF). For consolidation purposes, the results and financial positions of all Group entities whose functional currency differs from the presentation currency are translated into the presentation currency. Assets and liabilities are translated at the closing exchange rate at the date of that balance sheet. Income and expenses are translated at average exchange rates. All resulting conversion differences are recognized in equity.
Foreign exchange differences resulting from intercompany equity loans in a foreign currency are recognized in equity and reversed through profit and loss upon disposal of the entity or upon repayment of the loan.
1.3 Critical accounting estimates and judgmentsThe preparation of consolidated financial statements requires management to make estimates and judgements that affect the reported amounts of income, expenses, assets, liabilities and the disclosure of contingent assets and liabilities at the date of the financial statements. Therefore, the actual results may differ from these estimates.
The main estimates are in connection with the valuation of the inventory, the determination of useful lives of fixed assets, as well as the capitalization and valuation of deferred tax liabilities and tax assets.
All estimates and judgments are continually reviewed and are based on historical experience and other factors, including expectations regarding future events that appear reasonable under the given circumstances.
1.4 COVID-19 Pandemic To ensure liquidity and profitability various measures have been applied: SFS adjusted capacities, implemented cost-saving programs, increased the focus on reducing net working capital, postponed investments and further expanded credit lines. The pandemic did not have a significant impact on the valuation of the balance sheet items. Contributions from govern-ment support programs and other internal measures were treated as costreduction in the income statement.
2 Performance
This chapter comprises the performance and segment information as well as selected income and expense items.
2.1 Segment informationThe SFS Group is divided into three segments: Engineered Components, Fastening Systems and Distribution & Logistics.
The financial performance of the segments is monitored based on EBIT as well as on operating profit before amortization and depreciation (EBITDA). The segments apply the Group's accounting policies. Internal transactions are conducted based on internal group rates.
Segment assets are all assets which are directly attributable to a segment, such as receivables, inventories, prepayments and accrued income, property, plant and equipment, intangible assets, as well as deferred tax assets. Financial assets are not allocated to a segment. The segment liabilities include directly attributable payables, accrued liabilities and deferred income, pension benefit obligations, non-current provisions as well as deferred tax liabilities.
Segment assets less segment liabilities adds up to capital employed. Intercompany transactions, balances, income and expenses between segments are eliminated and reported in the «Corporate» column.

66 SFS Group AG | Annual report 2020 | Consolidated financial statements SFS Group
30
25
20
15
10
5
Distribution & Logistics
Engineered Components
SFS Group
Fastening Systems
2016 2017 2018 2019 2020
EBITDA In % of net sales
250
200
150
100
50
0
–50
EBITDA In CHF million
Third party salesIn CHF million
Fastening Systems2016 2017 2018 2019 2020
Engineered Components2016 2017 2018 2019 2020
Distribution & Logistics2016 2017 2018 2019 2020
Corporate2016 2017 2018 2019 2020
Distribution & Logistics2016 2017 2018 2019 2020
Engineered Components2016 2017 2018 2019 2020
Fastening Systems2016 2017 2018 2019 2020
1,000
800
600
400
200
The key figure EBITDA includes one-off effects: Engineered Components: 2019 CHF 17.1 million relocation costs in CN-Nantong.Fastening Systems: 2020 CHF 2.1 million book gains from the sale of real estate.Distribution & Logistics: 2019 CHF 14.3 million, 2017 CHF 7.3 million and 2016 CHF 4.2 million book gains from the sale of real estate.

67 SFS Group AG | Annual report 2020 | Consolidated financial statements SFS Group
2020 NotesEngineered
ComponentsFasteningSystems
Distribution& Logistics Corporate
TotalSFS Group
Third party sales 2.2 898.3 489.7 316.9 – 1,704.9
Increase to previous year in % –6.1 –1.7 –2.8 – –4.3
Net sales 2.2 910.4 500.7 321.6 –25.6 1,707.1
EBITDA 210.8 78.6 34.1 4.1 327.6
In % of net sales 23.2 15.7 10.6 19.2
Operating profit (EBIT) 141.2 59.7 28.7 –2.2 227.4
In % of net sales 15.5 11.9 8.9 13.3
Capital expenditure 83.1 10.9 4.1 6.0 104.1
Operating assets 918.2 324.7 149.6 63.5 1,456.0Operating liabilities 208.2 75.4 33.0 45.8 362.4
Capital employed 710.0 249.3 116.6 17.7 1,093.6of which net working capital 238.2 122.7 78.6 –15.6 423.9
2019
Third party sales 2.2 957.1 498.3 326.0 – 1,781.4
Increase to previous year in % –1.0 14.0 –2.5 – 2.5
Net sales 2.2 964.2 511.5 330.9 –24.5 –1,782.1
EBITDA 210.1 67.5 46.5 7.6 331.7
In % of net sales 21.8 13.2 14.1 18.6
Operating profit (EBIT) 147.0 47.1 40.5 1.7 236.3
In % of net sales 15.2 9.2 12.3 13.3
Capital expenditure 94.1 17.4 2.3 2.9 116.7
Operating assets 893.2 360.7 154.7 51.2 1,459.8Operating liabilities 187.8 72.3 32.0 47.3 339.4
Capital employed 705.4 288.4 122.7 3.9 1,120.4of which net working capital 241.4 139.9 83.7 –25.1 439.9
During the reporting period one customer exceeded the reportable threshold of 10% of third party sales (PY none).

68 SFS Group AG | Annual report 2020 | Consolidated financial statements SFS Group
Sales by region Notes 2020 % 2019 %
Switzerland 332.2 19.5 346.0 19.4Germany 231.0 13.6 270.6 15.2
Other Europe 372.1 21.8 423.7 23.8
America 386.9 22.7 384.5 21.6
China 266.2 15.6 234.1 13.1
Other Asia 111.5 6.5 117.5 6.6Africa, Australia 5.0 0.3 5.0 0.3
Third party sales 2.2 1,704.9 100.0 1,781.4 100.0
Not assigned items 2.2 0.7
Total net sales 2.2 1,707.1 1,782.1
Gross sales to third parties are allocated to the countries of the receiving party. Not assigned items include invoiced freight, hedged foreign currency fluctuations effects and cash discounts.
Sales by industries Notes 2020 % 2019 %
Automotive 368.0 21.6 434.6 24.4Construction 530.5 31.1 528.1 29.6
Electronics 356.6 20.9 334.1 18.8
Medical 131.1 7.7 132.8 7.5Other industries 318.7 18.7 351.8 19.7
Third party sales 2.2 1,704.9 100.0 1,781.4 100.0
Not assigned items 2.2 0.7
Total net sales 2.2 1,707.1 1,782.1
Reconciliation of segments to income statement and balance sheet
Income statement Notes 2020 2019
Operating profit (EBIT) 227.4 236.3
Financial result 2.6 –7.6 –6.5Share of profit from associates/joint ventures 0.5 –0.1
Earnings before tax 220.3 229.7
Assets
Operating assets 1,456.0 1,459.9
+ Cash and cash equivalents 4.1 187.7 130.7+ Derivative financial instruments 4.7 0.1 0.6+ Financial assets 4.2 40.3 47.4
Assets 1,684.1 1,638.6
Liabilities and equity
Operating liabilities 362.4 339.4
+ Current borrowings 4.3 1.8 9.8+ Long-term borrowings 4.3 41.7 52.2
Liabilities 405.9 401.4
Equity (Net assets) 1,278.2 1,237.2

69 SFS Group AG | Annual report 2020 | Consolidated financial statements SFS Group
Engineered ComponentsIn the Engineered Components segment, SFS develops, manufactures and supplies customer-specific precision compo-nents, mechanical fastening solutions and assemblies. As a specialist in the field of cold forming, deep drawing, injection molding, precision machining and mechanical fastening, it aims to be the preferred development partner for customer speci-fic components and assemblies. By focusing on selected customer groups, it ensures high application expertise in business units and key account structures. Within its applied technologies and industries, Engineered Components is seeking to occupy a leading position.
Fastening SystemsThe Fastening Systems segment combines the principles of threaded fastening and riveting technologies. Cold forming, and injection molding as well as the related secondary operations are applied in the production of application-optimized products. By combining the basic fasteners with innovative and efficient installation tools and logistic solutions, they support safe, eco-nomical and timely processing at the installation site. Having a worldwide network of sales locations, customer demands can be met through local consulting and delivery services.
Distribution & LogisticsThe Distribution & Logistics segment is a leading national supply partner for fasteners, tools, architectural hardware and related products to industrial customers, professional trade, wholesalers and DIY centers. Through international alliances and sourcing, Distribution & Logistics serves its customers with fast and reliable processes and products at competitive cost levels. Furthermore, value is added by providing tailor-made supply chain solutions, which employ state-of-the-art e-business, warehouse and IT technologies.
CorporateIn addition to the elimination of intercompany transactions, the «Corporate» column contains the corporate numbers relating to Technology and Services.
Technology ensures the transfer of know-how among the segments and production sites. Methods, processes and best practices are exchanged and enhanced. Standardized investment policies and engineering processes improve the efficiency of the SFS Group further.
Services provides added value across the Group in the fields of information technology, finance, controlling, human resources, communication as well as other business functions.

70 SFS Group AG | Annual report 2020 | Consolidated financial statements SFS Group
2020 2019 +/– %
Third party sales 1,704.9 1,781.4 –4.3Other items 2.2 0.7
Net sales 1,707.1 1,782.1 –4.2
Third party sales decreased by 4.3% (PY increased by 2.5). The growth due to changes in the scope of consolidation amounts to 3.0% (PY 4.4). Based on a like-for-like view and ignoring foreign currency effects, sales decreased by 3.2% (PY 0.6). The currency translation effect amounts to –4.1% (PY –1.3).
The service revenues account for less than 1% of total revenue (PY less than 1%). It does not comprise interests, user fees or dividends.
Sales of goods and services are recognized when the risks and rewards have been transferred to the customer, which is the point of shipping or billing or when services are rendered. Cash discounts and rebates granted to customers are treated as a reduction of sales.
2.3 Other operating income2020 2019
Revenue from services 6.9 8.1Lease income 0.5 0.7
Own-built machinery and capitalized own work 5.7 7.4Gain on disposals of assets 4.3 16.4
Total 17.4 32.6
In 2020, the SFS Group has started a project for the upgrade of the ERP system to SAP S/4HANA. The related own work is and will be capitalized in accordance with Swiss GAAP FER.
15
12
9
6
3
0
–3
–6
Increase of net salesin %
20202019201820172016
2,000
1,800
1,600
1,400
1,200
1,000
800
600
400
200
Net salesin CHF million
20202019201820172016
2.2 Net sales

71 SFS Group AG | Annual report 2020 | Consolidated financial statements SFS Group
2.4 Personnel expenses2020 2019
Wages and salaries 392.9 431.6Profit sharing 7.0 7.9
Social security 84.6 87.9Other employment expenses 10.6 23.2
Total 495.1 550.6
In 2020, personnel expenses are reduced by contributions from government support programs and further internal measures summing up to CHF 39.0 million worldwide. In 2019, personnel expenses include one-off costs of CHF 11.6 million due to the move to CN-Nantong.
Share-based paymentsThe members of the Board of Directors and of the Group Executive Board receive a variable compensation in the form of shares of the SFS Group AG. The shares rewarded must be held for at least three years. The expenses of these shares represent the share price on the day they are granted and are charged to the income statement under the line item «Per-sonnel expenses».
In addition, SFS maintains a share purchase program for its employees. Usually, every other year shares of the SFS Group AG are sold to key management members and specialists at a discount, which is charged to the income statement. The last share purchase program took place in 2018.
2.5 Other operating expenses2020 2019
Tools, energy, maintenance 127.6 146.4Selling and distribution 81.1 92.1Other operating expenses 46.9 49.0
Total 255.6 287.5
In 2019, the other operating expenses include one-off costs of CHF 3.1 million due to the move to CN-Nantong
Other operating expenses include operating lease expenses amounting to CHF 15.2 million (PY 16.0). The total costs for research and development recognized during the reporting period amount to CHF 44.5 million (PY 44.4). The main items responsible for those costs include the fields development, tools, sampling and preparation for large-lot production.
Development cost are only capitalized in case the future income covers the capitalized amount and if the other criteria re-quired by Swiss GAAP FER are met. The research and development costs are recognized under different line items in the income statement as the requirements for capitalization according to Swiss GAAP FER have not been met.

72 SFS Group AG | Annual report 2020 | Consolidated financial statements SFS Group
2.6 Financial result2020 2019
Interest expenses –1.9 –4.8Foreign exchange loss on financial investments –6.6 –3.2
Financial expenses –8.5 –8.0
Interest income 0.9 1.5
Financial income 0.9 1.5
Financial result –7.6 –6.5
Borrowing costs directly attributable to the acquisition, construction or production of qualifying assets, which are assets that necessarily take a substantial period of time to get ready for their intended use, are added to the cost of those assets. All other borrowing costs are recognized in financial expenses in the period in which they incurred.
2.7 Income taxes2020 2019
Current income tax 31.3 37.7Deferred tax expense (+)/-income (–) 4.2 –14.5
Income tax expense 35.5 23.2
Reconciliation
Earnings before tax 220.3 229.7Expected tax rate 14.5% 14.5%
Expected income tax 31.9 33.3
Variance in tax rates 9.7 10.6
Impact of change in tax rate on deferred taxes 0.1 –5.9
Items not subject to tax –3.1 –0.4
Changes in tax loss carryforwards 0.1 0.1
Goodwill amortisation for tax purposes 0.2 –12.7Adjustment in respect of prior years and other items –3.4 –1.8
Income tax 35.5 23.2
Effective tax rate 16.1% 10.1%
The income tax expense includes taxes which have been paid and accrued based on the profits of the taxable entities. These are calculated based on the relevant tax rates in the different countries. The reconciliation summarizes the individual reconciliation calculations which have been prepared based on the applicable tax rates of the respective tax jurisdictions. The expected income tax has been calculated based on the future expected tax rate of 14.5% (PY 14.5%) and corresponds to the maximum tax rate for legal entities in the canton of St. Gallen.
In 2019, the decrease of the corporate income tax rate in Switzerland led to a revaluation of deferred tax assets and deferred tax liabilities. The revaluation resulted in a non-recurring deferred tax income of CHF 5.9 million. A significant improvement of the operational performance in North America was expected. Hence deferred tax assets related to amortizable tax good-will and, to a smaller extent, tax loss carry forwards of net CHF 11.3 million were recognized. In sum, this resulted in a oneoff effect of CHF 17.2 million in 2019.

73 SFS Group AG | Annual report 2020 | Consolidated financial statements SFS Group
3 Capital employed
“Capital employed” consists of operating assets less operating liabilities. Operating assets include all assets directly attri-butable to the segments such as receivables, inventories, prepaid expenses, property, plant and equipment, intangible as-sets and deferred tax assets. Operating liabilities comprise all liabilities directly attributable to the segments such as ac-crued liabilities, pension benefit obligations, provisions and deferred tax liabilities.
3.1 Trade receivables2020 2019
From third parties 337.2 315.8From associates/joint ventures 1.0 0.5
From related parties 0.3 0.3Valuation allowances –2.5 –3.3
Total 336.0 313.3
Ageing analysis 2020 2019
Not yet due 285.9 256.1Overdue 1 to 30 days 40.9 43.8
Overdue 31 to 90 days 9.8 14.2Overdue more than 91 days 1.9 2.5
Trade receivables – gross 338.5 316.6Valuation allowances –2.5 –3.3
Trade receivables – net 336.0 313.3
Current receivables are carried at nominal value, less appropriate provisions for debtors.

74 SFS Group AG | Annual report 2020 | Consolidated financial statements SFS Group
3.2 Other current receivables2020 2019
VAT and withholding tax 13.7 16.1Other receivables 16.9 19.0Derivative financial instruments 0.1 0.6
Total 30.7 35.7
3.3 Inventories2020 2019
Raw materials 35.5 37.6Consumables 12.0 8.4
Work in progress 76.1 86.0
Finished goods 247.8 253.7Valuation allowances –51.3 –44.6
Total 320.1 341.1
Inventories are generally stated at the lower of cost or net realizable value. The cost of goods comprises raw materials, di-rect labor, other direct costs and related production overheads based on normal operating capacity utilization. Cash dis-counts from suppliers are deducted from costs of purchase.
Necessary valuation allowances are based on individual valuation of single items. The inventory quantity of each item is generally compared with annual consumption over the last twelve months. The first annual consumption of stock is as-sessed recoverable by 100%. If the quantity of inventory is higher than annual consumption, the excess inventory for the second annual consumption is written down to 50% of the value. All inventory above two years annual consumption is completely written off. Items added to the product range during the last 18 months prior to the balance sheet date are de-fined as new products and are not revalued.
In addition, the average sales price less distribution cost is compared with the cost of inventory. This valuation represents the net realizable value principle and any difference is included in the valuation allowance.

75 SFS Group AG | Annual report 2020 | Consolidated financial statements SFS Group
3.4 Property, plant and equipmentUndeveloped
propertyLand andbuildings
Machines andequipment
Assets underconstruction Total
Cost as at 1.1.2019 6.1 644.2 1,047.3 82.9 1,780.5
Changes in scope of consolidation – 0.9 0.6 – 1.5
Additions 1.0 16.6 56.1 40.8 114.5
Disposals –0.8 –27.9 –50.0 – –78.7
Reclassification – 34.1 39.6 –74.3 –0.6Exchange differences 0.2 –10.0 –15.1 –0.9 –25.8
Cost as at 31.12.2019 6.5 657.9 1,078.5 48.5 1,791.4
Changes in scope of consolidation – 4.8 15.2 0.1 20.1
Additions – 21.1 49.7 27.6 98.4
Disposals – –2.5 –24.1 –0.5 –27.1
Reclassification – 7.2 28.9 –37.1 –1.0 Exchange differences – –14.1 –29.9 –1.1 –45.1
Cost as at 31.12.2020 6.5 674.4 1,118.3 37.5 1,836.7
Accumulated depreciation as at 1.1.2019 – –356.6 –717.4 – –1,074.0
Changes in scope of consolidation – –23.1 –68.8 – –91.9
Depreciation – 22.6 50.0 – 72.6
Disposals – –0.2 0.2 – –Exchange differences – 4.2 7.7 – 11.9
Accumulated depreciation as at 31.12.2019 – –353.1 –728.3 – –1,081.4
Changes in scope of consolidation – – –1.6 – –1.6
Depreciation – –24.3 –72.2 – –96.5
Disposals – 2.1 22.1 – 24.2
Reclassification – –2.9 2.6 – –0.3 Exchange differences – 5.0 15.5 – 20.5
Accumulated depreciation as at 31.12.2020 – –373.2 –761.9 – –1,135.1
Net book value as at 1.1.2019 6.1 287.6 329.9 82.9 706.5Net book value as at 31.12.2019 6.5 304.8 350.2 48.5 710.0
Net book value as at 31.12.2020 6.5 301.2 356.4 37.5 701.6
Property, plant and equipment is stated at historical cost less depreciation. Value-added expenditures, which lead to an ex-tension of useful life or increased production capacity, are capitalized. Interest expenses incurred when the asset was under construction, are included in the historical costs, if material. Depreciation is calculated using the straight-line method to allocate the cost over the asset’s estimated useful lives, as follows:
76 SFS Group AG | Annual report 2020 | Consolidated financial statements SFS Group
Buildings Years
Buildings 20–33
Infrastructure 10–15
Machines and equipment
Machinery 5–15
Furniture, fittings and equipment 5–10
Office machinery, computer equipment 3–5
Vehicles 3–8
Based on its infinite useful life, land is stated at cost and is not depreciated.
The assets are reviewed for impairment whenever events or changes in circumstances indicate that the carrying amount may not be recoverable. An impairment loss is recognized through profit and loss for the amount by which the asset’s carrying amount exceeds its recoverable amount. Government grants related to assets are offset against the historical costs of the asset concerned, as long as SFS Group has no obligation for repayment.
The book value of assets under construction includes down payments to suppliers of CHF 11.3 million (PY 16.5).
In order to collateralize borrowings, assets amounting to CHF 26.6 million (PY 25.9) have been pledged with CHF 8.5 million (PY 17.0), of which CHF 0.2 million (PY 10.0) have been drawn.
The financial commitments for contracted purchases of property, plant and equipment as well as for assets under cons-truction amount to CHF 16.5 million (PY 22.5).
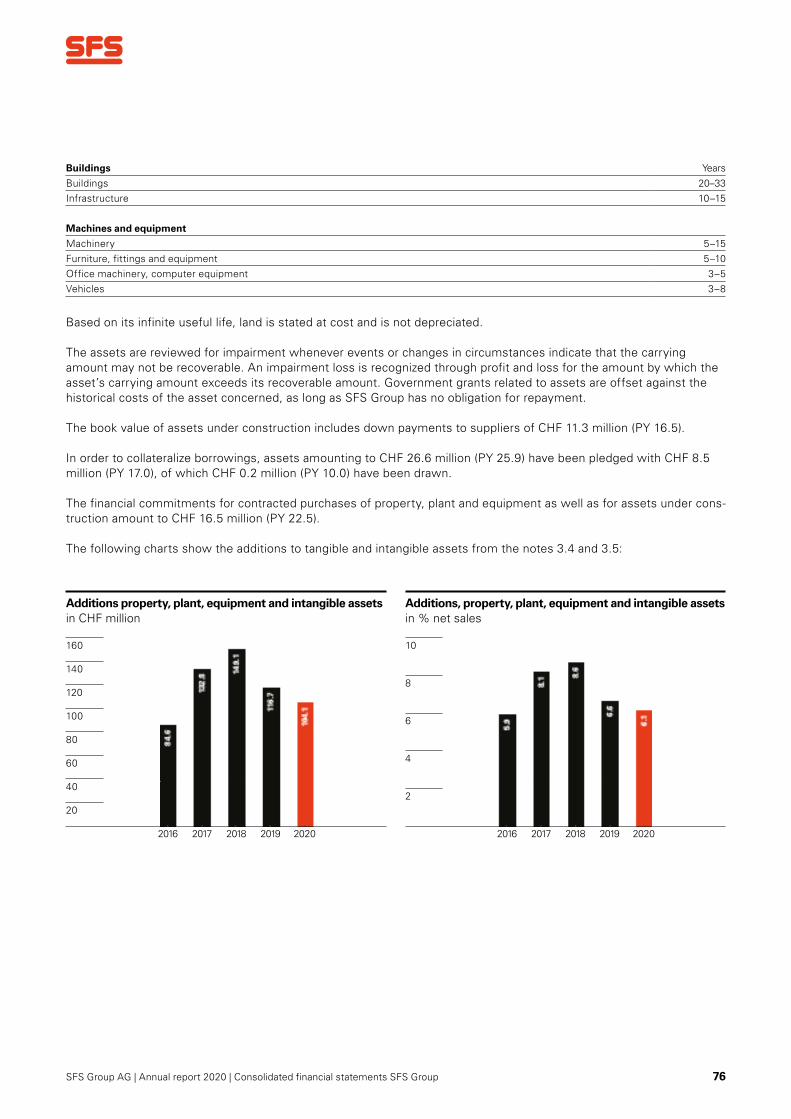
The following charts show the additions to tangible and intangible assets from the notes 3.4 and 3.5:
10
8
6
4
2
Additions, property, plant, equipment and intangible assetsin % net sales
160
140
120
100
80
60
40
20
Additions property, plant, equipment and intangible assetsin CHF million
20202019201820172016 20202019201820172016

77 SFS Group AG | Annual report 2020 | Consolidated financial statements SFS Group
3.5 Intangible assetsCustomers,
brands,technology Software
Software indevelopment
Buildingleases,patents Total
Cost as at 1.1.2019 298.3 72.6 – 3.3 374.2
Additions – 2.2 – – 2.2
Disposals – –0.9 – – –0.9
Derecognition –301.0 – – – –301.0
Reclassification – 0.6 – – 0.6Exchange differences 2.7 –0.5 – –0.1 2.1
Cost as at 31.12.2019 – 74.0 – 3.2 77.2
Changes in scope of consolidation – 0.1 – – 0.1
Additions – 2.4 3.3 – 5.7
Reclassification – 1.0 – – 1.0 Exchange differences – –0.4 – –0.1 –0.5
Cost as at 31.12.2020 – 77.1 3.3 3.1 83.5
Accumulated amortization as at 1.1.2019 –298.3 –60.0 – –0.5 –359.4
Amortization – –3.4 – –0.1 –3.5
Disposals – 0.6 – – 0.6
Derecognition 301.0 – – – –301.0Exchange differences –2.7 0.3 – 0.1 –2.3
Accumulated amortization as at 31.12.2019 – –63.1 – –0.5 –63.6
Amortization – –3.6 – –0.1 –3.7
Reclassification – 0.4 – –0.1 0.3 Exchange differences – 0.1 – 0.1 0.2
Accumulated amortization as at 31.12.2020 – –66.2 – –0.6 –66.8
Net book value as at 1.1.2019 – 12.0 – 2.8 14.8Net book value as at 31.12.2019 – 10.9 – 2.7 13.6
Net book value as at 31.12.2020 – 10.9 3.3 2.5 16.7
Intangible assets generated internally – – 1.1 – 1.1
Of which purchased intangible assets – 10.9 2.2 2.5 15.6
The purchased intangible assets in the “Customers, brands, technology” column include the assets from the Unisteel Technology acquisition. These were fully amortized and derecognized in 2019.
Intangible assets are carried at cost less accumulated amortization. Amortization is calculated using the straight-line method to allocate the costs over the assets' estimated useful lives, as follows:
Years
Customers, brands, technology 3–5
Software 3–10
Building leases (maximum) 50
Patents 3–5
Intangible assets related to individuals are amortized over a lifetime of five years.

78 SFS Group AG | Annual report 2020 | Consolidated financial statements SFS Group
Intangible assets generated internally can only be recognized as an asset if they meet all of the following conditions at the time of the initial recognition:
They are identifiable, controlled by the organization, they will yield a measurable benefit for the organization over several ye-ars, expenses can be recognized and measured separately and it is likely that the resources needed to complete the intan-gible assets are available or will be made available.
The intangible assets are reviewed for impairment whenever events or changes in circumstances indicate that the carryingamount may not be recoverable. An impairment loss is recognized for the amount by which the asset’s carrying amount exceeds its recoverable amount.
In 2020, the SFS Group had CHF 5.4 million (PY 0.6) future commitments to purchase software or software-related projects.
3.6 Theoretical goodwillGoodwill and intangible assets related to acquisitions are offset against equity at acquisition date. The effects of theoreticalcapitalization and amortization over five years, including any impairments, are shown in a shadow statement below. If a con-tract is concluded, transaction costs are part of acquisition costs. Earn out payments are offset against equity as well. As goodwill is immediately offset against equity at acquisition date, an impairment of goodwill would not impact the income statement, but the theoretical impact would be shown in the shadow accounting.
2020 2019
Balance as at 1.1. 314.1 248.8
Acquisitions 30.9 71.9Exchange differences –34.9 –6.6
Balance as at 31.12. 310.1 314.1
Accumulated amortization as at 1.1. –179.2 –125.1
Amortization –60.1 –57.8Exchange differences 16.1 3.7
Accumulated amortization as at 31.12. –223.2 –179.2
Theoretical value of goodwill as at 31.12. 86.9 134.9
Equity attributable to SFS 1,278.2 1,237.2Theoretical value of goodwill 86.9 134.9
Theoretical shareholders' equity as at 31.12. 1,365.1 1,372.1
Net income 184.8 206.5Amortization of goodwill –60.1 –57.8
Theoretical net income 124.7 148.7
79 SFS Group AG | Annual report 2020 | Consolidated financial statements SFS Group
3.7 Trade payables
2020 2019
Against third parties 136.0 117.9
Total 136.0 117.9
Liabilities are recognized in the balance sheet at nominal value.
3.8 Other current payables
2020 2019
VAT and other liabilities 30.6 29.0Tax liabilities 23.5 25.6
Total 54.1 54.6
3.9 Pension benefit obligations SFS Group maintains pension plans in several countries. The Swiss plans are legal entities that are financially independent from the SFS Group. They are compliant with local requirements and the employees and SFS usually fund the plan in equal parts.
The economic impact of the pension plans on SFS Group is reassessed annually. The valuation of a surplus or deficit is based on the plan's financial statement in accordance with Swiss GAAP FER 26 (Swiss plans) or based on an established methodol-ogy in the respective jurisdiction (non-Swiss plans). An economic benefit exists if it is permitted and intended to use the sur-plus to decrease the employer contributions. Surpluses which SFS Group can use as contributions at any time are recognized as assets in SFS Group's balance sheet. In the case of a deficit, an economic obligation exists if the conditions for estab-lishing a provision are met. The change from the previous year in economic benefit and economic obligation is recognized (together with the expenses relating to the business period) as personnel expenses in the result of the period.
Swiss plans Employees of the SFS Group in Switzerland are insured against the risks of old age, death and disability with the SFS Pen-sion Fund based on the Federal Law on Occupational Retirement, Survivors’ and Disability Pension Plans (OPA).
The SFS Pension Fund is a foundation, which is legally separated from the SFS Group. As per 31 December 2020, the SFSPension Fund has an expected coverage ratio according to the OPA of 118.2% (PY 119.5%). The pension liabilities and actu-arial reserves are calculated based on a technical interest rate of 1.5% (PY 1.75). The present challenge is the sustainable fi-nancing of future retirement pensions, which is hard to meet due to an ongoing increase of life expectancy and a rather low interest rate environment. The trustees of the SFS Pension Fund therefore decided to reduce the conversion rate gradually to 5.2% until 2024. At the same time, saving contributions of all age groups will be increased by 1.1% from 2021 onwards. The determination of the economic impact on the SFS Group is based on the preliminary financial statements of the SFS Pension Fund and the Patronage Fund. The SFS Patronage Fund holds 26,308 shares (PY 29,000) in SFS Group AG.

80 SFS Group AG | Annual report 2020 | Consolidated financial statements SFS Group
Non-Swiss plansFor non-Swiss plans, an external actuarial report is used to determine the impact on the SFS Group. Depending on the mix ofinsured persons (employees, retirees), the present value of benefit obligations is calculated using an interest rate of 0.4% to1.6% (PY 0.5% to 2.1%).
Employer contribution reserve (ECR)
Nominalvalue
31.12.2020
Waiver ofuse
2020
Balancesheet
31.12.2020Accumulation
2020
Balancesheet
31.12.2019
Result from ECR inpersonnel expenses
2020 2019
Patronage Fund 19.3 – 19.3 0.3 19.0 – –SFS Pension Fund 1.3 – 1.3 – 1.3 – –
Total 20.6 – 20.6 0.3 20.3 – –
An economic benefit is capitalized in SFS Group’s balance sheet coming from uncommitted employer contribution reser-ves as well as from the Patronage fund’s non-committed liabilities. It intends to use the surplus to decrease the employer contributions.
Economic benefit/eco-nomic obligation and pension benefit expenses
Surplus/deficit 31.12.2020
Economical part of SFS Change toprior year
Contributionconcerning
2020
Pension benefit expenseswithin personnel expenses
31.12.2020 31.12.2019 2020 2019
Patronage Fund 3.7 3.7 3.3 0.4 – –0.4 1.7Pension Funds
without surplus/deficit – – – – 24.3 24.3 23.6
with deficit –2.8 –2.8 –2.4 –0.4 – 0.4 –0.4without own assets –7.3 –7.3 –3.6 –3.7* – 0.6 0.2
Total –6.4 –6.4 –2.7 –3.7 24.3 24.9 25.1
* Includes CHF 3.1 million which have been reclassified from non-current provisions in 2020.
Pension Funds «without surplus/deficit» includes the SFS Pension Fund. At balance sheet date, no non-committed reser-ves exist. Therefore, neither an economic benefit nor an economic obligation is capitalized in SFS Group’s balance sheet. Furthermore, foreign contribution-based plans are included in this category.
Pension Funds «with deficit» includes plans of which benefit obligations exceed the plan’s assets. As of 31 December 2020 as well as of 31 December 2019 this is the case for plans in Germany and UK.
Pension Funds «without own assets» includes two plans in Germany. They are treated in the same way as the deficits of pension plans in the «with deficit» category.

81 SFS Group AG | Annual report 2020 | Consolidated financial statements SFS Group
3.10 Non-current provisions
Anniversaries,severancepayments
Other provisions Total
Balance as at 1.1.2019 11.8 2.3 14.1
Changes in scope of consolidation – 0.5 0.5
Additions 1.2 0.4 1.6
Used amounts –0.7 – –0.7
Unused amounts reversed – –0.2 –0.2Exchange differences –0.4 –0.3 –0.7
Balance as at 31.12.2019 11.9 2.7 14.6
Changes in scope of consolidation – 1.2 1.2
Additions 1.6 1.0 2.6
Used amounts –1.3 –0.3 –1.6
Unused amounts reversed –0.1 –0.5 –0.6
Reclassification –3.1 – –3.1Exchange differences –0.2 –0.1 –0.3
Balance as at 31.12.2020 8.8 4.0 12.8
Of which non-current 8.8 4.0 12.8
Various countries are obliged to recognize provisions as the employees are entitled to receive severance payments follo-wing the termination of employment. These are classified as contribution-based and disclosed in the «Anniversaries, se-verance payments» column. The «Other provisions» column contains provisions for warranty claims and business risks. Obligations arising from product liability are covered by the SFS Group’s insurance policies. In addition to this, provisions are recognized for warranty claims based on historical experience and amount to CHF 1.8 million (PY 1.6). For other busi-ness risks, CHF 2.2 million (PY 1.1) are deferred.
In 2020, CHF 3.1 million have been reclassified from non-current provisions to pension benefit obligations due to a reas-sessment.
A provision is recognized when SFS Group has a present legal or constructive obligation as a result of past events, it is probable that an outflow will be required and the amount of outflows can be estimated reliably. The valuation of provisi-ons is based on SFS Group’s best estimate at balance sheet date.

82 SFS Group AG | Annual report 2020 | Consolidated financial statements SFS Group
3.11 Deferred tax assets (–)/liabilities (+)
Net deferred tax balances 31.12.2020 31.12.2019
Deferred tax assets –35.2 –34.6Deferred tax liabilities 61.0 57.0
Total 25.8 22.4
Movement in net deferred tax balances 2020 2019
Balance as at 1.1. 22.4 43.9Changes in scope of consolidation –1.8 –5.4
Charged (+)/credited (–) to income statement 4.1 –16.4
Charged (+)/credited (–) to equity –0.4 –0.1Exchange differences 1.5 0.4
Balance as at 31.12. 25.8 22.4
Current tax liabilities arising from the taxable profit of the reporting period are accrued for, irrespective of when they are due for payment. Deferred income tax is recognized on all temporary differences arising between the values determined according to tax law and their carrying amounts in the consolidated financial statements.
The deferred taxes are determined using local tax rates that have been enacted by the balance sheet date and are expected to apply when the deferred tax items are realized or settled. Deferred income tax liabilities arising from future distribution of retained earnings are not recognized when the Group is able to control the timing and a reversal of the temporary difference is unlikely.
The table below shows the tax loss carryforwards:
Tax loss carryforwardsRecognized Unrecognized
2020 2019 2020 2019Expiry within 3 years – – 6.0 6.1Expiry in 4 to 7 years 18.4 31.8 2.8 3.1Expiry after 7 years 4.6 16.0 13.4 14.8
Total 23.0 47.8 22.2 24.0
Deferred tax assets are recognized for tax loss carryforwards and on other temporary differences to the extent that is ex-pected to be realizable within the next five years.
In 2020, the decrease of recognized tax loss carryforwards is primarily driven by the economic success of Unisteel Technology (China) Co., Ltd in Nantong. The entity has gradually ramped up its operations in 2019. For tax purposes, the investments in tangible assets have been fully depreciated in 2019.

83 SFS Group AG | Annual report 2020 | Consolidated financial statements SFS Group
4 Financing and risk management
This chapter describes the management of the capital structure and its financial risks. The aim is to optimize profits in relation to equity plus net debt, to secure liquidity and to minimize currency risks.
4.1 Cash and cash equivalents
2020 2019
Cash at bank and on hand 187.7 130.0Current bank deposits – 0.7
Total cash and cash equivalents 187.7 130.7
Cash and cash equivalents include cash on hand, deposits held on call with banks and other short-term highly liquid in-vestments. Due to the short-term maturities of the cash equivalents, the carrying amount is equal to the fair value of these assets. In order to qualify as a cash equivalent, the original maturity of the instrument must be 90 days or less.
175
150
125
100
75
50
25
Net cashin CHF million
20202019201820172016

84 SFS Group AG | Annual report 2020 | Consolidated financial statements SFS Group
4.2 Financial assets2020 2019
Loans to third parties 1.8 1.1Financial assets from associates/joint ventures 13.0 22.0
Assets from employer contribution reserves 20.6 20.3
Economic benefit from pension plans 3.7 3.3Other financial assets 1.2 0.7
Total 40.3 47.4
Marketable securities and financial assets are measured at market value through profit or loss. In absence of a market value, marketable securities and financial assets are measured at historical costs less any impairment.
4.3 Borrowings2020 2019
CHF million Interest CHF million InterestBank borrowings 1.8 1.9% 9.8 4.0%
Current borrowings 1.8 1.9% 9.8 4.0%Of which EUR 1.6 1.9% 5.4 1.9%Of which other currencies 0.2 2.6% 4.4 6.5%
Bank borrowings 41.2 0.7% 51.8 1.0%Non-current borrowings against third parties 0.5 0.3% 0.4 0.5%
Non-current borrowings 41.7 0.7% 52.2 1.0%
Of which CHF 35.0 0.4% 35.0 0.4%Of which EUR 6.6 2.0% 7.5 2.2%
Of which USD – – 9.7 2.2%Of which other currencies 0.1 2.5% – –
Total borrowings 43.5 0.7% 62.0 1.5%

85 SFS Group AG | Annual report 2020 | Consolidated financial statements SFS Group
The financial liabilities have the following maturities:
Cash-outflowsTotal 2020
In 3months
In 4–12months
In 13–24months Later
Borrowings 43.5 0.4 1.4 36.3 5.4
Interest payments 0.6 0.1 0.1 0.3 0.1
Total 31.12.2020 44.1 0.5 1.5 36.6 5.5
Total 2019
in 3months
in 4–12months
in 13–24months Later
Borrowings 62.0 5.0 4.8 46.4 5.8
Interest payments 1.3 0.2 0.5 0.3 0.3
Total 31.12.2019 63.3 5.2 5.3 46.7 6.1
Syndicated loanA loan contract was negotiated with five banks in August 2014. In October 2019, the contract was extended prematurely. In 2020, the SFS Group has exercised the extention option to prolong the maturity date of the loan by one year. The new contract term is for five years and ends on 18 October 2025. SFS can extend this maturity by one more year in 2021. The committed and uncollateralized revolving credit line amounts to CHF 150 million and is used up to 23.3% (PY 30.0%) at the end of 2020. It may be increased by a maximum amount of an additional CHF 150 million, provided the lenders agree to the request of the SFS Group. This option may be exercised until three months prior to the final maturity.
The syndicated loan includes normal commercial terms and conditions. The variable interest yield is linked to the financial key ratio «leverage ratio». The smaller this key ratio, the lower the interest margin. The financial covenant has been met in all subsequent periods:
Threshold
Leverage Ratio: Net senior debt/EBITDA maximum 2.50×

86 SFS Group AG | Annual report 2020 | Consolidated financial statements SFS Group
4.4 Leasing
Finance leases are capitalized at the start of the lease at the lower of the fair value of the leased asset and the present value of the minimum lease payments. They are amortized over the period of the lease. The related leasing obligations are recog-nized as liabilities. In the reporting period as well as in the previous year, no material finance leases existed.
Lease payments from operating leases are recognized through profit or loss during the period of the lease. If a contract is terminated early, a provision is made for the full amount owed less income realized from subleasing. Future aggregate minimum lease payments 2020 2019
No later than 1 year 13.6 12.9Later than 1 year and no later than 5 years 26.9 24.0Later than 5 years 8.1 5.0
Total 48.6 41.9
4.5 Off-balance sheet transactions
2020 2019
Debt guarantees 1.2 1.2Guarantee obligations 13.2 11.1Other commitments 2.0 2.2
Contingent liabilities are mainly due to potential warranty claims, guarantee obligations and liens in favor of third parties. Intercompany items are eliminated. Contingent liabilities are assessed on the basis of the likelihood and the amount of the potential future liabilities and are disclosed above.

87 SFS Group AG | Annual report 2020 | Consolidated financial statements SFS Group
4.6 Equity and earnings per SFS share
In the years 2016 to 2017, net income was negatively impacted by the amortization of intangible assets resulting from customer relations Unisteel. Excluding these effects, the payout ratio would have amounted to 37.5% in 2016 and 36.9% in 2017.
The payout for the financial year 2020 of CHF 1.80 (PY 1.80) per registered share, amounting to a total of CHF 67.5 million (PY 67.5), will be proposed at the Annual General Meeting of SFS Group AG on 22 April 2021. A payout from retained ear-nings will be realized and accounted in the books after the approval of the Annual General Meeting.
2020 2019
Weighted average number of shares 37,500,000 37,500,000Net income attributable to owners of SFS Group AG 183.9 205.3
Earnings per share (in CHF) basic and diluted 4.90 5.47
As of 31 December 2020, 37,500,000 (PY 37,500,000) registered shares at CHF 0.10 are issued and outstanding. The ear-nings per share are the result of dividing net income entitled to the owners of SFS Group by the weighted average number of shares in issue and outstanding during the year. There are no dilutive effects. There is no authorized or conditional capi-tal as of the balance sheet date (PY none). Statutory and legal reserves that may not be distributed amount to CHF 54.0 million (PY 56.1) as of 31 December 2020.
Share capital and treasury sharesThe share capital of SFS Group AG constitutes the share capital of the SFS Group. The consideration paid for treasury sha-res is deducted from the equity and separately disclosed (if any). The profit or loss realized by sales of treasury shares is re-cognized as a reduction of capital reserves, net of any related income taxes. SFS Group holds no treasury shares (PY none).
70
60
50
40
30
20
10
120
100
80
60
40
20
Earnings per share in CHF
Payout in % in CHF million
5.5
4.5
3.5
2.5
1.5
0.5
Earnings per share Payout in %Payout per share in CHF Payout in CHF million
2020201920182017201620202019201820172016

88 SFS Group AG | Annual report 2020 | Consolidated financial statements SFS Group
4.7 Derivative financial instruments
Forward foreign exchange contracts2020
Contract value Market valueCHFCHF EUR USD CNY
EUR sale/CHF purchase 62.7 –58.5 – – –0.5CHF sale/EUR purchase (FX-Swap) –7.6 7.0 – – 0.0USD sale/CNY purchase – – –56.7 381.7 1.3
2019
EUR sale/CHF purchase 55.9 –50.7 – – 0.9CHF sale/EUR purchase (FX-Swap) –22.9 21.0 – – –0.1
CHF sale/USD purchase (FX-Swap) –6.9 – 7.0 – –0.1USD sale/CNY purchase – – –35.9 250.6 –0.1
The SFS Group uses derivative financial instruments to reduce the risks from interest and foreign currency fluctuations on business and financial transactions. To hedge foreign currency exposures, usually cash flow hedges are used. To reduce volatility in the income statement, changes in the fair value of derivatives are recognized in equity. Amounts accumulated in equity are reclassified to the income statement in the periods when the hedged item affects the income statement or the future cash flow is no longer expected to occur. Derivatives are held in 2020 and 2019 exclusively for the purpose of currency hedging.
4.8 Exchange rates
UnitBalance sheet Income statement
2020 2019 2020 2019China CNY 100 13.465 13.879 13.590 14.233EU EUR 1 1.080 1.085 1.071 1.114
United Kingdom GBP 1 1.202 1.276 1.206 1.268
Singapore SGD 1 0.666 0.718 0.681 0.729USA USD 1 0.880 0.966 0.936 0.993

89 SFS Group AG | Annual report 2020 | Consolidated financial statements SFS Group
5 Group structure
This chapter provides an overview of the Group structure. Changes and related detailed information are explained. Trans-actions with related parties are also disclosed.
5.1 Changes in scope of consolidation
Acquisition of subsidiaries 2020 2019
Cash and cash equivalents 1.8 1.2Trade receivables 7.4 7.1
Inventories 9.3 12.1
Other current assets 0.4 0.8
Property, plant, equipment and software 18.5 1.6
Other non-current assets 3.8 6.3
Current liabilities –4.7 –3.5Non-current liabilities -6.1 –2.7
Acquired net assets 30.4 22.8
Purchase non-controlling interests 0.0 1.9Goodwill offset against equity 30.9 71.9
Purchase price incl. acquisition cost 61.3 96.6
Cash and cash equivalents –1.8 –1.2
Consideration in cash flow statement 59.5 95.4
2020The SFS Group acquired 100% of MBE Moderne Befestigungselemente GmbH (MBE) as of 1 January 2020. The company is a leading supplier of painted fasteners for high-performance facade systems. MBE is based in Menden (Germany) and achieved in 2019 with 75 employees a turnover of EUR 10 million. The company is part of the Segment Fastening Sys-tems.
As of 1 April 2020, the SFS Group acquired 100% of Truelove & Maclean, Inc (T&M). The company is based in Connecticut (US). In 2019 T&M achieved with 110 employees a turnover of USD 36 million. It has profound expertise in the deep draw-ing technology and mainly serves customers in the automotive industry in North America. T&M is reported in Segment En-gineered Components.
In April 2020, the SFS Group increased its share in Tegra Medical from 98.8% to 100%.
In September 2020, the entity Solheimsveien 44 AS was sold. As a result, book gains of CHF 2.1 million were realized. The book gains are related to the valuation of the premises and are reported in the other operating income.
2019With effect of 1 April 2019, the SFS Group acquired 100% of Triangle Fastener Corporation. The company is domiciled in Pittsburth (US) and is reported in the segment Fastening Systems. In 2018, Triangle Fastener Corporation achieved a turno-ver of USD 70 million with 200 employees.
The purchase of non-controlling interests relates to the increase of the stake in Indo Schöttle Auto Parts Pvt. Ltd (India). Additional shares were acquired for CHF 3.8 million. Thereof, CHF 1.9 million represent the goodwill paid.

90 SFS Group AG | Annual report 2020 | Consolidated financial statements SFS Group
5.2 Group companies
Subsidiaries
CountryRegisteredoffice Name of the company
Shareholding in %Share capital in
local currency2020 2019 (1,000) Activities
China Nansha-Guangzhou
SFS intec (China) Advanced PrecisionParts Manufacturing Co., Ltd
100.0 100.0 CNY 93,959 V, P
Nantong Unisteel Technology (China) Co., Ltd 100.0 100.0 CNY 466,739 V, PShanghai Unisteel Fastening Systems
(Shanghai) Co., Ltd100.0 100.0 CNY 100,688 L
SFS Group (Shanghai) Co., Ltd. 100.0 – CNY 14,263 DL
Suzhou Unisteel Precision (Suzhou) Co., Ltd 100.0 100.0 CNY 82,674 L
Costa Rica La AuroraHeredia
Tegra Medical Costa Rica S.A. 100.0 98.8 USD 0 V, P
Germany Menden MBE Moderne Befestigungselemente GmbH
100.0 – EUR 300 V, P
Mörfelden-Walldorf
GESIPA Blindniettechnik GmbH 100.0 100.0 EUR 5,000 V, P
Oberursel SFS intec GmbH 100.0 100.0 EUR 5,000 V, P
SFS intec Beteiligungen GmbH & Co. KG 99.0 99.0 EUR 4,000 H
Schramberg Ludwig Hettich Holding GmbH & Co. KG 51.0 51.0 EUR 2,500 H
Ludwig Hettich Verwaltungs-GmbH 51.0 51.0 EUR 26 H
HECO Schrauben GmbH & Co. KG 51.0 51.0 EUR 1,230 V, P
Estonia Tallinn SFS intec Oy Eesti Filiaal 100.0 100.0 EUR n/a V
Finland Nummela SFS intec Oy 100.0 100.0 EUR 84 V
France Valence SFS Group SAS 100.0 100.0 EUR 3,078 V, P
Sain-Projet HECO France Sarl 51.0 51.0 EUR 8 V
United Kingdom Leeds SFS Group Fastening Technology Ltd 100.0 100.0 GBP 2,000 V, P
India Pune Indo Schöttle Auto Parts Pvt. Ltd 99.7 99.7 INR 46,654 V, P
Italy Pordenone SFS intec S.r.l. unipersonale 100.0 100.0 EUR 10,000 V, P
Canada Dundas SFS intec Inc. 100.0 100.0 CAD 4,000 V, P
Malaysia Johor Bahru Unisteel Technology (M) Sdn Bhd 100.0 100.0 USD 1,372 V, P
Labuan Unisteel Technology International Ltd 100.0 100.0 USD 379,850 L
Mauritius – Unisteel International Pte Ltd 100.0 100.0 USD 1 L
Mexico Monterrey SFS Group Fastening Technology 100.0 100.0 MXN 50 VMexico S.A.
Netherlands Helmond Guardian B.V. 100.0 100.0 EUR 18 V, P
Norway Frogner SFS intec AS 100.0 100.0 NOK 2,030 V
Lorenskog Solheimsveien 44 AS – 100.0 NOK 470 –
Austria Korneuburg SFS Group Austria GmbH 100.0 100.0 EUR 146 V, P
Poland Poznan SFS Group Sp. z o.o. 100.0 100.0 PLN 11,937 V
Portugal Malveira SFS Group Fastening Technology 100.0 100.0 EUR n/a V(Iberica), S.A.U. Sucursal em Portugal
Romania Campia Turzii HECO Schrauben S.r.l. 51.0 51.0 RON 12,737 P
Sweden Strängnäs SFS intec AB 100.0 100.0 SEK 200 V, P

91 SFS Group AG | Annual report 2020 | Consolidated financial statements SFS Group
CountryRegisteredoffice Name of the company
Shareholding in %Share capital in
local currency2020 2019 (1,000) Activities
Switzerland Heerbrugg SFS intec Holding AG 100.0 100.0 CHF 5,400 H
municipality SFS intec AG 100.0 100.0 CHF 6,550 V, P
of Au/SG and SFS unimarket AG 100.0 100.0 CHF 12,550 V, PWidnau SFS services AG 100.0 100.0 CHF 100 DL
Emmenbrücke Allchemet AG 100.0 100.0 CHF 340 Vmunicipalityof Emmen
Hallau Stamm AG 100.0 100.0 CHF 500 V, P
Singapore Singapur Unisteel Technology Limited 100.0 100.0 SGD 8,033 V
Spain Sondika- SFS Group Fastening Technology 100.0 100.0 EUR 975 VBizkaia (Iberica), S.A.U.
Taiwan Kaohsiung Unisteel Technology Limited Taiwan 100.0 100.0 NTD n/a DLBranch
Czech Republic Turnov SFS Group CZ s.r.o. 100.0 100.0 CZK 205,000 V, P
Turkey Torbali-Izmir SFS intec Baglanti Teknolojileri 95.1 95.1 TRY 23,109 V, PSanayi ve Ticaret A.S.
SFS Group Pazarlama A.S. 95.1 – TRY 100 V
Hungary Janossomorja SFS Group Hungary Kft. 100.0 100.0 HUF 412,500 V, P
USA Wyomissing, SFS Group USA, Inc. 100.0 100.0 USD 37,750 V, PPA SFS Acquisition Holding, Inc. 100.0 98.8 USD 140,000 H
Franklin, MA Tegra-CTW Holdings, LLC – 98.8 USD – –
Tegra Medical, LLC 100.0 98.8 USD 23,465 V, P
Tegra Medical CR, LLC 100.0 98.8 USD 0 H
Hernando, MS Tegra Medical (MS), LLC – 98.8 USD – –
Pittsburgh, PA Triangle Fastener Corporation 100.0 100.0 USD 1 V
Connecticut Truelove & Maclean, Inc. 100.0 – USD 1 V, P
DL = Services, P = Production, V = Sales, H = Holding, L = in Liquidation
The closing date of all companies is 31 December.
2020At the beginning of 2020, the companies Tegra-CTW Holdings, LLC and Tegra Medical (MS), LLC were merged into Tegra Medical, LLC.
In early summer 2020, SFS Group (Shanghai) Co. Ltd in Shanghai established a regional headquarter. This entity provi-des local services for the divisions in the area.
The entity Solheimsveien 44 AS was sold in September 2020.
2019In 2019, the companies QBM Distributors Ltd, Ncase Ltd and Nvelope Rainscreen Systems Ltd were merged into SFS Group Fastening Technology Ltd.
SFS intec AS (Norway) carved out the operating premises into an independent entity (Solheimsveien 44 AS).
SFS intec Baglanti Teknolojileri Sanayi ve Ticaret A.S. (Turkey) increased its share capital. As the minority shareholder did not participate, SFS Group increased its shareholding.

92 SFS Group AG | Annual report 2020 | Consolidated financial statements SFS Group
Joint ventures
CountryRegisteredoffice Name of the company
Shareholding in % Share capital in local currencyActivities2020 2019 (1,000)
China Tianjin Sunil SFS intec Automoti-ve Parts (Tianjin) Co., Ltd
50.0 50.0 CNY 212,483 V, P
5.3 Transactions with related parties
Transaction with related parties are generally conducted based on usual market conditions.
Business relationships with related partiesBusiness transactions with members of the Board of Directors and of the Group Executive Board as well as related companies are summarized in the table below:
2020 2019
Sales of goods and services 2.8 3.1Purchases of goods and services 0.6 0.6Receivables 0.3 0.3
The sale of goods and services mainly includes IT & finance services to companies owned by the founding families.
Business relationship with Pension FundsSFS Group charges CHF 0.6 million (PY 0.6) in connection with the administration of the SFS Pension Fund and the Patron-age fund.
Business relationship with associates and joint ventures2020 2019
Sales of goods and services 1.5 1.7Receivables 1.0 0.5
Loans – 9.2Bank guarantees 13.2 12.5
6 Events after the balance sheet date
SFS is not aware of events that occured after the balance sheet date that could have a material impact on the consolidated statements for the financial year ended 31 December 2020.
The consolidated financial statements of the SFS Group were approved by the Audit Committee and the Board of Directors on 4 March 2021 and are subject to final approval at the Annual General Meeting of shareholders, which will take place on 22 April 2021.
93 SFS Group AG | Annual report 2020 | Auditor's report on the consolidated financial statements SFS Group
Report of the statutory auditor to the General Meeting of SFS Group AG
Heerbrugg, municipality of Widnau, SG
Report on the audit of the consolidated financial statements
Opinion We have audited the consolidated f inancial statements of SFS Group AG and its subsidiaries (the Group), w hich comprise the con-solidated income statement, consolidated balance sheet as at 31 December 2020, consolidated statement of changes in equity and consolidated cash f low statement for the year then ended, and notes to the consolidated f inancial statements, including a summar y of signif icant accounting policies.
In our opinion, the consolidated f inancial statements (pages 57 to 92) give a true and fair view of the consolidated f inancial position of the Group as at 31 December 2020 and its consolidated f inancial performance and its consolidated cash f lows for the year then ended in accordance with Swiss GAAP FER and comply w ith Sw iss law.
Basis for opinion We conducted our audit in accordance with Swiss law and Swiss Auditing Standards. Our responsibilities under those provisions and standards are further described in the “Auditor’s responsibilities for the audit of the consolidated f inancial statements ” section of our report.
We are independent of the Group in accordance with the provisions of Swiss law and the requirements of the Sw iss audit profes-sion and w e have fulf illed our other ethical responsibilities in accordance with these requirements. We believ e that the audit evi-dence w e have obtained is suff icient and appropriate to provide a basis for our opinion.

94
Our audit approach
Overview Overall Group materiality: CHF 11,000,000
We concluded full scope audit w ork at thirteen Group companies in seven countries. We further, concluded a review at a Group company and specif ied procedures at a further Group company.
Our activities addressed 74% of the net sales and 75% of the assets of the Group.
As key audit matter the follow ing area of focus has been identif ied:
Valuation of inventories
Materiality The scope of our audit w as influenced by our application of materiality. Our audit opinion aims to provide reasonable assurance that the consolidated f inancial statements are free from material misstatement. Misstatements may arise due to fraud or error. They are considered material if , individually or in aggregate, they could reasonably be expected to influence the economic decisions of users taken on the basis of the consolidated f inancial statements.
Based on our professional judgement, w e determined certain quantitative thresholds for materiality, including the overall Group materiality for the consolidated f inancial statements as a w hole as set out in the table below . These, together with qualitative consid-erations, helped us to determine the scope of our audit and the nature, timing and extent of our audit procedures and to evaluate the effect of misstatements, both individually and in aggregate, on the consolidated f inancial statements as a w hole.
SFS Group AG | Annual report 2020 | Auditor's report on the consolidated financial statements SFS Group

95
Overall Group materiality CHF 11'000'000
How we determined it 5% of profit before tax
Rationale for the materiality benchmark applied
We chose profit before tax as the benchmark because, in our view , it is the bench-mark against w hich the performance of the Group is most commonly measured, and it is a generally accepted benchmark.
Audit scope We tailored the scope of our audit in order to perform sufficient work to enable us to provide an opinion on the consolidated f inancial statements as a w hole, taking into account the structure of the Group, the accounting processes and controls, and the industr y in w hich the Group operates.
We designed the scope of our audit in order to cover the signif icant subsidiaries with a full scope audit or review. For the other com-panies, w e relied on the results of the completed statutory audits and on analyses of signif icant changes. In particular, for these companies w e checked the reconciliation of the statutory f inancial statements to Sw iss GAAP FER. Where audits w ere performed by component auditors, w e ensured that, as Group auditor, w e were adequately involved in the audit in order to assess whether suff icient appropriate audit evidence was obtained from the w ork of the component auditors to provide a basis for our opinion. Our involvement included, for example, telephone conferences during the audit planning stage and after completion of the local audits.
Report on key audit matters based on the circular 1/2015 of the Fe deral Audit Oversight Authority Key audit matters are those matters that, in our professional judgement, w ere of most signif icance in our audit of the consolidated f inancial statements of the current period. These matters w ere addressed in the context of our audit of the consolidated f inancial statements as a w hole, and in forming our opinion thereon, and w e do not provide a separate opinion on these matters.
SFS Group AG | Annual report 2020 | Auditor's report on the consolidated financial statements SFS Group

96
Valuation of inventories
Key audit matter How our audit addressed the key audit matter
Inventories as at 31 December 2020 amount to CHF 320.1 million. This represents 19.0% of total assets.
We consider the valuation of inventories a key audit matter. In particular, the follow ing risks exist in connection with the valuation of inventories:
• Inventories are not stated at the low er of aver-age acquisition or production cost and net realizable value.
• Write-downs for obsolescent inventory or stock that exceeds the usual sales volume (e.g. slow moving or excess inventory) are inadequate.
Further details regarding inventories can be found in note 3.3.
We performed the follow ing audit procedures:
• Sample-based testing of w hether inventories were stated at acquisition or production costs in accordance with Swiss GAAP FER. We com-pared the acquisition costs used for the valuation of raw materials, supplies and consumables, and purchased finished goods with the latest purchase prices or other evidence. We tested the additional costs included in the production costs of semi-f inished and f inished goods, in partic-ular using overhead recovery variance analysis or alternative methods.
• Sample-based testing of w hether the low er of acquisition or production cost and net realizable value has been applied.
• Sample-based testing of the mathematical correctness and appropriateness of Management’s calculation of w rite-downs of obsolescent inventory.
The results of our audit support Management's valuation of the inventories as at 31 December 2020.
SFS Group AG | Annual report 2020 | Auditor's report on the consolidated financial statements SFS Group

97
Responsibilities of the Board of Directors for the consolidated financial statements The Board of Directors is responsible for the preparation of the consolidated f inancial statements that give a true and fair view in accordance with Swiss GAAP FER and the provisions of Swiss law, and for such internal control as the Board of Directors deter-mines is necessary to enable the preparation of consolidated f inancial statements that are free from material misstatement, w hether due to fraud or error.
In preparing the consolidated f inancial statements, the Board of Directors is responsible for assessing the Group’s ability to continue as a going concern, disclosing, as applicable, matters related to going concern and using the going concern basis of accounting unless the Board of Directors either intends to liquidate the Group or to cease operations, or has no realistic alternative but to do so.
Auditor’s responsibilities for the audit of the consolidated financial statements Our objectives are to obtain reasonable assurance about w hether the consolidated f inancial statements as a w hole are free from material misstatement, w hether due to fraud or error, and to issue an auditor’s report that includes our opinion. Reasonable assur-ance is a high level of assurance, but is not a guarantee that an audit conducted in accordance with Swiss law and Swiss Auditing Standards w ill alw ays detect a material misstatement w hen it exists. Misstatements can arise from fraud or error and are cons idered material if , individually or in the aggregate, they could reasonably be expected to influence the economic decisions of users taken on the basis of these consolidated f inancial statements.
A further description of our responsibilities for the audit of the consolidated f inancial statements is located at the w ebsite of EXPERTsuisse: http://expertsuisse.ch/en/audit-report-for-public-companies. This description forms part of our auditor’s report.
Report on other legal and regulatory requirements
In accordance with article 728a paragraph 1 item 3 CO and Sw iss Auditing Standard 890, w e confirm that an internal control system exists w hich has been designed for the preparation of consolidated f inancial statements according to the instructions of the Board of Directors.
We recommend that the consolidated f inancial statements submitted to you be approved.
Pricew aterhouseCoopers AG
Thomas Illi Gianluca Galasso
Audit expert Auditor in charge
Audit expert
St. Gallen, 4 March 2021
SFS Group AG | Annual report 2020 | Auditor's report on the consolidated financial statements SFS Group
98 SFS Group AG | Annual report 2020 | Consolidated financial statements SFS Group

99 SFS Group AG | Annual report 2020 | Financial statements SFS Group AG
Financial statements SFS Group AG
Balance sheet 100
Income statement 101
Notes 102
Proposed appropriationof retained earnings 104
Auditor’s report 105

100 SFS Group AG | Annual report 2020 | Financial statements SFS Group AG
Balance sheet
Assets in CHF million 31.12.2020 31.12.2019
Cash and cash equivalents 14.2 12.5Other current receivables from Group companies 12.0 16.2
Current assets 26.2 28.7
Financial assets from Group companies 868.5 845.0Shareholdings 90.8 90.8
Non-current assets 959.3 935.8
Assets 985.5 964.5
Liabilities and equity in CHF million
Interest-bearing borrowings from Group companies 26.1 28.6Deferred income and accrued expenses 1.0 0.7
Current liabilities 27.1 29.3
Interest-bearing borrowings 35.0 35.0Interest-bearing borrowings from Group companies 39.3 36.2
Non-current liabilities 74.3 71.2
Share capital 3.8 3.8
Statutory capital reserves 11.5 11.5
Statutory retained earnings 1.9 1.9
Voluntary retained earnings 275.1 275.1Retained earnings 591.8 571.7
Total equity 884.1 864.0
Liabilities and equity 985.5 964.5

101 SFS Group AG | Annual report 2020 | Financial statements SFS Group AG
Income statement
Income in CHF million 2020 2019
Investment income 82.5 77.5Interest income 6.5 6.2
Total income 89.0 83.7
Expenses in CHF million
Interest expense –0.5 –0.7Administration expenses 0.1 –0.4
Total expenses –0.4 –1.1
Net income before taxes 88.6 82.6
Direct taxes –1.0 –0.5
Net income 87.6 82.1
Notes
1 Accounting policiesThe present financial statements have been prepared in accordance with the regulations on commercial accounting and reporting given in the Swiss Code of Obligations. Securities (marketable securities with a stock exchange price) are re-cognized at fair value. All other assets are stated at historical cost less necessary depreciation.
2 Number of employeesThe company does not have any employees.
3 ShareholdingsThe SFS Group AG is incorporated and domiciled in Heerbrugg, municipality of Widnau/SG, Switzerland and held the following shareholdings:
2020 2019Share capital Shareholding1 Share capital Shareholding1
SFS intec Holding AG, Heerbrugg, municipality of Widnau, Switzerland 5.4 100% 5.4 100%SFS unimarket AG, Heerbrugg, municipality of Widnau, Switzerland 12.6 100% 12.6 100%SFS services AG, Heerbrugg, municipality of Widnau, Switzerland 0.1 100% 0.1 100%1Each share represents one voting right
The significant indirect shareholdings are disclosed in note 5.2 of the consolidated financial report.
102 SFS Group AG | Annual report 2020 | Financial statements SFS Group AG
4 Share capitalThe share capital is as in the previous year divided into 37,500,000 registered shares each with a par value of CHF 0.10. Noconversion and option rights have been issued.
5 Significant shareholdersThe founding families of SFS Group AG, Huber and Stadler/Tschan, form an organized group according to art. 12 of the Ordinance of the Swiss Financial Supervisory Authority on financial market infrastrustructures and market behavior in securities and derivatives trading.
Share capital and voting rights 31.12.2020 31.12.2019
Founding families 54.9% 54.8%
Both families have defined their principles of cooperation and partnership in a pool agreement. It is their intention to retain a majority of more than 50% of the capital and the voting rights in the long run. They agree with each other on important decisions and always put the successful development of the SFS Group before the particular interests of the families.
The Board of Directors is not aware of any other shareholders or shareholder groups listed in the share register holding more than 5% of the share capital or voting rights.
6 Board of Directors' and Group Executive Board's shareholdings
The following tables provide information with regard to the shareholdings of the Board members:
Board of Directors
Number of shares
31.12.2020
Number of shares
31.12.2019
Heinrich Spoerry, Chairman, independent, external member 201,260 199,460Nick Huber, external member 114,652 114,152
Urs Kaufmann, independent, external member 10,260 9,760
Thomas Oetterli, independent, external member 8,260 7,760
Bettina Stadler, external member 392,400 391,900Jörg Walther, independent, external member 5,140 4,640
Total 731,972 727,672
Shares, granted during the reporting period, are disclosed in the compensation report.

103 SFS Group AG | Annual report 2020 | Financial statements SFS Group AG
Group Executive Board
Numberof shares
31.12.2020
Numberof shares
31.12.2019
Arthur Blank, Head of Division Construction 13,705 15,580Jens Breu, Chief Executive Officer 25,810 15,310
Volker Dostmann, since 1 November 2020, CFO as per AGM 2021 – n/a
Rolf Frei, Chief Financial Officer 50,610 49,710
J. Mark King, Head of Division Medical until 1 August 2020 n/a 1,400
Walter Kobler, Head of Division Industrial, Head of Division Medical since 1 January 2021 21,625 22,000
Urs Langenauer, Head of Division Riveting 3,256 3,100
George Poh, Head of Division Electronics 46,724 55,661
Iso Raunjak, Head of Segment Distribution & Logistics since 1 January 2020 60 n/a
Alfred Schneider, Head of Division Automotive 17,985 17,360
Claude Stadler, Head of Corporate Services 391,580 391,080Josef Zünd, Head of Segment Distribution & Logistics until 31 December 2019 n/a 7,391
Total 571,355 578,592
Shares, granted during the reporting period, are disclosed in the compensation report.
7 Statutory capital reserves
The disclosed statutory capital reserves amount to CHF 11,549,250 (PY 11,549,250) and result from the share premiums inconnection with the share capital increase and the initial public offering. Statutory capital reserves of CHF 311,994,597.50 have been approved by the Federal Tax Administration (FTA) on 12 June 2015. The FTA did not accept the IPO and capital expenses of CHF 11,179,652.50 as statutory capital reserves. In this context, the SFS Group AG is still of the opinion that the share premium before deduction of the IPO and capital expenses qualify to the full extent as statutory capital reserves.
8 Contingent liabilities
Apart from the warranty obligations there are no contingent liabilities.
Contingent liabilities 31.12.2020 31.12.2019
Warranty obligations to Group companies 227.9 209.7Warranty obligations to third parties 13.2 11.1Of which used 45.5 55.1

104 SFS Group AG | Annual report 2020 | Financial statements SFS Group AG
Proposed appropriation of retained earnings
The Board of Directors proposes to the Annual General Meeting of shareholders to payout a total of CHF 1.80 (PY 1.80) perregistered share with a nominal of CHF 0.10 per share.
Proposed appropriation of retained earningsPayment from retained earnings CHF 1.80 (PY 1.80) per registered share with a nominal of CHF 0.10 per share.
Decision AGM Retained earnings in CHF million 31.12.2020 31.12.2019
Profit carry forward 504.2 489.6Net income 87.6 82.1
Earnings available for distribution 591.8 571.7
Payout from retained earnings –67.5 –67.5
Carryforward to retained earnings 524.3 504.2
Due to the presentation in millions, rounding differences may arise for the value «Carry forward to retained earnings».
Proposed appropriation of statutory capital reservesBalance to be carried forward (PY same).
Statutory capital reserves in CHF million 31.12.2020 31.12.2019
Carryforward 11.5 11.5
Payout from statutory capital reserves – –
Carryforward to statutory capital reserves 11.5 11.5

105 SFS Group AG | Annual report 2020 | Auditor's report on the financial statements SFS Group AG
Report of the statutory auditor to the General Meeting of SFS Group AG
Heerbrugg, municipality of Widnau, SG
Report on the audit of the financial statements
Opinion We have audited the f inancial statements of SFS Group AG, w hich comprise the balance sheet as at 31 December 2020, income statement and notes for the year then ended, including a summary of signif icant accounting policies.
In our opinion, the f inancial statements (pages 100 to 104) as at 31 December 2020 comply w ith Sw iss law and the company’s arti-cles of incorporation.
Basis for opinion We conducted our audit in accordance with Swiss law and Swiss Auditing Standards. Our responsibilities under those provisions and standards are further described in the “Auditor’s responsibilities for the audit of the f inancial statements” section of our report.
We are independent of the entity in accordance with the provisions of Swiss law and the requirements of the Sw iss audit profession and w e have fulfilled our other ethical responsibilities in accordance with these requirements. We believe that the audit evidence we have obtained is suff icient and appropriate to provide a basis for our opinion.
Our audit approach
Materiality The scope of our audit w as influenced by our application of materiality. Our audit opinion aims to provide reasonable assurance that the f inancial statements are free from material misstatement. Misstatements may arise due to fraud or error. They are considered material if , individually or in aggregate, they could reasonably be expected to influence the economic decisions of users taken on the basis of the f inancial statements.
Based on our professional judgement, w e determined certain quantitative thresholds for materiality, including the overall materiality for the f inancial statements as a w hole as set out in the table below . These, together with qualitative considerations, helped us to determine the scope of our audit and the nature, timing and extent of our audit procedures and to evaluate the effect of miss tate-ments, both individually and in aggregate, on the f inancial statements as a w hole.

106
Overall materiality CHF 4,400,000
How we determined it 0.5% of total equity
Rationale for the materiality benchmark applied
We chose total equity as the benchmark because, in our view , it is an appropriate benchmark for materiality considerations relating to a holding company.
Audit scope We designed our audit by determining materiality and assessing the risks of material misstatement in the f inancial statements. In particular, w e considered where subjective judgements w ere made; for example, in respect of signif icant accounting estimates that involved making assumptions and considering future events that are inherently uncertain. As in all of our audits, w e also addressed the risk of management override of internal controls, including among other matters consideration of w hether there was evidence of bias that represented a risk of material misstatement due to fraud.
Report on key audit matters based on the circular 1/2015 of the Federal Audit Oversight Authority We have determined that there are no key audit matters to communicate in our report.
Responsibilities of the Board of Directors for the financial statements The Board of Directors is responsible for the preparation of the f inancial statements in accordance with the provisions of Swiss law and the company’s articles of incorporation, and for such internal control as the Board of Directors determines is necessary to ena-ble the preparation of f inancial statements that are free from material misstatement, w hether due to fraud or error.
In preparing the f inancial statements, the Board of Directors is responsible for assessing the entity’s ability to continue as a going concern, disclosing, as applicable, matters related to going concern and using the going concern basis of accounting unless the Board of Directors either intends to liquidate the entity or to cease operations, or has no realistic alternative but to do s o.
SFS Group AG | Annual report 2020 | Auditor's report on the financial statements SFS Group AG

107
Auditor’s responsibilities for the audit of the financial statements Our objectives are to obtain reasonable assurance about w hether the f inancial statements as a w hole are free from material mis-statement, w hether due to fraud or error, and to issue an auditor’s repor t that includes our opinion. Reasonable assurance is a high level of assurance, but is not a guarantee that an audit conducted in accordance with Swiss law and Sw iss Auditing Standards will alw ays detect a material misstatement w hen it exists. Misstatements can arise from fraud or error and are considered material if , individually or in the aggregate, they could reasonably be expected to influence the economic decisions of users taken on the basis of these f inancial statements.
A further description of our responsibilities for the audit of the f inancial statements is located at the w ebsite of EXPERTsuisse: http://expertsuisse.ch/en/audit-report-for-public-companies. This description forms part of our auditor’s report.
Report on other legal and regulatory requirements
In accordance with article 728a paragraph 1 item 3 CO and Sw iss Auditing Standard 890, w e confirm that an internal control sy stem exists w hich has been designed for the preparation of f inancial statements according to the instructions of the Board of Directors.
We further confirm that the proposed appropriation of available earnings complies w ith Sw iss law and the company’s articles o f in-corporation. We recommend that the f inancial statements submitted to you be approved.
Pricew aterhouseCoopers AG
Thomas Illi Gianluca Galasso
Audit expert Auditor in charge
Audit expert
St. Gallen, 4 March 2021
SFS Group AG | Annual report 2020 | Auditor's report on the financial statements SFS Group AG

108 SFS Group AG | Annual report 2020 | Consolidated financial statements SFS Group
Information for shareholders
Explanation regarding alternative performance measurementsIn addition to financial key figures defined by general accounting principles, SFS Group uses alternative performance mea-surements. For SFS it is of strategic importance to generate value added for all stakeholders: Customers, vendors, employ-ees, shareholders and the community. Return on investment is a highly condensed key figure to measure value added. A comprehensive corporate management requires additional operational key figures: organic sales growth, adjusted opera-ting profit (EBIT) margin and free cash flow. These key figures help to keep the organization on track and to monitor strate-gic implementations.
Return on Invested Capital (ROIC)This key figure measures the return on invested capital as a percentage. ROIC illustrates how efficiently the company›s re-sources are used. If ROIC exceeds weighted average cost of capital, SFS Group creates value added. The mid-term target is >10%. The key figure relates the adjusted operating profit after tax (EBIT adjusted after tax) to the invested capital. The invested capital is based on the equity at year end before goodwill offset, less net financial assets. A standard tax rate of 17.5% is applied.
In CHF million 2020 2019 2018 2017 2016
Equity at year end 1,278.2 1,237.2 1,204.6 1,087.0 987.8– Invested capital related to the acquisition of Tegra Medical – – – – –202.2
+ Goodwill offset against equity 1,015.6 984.7 912.8 908.6 907.1– Net cash/+ net debt –144.3 –68.7 –59.1 –34.7 –0.5
Invested capital 2,149.5 2,153.2 2,058.3 1,960.9 1,692.2
Operating profit (EBIT) adjusted 225.3 239.1 243.1 233.3 210.1
– Tax 17.5% –39.4 –41.8 –42.5 –40.8 –36.8
Operating profit (EBIT) adjusted less tax 185.9 197.3 200.6 192.5 173.3
ROIC 8.6% 9.2% 9.7% 9.8% 10.2%
Return on Capital Employed (ROCE)Like ROIC, this key figure is an indicator for the profitability in relation to capital employed. In contrast to ROIC, goodwill offsets and taxes are not taken into account. ROCE relates the adjusted operating profit (EBIT) to the average capital em-ployed. The capital employed is calculated based on the average of the last four quarters.
In CHF million 2020 2019 2018 2017 2016
Ø Net working capital 603.0 615.8 580.1 535.6 510.2– Ø Cash and cash equivalents –146.2 –147.8 –124.3 –122.8 –151.4
+ Ø Tangible and intangible assets 721.2 723.1 686.8 608.5 565.5– Ø Net deferred tax liabilities and provisions –44.1 –56.2 –71.8 –73.7 –77.6
Ø Capital employed 1,134.0 1,134.9 1,070.8 947.4 846.6
Operating profit (EBIT) adjusted 225.3 239.1 243.1 233.3 210.1
ROCE 19.9% 21.1% 22.7% 24.6% 24.8%

109 SFS Group AG | Annual report 2020 | Consolidated financial statements SFS Group
Organic sales growthAll segments, divisions and management are measured by their contribution to growth. Organic sales growth is a key figure which measures the top-line growth compared to the previous year. To increase transparency and comparability, currency impacts and changes in scope are excluded from third party sales. The result is the organic sales growth as illustrated in the Financial overview on page 4.
Adjusted operating profit (EBIT) and adjusted EBIT marginSFS uses the operating profit (EBIT) to assess the earnings situation and operational success. EBIT-margin relates the opera-ting profit to net sales and illustrates if the operating business is led successfully. The adjusted operating profit and hence ad-justed EBIT margin are calculated excluding one-off effects. This increases comparability and transparency for a performance measurement over time.
In CHF million 2020 2019 2018 2017 2016
Operating profit (EBIT) 227.4 236.3 243.1 197.7 159.8– Book gain on disposal of non-operating assets –2.1 –14.3 – –7.3 –9.5
+ Amortization of customer relationship Unisteel – – – 39.8 59.8
+ Relocation cost CN-Nantong – 17.1 – – –+/– Other one-time effects – – – 3.1 –
Operating profit (EBIT) adjusted 225.3 239.1 243.1 233.3 210.1
Net sales 1,707.1 1,782.1 1,736.9 1,634.8 1,436.7
EBIT margin adjusted 13.2% 13.4% 14.0% 14.3% 14.6%
Free Cash FlowIt is in the SFS DNA to finance capital expenditures needed for organic growth with own funds. Free cash flow is used as a key figure to determine cash generation. The key figure measures the ability to convert operational success into cash inflows. This enables to finance day-to-day operations (working capital) and necessary investments in operating assets from SFS Group's own business. Sustainable operating profitability and effective net working capital management have a great impact on free cash flow generation. To increase comparability, acquisitions of subsidiaries are not taken into account.
In CHF million 2020 2019 2018 2017 2016
Cash flow from operating activities 296.4 277.6 263.5 226.6 241.5– Purchases of
Property, plant and equipment -98.4 –114.5 –146.1 –128.8 –83.5
Intangible assets -5.7 –2.2 –3.0 –8.2 –1.1+ Proceeds from government grants – – – 4.2 –
Free Cash Flow 192.3 160.9 114.4 93.8 156.9

110 SFS Group AG | Annual report 2020 | Consolidated financial statements SFS Group
The registered shares of the SFS Group AG of CHF 0.10 each have been listed on the SIX Swiss Exchange AG since 7 May 2014. The consolidated financial statements have been prepared in accordance with Swiss GAAP FER since 2017.
31.12.2020 31.12.2019 31.12.2018 31.12.2017 31.12.2016
Number of registered shares (in 1,000) 37,500 37,500 37,500 37,500 37,500 Number of shares ranking for dividend (in 1,000) 37,500 37,500 37,500 37,500 37,500
Weighted average number of shares (in 1,000) 37,500 37,500 37,500 37,500 37,500
Number of shareholders 7,825 8,353 7,960 7,530 6,641
Stock exchange quotation (in CHF)
Year high 106.90 97.00 121.80 123.50 83.15Year low 58.85 68.60 73.80 82.55 60.45Year-end price 105.00 93.10 76.30 113.20 83.10
Share key data
Earnings per share in CHF 4.90 5.47 5.14 4.24 3.32Distribution per share in CHF 1.80 1.80 2.00 1.90 1.75
Payout ratio in % of net income 36.5 32.7 38.7 44.8 52.6Price/earnings ratio (year-end price) 21.4 17.0 14.8 26.7 25.0
Market capitalization
In CHF million 3'937.5 3,491.3 2,861.3 4,245.0 3,116.3(year-end price × number of shares ranking for dividend)
As a % of net sales 230.7 195.9 164.7 259.7 216.9As a % of equity 308.1 282.2 237.5 390.5 315.5
AgendaThursday, 22 April 2021 28th Annual General Meeting of SFS Group AGTuesday, 20 July 2021 Publication half year results 2021
Security-n. 23.922.930 ISIN CH 023 922 930 2SIX Swiss Exchange AG SFSNReuters SFSN.S Bloomberg SFSN SW Fact Set SFSN-CH

111 SFS Group AG | Annual report 2020 | Consolidated financial statements SFS Group
Annual report 2020The annual report is available in German and English.The German language version of the full annual report isthe only legally binding version and is available online at www.annualreport.sfs.com/en.
Exclusion of liabilityThis annual report includes forward looking statements.These statements reflect the SFS Group’s current asses-ment of market conditions and future events. The state-ments are therefore subject to risks, uncertainities and assumptions.
Unforseen events may lead to deviations of the actual results from the forecasts and estimates made in this presentation and in other published information. To this extent, all forward looking statements in this annual report are subject to such limitations.
ImprintPublisher SFS Group AGConcept anddesign SFS Group AGText SFS Group AGPrinting Galledia Print AG