Embed Size (px)
Citation preview

04 |
CO
NSO
LID
AT
ED F
INA
NC
IAL
STA
TEM
ENT
S


•60• Consolidated financial statements
Directors’ responsibility and approval
The directors are required in terms of the Companies Act of South Africa to maintain adequate accounting records and are responsible for the content and integrity of the consolidated and separate financial statements and related financial information included in this report. It is their responsibility to ensure that the consolidated and separate financial statements fairly present the Group’s state of affairs as at the end of the financial year and the results of their operations and cash flows for the year then ended, in conformity with International Financial Reporting Standards. The external auditors are engaged to express an independent opinion on the consolidated and separate financial statements.
The consolidated and separate financial statements are prepared in accordance with International Financial Reporting Standards and are based upon appropriate accounting policies consistently applied and supported by reasonable and prudent judgements and estimates.
The directors acknowledge that they are ultimately responsible for the system of internal financial control established by the Company and its subsidiaries and place considerable importance on maintaining a strong control environment. To enable the directors to meet these responsibilities, the Board sets standards for internal control aimed at reducing the risk of error or loss in a cost-effective manner. The standards include the proper delegation of responsibilities within a clearly defined framework, effective accounting procedures and adequate segregation of duties to ensure an acceptable level of risk. These controls are monitored throughout the Group and all employees are required to maintain the highest ethical standards in ensuring the businesses are conducted in a manner that in all reasonable circumstances is above reproach. The focus of risk management in the Group is on identifying, assessing, managing and monitoring all known forms of risk across the Group. While operating risk cannot be fully eliminated, the Group endeavours to minimise it by ensuring that appropriate infrastructure, controls, systems and ethical behaviour are applied and managed within predetermined procedures and constraints.
The directors are of the opinion, based on the information and explanations given by management, that the system of internal control provides reasonable assurance that the financial records may be relied on for the preparation of the consolidated and separate financial statements. However, any system of internal financial control can provide only reasonable, and not absolute, assurance against material misstatement or loss.
The directors have reviewed the Group’s cash flow forecast for the year to 28 February 2017 and, in light of this review and the current financial position, are satisfied that the businesses have access to adequate resources to continue in operational existence for the foreseeable future.
The external auditors are responsible for independently auditing and reporting on the consolidated and separate financial statements. The consolidated and separate financial statements have been examined by the external auditors and their report is presented on page 64.
The consolidated and separate financial statements set out on pages 67 to 124, which have been prepared on the going concern basis, were approved by the Board on 22 July 2016 and were signed on its behalf by:
CD Stein
Chairman
SD Gottschalk
Chief executive officer

Consolidated financial statements •61•
Certification by company secretary
In terms of section 88(2)(e) of the Companies Act, 71 of 2008, as amended, I certify that, to the best of my knowledge and belief, the Group has, in respect of the financial year reported upon, lodged with the Companies and Intellectual Property Commission all returns required of a public group in terms of the Act and that all such returns are true, correct and up to date.
Claire Middlemiss
On behalf of: iThemba Governance and Statutory Solutions Proprietary Limited
22 July 2016

•62• Consolidated financial statements
Audit and risk committee reportfor the year ended 29 February 2016
● ensure that the internal audit function is appropriately resourced and has an appropriate budget;
● ensure that the combined assurance model is appropriate to address all significant risks facing the Group;
● ensure that the activities allocated to internal audit in terms of the combined assurance plan are included in the scope of coverage and in the internal audit plan;
● confirm with external audit that the work performed by them will warrant reliance in terms of the combined assurance plan;
● monitor the relationship between the external and internal assurance providers and the Group;
● review both internal and external auditors’ reports;
● review fraud risk and whistle-blower arrangements and consider any complaints;
● review policies and procedures for preventing and detecting of fraud;
● establish that management is adhering to, and continually improving internal controls;
● consider information technology risks and controls, business continuity and data recovery related to IT, and information security and privacy;
● review the going concern statement and make recommendations to the Board; and
● perform any other functions as may be determined by the Board.
During the year, the committee performed the following
activities:
● considered the independence and objectivity of the external auditors and ensured that the scope of their additional services provided was not such that they could be seen to have impaired their independence;
● received and reviewed reports from both the internal and external auditors concerning the effectiveness of internal controls, systems and procedures;
● reviewed the reports of both the internal and external auditors detailing their concerns arising out of their audits and requested appropriate responses from management resulting in their concerns being addressed;
● made appropriate recommendations to the Board of directors regarding the corrective actions to be taken as a consequence of audit findings;
BACKGROUND
The audit committee has formal terms of reference which set out the committee’s Board-approved charter. The Board is satisfied that the committee has complied with these terms and its responsibilities as recommended by King III and in accordance with the Companies Act of South Africa and the JSE Listings Requirements.
MEMBERSHIP
The committee comprises three independent non-executive directors who collectively possess the knowledge and experience to fulfil the audit committee function. Membership and attendance of audit committee members are reflected on page 54 of the integrated annual report.
SCOPE AND OBJECTIVES
The scope and objectives of the committee are as follows:
● consider and nominate to the Board, the appointments and/or termination of the external auditors, including an assessment of their performance, independence and objectivity;
● determine the audit fee of the external auditors;
● consider and set mandatory term limits on the period that the lead audit partner of the external auditors may serve the Group;
● determine the nature, scope and extent of audit and any non-audit services which the external auditors may provide to the Group;
● review half-year interim results and consolidated and separate financial statements before submission to the Board;
● assess the experience and expertise of the Group’s financial director;
● undertake the prescribed functions (in terms of section 94(7) of the Companies Act of South Africa) on behalf of the Group and all subsidiary companies;
● the appointment, assessment and dismissal of the Chief audit executive;
● the approval of the internal audit plan and the staffing and objectives of the internal audit function;
● ensure that the internal audit function is subject to an independent quality review to ensure that the function remains effective and is able to discharge its duty of assisting and advising the audit and risk committee and the Board;

Consolidated financial statements •63•
● reviewed and recommended for adoption by the Board, financial information that is publicly disclosed which included:;
● reviewed results for the year ended 29 February 2016 and interim results for the six months ended 31 August 2015
● approved the internal audit plan and the staffing and objectives of the internal audit function;
● ensured that the internal audit function was appropriately resourced and had an appropriate budget;
● monitored the appropriateness of the Group’s combined assurance model;
● ensured that significant risks were adequately addressed and that suitable controls exist to mitigate and reduce those risks;
● encouraged cooperation between external and internal audit and ensured that the area of assurance overlap was such that it optimised the combined assurance obtained from these assurance providers;
● reviewed IT managers’ infrastructure, applications and governance reports; and
● reviewed the Group’s risk management processes and assessed the key risks, the likelihood and the impact thereof, and any associated mitigating controls.
The audit committee is of the opinion that the objectives of the committee were met during the year under review. Where weaknesses in specific controls had been identified, management undertook to implement appropriate corrective actions to mitigate the weakness identified.
EXTERNAL AUDIT
The committee has satisfied itself that the external auditor, Baker Tilly SVG, was independent of the Company, as set out in sections 90(2)(c) and 94(8) of the Companies Act of South Africa, which includes consideration of compliance with criteria relating to independence or conflicts of interest as prescribed by the Independent Regulatory Board for Auditors. Requisite assurance was sought and provided by the external auditor that internal governance processes within Baker Tilly SVG support and demonstrate their claim to independence.
The committee, in consultation with executive management, agreed to the engagement letter, terms, audit plan and budgeted audit fees for the financial year ended 29 February 2016.
There is a formal written policy and procedure that governs the process whereby the external auditor is considered for non-audit services. The committee approved the terms of the written policy for the provision of non-audit services by the external auditor, and approved the nature and extent of non-audit services that the external auditor may provide.
The committee has nominated for reappointment at the annual general meeting, Baker Tilly SVG as the external auditor of Value Group Limited for the financial year ending 28 February 2017. It has further satisfied itself that the audit firm is accredited to appear on the JSE list of accredited auditors.
GROUP FINANCIAL DIRECTOR
The committee has reviewed the performance, experience and expertise of the Group financial director, Mr CL Sack, and confirms his suitability to carry out his duties as financial director in terms of the JSE Listings Requirements. In addition, the committee is satisfied that the financial director is adequately supported by qualified and competent staff.
INTEGRATED ANNUAL REPORT
The audit committee has evaluated the integrated annual report encompassing the consolidated and separate financial statements for the year ended 29 February 2016 and considers that it complies, in all material respects, with the requirements of the Companies Act of South Africa and International Financial Reporting Standards. The committee therefore recommended this report for approval to the Board. The Board has subsequently approved this integrated annual report which will be open for discussion at the forthcoming annual general meeting.
IM Groves
Audit and risk committee chairman
22 July 2016

•64• Consolidated financial statements
Independent auditor’s reportfor the year ended 29 February 2016
To the shareholders of Value Group Limited
We have audited the consolidated and separate financial statements of Value Group Limited set out on pages 67 to 124, which comprise the statements of financial position at 29 February 2016, and the statements of comprehensive income, statements of changes in equity and statements of cash flows for the year then ended, and the notes, comprising a summary of significant accounting policies and other explanatory information.
DIRECTORS’ RESPONSIBILITY FOR THE CONSOLIDATED FINANCIAL STATEMENTS
The Company’s directors are responsible for the preparation and fair presentation of these consolidated and separate financial statements in accordance with International Financial Reporting Standards and the Companies Act of South Africa and for such internal control as the directors determine is necessary to enable the preparation of consolidated and separate financial statements that are free from material misstatement whether due to fraud or error.
AUDITOR’S RESPONSIBILITY
Our responsibility is to express an opinion on these consolidated and separate financial statements based on our audit. We conducted our audit in accordance with International Standards on Auditing. Those standards require that we comply with ethical requirements and plan and perform the audit to obtain reasonable assurance about whether the financial statements are free from material misstatement.
An audit involves performing procedures to obtain audit evidence about the amounts and disclosures in the financial statements. The procedures selected depend on the auditor’s judgement, including the assessment of the risks of material misstatement of the financial statements, whether due to fraud or error. In making those risk assessments, the auditor considers internal control relevant to the entity’s preparation and fair presentation of the financial statements in order to design audit procedures that are appropriate in the circumstances, but not for the purpose of expressing an opinion on the effectiveness of the entity’s internal control. An audit also includes evaluating the appropriateness of accounting policies used and the reasonableness of accounting estimates made by management, as well as evaluating the overall presentation of the financial statements.
We believe that the audit evidence we have obtained is sufficient and appropriate to provide a basis for our audit opinion.
OPINION
In our opinion, the consolidated and separate financial statements present fairly, in all material respects, the consolidated and separate financial position of Value Group Limited as at 29 February 2016, and its consolidated and separate financial performance and consolidated and separate cash flows for the year then ended in accordance with International Financial Reporting Standards, and the requirements of the Companies Act of South Africa.
OTHER REPORTS REQUIRED BY THE COMPANIES ACT
As part of our audit of the consolidated and separate financial statements for the year ended 29 February 2016, we have read the directors’ report, the audit committee’s report and the certification by company secretary for the purpose of identifying whether there are material inconsistencies between these reports and the audited consolidated and separate financial statements. These reports are the responsibility of the respective preparers. Based on reading these reports we have not identified material inconsistencies between these reports and the audited consolidated and separate financial statements. However, we have not audited these reports and accordingly do not express an opinion on these reports.
REPORT ON OTHER LEGAL AND REGULATORY REQUIREMENTS
In terms of the IRBA Rule published in Government Gazette Number 39475 dated 4 December 2015, we report that Baker Tilly SVG has been the auditor of the Value Group Limited for 19 years.
L Vroom
Partner
Registered auditor
22 July 2016
Illovo
Consolidated financial statements •65•
for the year ended 29 February 2016
Directors’ report
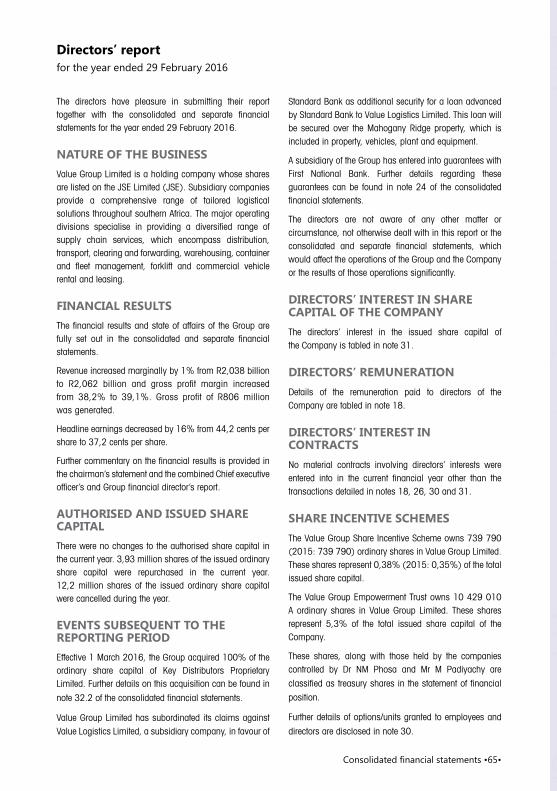
The directors have pleasure in submitting their report together with the consolidated and separate financial statements for the year ended 29 February 2016.
NATURE OF THE BUSINESS
Value Group Limited is a holding company whose shares are listed on the JSE Limited (JSE). Subsidiary companies provide a comprehensive range of tailored logistical solutions throughout southern Africa. The major operating divisions specialise in providing a diversified range of supply chain services, which encompass distribution, transport, clearing and forwarding, warehousing, container and fleet management, forklift and commercial vehicle rental and leasing.
FINANCIAL RESULTS
The financial results and state of affairs of the Group are fully set out in the consolidated and separate financial statements.
Revenue increased marginally by 1% from R2,038 billion to R2,062 billion and gross profit margin increased from 38,2% to 39,1%. Gross profit of R806 million was generated.
Headline earnings decreased by 16% from 44,2 cents per share to 37,2 cents per share.
Further commentary on the financial results is provided in the chairman’s statement and the combined Chief executive officer’s and Group financial director’s report.
AUTHORISED AND ISSUED SHARE CAPITAL
There were no changes to the authorised share capital in the current year. 3,93 million shares of the issued ordinary share capital were repurchased in the current year. 12,2 million shares of the issued ordinary share capital were cancelled during the year.
EVENTS SUBSEQUENT TO THE REPORTING PERIOD
Effective 1 March 2016, the Group acquired 100% of the ordinary share capital of Key Distributors Proprietary Limited. Further details on this acquisition can be found in
note 32.2 of the consolidated financial statements.
Value Group Limited has subordinated its claims against Value Logistics Limited, a subsidiary company, in favour of
Standard Bank as additional security for a loan advanced by Standard Bank to Value Logistics Limited. This loan will be secured over the Mahogany Ridge property, which is included in property, vehicles, plant and equipment.
A subsidiary of the Group has entered into guarantees with First National Bank. Further details regarding these guarantees can be found in note 24 of the consolidated financial statements.
The directors are not aware of any other matter or circumstance, not otherwise dealt with in this report or the consolidated and separate financial statements, which would affect the operations of the Group and the Company or the results of those operations significantly.
DIRECTORS’ INTEREST IN SHARE CAPITAL OF THE COMPANY
The directors’ interest in the issued share capital of the Company is tabled in note 31.
DIRECTORS’ REMUNERATION
Details of the remuneration paid to directors of the Company are tabled in note 18.
DIRECTORS’ INTEREST IN CONTRACTS
No material contracts involving directors’ interests were entered into in the current financial year other than the transactions detailed in notes 18, 26, 30 and 31.
SHARE INCENTIVE SCHEMES
The Value Group Share Incentive Scheme owns 739 790 (2015: 739 790) ordinary shares in Value Group Limited. These shares represent 0,38% (2015: 0,35%) of the total issued share capital.
The Value Group Empowerment Trust owns 10 429 010 A ordinary shares in Value Group Limited. These shares represent 5,3% of the total issued share capital of the Company.
These shares, along with those held by the companies controlled by Dr NM Phosa and Mr M Padiyachy are
classified as treasury shares in the statement of financial
position.
Further details of options/units granted to employees and
directors are disclosed in note 30.

•66• Consolidated financial statements
for the year ended 29 February 2016
Directors’ report
Information pertaining to the company secretary is set out on company information (IBC).
Information pertaining to the Group’s auditors, Baker Tilly SVG, is set out on company information (IBC).
INTEREST IN SUBSIDIARIES
Details of the Company’s subsidiaries are set out in note 2 of the Company’s financial statements (refer page 122). The Company’s interest in the after tax income of the subsidiaries
amounted to R55,3 million (2015: R68,3 million).
DIVIDENDS
Dividend number 17 of 12 cents per share was declared
on 13 May 2015 and paid on 6 July 2015 to shareholders
registered on 26 June 2015.
Dividend number 18 of 5 cents per share was declared on
21 October 2015 and paid on 18 January 2016 to
shareholders registered on 8 January 2016.
Dividend number 19 of 12 cents per share was declared
on 11 May 2016 and paid on 4 July 2016 to shareholders
registered on 24 June 2016.
DIRECTORATE, SECRETARY AND AUDITORS
The names of the directors in office at the date of this report
are set out on pages 38 and 39.

Consolidated financial statements •67•
ASSETSNon-current assets 1 074 448 1 052 840
Property, vehicles, plant and equipment 2 1 039 515 1 022 644 Intangible assets 3 17 415 25 261 Goodwill 4 10 670 — Loan receivable 5 1 776 1 568 Equity-accounted investees 6 313 234 Deferred tax 7 4 759 3 133
Current assets 440 268 444 246
Inventories 8 59 993 51 743 Trade and other receivables 9 276 124 262 861 Taxation in advance 2 831 2 328 Cash and cash equivalents 10 101 279 127 314 Other financial asset 16 41 —
Non-current assets held for sale 11 156 951
Total assets 1 514 872 1 498 037
EQUITY AND LIABILITIESEquity 741 251 726 094
Share capital and premium 12 10 839 10 851 Treasury shares (97 021) (134 777) Foreign currency translation reserve 371 16 Share-based payment reserve 27 184 23 891 Retained income 800 884 826 385
Equity attributable to owners of the Company 742 257 726 366 Non-controlling interests (1 006) (272)
Non-current liabilities 342 956 355 447
Interest-bearing borrowings 13 163 346 181 230 Non interest-bearing borrowings 14 1 774 — Deferred tax 7 177 836 174 217
Current liabilities 430 665 416 496
Trade and other payables 15 325 124 312 706 Other financial liability 16 — 317Current tax payable 147 1 151 Current portion of interest-bearing borrowings 13 101 144 101 973 Shareholders for dividend 448 349 Non interest-bearing borrowings 14 3 802 —
Total equity and liabilities 1 514 872 1 498 037
at 29 February 2016
Consolidated statement of financial position
R’000 Notes 2016 2015

•68• Consolidated financial statements
Consolidated statement of comprehensive income
Revenue 17 2 062 413 2 038 353 Cost of sales (1 256 458) (1 258 868)
Gross profit 805 955 779 485 Other income 13 967 11 403 Operating expenses (730 616) (682 191)
Operating profit 18 89 306 108 697 Share of profit of equity-accounted investees 79 64 Investment income 19 14 631 13 511 Finance costs 20 (30 932) (30 297)
Net profit before taxation 73 084 91 975 Taxation 21 (18 889) (23 815)
Net profit for the year 54 195 68 160 Other comprehensive income to be reclassified to profit or loss in subsequent periodsForeign currency translation differences 355 (92)
Total comprehensive income for the year 54 550 68 068
Net profit for the year attributable to:
Owners of the Company 54 929 68 432Non-controlling interests (734) (272)
54 195 68 160
Total comprehensive income for the year attributable to:
Owners of the Company 55 284 68 340 Non-controlling interests (734) (272)
54 550 68 068
Earnings per ordinary share (cents) 22– basic 35,4 42,1 – headline 37,2 44,2 – diluted basic 35,4 41,7 – diluted headline 37,1 43,9
for the year ended 29 February 2016
R’000 Notes 2016 2015

Consolidated financial statements •69•
R’000
Sharecapital
and sharepremium
Treasuryshares
Foreigncurrency
translationreserve
Share-based
paymentreserve
Retainedincome
Totalattributable
to equity holders of the parent
Non-controlling
interestsTotal
equity
Balance at 28 February 2014 10 851 (109 679) 108 20 322 793 694 715 296 — 715 296
Transactions with owners — (25 098) — 3 569 (35 741) (57 270) — (57 270)
– Profit on disposal of treasury shares — — — — 103 103 — 103
– Dividends paid — — — — (35 844) (35 844) — (35 844)– Share-based
payment expense — — — 3 569 — 3 569 — 3 569 – Treasury shares
acquired — (25 733) — — — (25 733) — (25 733)– Treasury shares
sold — 635 — — — 635 — 635
Total comprehensive income for the year — — (92) — 68 432 68 340 (272) 68 068
– Net profit for the year — — — — 68 432 68 432 (272) 68 160
– Foreign currency translation differences — — (92) — — (92) — (92)
Balance at 28 February 2015 10 851 (134 777) 16 23 891 826 385 726 366 (272) 726 094
Transactions with owners (12) 37 756 — 3 293 (80 430) (39 393) — (39 393)
– Dividends paid — — — — (26 246) (26 246) — (26 246)– Share-based
payment expense — — — 3 293 — 3 293 — 3 293 – Treasury shares
acquired — (16 440) — — — (16 440) — (16 440)– Shares cancelled (12) 54 196 — — (54 184) — — —
Total comprehensive income for the year — — 355 — 54 929 55 284 (734) 54 550
– Net profit for the year — — — — 54 929 54 929 (734) 54 195
– Foreign currency translation differences — — 355 — — 355 — 355
Balance at 29 February 2016 10 839 (97 021) 371 27 184 800 884 742 257 (1 006) 741 251
Consolidated statement of changes in equityfor the year ended 29 February 2016

•70• Consolidated financial statements
for the year ended 29 February 2016
Cash flows from operating activities 175 702 158 561
Cash generated by operations before proceeds on disposal of rental assets i 184 566 157 820 Proceeds on disposal of rental assets 52 063 74 599 Investment income 14 631 13 511 Finance costs (30 932) (30 297)Taxation paid ii (18 479) (21 287)Dividends paid iii (26 147) (35 785)
Cash flows from investing activities (166 892) (206 868)
Purchase of property, vehicles, plant and equipment (160 127) (208 002)Purchase of intangible assets (3 796) (5 085)Proceeds on disposal of property, vehicles, plant and equipment 1 303 1 598 Proceeds on disposal of non-current assets held for sale 1 925 4 616 Increase in investments — (45)Acquisition of subsidiary iv (6 197) —Decrease in loans — 50
Cash flow from financing activities (35 153) 9 020
(Decrease)/increase in loans (18 713) 34 015 Treasury shares acquired (16 440) (25 733)Proceeds on disposal of treasury shares — 738
Net change in cash and cash equivalents (26 343) (39 287)Translation difference 308 (38)Cash and cash equivalents at beginning of the year 127 314 166 639
Cash and cash equivalents at end of the year 10 101 279 127 314
Consolidated statement of cash flows
R’000 Notes 2016 2015

Consolidated financial statements •71•
i Cash generated by operations Net profit before taxation 73 084 91 975 Adjustments for:Depreciation 102 911 99 318 Amortisation of intangible assets 11 618 16 693 Impairment of rental vehicles held for sale 2 252 —Investment income (14 631) (13 511)Fair value adjustment to loan receivable (208) 432 Finance costs 30 932 30 297 Straight-line rental expense (11 620) (15 072)Loss on disposal of property, vehicles, plant and equipment 3 703 4 203 Loss on disposal of non-current assets held for sale 91 526 Loss on disposal of intangible assets 24 130 Profit on disposal of rental assets (12 860) (6 546)Fair value adjustment relating to forward exchange contracts (358) (77)Foreign currency translation movement (314) 23 Share-based payment expense 3 293 3 569 Share of profit of equity-accounted investees (79) (64)
Cash generated by operations before movements in working capital 187 838 211 896 Movements in working capital:Inventories (14 018) 6 708 Trade and other receivables (13 205) (21 881)Trade and other payables 23 951 (38 903)
Cash generated by operations before proceeds on disposal of rental assets 184 566 157 820
ii Taxation paidOpening balance 1 177 1 182 Taxation per note 21 (16 972) (21 292)Closing balance (2 684) (1 177)
(18 479) (21 287)
iii Dividends paidCharge to the statement of changes in equity (26 246) (35 844)Movement in shareholders for dividend 99 59
(26 147) (35 785)
iv Acquisition of subsidiaryDuring the period the Group obtained control of Core Logistix Proprietary Limited. The fair values of assets acquired and liabilities assumed were as follows:Goodwill 10 670 —Property, plant and equipment 1 103 —Cash and cash equivalents 900 —
12 673 —
Purchase price paid in cash (7 097) —Less: cash of subsidiary acquired 900 —
Cash paid net of cash acquired (6 197) —
for the year ended 29 February 2016
Notes to the consolidated statement of cash flows
R’000 2016 2015

•72• Consolidated financial statements
Notes to the consolidated financial statements
1. PRESENTATION OF FINANCIAL STATEMENTS
The financial statements have been prepared in accordance with International Financial Reporting Standards and the Companies Act of South Africa. The financial statements have been prepared on the historical cost basis, except for the measurement of certain financial instruments at fair value, and incorporate the principal accounting policies set out below.
These accounting policies are consistent with the previous year.
The financial statements have been prepared in South African Rand, which is the functional currency.
All the financial information has been rounded to the nearest thousand Rand, except where otherwise stated.
1.1 Significant judgements and sources of estimation uncertainty
In preparing the financial statements, management is required to make estimates and assumptions that affect the amounts represented in the financial statements and related disclosures. Use of available information and the application of judgement is inherent in the formation of estimates. Actual results in the future could differ from these estimates which may be material to the financial statements. Significant judgements include:
Assessment of control
The Group is considered to exercise control over an entity, or division of that entity, in which it does not have a majority stake when it has the ability to control the activities of that operation and to earn variable returns from it. In all other cases where the Group does have a majority stake, control was assessed ensuring that the Group has power over the entity, exposure to variable returns and the ability to affect the amount of the returns from it.
Property, vehicles, plant and equipment
and IT software
Property, vehicles, plant and equipment and IT software are depreciated over their useful life taking
into account residual values, where appropriate. The actual lives of the assets and residual values are assessed annually and may vary depending on a number of factors. In re-assessing asset lives, factors such as technological innovation and maintenance programmes are taken into account. Residual value assessments consider issues such as future market conditions, the remaining life of the asset and projected disposal values.
Impairment testing
Property, vehicles, plant and equipment and IT software are considered for impairment if there is a reason to believe that an impairment may be necessary. The future cash flows expected to be generated by the assets are projected taking into account market conditions and the expected useful lives of the assets. The present value of these cash flows, determined using an appropriate discount rate, is compared to the current carrying value and, if lower, the assets are impaired to the present value.
Goodwill is tested on an annual basis for impairment. The recoverable amount of goodwill was calculated by determining its value in use through the discounted cash flow method. Assumptions regarding future growth in profitability, cash applied to the business and the free cash generated by the business were discounted using an appropriate risk-adjusted rate.
The following key assumptions were applied:
● growth rate of 12% for the first 2 years and 6% thereafter;
● discount rate of 13%;
● a forecast period of ten years was used to assess the carrying amount; and
● the discount rate was calculated by using a risk-free rate adjusted for risk factors.
Contingent provisions on business
combinations
Contingencies recognised in the current year required estimates and judgments, refer to note 32.1 on business combinations.
for the year ended 29 February 2016

Consolidated financial statements •73•
Taxation
Judgement is required in determining the provision
for income taxes due to the complexity of legislation.
The Group recognises liabilities for anticipated tax
audit issues based on estimates of whether additional
taxes will be due. Where the final tax outcome of
these matters is different from the amounts that were
initially recorded, such differences will impact the
income tax and deferred tax provisions in the year in
which such determination is made.
Deferred tax assets
Deferred tax assets are recognised to the extent it is
probable that taxable profits will be available against
which deductible temporary differences can be
utilised. Future taxable profits are estimated based
on business plans which include estimates and
assumptions regarding economic growth, inflation,
taxation rates and competitive forces.
Trade receivables, loans receivable and
other receivables
The Group assesses its trade receivables, loans
receivable and other receivables for impairment at each
reporting date. In determining whether an impairment
loss should be recorded in profit or loss, the Group
makes judgements as to whether there is observable
data indicating a measurable decrease in the estimated
future cash flows from a financial asset.
The impairment for trade receivables, loans
receivable and other receivables is calculated on a
portfolio basis, based on historical loss ratios,
adjusted for national and industry specific economic
conditions and other indicators present at the
reporting date that correlate with defaults on the
portfolio.
Provisions for insurance claims
Whilst management consider that the gross
provisions for claims and the related reinsurance
recoveries are fairly stated on the basis of the
information currently available to them, the ultimate
liability will vary as a result of subsequent information
and events and may result in significant adjustments
to the amounts provided.
Options granted
Management uses the Black-Scholes-Merton pricing
model to determine the value of the options at issue
date. Additional details regarding the estimates are
included in note 30 and accounting policy 1.11.
Available-for-sale financial assets
The Group follows the guidance of IAS 39 to
determine when an available-for-sale financial asset
is impaired. This determination requires significant
judgement. In making this judgement, the Group
evaluates, among other factors, the duration and
extent to which the fair value of an investment is less
than its cost; and the financial health of and near-
term business outlook for the investee, including
factors such as industry and sector performance,
changes in technology and operational and financing
cash flow.
Allowance for slow moving, damaged and
obsolete inventories
An allowance is raised to write down inventories to
the lower of cost or net realisable value. Management
have made estimates of the selling price and direct
cost to sell on certain inventory items. The write-
down is included in profit and loss.
Fair value estimation
The fair value of forward foreign exchange contracts
is determined using quoted forward exchange rates
at the end of the reporting period.
The carrying value less impairment provision of
trade receivables and payables are assumed to
approximate their fair values.
1.2 Business combinations, consolidation and
goodwill
The consolidated financial statements comprise the
financial statements of the Company and its
subsidiaries. Subsidiaries are all entities (including
structured entities) over which the Group has control.
The Group controls an entity where the Group is
exposed to, or has rights to, variable returns from its
involvement with the entity and has the ability to

for the year ended 29 February 2016 (continued)
•74• Consolidated financial statements
Notes to the consolidated financial statements
subsidiaries attributable to non-controlling interests
are allocated to the non-controlling interest even if
this results in a debit balance being recognised for
non-controlling interest.
1.3 Property, vehicles, plant and equipment
Property, vehicles, plant and equipment are tangible
assets which the Group holds for its own use or for
rental to others and which are expected to be used for
more than one year.
The cost of an item of property, vehicles, plant and
equipment is recognised as an asset when:
● it is probable that future economic benefits
associated with the item will flow to the Group;
and
● the cost of the item can be measured reliably.
Property, vehicles, plant and equipment are initially
measured at cost.
Costs include costs incurred initially to acquire or
construct an item of property, vehicles, plant and
equipment and costs incurred subsequently to add
to, replace part of, or service it. If a replacement cost
is recognised in the carrying amount of an item of
property, vehicles, plant and equipment, the carrying
amount of the replaced part is derecognised.
Property, vehicles, plant and equipment is carried
at cost less accumulated depreciation and any
impairment losses.
Depreciation is provided on all property, vehicles,
plant and equipment to write-down the cost to the
residual value on a straight-line basis over their
useful lives as follows:
Item Average useful life
● Buildings 50 years
● Plant and equipment 5 to 20 years
● Office furniture and
equipment 6 to 15 years
● Motor vehicles and
accessories 5 to 16 years
● Computer equipment 5 years
● Leasehold improvements 5 to 10 years
● Forklifts 10 years
affect those returns through its power to direct the activities of the entity. Subsidiaries are fully consolidated from the date on which control is transferred to the Group. They are deconsolidated from the date that control ceases.
The Group accounts for business combinations by applying the acquisition method.
Intercompany transactions and balances are eliminated on consolidation.
Goodwill is initially measured at cost, being the excess of the cost of the business combination and the non-controlling interests over the Group’s interest in the net fair value of the identifiable assets, liabilities and contingent liabilities. Cost includes contingent consideration. Goodwill is recognised separately as an intangible asset.
Subsequently goodwill acquired in a business combination is carried at cost less any accumulated impairment.
Goodwill is tested annually for impairment and whenever there is an indicator of impairment. For the purposes of impairment testing goodwill is allocated to cash-generating units expected to benefit from the business combination in which the goodwill arose. An impairment loss is recognised if the carrying amount of the cash-generating unit exceeds its recoverable amount.
Any impairment loss is first allocated to reduce the carrying amount of any goodwill allocated to the cash generating unit, and then to the remaining assets pro-rata based on the carrying value of each asset.
Impairment losses on goodwill are not reversed.
The excess of the net fair value of the identifiable assets, liabilities and contingent liabilities over the cost of the business combination is immediately recognised in profit or loss.
Internally generated goodwill is not recognised as an asset.
Non-controlling interests in the net assets of consolidated subsidiaries are identified and recognised separately from the Group’s interest therein, and are recognised within equity. Losses of

Consolidated financial statements •75•
The residual value and the useful life of each asset is
reviewed at each financial year end. Changes are
accounted for as a change in accounting estimate.
Each part of an item of property, vehicles, plant and
equipment with a cost that is significant in relation to
the total cost of the item is depreciated separately.
The depreciation charge for each year is recognised
in profit or loss unless it is included in the carrying
amount of another asset.
The gain or loss arising from the derecognition of an
item of property, vehicles, plant and equipment
is included in profit or loss when the item is
derecognised. The gain or loss arising from the
derecognition of an item of property, vehicles, plant
and equipment is determined as the difference
between the net disposal proceeds, if any, and the
carrying amount of the item.
Assets which the Group holds for rentals to others
and subsequently routinely sells as part of the
ordinary course of activities, are transferred to
inventories when the rentals end and the assets are
available for sale. These assets are not accounted for
as non-current assets held for sale. Proceeds from
sales of these assets are recognised as revenue. All
cashflows on these assets are included in cashflows
from operating activities in the cashflow statement.
1.4 Full maintenance lease assets
Full maintenance lease assets are items of property,
vehicles, plant and equipment which are leased to
customers where the Group retains substantially all
the risks and rewards of ownership.
The cost of full maintenance lease assets includes the
purchase cost and other expenditure that is directly
attributable to the acquisition of the assets to bring
them into working condition for their intended use.
Full maintenance lease assets are stated at historical
cost less accumulated depreciation and any
impairment losses.
Depreciation is provided on all full maintenance
lease assets to write-down the cost to the residual
value on a straight-line basis over their useful lives
as follows:
Item Average useful life
● Motor vehicles and
accessories 5 to 16 years
● Forklifts 10 years
The residual value and the useful life of each asset is
reviewed at each financial year end.
The depreciation charge for each year is recognised
in profit or loss unless it is included in the carrying
amount of another asset.
The gain or loss arising from the derecognition of a
full maintenance lease asset is included in profit or
loss when the item is derecognised. The gain or loss
arising from the derecognition of a full maintenance
lease asset is determined as the difference between
the net disposal proceeds, if any, and the carrying
amount of the item.
1.5 Intangible assets
An intangible asset is recognised when:
● it is probable that the expected future economic
benefits that are attributable to the asset will flow
to the entity; and
● the cost of the asset can be measured reliably.
Intangible assets are initially recognised at cost.
Intangible assets are carried at cost less any
accumulated amortisation and any impairment losses.
The amortisation period and the amortisation method
for intangible assets are reviewed at each financial
year end.
Amortisation is provided to write down the intangible
assets, on a straight-line basis, to their residual
values as follows:
Item Average useful life
● IT software 5 years

for the year ended 29 February 2016 (continued)
•76• Consolidated financial statements
Notes to the consolidated financial statements
1.6 Financial instruments
Classification
The Group classifies financial assets and financial
liabilities into the following categories:
● Financial assets/liabilities at fair value through
profit or loss – held-for-trading
● Loans and receivables
● Available-for-sale financial assets
● Financial liabilities measured at amortised cost.
Classification depends on the purpose for which the
financial instruments were obtained/incurred and
takes place at initial recognition. For financial
instruments which are not derivatives or designated
as at fair value through profit or loss, classification is
re-assessed on an annual basis.
Initial recognition and measurement
Financial instruments are recognised initially when
the Group becomes a party to the contractual
provisions of the instruments.
The Group classifies financial instruments, or their
component parts, on initial recognition as a financial
asset, a financial liability or an equity instrument in
accordance with the substance of the contractual
arrangement.
Derecognition
Financial assets are derecognised when the rights to
receive cash flows from the investments have expired
or have been transferred and the Group has
transferred substantially all risks and rewards of
ownership. Financial liabilities are derecognised
when the obligation specified in the contract is
discharged, cancelled or expires.
Impairment of financial assets
At each reporting date the Group assesses all
financial assets, other than those measured at fair
value through profit or loss, to determine whether
there is objective evidence that a financial asset or
group of financial assets has been impaired.
For amounts due to the Group, significant financial difficulties of the debtor, probability that the debtor will enter bankruptcy and default of payments are all considered indicators of impairment.
Impairment losses are recognised in profit or loss.
Impairment losses are reversed when an increase in the financial asset’s recoverable amount can be related objectively to an event occurring after the impairment was recognised, subject to the restriction that the carrying amount of the financial asset at the date that the impairment is reversed shall not exceed what the carrying amount would have been had the impairment not been recognised.
Reversals of impairment losses are recognised in profit or loss.
Where financial assets are impaired through use of an allowance account, the amount of the loss is recognised in profit or loss within operating expenses. When such assets are written off, the write off is charged to the relevant allowance account. Subsequent recoveries of amounts previously written off are credited against operating expenses.
Fair value determination
If the market for a financial asset is not active the Group establishes fair value by using valuation techniques. These include the use of recent arm’s length transactions, reference to other instruments that are substantially the same, discounted cash flow analysis, and option pricing models making maximum use of market inputs and relying as little as possible on entity-specific inputs.
Loans receivable
Loans with fixed or determinable repayment terms are classified as loans receivable.
These financial assets are initially recognised at fair value plus direct transaction costs. Differences on initial recognition between the transaction price and the fair value are recognised in profit or loss.
Subsequently these loans are measured at amortised cost using the effective interest rate method, less any impairment loss recognised to reflect irrecoverable
amounts.

Consolidated financial statements •77•
On loans receivable, an impairment loss is
recognised in profit or loss when there is objective
evidence that it is impaired. The impairment is
measured as the difference between the loan’s
carrying amount and the present value of estimated
future cash flows discounted at the effective interest
rate computed at initial recognition.
Trade and other receivables
Trade receivables are measured at initial recognition
at fair value, and are subsequently measured at
amortised cost using the effective interest rate
method. Appropriate allowances for estimated
irrecoverable amounts are recognised in profit or
loss when there is objective evidence that the
asset is impaired. Significant financial difficulties
of the debtor, probability that the debtor will enter
bankruptcy or financial reorganisation, and default or
delinquency in payments (more than 30 days
overdue) are considered indicators that the trade
receivable is impaired. The allowance recognised is
measured as the difference between the asset’s
carrying amount and the present value of estimated
future cash flows discounted at the effective interest
rate computed at initial recognition.
The carrying amount of the asset is reduced through
the use of an allowance account, and the amount of
the loss is recognised in profit or loss within operating
expenses. When a trade receivable is uncollectable,
it is written off against the allowance account
for trade receivables. Subsequent recoveries of
amounts previously written off are credited against
operating expenses in profit or loss.
Trade and other receivables are classified as loans
and receivables.
Trade and other payables
Trade and other payables are initially measured
at fair value, and are subsequently measured at
amortised cost using the effective interest rate
method.
Cash and cash equivalents
Cash and cash equivalents comprise cash on hand
and demand deposits. These are initially and
subsequently recorded at fair value.
Cash and cash equivalents are classified as held-for-
trading financial assets.
Bank overdrafts and borrowings
Borrowings are initially measured at fair value, and
are subsequently measured at amortised cost using
the effective interest rate method. Any difference
between the proceeds (net of transaction costs) and
the settlement or redemption of borrowings is
recognised over the term of the borrowings in
accordance with the Group’s accounting policy for
borrowing costs.
Other financial liabilities are measured initially at fair
value and subsequently at amortised cost, using the
effective interest rate method. Differences on initial
recognition between the transaction price and the fair
value are recognised in profit or loss.
Bank overdrafts are initially and subsequently
measured at fair value.
Derivatives
Derivative financial instruments which are not
designated as hedging instruments, consisting of
foreign exchange contracts are initially measured at
fair value on the contract date, and are remeasured to
fair value at subsequent reporting dates.
Derivatives embedded in other financial instruments
or other non-financial host contracts are treated as
separate derivatives when their risks and
characteristics are not closely related to those of the
host contract and the host contract is not carried at
fair value with unrealised gains or losses reported in
profit or loss.
Changes in the fair value of derivative financial
instruments are recognised in profit or loss as
they arise.
Derivatives are classified as financial assets or
financial liabilities through profit or loss-held for
trading.

for the year ended 29 February 2016 (continued)
•78• Consolidated financial statements
Notes to the consolidated financial statements
Available-for-sale financial assets
These financial assets are non-derivatives that are either designated in this category or not classified elsewhere.
These financial assets are measured initially and subsequently at fair value. Gains and losses arising from changes in fair value are recognised directly in equity until the financial asset is disposed of or is determined to be impaired.
1.7 Inventories
Inventories include beverages, materials handling equipment, fuel and maintenance spares, and vehicles and materials handling equipment which previously formed part of the rental fleet.
Property, vehicles, plant and equipment that are held for rental to others, and are routinely sold, are transferred to inventory at their carrying amount when they cease to be rented and become held for sale on which date depreciation ceases and are measured at the lower of their carrying amount or fair value less costs to sell.
Beverages, fuel and maintenance spares are measured at cost on the first-in first-out basis. Provision is made for maintenance spares which are obsolete.
Materials handling equipment and vehicles are measured at the lower of cost or net realisable value.
Net realisable value is the estimated selling price in the ordinary course of business less the estimated costs of completion and the estimated costs necessary to make the sale.
The cost of inventories comprises all costs of purchase, costs of conversion and other costs incurred in bringing the inventories to their present location and condition.
When inventories are sold, the carrying amount of those inventories is recognised as an expense in the period in which the related revenue is recognised. The amount of any write-down of inventories to net realisable value and all losses of inventories is recognised as an expense in the period the write-down or loss occurs. The amount of any reversal of any write-down of inventories, arising from an increase in net realisable value, is recognised as a
reduction in the amount of inventories recognised as an expense in the year in which the reversal occurs.
1.8 Non-current assets held for sale
Non-current assets held for sale are classified as held for sale when their carrying amounts are to be recovered through a sale transaction rather than through continuing use. All such assets are disclosed as held for sale if:
● they are available for immediate sale in their present condition;
● management is committed to the sale and the sale is highly probable; and
● the sale of the asset is expected to be recognised as a completed sale within one year of classification as held for sale.
Non-current assets held for sale are measured at the lower of their carrying amount and fair value less costs to sell.
A non-current asset is not depreciated while it is classified as held for sale.
1.9 Impairment of non-financial assets
The Group assesses at each reporting date whether there is any indication that an asset may be impaired. If any such indication exists, the Group estimates the recoverable amount of the asset.
If there is any indication that an asset may be impaired, the recoverable amount is estimated for the individual asset. If it is not possible to estimate the recoverable amount of the individual asset, the recoverable amount of the cash-generating unit to which the asset belongs is determined.
The recoverable amount of an asset or a cash-generating unit is the higher of its fair value less costs to sell and its value in use.
If the recoverable amount of an asset is less than its carrying amount, the carrying amount of the asset is reduced to its recoverable amount. That reduction is an impairment loss.
An impairment loss of assets carried at cost less any accumulated depreciation or amortisation is recognised immediately in profit or loss, in operating expenses.

Consolidated financial statements •79•
The Group assesses at each reporting date whether
there is any indication that an impairment loss
recognised in prior periods for assets other than
goodwill may no longer exist or may have decreased.
If any such indication exists, the recoverable
amounts of those assets are estimated.
The increased carrying amount of an asset, other
than goodwill, attributable to a reversal of an
impairment loss, does not exceed the carrying
amount that would have been determined had no
impairment loss been recognised for the asset in
prior periods.
A reversal of an impairment loss of assets carried at
cost less accumulated depreciation or amortisation,
other than goodwill, is recognised immediately in
profit or loss.
The accounting policy for testing impairment losses
on goodwill have been detailed in notes 1.1 and 1.2.
1.10 Share capital and equity
Equity instruments
An equity instrument is any contract that evidences a
residual interest in the assets of an entity after
deducting all of its liabilities.
Ordinary shares and A ordinary shares are classified
as equity.
Treasury shares
Where any Group company purchases the Company’s
equity share capital as treasury shares, or where any
special purpose entity holds the Company’s equity
share capital and is consolidated, the consideration
paid, including any directly attributable incremental
costs (net of income taxes) is deducted from equity
attributable to the Company’s equity holders until the
shares are cancelled, reissued or disposed of. Where
such shares are subsequently sold or reissued, any
consideration received, net of any directly attributable
incremental transaction costs and the related income
tax effects, is included in equity attributable to the
Company’s equity holders.
1.11 Share-based payments
The Group operates equity-settled, share-based
compensation plans. The fair value of the employee
services received in exchange for the grant of the
options/units is recognised as an expense on a
straight-line basis over the vesting period. The total
amount to be expensed over the vesting period is
determined by reference to the fair value of the
options/units granted, excluding the impact of any
non-market vesting conditions (for example,
profitability and sales growth targets). Fair value is
determined using the Black-Scholes-Merton pricing
model. The expected life used in this model is
adjusted for the effects of non-transferability, exercise
restrictions and behavioural considerations. Non-
market vesting conditions are included in
assumptions about the number of options/units that
are expected to become exercisable. At each
reporting date, the Group revises its estimates of the
number of options/units that are expected to become
exercisable.
The revision of original estimates, including
forfeitures, if any, are recognised in the statement of
comprehensive income, with a corresponding
adjustment to equity at the end of each reporting
period.
1.12 Leases
A lease is classified as a finance lease if it transfers
substantially all the risks and rewards incidental to
ownership. A lease is classified as an operating
lease if it does not transfer substantially all the risks
and rewards incidental to ownership.
Operating leases – lessor
Operating lease income is recognised as an income
on a straight-line basis over the lease term. Initial
direct costs incurred in negotiating and arranging
operating leases are added to the carrying amount at
the leased asset and recognised as an expense over
the lease term on the same basis as the lease
income.
Income for leases is disclosed under revenue in the
statement of comprehensive income.

for the year ended 29 February 2016 (continued)
•80• Consolidated financial statements
Notes to the consolidated financial statements
Operating leases – lessee
Operating lease payments are recognised as an
expense on a straight-line basis over the lease term.
The difference between the amounts recognised as
an expense and the contractual payments is
recognised as an operating lease liability. This
liability is not discounted.
Any contingent rents are expensed in the year they
are incurred.
Finance leases – lessee
Finance leases are recognised as assets in the
statement of financial position at amounts equal to
the fair value of the leased property or, if lower, the
present value of the minimum lease payments. The
corresponding liability to the lessor is included in the
statement of financial position as a finance lease
obligation within interest-bearing borrowings.
The discount rate used in calculating the present
value of the minimum lease payments is the interest
rate implicit in the lease.
The lease payments are apportioned between the
finance charge and reduction of the outstanding
liability. The finance charge is allocated to each
period during the lease term so as to produce a
constant periodic rate on the remaining balance of
the liability.
1.13 Tax
Current tax assets and liabilities
Current tax for current and prior periods is, to the
extent unpaid, recognised as a liability. If the amount
already paid in respect of current and prior periods
exceeds the amount due for those periods, the
excess is recognised as an asset.
Current tax liabilities and assets for the current and
prior periods are measured at the amount expected to
be paid to or recovered from the tax authorities, using
the tax rates and tax laws that have been enacted or
substantively enacted by the reporting date.
Deferred tax assets and liabilities
A deferred tax liability is recognised for all taxable
temporary differences, except to the extent that the
deferred tax liability arises from the initial recognition
of an asset or liability in a transaction which, at the
time of the transaction, affects neither accounting
profit nor taxable profit or loss.
A deferred tax asset is recognised for all deductible
temporary differences to the extent that it is probable
that taxable profit will be available against which
the deductible temporary difference can be utilised.
A deferred tax asset is not recognised when it arises
from the initial recognition of an asset or liability in a
transaction which, at the time of the transaction,
affects neither accounting profit nor taxable profit
or loss.
A deferred tax asset is recognised for the carry
forward of unused tax losses to the extent that it is
probable that future taxable profit will be available
against which the unused tax losses can be utilised.
Deferred tax assets and liabilities are measured at
the tax rates that are expected to apply to the
period when the asset is realised or the liability is
settled, based on tax rates and tax laws that have
been enacted or substantively enacted by the
reporting date.
Tax expenses
Current and deferred taxes are recognised as income
or an expense and included in profit or loss for the
period, except to the extent that the tax arises from:
● a transaction or event which is recognised, in the
same or a different period, directly in equity; or
● a transaction or event which is recognised, in the
same or a different period, to other comprehensive
income; or
● a business combination.
Current tax and deferred taxes are charged or credited
directly to equity if the tax relates to items that are
credited or charged, in the same or a different period,
directly to equity.

Consolidated financial statements •81•
1.14 Provisions and contingencies
Provisions are recognised when:
● the Group has a present obligation (legal or
constructive) as a result of a past event;
● it is probable that an outflow of resources
embodying economic benefits will be required to
settle the obligation; and
● a reliable estimate can be made of the obligation.
The amount of a provision is the present value of the
expenditure expected to be required to settle the
obligation.
Where some or all of the expenditure required to settle a
provision is expected to be reimbursed by another party,
the reimbursement is recognised when, and only when,
it is virtually certain that reimbursement will be received
if the entity settles the obligation. The reimbursement is
treated as a separate asset. The amount recognised for
the reimbursement does not exceed the amount of the
provision.
Provisions are not recognised for future operating
losses.
Provisions are reversed when it is no longer probable
that an outflow of resources will be required to settle
the obligation.
After their initial recognition, contingent liabilities
recognised in business combinations that are
recognised separately are subsequently measured at
the higher of:
● the amount that would be recognised as a
provision
● the amount initially recognised less cumulative
amortisation.
Contingent assets and contingent liabilities are not
recognised. Contingencies are disclosed in note 32.1.
1.15 Revenue
Revenue from the sale of goods is recognised when
all the following conditions have been satisfied:
● the Group has transferred to the buyer the
significant risks and rewards of ownership of
the goods;
● the Group retains neither continuing managerial
involvement to the degree usually associated with
ownership nor effective control over the goods
sold;
● the amount of revenue can be measured reliably;
● it is probable that the economic benefits
associated with the transaction will flow to the
Group; and
● the costs incurred or to be incurred in respect of
the transaction can be measured reliably.
Sale of goods comprise the sale of rental assets and
forklifts. Revenue from the sale of rental assets and
forklifts is recognised when delivery to the buyer has
taken place.
When the outcome of a transaction involving the
rendering of services can be estimated reliably, revenue
associated with the transaction is recognised by
reference to the stage of completion of the transaction at
the statement of financial position date. The outcome of
a transaction can be estimated reliably when all the
following conditions are satisfied:
● the amount of revenue can be measured reliably;
● it is probable that the economic benefits
associated with the transaction will flow to the
Group;
● the stage of completion of the transaction at the
statement of financial position date can be
measured reliably; and
● the costs incurred for the transaction and the costs
to complete the transaction can be measured
reliably.
Revenue from the rendering of services comprises
distribution, transport, clearing and forwarding,
warehousing, container and fleet management,
forklift and commercial vehicle rental and leasing
and insurance.
Revenue from forklift and commercial vehicle rental is recognised when the vehicle is returned and the kilometres travelled are known. Revenue from transport and distribution is recognised when the parcel reaches the destination. Revenue from clearing and forwarding is recognised when all fees and costs can be determined as this is when a

for the year ended 29 February 2016 (continued)
•82• Consolidated financial statements
Notes to the consolidated financial statements
All other borrowing costs are recognised as an expense in the period in which they are incurred.
1.17 Employee benefits
Short-term employee benefits
The cost of short-term employee benefits (those payable within 12 months after the service is rendered, such as paid vacation leave, sick leave and bonuses), are recognised as an expense in profit or loss in the period in which the service is rendered and are not discounted.
The expected cost of compensated absences is recognised as an expense as the employees render services that increase their entitlement or, in the case of non-accumulating absences, when the absence occurs.
The expected cost of profit sharing and bonus payments is recognised as an expense when there is a legal or constructive obligation to make such payments as a result of past performance.
Defined contribution plans Payments to defined contribution retirement benefit plans are charged as an expense as they fall due.
1.18 Translation of foreign currencies
Foreign currency transactions
A foreign currency transaction is recorded, on initial recognition in Rands, by applying to the foreign currency amount the spot exchange rate between the functional currency and the foreign currency at the date of the transaction.
At each reporting date foreign currency monetary items are translated using the closing rate.
Exchange differences arising on the settlement of monetary items or on translating monetary items at rates different from those at which they were translated on initial recognition during the period or in previous financial statements are recognised in profit or loss in the period in which they arise.
Cash flows arising from transactions in a foreign currency are recorded in Rands by applying to the foreign currency amount the exchange rate between the Rand and the foreign currency at the date of the
cash flow.
reliable measure of revenue is available. Revenue
from warehousing is recognised at every month end.
Revenue from insurance is recognised over the
period covered by the insurance contract. Revenue
from container and fleet management are recognised
over the period stipulated in the management
agreement.
Revenue excludes investment income and value
added tax.
Interest is recognised on a time proportion basis
which takes into account the effective yield on the
asset over the period it is expected to be held.
Dividends are recognised, in profit or loss, when the
Group’s right to receive payment has been established.
1.16 Borrowing costs
Borrowing costs that are directly attributable to the
acquisition, construction or production of a qualifying
asset are capitalised as part of the cost of that asset
until such time as the asset is ready for its intended
use. The amount of borrowing costs eligible for
capitalisation is determined as follows:
● Actual borrowing costs on funds specifically
borrowed for the purpose of obtaining a qualifying
asset less any temporary investment of those
borrowings.
● Weighted average of the borrowing costs
applicable to the entity on funds generally
borrowed for the purpose of obtaining a qualifying
asset. The borrowing costs capitalised do not
exceed the total borrowing costs incurred.
The capitalisation of borrowing costs commences
when:
● expenditures for the asset have occurred;
● borrowing costs have been incurred; and
● activities that are necessary to prepare the asset
for its intended use or sale are in progress.
Capitalisation is suspended during extended periods
in which active development is interrupted.
Capitalisation ceases when substantially all the
activities necessary to prepare the qualifying asset for
its intended use or sale are complete.

Consolidated financial statements •83•
Foreign operations
The financial statements of foreign operations in the
Group are translated into South African Rand as
follows:
● assets and liabilities at the rates of exchange
ruling at the reporting date;
● income, expenditure and cash flow items at
the weighted average rate of exchange during the
accounting period;
● equity at historical rates;
● differences arising on translation are recognised
in other comprehensive income and disclosed as
a foreign currency translation reserve;
● if a foreign operation is disposed of in full, the
relevant amount in the foreign currency translation
reserve is recognised in the statement of
comprehensive income; and
● differences arising from a monetary item
receivable from or payable to a foreign operation,
the settlement of which is neither planned nor
likely in the foreseeable future, are considered to
form part of a net investment in a foreign operation
and are recognised in other comprehensive
income in the foreign currency translation reserve.
1.19 Investments in subsidiaries
Consolidated financial statements
The consolidated financial statements include those
of the Company and its subsidiaries. The results of
the subsidiaries are included from the effective date
control was acquired up to the date effective control
ceased.
On acquisition, the Group recognises the subsidiary’s
identifiable assets, liabilities and contingent liabilities at
fair value, except for assets classified as held for sale,
which are recognised at fair value less costs to sell.
Further details are contained in accounting policy 1.2.
Company financial statements
In the Company’s separate financial statements,
investments in subsidiaries are carried at cost less
any accumulated impairment.
The cost of an investment in a subsidiary is the aggregate of:
● the fair value, at the date of exchange, of assets given, liabilities incurred or assumed, and equity instruments issued by the Company; plus
● any costs directly attributable to the purchase of the subsidiary.
An adjustment to the cost of a business combination contingent on future events is included in the cost of the combination if the adjustment is probable and can be measured reliably.
1.20 Investments in equity-accounted investees
An associate is an entity over which the Group has the ability to exercise significant influence, but not control or joint control, through participation in the financial and operating policy decisions of the company, generally accompanying a shareholding embodying between 20% and 50% of the voting rights.
Profits, losses and other comprehensive income in the associate are recognised using the equity method of accounting from the effective date that significant influence was obtained until the effective date that significant influence ceased. Investments in associates are carried at cost and adjusted for any post-acquisition profits or losses. If impaired, the carrying value of the Group’s share in the associate is written down to its estimated recoverable amount.
A joint venture is an arrangement whereby the parties that have joint control over an entity have rights to the net assets of the jointly controlled entity. Joint control exists when there is a contractually agreed sharing of control over an entity, which exists only when decisions about the relevant activities require the unanimous consent of the parties sharing control.
An interest in a jointly controlled entity is accounted for using the equity method. Under the equity method, interests in jointly controlled entities are carried in the consolidated statement of financial position at cost adjusted for post-acquisition changes in the Group’s share of the net assets of the jointly controlled entity, less any impairment losses. Profits or losses on transactions between the Group and a joint venture are eliminated to the extent of the Group’s interest therein.

for the year ended 29 February 2016 (continued)
•84• Consolidated financial statements
from insurance risk. Reinsurance agreements that
give rise to a significant transfer of insurance risk are
accounted for as reinsurance contracts. Amounts
recoverable under such contracts are recognised in
the same year as the related claim. Amounts
recoverable under reinsurance contracts are
assessed for impairment at each statement of
financial position date. Such assets are deemed
impaired if there is objective evidence, as a result of
an event that occurred after its initial recognition, that
the Group may not recover all amounts due and that
the event has a reliably measurable impact on the
amounts that the Group will receive from the
reinsurer.
Types of insurance contracts
Certain transactions are entered into by the Group as
insurer which falls into the definition of insurance
contracts. Significant types of insurance contracts
undertaken by the Group comprise motor, goods in
transit, multi-peril and marine insurance.
Motor insurance provides the Group’s customers
indemnity for loss of or damage to the Group’s motor
vehicles with or without an excess. The cover is
normally on an all risks basis providing a wide range
of cover following an accident or a theft of the vehicle.
Legal liabilities arising out of the use of the Group’s
motor vehicle following an accident for damage to
third party property is also covered under this class of
insurance.
Goods-in-transit insurance provides limited
indemnity for loss of or damage to movable property
for losses caused by crime and accident damages.
Multi-peril insurance provides limited indemnity for
loss of or damage to movable customer property
warehoused by the Group caused by perils such as
fire, lightning, explosion, weather, water, earthquake
and malicious damage. The policies specifically
exclude theft.
Marine insurance provides limited indemnity for
cargo imported and exported by customers. Cargo
covers physical loss of or damage to cargo as a
result of fire, explosion, weather, accidents and
malicious damage.
1.21 Insurance contracts
Classification of insurance contracts
Contracts under which the Group accepts significant insurance risk from another party (the policyholder) by agreeing to compensate the policyholder or other beneficiary if a specified uncertain future event (the insured event) adversely affects the policyholder or other beneficiary are classified as insurance contracts. Insurance risk is the risk that is transferred from the policy holder to the Group.
Recognition and measurement of insurance
contracts
Premiums
Gross written premiums comprise the premiums on insurance contracts entered into during the year, irrespective of whether they relate in whole or in part to a later accounting period. Premiums are disclosed gross of commission due to intermediaries and exclude Value Added Tax. The earned portion of premiums received is recognised as revenue. Premiums are earned from the date of attachment of risk, over the indemnity period, based on the pattern of risks underwritten.
Claims incurred
Claims incurred consist of claims and claims handling expenses paid during the financial year together with the movement in the provision for outstanding claims. Claims outstanding comprise provisions for the Group’s estimate of the final cost of settling all claims incurred but unpaid at the statement of financial position date whether reported or not, and an appropriate risk margin. Adjustments to the amounts of claims provisions established in prior years are reflected in the financial statements for the period in which the adjustments are made, and
disclosed separately, if material.
Reinsurance
Outward reinsurance premiums are recognised as an expense in the same accounting period as the premiums for the related insurance contract. Reinsurance contracts are entered into for the purposes of limiting the Group’s loss potential arising
Notes to the consolidated financial statements

Consolidated financial statements •85•
maximising the use of relevant observable inputs
and minimising the use of unobservable inputs. All
assets and liabilities for which fair value is measured
or disclosed in the financial statements are
categorised within the fair value hierarchy, described
as follows, based on the lowest level input that is
significant to the fair value measurement as a whole:
Level 1 – Quoted unadjusted prices in active markets
for identical assets or liabilities that the Group can
assess at measurement date
Level 2 – Inputs other than quoted prices included in
level 1 that are observable for the asset or liability
either directly or indirectly
Level 3 – Unobservable inputs for the asset or
liability.
For assets and liabilities that are recognised in the
financial statements on a recurring basis, the Group
determines whether transfers have occurred between
the levels in the hierarchy by re-assessing
categorisation at the end of each reporting period.
For the purpose of fair value disclosures, the Group
has determined classes of assets and liabilities on
the basis of the nature, characteristics and risks of
the asset or liability and the level of the fair value
hierarchy as explained above.
1.22 Segment analysis
A segment is a distinguishable component of the
Group that is engaged in providing products or
services which are subject to risks and rewards that
are different from those of other segments. The
primary basis for reporting segment information is
business segments and the secondary basis
is by significant geographical region, which is
representative of the internal structure used for
management reporting.
Segment results include revenue and expenses
directly attributable to a segment whether from
external transactions or from transactions with other
Group segments.
Segment assets and liabilities comprise those
operating assets and liabilities that are directly
attributable to the segment or can be allocated to the
segment on a reasonable basis.
1.23 Fair value measurement
The Group measures financial instruments, such as
derivatives and certain investments, at fair value at
each reporting date.
Fair value is the price that would be received to sell
an asset or paid to transfer a liability in an orderly
transaction between market participants at the
measurement date.
The Group uses valuation techniques that are
appropriate in the circumstances and for which
sufficient data is available to measure fair value,

•86• Consolidated financial statements
Notes to the consolidated financial statementsfor the year ended 29 February 2016 (continued)
R’000 CostAccumulated depreciation
Carryingvalue
Openingbalance Additions
Additions through
business combination Transfers
Transfers ToInventory And
Non-CurrentAssets Held
For Sale Disposals Depreciation Translation Total
2. PROPERTY, VEHICLES, PLANT AND EQUIPMENT 2016Owned assetsProperty 39 416 (2 696) 36 720 36 939 — — — — — (219) — 36 720 Plant and equipment 137 246 (52 468) 84 778 68 324 26 768 60 — — (88) (10 286) — 84 778 Motor vehicles and accessories 929 376 (292 273) 637 103 676 844 54 461 — — (35 303) (4 331) (54 783) 215 637 103 Office furniture and equipment 34 236 (27 564) 6 672 5 738 3 848 329 11 — (92) (3 162) — 6 672 Computer equipment 94 607 (65 591) 29 016 27 311 14 110 714 (11) — (246) (12 862) — 29 016 Forklifts 316 985 (76 253) 240 732 200 605 59 669 — — (1 605) (249) (17 939) 251 240 732 Leasehold improvements 16 994 (14 156) 2 838 3 030 1 271 — — — — (1 463) — 2 838
1 568 860 (531 001) 1 037 859 1 018 791 160 127 1 103 — (36 908) (5 006) (100 714) 466 1 037 859
Capitalised finance lease
Computer equipment 10 956 (9 300) 1 656 3 853 — — — — — (2 197) — 1 656
Total 1 579 816 (540 301) 1 039 515 1 022 644 160 127 1 103 — (36 908) (5 006) (102 911) 466 1 039 515
R’000 CostAccumulated depreciation
Carrying value
Openingbalance Additions
Additions through
business combination Transfers
Transfers toinventory and
non-currentassets held
for sale Disposals Depreciation Translation Total
PROPERTY, VEHICLES, PLANT AND EQUIPMENT 2015Owned assetsProperty 39 416 (2 477) 36 939 36 745 311 — — — — (117) — 36 939Plant and equipment 111 610 (43 286) 68 324 50 726 27 181 — — 82 (465) (9 200) — 68 324Motor vehicles and accessories 955 839 (278 995) 676 844 668 907 135 615 — — (66 699) (3 922) (57 014) (43) 676 844Office furniture and equipment 32 055 (26 317) 5 738 5 165 3 404 — — (122) (178) (2 531) — 5 738Computer equipment 85 709 (58 398) 27 311 27 062 12 149 — 569 10 (387) (12 092) — 27 311Forklifts 262 297 (61 692) 200 605 187 503 29 093 — — (684) (850) (14 406) (51) 200 605Leasehold improvements 16 210 (13 180) 3 030 4 743 249 — — (197) 1 (1 766) — 3 030
1 503 136 (484 345) 1 018 791 980 851 208 002 — 569 (67 610) (5 801) (97 126) (94) 1 018 791
Capitalised finance leaseComputer equipment 10 956 (7 103) 3 853 6 045 — — — — — (2 192) — 3 853
Total 1 514 092 (491 448) 1 022 644 986 896 208 002 — 569 (67 610) (5 801) (99 318) (94) 1 022 644

R’000 CostAccumulated depreciation
Carryingvalue
Openingbalance Additions
Additions through
business combination Transfers
Transfers ToInventory And
Non-CurrentAssets Held
For Sale Disposals Depreciation Translation Total
2. PROPERTY, VEHICLES, PLANT AND EQUIPMENT 2016Owned assetsProperty 39 416 (2 696) 36 720 36 939 — — — — — (219) — 36 720 Plant and equipment 137 246 (52 468) 84 778 68 324 26 768 60 — — (88) (10 286) — 84 778 Motor vehicles and accessories 929 376 (292 273) 637 103 676 844 54 461 — — (35 303) (4 331) (54 783) 215 637 103 Office furniture and equipment 34 236 (27 564) 6 672 5 738 3 848 329 11 — (92) (3 162) — 6 672 Computer equipment 94 607 (65 591) 29 016 27 311 14 110 714 (11) — (246) (12 862) — 29 016 Forklifts 316 985 (76 253) 240 732 200 605 59 669 — — (1 605) (249) (17 939) 251 240 732 Leasehold improvements 16 994 (14 156) 2 838 3 030 1 271 — — — — (1 463) — 2 838
1 568 860 (531 001) 1 037 859 1 018 791 160 127 1 103 — (36 908) (5 006) (100 714) 466 1 037 859
Capitalised finance lease
Computer equipment 10 956 (9 300) 1 656 3 853 — — — — — (2 197) — 1 656
Total 1 579 816 (540 301) 1 039 515 1 022 644 160 127 1 103 — (36 908) (5 006) (102 911) 466 1 039 515
R’000 CostAccumulated depreciation
Carrying value
Openingbalance Additions
Additions through
business combination Transfers
Transfers toinventory and
non-currentassets held
for sale Disposals Depreciation Translation Total
PROPERTY, VEHICLES, PLANT AND EQUIPMENT 2015Owned assetsProperty 39 416 (2 477) 36 939 36 745 311 — — — — (117) — 36 939Plant and equipment 111 610 (43 286) 68 324 50 726 27 181 — — 82 (465) (9 200) — 68 324Motor vehicles and accessories 955 839 (278 995) 676 844 668 907 135 615 — — (66 699) (3 922) (57 014) (43) 676 844Office furniture and equipment 32 055 (26 317) 5 738 5 165 3 404 — — (122) (178) (2 531) — 5 738Computer equipment 85 709 (58 398) 27 311 27 062 12 149 — 569 10 (387) (12 092) — 27 311Forklifts 262 297 (61 692) 200 605 187 503 29 093 — — (684) (850) (14 406) (51) 200 605Leasehold improvements 16 210 (13 180) 3 030 4 743 249 — — (197) 1 (1 766) — 3 030
1 503 136 (484 345) 1 018 791 980 851 208 002 — 569 (67 610) (5 801) (97 126) (94) 1 018 791
Capitalised finance leaseComputer equipment 10 956 (7 103) 3 853 6 045 — — — — — (2 192) — 3 853
Total 1 514 092 (491 448) 1 022 644 986 896 208 002 — 569 (67 610) (5 801) (99 318) (94) 1 022 644
Consolidated financial statements •87•

•88• Consolidated financial statements
Notes to the consolidated financial statementsfor the year ended 29 February 2016 (continued)
3. INTANGIBLE ASSETSIT software– Cost 103 531 105 602 – Accumulated amortisation and impairment (86 116) (80 341)
17 415 25 261
IT software– Carrying value at beginning of the year 25 261 37 568 – Additions at cost 3 796 5 085 – Disposals at cost (5 867) (22 064)– Disposals accumulated amortisation 5 843 21 934 – Transfers — (569)– Current amortisation (11 618) (16 693)
Carrying value at end of the year 17 415 25 261
Since 2010, the Group has implemented the financial, workshop, truck rental, linehaul and material handling equipment rental modules of Embrace Software.
The carrying value of this software is R2 427 000 (2015: R4 452 000).
The maximum remaining amortisation period of this software is 5 years (2015: 5 years).
4. GOODWILLCore Logistix – Cost 10 670 — – Accumulated impairment — —
10 670 —
Carrying value at beginning of the year — —Addition through business combination 10 670 —
Carrying value at end of the year 10 670 —
In accordance with accounting standards, the Company performs an annual test for impairment of the cash-generating unit to which goodwill is attributed. The recoverable amount of the business has been determined based on a value-in-use calculation.The calculation uses cash flow projections based on financial budgets approved by management and a discount rate at the weighted average cost of capital of 13%. Cash flows have been projected for a period of 10 years at 12% growth for the first two years and at 6% growth thereafter. These growth rates were derived from management-approved budgets, while extrapolating a steady growth rate for the longer term. Management believe that a 10 year forecast period is justified due to the long-term nature of logistics-related businesses.The impairment calculations performed estimated the recoverable amount of the business at R16 366 000. As this amount is greater than the net asset value of the business, no impairment of goodwill associated to the business is considered necessary.Management believes that any reasonable change in any of these key assumptions would not cause the carrying amount of goodwill to exceed the recoverable amount.
R’000 2016 2015

5. LOAN RECEIVABLESKR Marketing CCThis loan is interest free. An extension of payment terms was granted during the previous financial year. Consequently, the loan is repayable by 31 March 2017 (2015: Repayable by 31 March 2017). M Padiyachy, R Lazarus and K Padiyachy have bound themselves jointly and severally as surety and co-principal debtor for the loan. 1 776 1 568
The Group entered into the loan agreement with SKR Marketing CC as the Group wishes to assist in the development, sustainability and ultimate financial and operational independence of this entity.
The fair value of the loan receivable approximates the carrying amount.
The credit quality of the loan receivable can be assessed by reference to historical information about counterparty default rates. There have been no defaults in the past.
The maximum exposure to credit risk is the fair value of the loan shown above.
6. EQUITY-ACCOUNTED INVESTEESInterest in associate 173 154Interest in joint venture 140 80
313 234
A. Interest in associateValue SA (Pty) Limited Shares at cost, representing a 30% interest * * Share of retained income 173 154
– Balance at beginning of the year 154 125 – Group’s share of net profit after tax 19 29
173 154
Value SA Proprietary Limited is involved in the business of procuring maintenance, transport, forklift hire, warehousing services, car rental and other transport, distribution and logistics related contracts from national government, provincial governments and parastatals. The principal place of business is South Africa.
B. Interest in joint ventureValue Logistics (Hong Kong) Co. Limited
Shares at cost, representing a 50% interest 45 45 Share of retained income 95 35
– Balance at beginning of the year 35 — – Group’s share of net profit after tax 60 35
140 80
Value Logistics (Hong Kong) Co. Limited is a joint venture operation aimed at increasing international forwarding and forwarding-related business. The principal place of business is China.
Directors’ valuation of unlisted investments R313 000 (2015: R234 000).
The separate financial statements of these entities are not material to the Group.*Nominal amount.
R’000 2016 2015
Consolidated financial statements •89•

•90• Consolidated financial statements
Notes to the consolidated financial statementsfor the year ended 29 February 2016 (continued)
7. DEFERRED TAXBalance at beginning of the year 171 084 168 574Temporary differences 2 813 2 523Translation difference 76 (13)Assessed loss recognised (896) —
Balance at end of the year 173 077 171 084
Analysis of significant temporary differences:Accelerated allowances on property, vehicles, plant and equipment 198 169 192 051Finance lease obligation (58) (131)Future rental expense payable (1 526) (4 739)Bad debt provision (4 472) (3 881)Accruals and provisions (17 960) (12 022)Fair value adjustments (233) (183)Tax losses (896) —Unrealised foreign exchange differences 53 (11)
173 077 171 084
Comprising:Deferred tax liability 177 836 174 217Deferred tax asset (4 759) (3 133)
Balance at end of the year 173 077 171 084
8. INVENTORIESMaintenance spares 15 341 14 393
– Cost 21 332 21 379– Write down (5 991) (6 986)
Materials handling equipment 26 618 14 272Fuel 6 562 5 876Rental vehicles held for sale 9 707 15 461
– Opening balance 15 461 20 601– Impairments (2 252) (119)– Transfer from property, vehicles, plant and equipment 34 082 60 699– Disposals (37 584) (65 720)
Rental materials handling equipment held for sale 1 727 1 741
– Opening balance 1 741 3 160– Transfer from property, vehicles, plant and equipment 1 605 914– Disposals (1 619) (2 333)
Beverages 38 —
59 993 51 743
Materials handling equipment recognised as an expense 9 002 13 168Carrying value of inventories carried at fair value less costs to sell 2 351 4 196None of the inventory items reflected above have been pledged as security.
R’000 2016 2015

9. TRADE AND OTHER RECEIVABLESTrade receivables 270 120 257 460
VAT 447 184
Other receivables 5 557 5 217
276 124 262 861
Credit quality of trade receivables
The credit quality of trade receivables that are neither past due, nor impaired is assessed by reference to external credit ratings where available or to historical information about counterparty default rates.
External credit ratings are obtained through the use of a credit vetting agency and/or by obtaining references from the customer’s existing suppliers. The Group generally does credit dealings with larger companies that have a sound credit standing.
Historic levels of customer defaults are minimal and as a result the credit quality of year-end trade receivables which are not past due is considered to be high.
Trade and other receivables are classified as loans and receivables.
Trade receivables past due but not impaired
At end February the following amounts were past due but not impaired
The ageing of amounts past due but not impaired is as follows:
– Over 60 days 3 330 6 188
– Over 90 days 11 555 898
14 885 7 086
Trade receivables impaired
At end February the following trade receivables were impaired and provided for.
The ageing of the trade receivables relating to the provision is as follows:
– Current 3 256 1 275
– Over 30 days 126 713
– Over 60 days 1 771 372
– Over 90 days 18 950 1 446
– Over 120 days 364 19 178
24 467 22 984
R’000 2016 2015
Consolidated financial statements •91•

•92• Consolidated financial statements
Notes to the consolidated financial statementsfor the year ended 29 February 2016 (continued)
9. TRADE AND OTHER RECEIVABLES (continued)
Reconciliation of provision for impairment of trade receivablesOpening balance 22 984 22 087Provision for impairment 2 898 1 407Amounts written off as uncollectable (1 415) (510)
24 467 22 984
The creation and release of the provision for impaired trade receivables has been included in operating expenses in the statement of comprehensive income (note 18). The provision was calculated based on the days outstanding, the activity on the account and the amount to be recovered. All accounts over 60 days with no activity on the account were provided for in full. Accounts that were over 60 days with activity on the account were provided for at a rate of 75%.
Amounts charged to the allowance account are generally written off when there is no expectation of recovering additional cash.
Fair value of trade and other receivables 276 124 262 861
Trade receivables of R264 233 000 have been ceded to First National Bank, a division of First Rand Limited (2015: R256 395 000 ceded to Nedbank) as security for banking facilities granted. The maximum exposure to credit risk at the reporting date is the fair value of each class of receivable mentioned above.
10. CASH AND CASH EQUIVALENTSCash on hand 892 818Bank balances 100 387 126 496
101 279 127 314
Cash and cash equivalents are classified as held-for-trading financial assets. Cash and cash equivalents are measured at fair value.
The maximum exposure to credit risk at the reporting date is the carrying amount.
The Group only deposits with major banks with high quality credit standing. For this reason the credit quality at year-end of cash and cash equivalents are considered to be high.
11. NON-CURRENT ASSETS HELD FOR SALEMotor vehicles and accessories:– Net book value at beginning of the year 951 97– Transfer from property, vehicles, plant and equipment 1 221 5 997– Disposals (2 016) (5 143)
Net book value at end of the year 156 951
In line with the Group’s replacement policy, motor vehicles which need to be replaced are identified and disposed of within 12 months.
R’000 2016 2015

12. SHARE CAPITAL AND PREMIUMAuthorised share capital500 000 000 ordinary shares of 0,1 cent each 500 50010 429 010 A ordinary shares of 0,1 cent each 10 10
Issued share capital186 427 478 (2015: 198 627 386) ordinary shares of 0,1 cent each 186 19810 429 010 A ordinary shares of 0,1 cent each 10 10Share premium 10 643 10 643
10 839 10 851
The A ordinary shares rank pari passu with the ordinary shares in respect of voting rights, but do not participate in distributions by the Company to its shareholders until converted into ordinary shares. The A ordinary shares are unlisted, and will automatically convert into ordinary shares on a one-for-one basis on the seventh anniversary of the scheme effective date, subject to repurchase rights held by the Company. Full details of the rights, privileges and conditions attaching to the A ordinary shares are set out in the circular to shareholders dated 1 July 2010 and additional information is contained in note 30.
Number of shares 2016 2015
Movement in issued ordinary sharesNumber of shares outstanding at the beginning of the period 198 627 386 198 627 386Shares cancelled (12 199 908) —
Number of shares outstanding at the end of the period 186 427 478 198 627 386
Treasury sharesOrdinary sharesShares held by special purpose entitiesDiplobuzz Investments (RF) Proprietary Limited 6 257 406 6 257 406Opsiweb Investments (RF) Proprietary Limited 14 600 614 14 600 614The Value Group Share Incentive Trust 739 790 739 790
– Opening balance 739 790 1 089 580– Utilised for options which were exercised — (349 790)
Shares held by subsidiary companyValue Logistics Limited 10 440 262 18 707 521
Opening balance 18 707 521 13 066 492 Acquired during the year 3 932 649 5 641 029 Shares cancelled (12 199 908) —
32 038 072 40 305 331
Average price paid for repurchased equity securities (Rand) 4,18 4,56 A ordinary sharesShares held by special purpose entityThe Value Group Empowerment Trust 10 429 010 10 429 010
R’000 2016 2015
Consolidated financial statements •93•

•94• Consolidated financial statements
Notes to the consolidated financial statementsfor the year ended 29 February 2016 (continued)
13. INTEREST-BEARING BORROWINGSInstalment sales agreementsLiabilities under instalment sale agreements, which bear interest at rates varying between 0,7% below the prime bank overdraft rate and 1,25% below the prime bank overdraft rate (2015: rates between 1,25% below the prime bank overdraft rate and 1,3% below the prime bank overdraft rate). The loans are repayable in monthly instalments of R9 502 000 (2015: R10 507 000) and are secured by vehicles having a carrying value of R364 885 000 (2015: R379 629 000). 249 157 270 652
Mortgage bondsLoans secured by mortgage bonds over property having a carrying value of R36 720 000 (2015: R36 938 000). The loans bear interest at rates varying from the prime bank overdraft rate less 0,5% and the prime bank overdraft rate less 1% (2015: prime bank overdraft rate less 0,5% and the prime bank overdraft rate less 1%) and are repayable by September 2022 in monthly instalments of R228 000 (2015: R220 000).
13 438 8 334Finance lease obligation
The Group entered into finance leases for computer hardware in 2012 and 2013. The leases are secured by computer hardware, the carrying value of which is disclosed in note 2.
The lease term is five years and the average effective borrowing rate is 5%, which was fixed at the contract date. The liability is repayable in quarterly instalments amounting to R620 000 (2015: R620 000). 1 895 4 217Minimum lease payments due:– Within one year 1 591 2 481– In second to fifth year inclusive 350 1 942– Future finance charges (46) (206)
264 490 283 203
Long-term portion of interest-bearing borrowings 163 346 181 230Current portion of interest-bearing borrowings 101 144 101 973
264 490 283 203
The Company and its subsidiaries have unlimited borrowing powers in terms of their articles of association.Interest-bearing borrowings are stated at amortised cost. The fair value of interest-bearing borrowings approximates the carrying amount.
R’000 2016 2015

14. NON-INTEREST-BEARING BORROWINGSVendor for acquisitionUnsecured, interest free loan. This loan has been raised in favour of Nucleus Chain Stores Proprietary Limited (“Nucleus”). This loan is outstanding under a contingent consideration arrangement. Additional information regarding the contingent consideration arrangement can be found in note 32.1 of these financial statements. 3 802 —
Loan by outside shareholderUnsecured, interest free loan. This loan has been raised in favour of an outside shareholder in terms of the sale agreement dated 9 December 2014 between Core Logistix Proprietary Limited and Nucleus. 1 774 —
15. TRADE AND OTHER PAYABLES Trade payables 218 679 210 829VAT 17 723 17 493Other payables 88 722 84 384
325 124 312 706
Trade and other payables are measured at amortised cost.
Included in other payables are the following significant provisions:
R’000Customer
claimsInsurance
loss Total
Carrying value at beginning of the year 15 717 8 692 24 409
Charged to profit and loss (958) (193) (1 151)
Amounts added 6 947 8 566 15 513
Unused amounts reversed (7 905) (8 759) (16 664)
Amounts utilised (299) — (299)
Carrying value at end of the year 14 460 8 499 22 959
All provisions are re-assessed on a continual basis.
R’000 2016 2015
16. OTHER FINANCIAL (ASSET)/LIABILITYMark to market of foreign exchange contacts. (41) 317
17. REVENUEServices rendered 1 958 307 1 915 551 Sale of goods 33 308 27 665 Sale of assets held for rental 52 062 74 599 Insurance contracts 18 736 20 538
2 062 413 2 038 353
R’000 2016 2015
Consolidated financial statements •95•

•96• Consolidated financial statements
Notes to the consolidated financial statementsfor the year ended 29 February 2016 (continued)
18. OPERATING PROFIT ON ORDINARY ACTIVITIES IS STATED AFTER:Auditors’ remuneration – audit fees 2 902 3 493 Depreciation 102 911 99 318 Amortisation of intangible assets 11 618 16 693 Impairment of trade and other receivables 2 898 1 407 Impairment of inventories 1 257 1 807Loss on disposal of property, vehicles, plant and equipment 3 703 4 203 Loss on disposal of non-current assets held for sale 91 526 Loss on disposal of intangible assets 24 130 Profit on disposal of rental assets (12 860) (6 546) Loss on foreign exchange 5 050 855 Lease rentals 160 361 140 402
– Premises 157 284 136 388– Equipment 3 077 4 014
Retirement benefit costs– Defined contribution plan expense 38 847 37 833Staff costs 672 745 632 407
Depreciation increased by R691 000 in the current year (2015: R1 567 000) due to a change in the estimated residual values of certain asset categories.
R’000Fees forservices
Basicsalaries Allowances
Providentfund
contributions Other Total
Directors’ remuneration2016ExecutiveSD Gottschalk — 3 788 127 — 85 4 000CL Sack — 3 640 78 302 76 4 096M Padiyachy — 2 232 97 185 70 2 584
— 9 660 302 487 231 10 680
Non-executiveCD Stein 754 — — — — 754IM Groves 658 — — — — 658NM Phosa 458 — — — — 458VW Mcobothi 440 — — — — 440
2 310 — — — — 2 310
2 310 9 660 302 487 231 12 990
R’000 2016 2015

R’000Fees forservices
Basicsalaries Allowances
Providentfund
contributions Other Total
18. OPERATING PROFIT ON ORDINARY ACTIVITIES IS STATED AFTER: (continued)Directors’ remuneration2015ExecutiveSD Gottschalk — 3 809 127 — 64 4 000CL Sack — 3 403 78 294 372 4 147M Padiyachy — 2 086 97 180 149 2 512
— 9 298 302 474 585 10 659
Non-executiveCD Stein 704 — — — — 704IM Groves 576 — — — — 576NM Phosa 402 — — — — 402VW Mcobothi 384 — — — — 384
2 066 — — — — 2 066
Total 2 066 9 298 302 474 585 12 725
R’000 2016 2015
19. INVESTMENT INCOMEInterest received on loans and deposits 1 454 2 840Fair value adjustment to revenue 13 177 10 671
14 631 13 511
20. FINANCE COSTSLong-term borrowings 21 744 21 493Fair value adjustment 7 513 8 648Bank and short-term borrowings 1 494 21Other 181 135
30 932 30 297
Consolidated financial statements •97•

•98• Consolidated financial statements
Notes to the consolidated financial statementsfor the year ended 29 February 2016 (continued)
21. TAXATIONSouth African normal tax– Current year 16 837 21 292 – Securities transfer tax 135 —
16 972 21 292 Deferred tax– Current year 1 917 2 523
Tax for the year 18 889 23 815
Reconciliation of rate of taxation % %South African normal tax rate 28,0 28,0Adjusted for:– Special allowances (2,5) (2,2)– Effect of tax rates in foreign jurisdictions 0,3 0,1– Securities transfer tax 0,2 —– Previously unrecognised deferred tax asset (0,2) —
Effective rate 25,8 25,9
22. EARNINGS PER SHAREThe calculation of attributable and headline earnings per share is based on the weighted average number of ordinary shares. The calculation is reconciled as follows:Earnings on which basic earnings per share is based 54 929 68 432Loss on disposal of property, vehicles, plant and equipment, Gross: R3 703 000 (2015: R4 203 000), less taxation 2 694 3 038Loss on disposal of non-current assets held for sale, Gross: R91 000 (2015: R526 000), less taxation 66 379Loss on disposal of intangible assets, Gross: R24 000 (2015: R130 000), less taxation 17 94
Earnings on which headline earnings per share is based 57 706 71 943
Number of shares
Weighted average shares outstandingWeighted average shares outstanding for basic and headline earnings per share 155 216 667 162 673 657 Effect of weighting — (4 351 602) Potentially dilutive ordinary shares resulting from outstanding options 139 407 5 706 392
Weighted average shares outstanding for diluted and diluted headline earnings per share 155 356 074 164 028 447
R’000 2016 2015

23. SEGMENT ANALYSISIn terms of IFRS 8 Operating Segments the chief operating decision-maker has been identified as the Group’s executive directors. Operating segments have been identified based on the Group’s internal reporting reviewed by the Group’s executive directors for assessing performance and making strategic decisions.
The Group’s operating segments are General distribution, Truck rental and other, and Head office and other. Operational divisions with similar economic characteristics and specialised resource and infrastructure requirements have been aggregated. Refer to pages 8 and 9 for more details on operational divisions.
The general distribution activities include break-bulk and single party distribution and warehousing services to a wide range of customers in the automotive, fast moving consumer goods (FMCG), electronics, chemical, textile, packaging, mining, construction, telecommunications and pharmaceutical industries.
The Truck rental and other activities include fleet management, forklift and commercial vehicle rental and leasing, clearing and forwarding and container handling.
The Head office and other activities include the costs of a management services company, financing structures, secretarial, compliance and internal audit functions, treasury and insurance. Head office costs are allocated to operating segments where appropriate.
Operating segment results have been reconciled to the Group’s net profit before taxation in the tables that follow. External revenue, total assets and trade and other payables as disclosed in the segment analysis agree to the corresponding amounts as disclosed in the annual financial statements. Inter-segment transfer pricing is determined by management in a similar manner to transactions with third parties. During the current year, revenues from an individual customer did not exceed 10% of total Group revenues. During the prior year, revenues from an individual customer amounted to R210 927 000 or 10% of total Group revenues. The General distribution segment accounted for 99% of the R210 927 000 in its reported revenue, with the remaining 1% in the Truck rental and other segment.
The Group operates primarily in South Africa and as such no geographical segments have been disclosed as economic and political conditions, relationships between operations, underlying currency risk and special risk associated with operations are similar within the different regions in South Africa.
Consolidated financial statements •99•
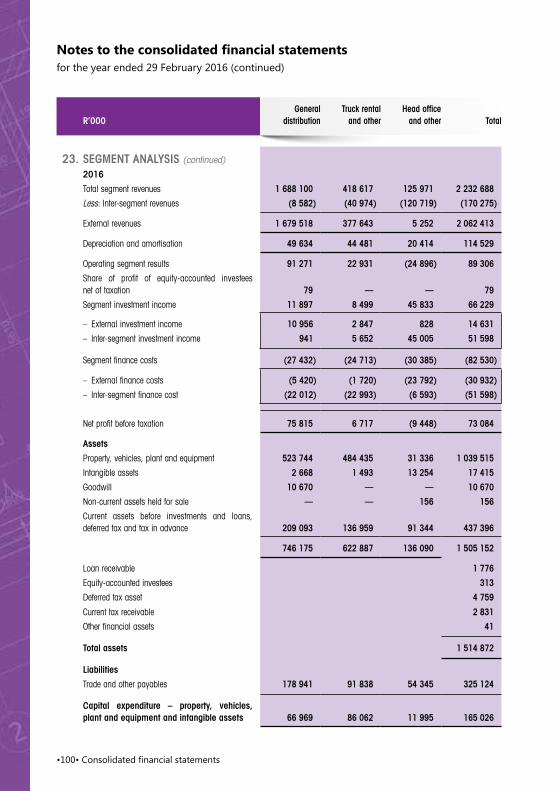
•100• Consolidated financial statements
Notes to the consolidated financial statementsfor the year ended 29 February 2016 (continued)
R’000General
distributionTruck rental
and otherHead office
and other Total
23. SEGMENT ANALYSIS (continued)
2016
Total segment revenues 1 688 100 418 617 125 971 2 232 688
Less: Inter-segment revenues (8 582) (40 974) (120 719) (170 275)
External revenues 1 679 518 377 643 5 252 2 062 413
Depreciation and amortisation 49 634 44 481 20 414 114 529
Operating segment results 91 271 22 931 (24 896) 89 306
Share of profit of equity-accounted investees net of taxation 79 — — 79
Segment investment income 11 897 8 499 45 833 66 229
– External investment income 10 956 2 847 828 14 631
– Inter-segment investment income 941 5 652 45 005 51 598
Segment finance costs (27 432) (24 713) (30 385) (82 530)
– External finance costs (5 420) (1 720) (23 792) (30 932)
– Inter-segment finance cost (22 012) (22 993) (6 593) (51 598)
Net profit before taxation 75 815 6 717 (9 448) 73 084
Assets
Property, vehicles, plant and equipment 523 744 484 435 31 336 1 039 515
Intangible assets 2 668 1 493 13 254 17 415
Goodwill 10 670 — — 10 670
Non-current assets held for sale — — 156 156
Current assets before investments and loans, deferred tax and tax in advance 209 093 136 959 91 344 437 396
746 175 622 887 136 090 1 505 152
Loan receivable 1 776
Equity-accounted investees 313
Deferred tax asset 4 759
Current tax receivable 2 831
Other financial assets 41
Total assets 1 514 872
Liabilities
Trade and other payables 178 941 91 838 54 345 325 124
Capital expenditure – property, vehicles, plant and equipment and intangible assets 66 969 86 062 11 995 165 026

R’000General
distributionTruck rental
and otherHead office
and other Total
23. SEGMENT ANALYSIS (continued)
2015
Total segment revenues 1 658 564 417 522 121 815 2 197 901
Less: Inter-segment revenues (5 621) (33 374) (120 553) (159 548)
External revenues 1 652 943 384 148 1 262 2 038 353
Depreciation and amortisation 51 208 42 834 21 969 116 011
Operating segment results 111 727 22 651 (25 681) 108 697
Share of profit of equity-accounted investees net of taxation 64 — — 64
Segment investment income 9 175 7 453 40 916 57 544
– External investment income 8 651 2 268 2 592 13 511
– Inter-segment investment income 524 5 185 38 324 44 033
Segment finance costs (24 761) (21 919) (27 650) (74 330)
– External finance costs (6 250) (2 106) (21 941) (30 297)
– Inter-segment finance cost (18 511) (19 813) (5 709) (44 033)
Net profit before taxation 96 205 8 185 (12 415) 91 975
Assets
Property, vehicles, plant and equipment 532 758 453 739 36 147 1 022 644
Intangible assets 3 454 2 379 19 428 25 261
Non-current assets held for sale — — 951 951
Current assets before investments and loans, deferred tax and tax in advance 176 687 135 137 130 094 441 918
712 899 591 255 186 620 1 490 774
Loan receivable 1 568
Equity-accounted investees 234
Deferred tax asset 3 133
Current tax receivable 2 328
Total assets 1 498 037
Liabilities
Trade and other payables 150 936 104 136 57 634 312 706
Capital expenditure – property, vehicles, plant and equipment and intangible assets 124 224 67 350 21 513 213 087
Consolidated financial statements •101•
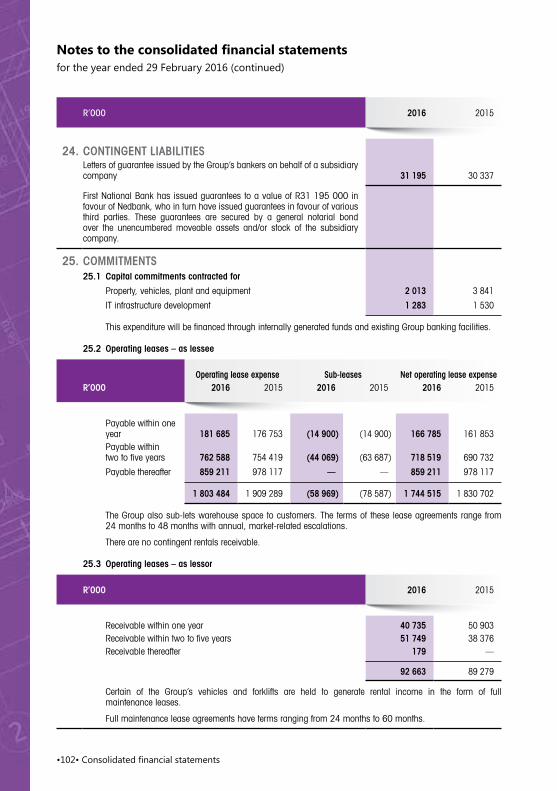
•102• Consolidated financial statements
Notes to the consolidated financial statementsfor the year ended 29 February 2016 (continued)
24. CONTINGENT LIABILITIESLetters of guarantee issued by the Group’s bankers on behalf of a subsidiary company 31 195 30 337
First National Bank has issued guarantees to a value of R31 195 000 in favour of Nedbank, who in turn have issued guarantees in favour of various third parties. These guarantees are secured by a general notarial bond over the unencumbered moveable assets and/or stock of the subsidiary company.
25. COMMITMENTS25.1 Capital commitments contracted for
Property, vehicles, plant and equipment 2 013 3 841
IT infrastructure development 1 283 1 530
This expenditure will be financed through internally generated funds and existing Group banking facilities.
25.2 Operating leases – as lessee
Operating lease expense Sub-leases Net operating lease expenseR’000 2016 2015 2016 2015 2016 2015
Payable within one year 181 685 176 753 (14 900) (14 900) 166 785 161 853Payable within two to five years 762 588 754 419 (44 069) (63 687) 718 519 690 732
Payable thereafter 859 211 978 117 — — 859 211 978 117
1 803 484 1 909 289 (58 969) (78 587) 1 744 515 1 830 702
The Group also sub-lets warehouse space to customers. The terms of these lease agreements range from 24 months to 48 months with annual, market-related escalations.
There are no contingent rentals receivable.
25.3 Operating leases – as lessor
R’000 2016 2015
Receivable within one year 40 735 50 903 Receivable within two to five years 51 749 38 376 Receivable thereafter 179 —
92 663 89 279
Certain of the Group’s vehicles and forklifts are held to generate rental income in the form of full maintenance leases.
Full maintenance lease agreements have terms ranging from 24 months to 60 months.
R’000 2016 2015

26. RELATED PARTIESRelated-party transactions exist between the Group companies. All purchasing and selling transactions are concluded at arm’s length.
Leases on properties have been entered into with companies controlled by a director, Mr SD Gottschalk. The risk of continuity of securing the premises, which are integral to the Group’s operations, is therefore reduced. All rentals and rental escalations on these properties are determined by independent valuers taking into account the future prospects and demand for properties in the area with reference to rentals achieved and vacancy rates, as well as the condition and state of improvements of the said properties. At the request of the Board, the Group’s auditors conducted an independent review of a number of the material related party leases, where it was concluded that the rental valuations formed a reasonable basis for determining the rentals on the related party leases.
Escalations on these leases vary from 8% to 9%, and the lease periods range from month to month to 10 years. Most lease rentals are again independently assessed every two to five years and lease rentals and escalations are then adjusted to align these with current market conditions. This specific reassessment is viewed by the Group as being advantageous since this condition is not normally available in the market place. The lease commitments, where escalations are reassessed, have been calculated based on the remaining period of the various agreements by applying the estimated escalations over the full period of the lease. Where renewal is certain, future lease commitments in relation to property leases to be renewed in the 2017 financial year have been estimated.
Property lease rentals paid to companies controlled by SD Gottschalk and associated future estimated lease commitments are as follows:
Current Due within 1 year Due thereafterR’000 2016 2015 2016 2015 2016 2015
Gauteng 99 796 87 067 102 702 94 809 1 046 232 1 091 797Western Cape 20 884 4 244 24 275 22 066 267 972 292 247 KwaZulu-Natal 27 036 21 151 30 145 27 684 232 435 262 579 Eastern Cape 11 156 11 048 12 695 10 485 58 693 61 106 Namibia 1 444 1 325 1 574 1 444 9 503 11 050 Free State 929 1 631 2 352 2 178 2 934 5 286 Mpumalanga 1 465 1 461 1 269 1 542 475 4 031 North West 2 061 1 945 1 230 1 785 1 611 2 901 Limpopo 1 047 948 1 105 1 023 93 1 198 Northern Cape 474 425 200 463 — 200
166 292 131 245 177 547 163 479 1 619 948 1 732 395
R’000 Notes 2016 2015
Revenue earned from associate company: – Value SA (Pty) Limited 6 2 039 2 785Included in trade receivables are amounts receivable from related parties:Companies controlled by a director, SD Gottschalk– Trade receivables 82 33Equity-accounted investees– Trade receivables 180 207Loan due by related party:– SKR Marketing CC 5 1 776 1 568
Consolidated financial statements •103•

•104• Consolidated financial statements
Notes to the consolidated financial statementsfor the year ended 29 February 2016 (continued)
27. RETIREMENT BENEFITSDefined contribution plan
Currently subsidiary companies provide retirement benefits to 91% (2015: 90%) of their employees. A defined contribution provident fund, which is subject to the Pension Funds Act, exists for this purpose. The scheme is funded both by member and company contributions, which are charged to the income statement as they are incurred. The Group is under no obligation to cover any unfunded benefits. The Group’s contribution to the above scheme was R38 847 000 (2015: R37 833 000).
Medical aid
The Group does not provide any post-retirement medical benefits.
28. RISK MANAGEMENTCapital risk management
The capital structure of the Group consists of equity attributable to equity holders of the Group which comprises issued share capital and premium, the share-based payment reserve and accumulated profits as disclosed in the statement of changes in equity, borrowings as disclosed under note 13 and cash and cash equivalents as disclosed under note 10.
The Group’s capital management objective is to meet its liquidity requirements, to repay borrowings as they fall due, to continue as a going concern, to ensure there is sufficient capital available for the funding requirements of the Group (including capital expenditure) and to maximise shareholders’ returns and reduce cost of capital.
The Group is in a net asset position at year-end. The Group is in a net current asset position at year-end, has repaid all borrowings as they fall due during the year and is able to meet its liquidity requirements. Based on the budget and forecast for the following year, the Group has sufficient capital available for its funding requirements, to maximise shareholders’ returns and to continue as a going concern.
The Group’s capital management policy is to hold sufficient capital as management believes is necessary to ensure that obligations can always be met on a timely basis and to maintain a positive net assets and net current assets position.
Group transactional banking facilities consist of the following:
● Short term working capital facilities of R100 million secured by a cession of trade receivables;
● Guarantee facility of R40 million secured by a general notarial bond over unencumbered moveable assets and/or stock to the value of R40 million; and
● Forward exchange facilities of R8 million.
The bank balances fluctuate on a daily basis, however at year-end there was no bank overdraft.
A subsidiary of the Group has to maintain covenant ratios and metrics in relation to the banking facilities granted by the subsidiary’s bankers during the 2016 financial year as follows:
● Total senior debt: EBITDA must not exceed 1.5 times; and
● Shareholders’ interest must not reduce below R580 million.
These covenant conditions were met.
A subsidiary of the Group has combined asset based funding facilities of R314,7 million of which R63,6 million was available at year end. These facilities are secured by vehicles and IT hardware as detailed in note 13.
Subsequent to year-end, loan funding facilities of R38,9 million was granted to a subsidiary of the Group. This funding was partly utilised to settle the mortgage bond as detailed in note 13. This loan is secured by a mortgage bond over the Mahogany Ridge property and a subordination agreement between the subsidiary company and the Group, in favour of the bank.
The following covenants are in place as regards this mortgage bond:
● EBITDA: Net interest must not be less than 2 times; and
● Net debt: EBITDA must not exceed 2.25 times.

28. RISK MANAGEMENT (continued)
Financial risk management
The Group’s activities expose it to a variety of financial risks: credit risk, liquidity risk and market risk (including currency risk and interest rate risk). The Group’s overall risk management programme focuses on the unpredictability of financial markets and seeks to minimise potential adverse effects on the Group’s financial performance.
Currency riskThe Group’s non-South African operations are small in relation to its total operations. Where possible, foreign entities match their assets and liabilities in the same currency to avoid unnecessary currency exposures.
Fair value hedges
The Group is exposed to foreign exchange risk as it imports materials handling equipment and spares. Hedging instruments are used to reduce the risks arising from foreign currency fluctuations against the Group’s own currency.
It is the Group’s policy to take out forward cover on all substantial foreign transactions, and review its foreign currency exposure, including commitments on an ongoing basis. The Group expects its foreign exchange contracts to hedge foreign exchange exposure. The Group does not use FECs for speculative purposes and does not apply cash flow hedge accounting.
Details of each outstanding forward exchange contract are as follows:
Amount in foreign currency purchased Forward exchange rate Maturity date
As at 29 February 2016
23 234 Euro (EUR) 1 EUR = 17,3784 ZAR 16 March 2016
As at 28 February 2015
88 697 Botswana Pula (BWP) 0,8265 BWP = R1 3 March 201523 921 Euro (EUR) 1 EUR = 13,0945 ZAR 13 March 20157 016 Euro (EUR) 1 EUR = 13,0945 ZAR 13 March 201543 410 Euro (EUR) 1 EUR = 13,1012 ZAR 16 March 20157 074 000 Japanese Yen (JPY) 10,1940 JPY = 1 ZAR 24 March 201521 780 000 Japanese Yen (JPY) 10,1886 JPY = 1 ZAR 27 March 2015197 394 Euro (EUR) 1 EUR = 13,1577 ZAR 10 April 2015
At year-end the forward exchange contracts were hedging amounts payable for materials handling equipment that was shipped free on board before year-end. Settlement of the creditor occurred after year-end. The risk being hedged is an exchange loss due to an unfavourable movement in the exchange rate between the Rand and the Euro. After the recognition of the materials handling equipment, the forward exchange contracts will continue to hedge the trade payable.
The Group’s loss on hedging instruments for the year was R4 490 000 (2015: loss of R875 000).
At 29 February 2016, if the Rand had weakened/strengthened by 10% against the various foreign currencies with all other variables held constant, pre-tax profit for the year would have been R973 000 (2015: R747 000) lower/higher.
Consolidated financial statements •105•

•106• Consolidated financial statements
Notes to the consolidated financial statementsfor the year ended 29 February 2016 (continued)
28. RISK MANAGEMENT (continued)
Interest rate risk
The Group’s interest rate risk arises principally from long-term borrowings. Borrowings raised at variable rates expose the Group to cash and interest rate risk. Borrowings raised at fixed rates expose the Group to fair value interest rate risk. The Group analyses its interest rate exposure on a dynamic basis. Various scenarios are simulated taking into consideration refinancing, renewal of existing positions and alternative financing. Based on these scenarios, the Group calculates the impact on profit and loss of a defined interest rate shift. For each simulation, the same interest rate shift is used for all currencies. The scenarios are run only for liabilities that represent the major interest-bearing positions. Based on the simulations perceived, the impact on pre-tax profit of a 50 basis point shift in the interest rate would be a maximum increase/decrease of R1 322 000 (2015: R1 416 000). The simulation is done on a regular basis to verify that the maximum loss potential is within the limit given by management.
Credit risk
Credit risk is the risk of financial loss to the Group if a customer or counterparty to a financial instrument fails to meet its contractual obligations. Financial assets which potentially subject the Group to concentrations of credit risk consists mainly of cash deposits, cash equivalents, trade and other receivables, investments and loans receivable.
Management’s objectives for managing credit risk is to minimise the Group’s exposure. The Group has adopted a policy of only dealing with creditworthy counterparties as a means of mitigating the risk of financial defaults. The Group’s exposure is continuously monitored and the aggregate value of transactions concluded is spread amongst approved counterparties. Credit exposure is controlled by counterparty limits that are reviewed and approved by management.
Cash and cash equivalents
The Group only deposits cash with major banks with high quality credit standing and limits exposure to any one counterparty. For this reason the Group does not consider there to be any significant concentration of credit risk.
Trade and other receivables
Trade receivables comprise a widespread customer base spread across diverse industries and geographical areas. Management evaluated credit risk relating to customers on an ongoing basis. Accordingly, the Group has no significant concentration of credit risk.
Investments
These comprise of the Group’s investments in equity-accounted investees. The exposure to credit risk is not significant as the value of the investments is not material.
Loan receivable
This comprises a loan due from a related party, SKR Marketing CC. The exposure to credit risk is not significant as the members have bound themselves jointly and severally as surety and co-principal debtor of the loan. There have been no defaults in the past.
Liquidity risk
Liquidity risk is the risk that the Group will not be able to meet its financial obligations as they fall due. The Group manages liquidity risk by maintaining adequate reserves, banking facilities and reserve borrowing facilities and by continuously monitoring cash flows. Cash flow forecasts are prepared and adequate utilised borrowing facilities are monitored. The table below analyses the Group’s financial liabilities at the financial year-end into relevant maturity groupings. The amounts disclosed in the table are the contractual undiscounted cash flows. Balances due within 12 months equal their carrying balances as the impact of discounting is not significant.

28. RISK MANAGEMENT (continued)
R’000Less than
1 yearBetween
1 and 5 yearsMore than
5 years
At 29 February 2016Interest-bearing borrowings 101 144 159 320 4 026 Trade and other payables 325 124 — — Shareholders for dividend 448 — — Non-interest-bearing borrowings — 1 774 —Vendor for acquisition 3 802 — —
At 28 February 2015Interest-bearing borrowings 101 973 175 093 6 137 Trade and other payables 312 706 — — Other financial liability 317 — — Shareholders for dividend 349 — —
Market risk
Market risk is the risk that the fair value of future cash flows of a financial instrument will fluctuate because of changes in market prices. Management’s objectives for managing market risk is to minimise the Group’s exposure.
Financial instruments by category
R’000Loans and
receivables
Fair value through profit or loss – held
for trading
Financial liabilities at
amortised cost
At 29 February 2016Loan receivable 1 776 — — Forward exchange contracts — 41 — Trade receivables 270 120 — — Cash and cash equivalents — 101 279 — Interest-bearing borrowings — — (264 490)Non-interest-bearing borrowings — — (5 576)Trade payables — — (218 679)Other payables — — (31 063)Shareholders for dividend — — (448)
271 896 101 320 (520 256)
At 28 February 2015Loan receivable 1 568 — — Forward exchange contracts — (317) — Trade and other receivables 257 460 — — Cash and cash equivalents — 127 314 — Interest-bearing borrowings — — (283 203)Trade payables — — (210 829)Other payables — — (31 742)Shareholders for dividend — — (349)
259 028 126 997 (526 123)
Consolidated financial statements •107•
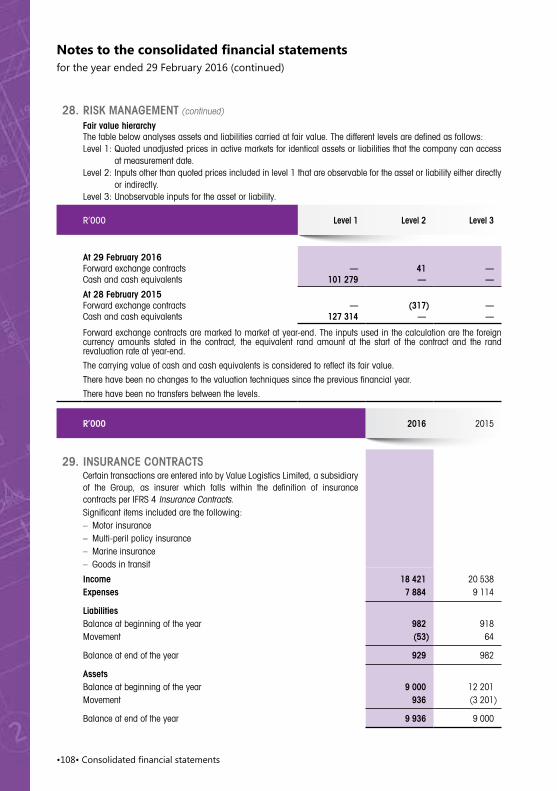
•108• Consolidated financial statements
Notes to the consolidated financial statementsfor the year ended 29 February 2016 (continued)
28. RISK MANAGEMENT (continued)
Fair value hierarchyThe table below analyses assets and liabilities carried at fair value. The different levels are defined as follows:Level 1: Quoted unadjusted prices in active markets for identical assets or liabilities that the company can access
at measurement date.Level 2: Inputs other than quoted prices included in level 1 that are observable for the asset or liability either directly
or indirectly.Level 3: Unobservable inputs for the asset or liability.
R’000 Level 1 Level 2 Level 3
At 29 February 2016Forward exchange contracts — 41 — Cash and cash equivalents 101 279 — —
At 28 February 2015Forward exchange contracts — (317) — Cash and cash equivalents 127 314 — —
Forward exchange contracts are marked to market at year-end. The inputs used in the calculation are the foreign currency amounts stated in the contract, the equivalent rand amount at the start of the contract and the rand revaluation rate at year-end.
The carrying value of cash and cash equivalents is considered to reflect its fair value.
There have been no changes to the valuation techniques since the previous financial year.
There have been no transfers between the levels.
R’000 2016 2015
29. INSURANCE CONTRACTSCertain transactions are entered into by Value Logistics Limited, a subsidiary of the Group, as insurer which falls within the definition of insurance contracts per IFRS 4 Insurance Contracts.Significant items included are the following:– Motor insurance– Multi-peril policy insurance– Marine insurance– Goods in transit
Income 18 421 20 538Expenses 7 884 9 114
LiabilitiesBalance at beginning of the year 982 918Movement (53) 64
Balance at end of the year 929 982
AssetsBalance at beginning of the year 9 000 12 201Movement 936 (3 201)
Balance at end of the year 9 936 9 000

29. INSURANCE CONTRACTS (continued)
The sub-classification of liabilities are claims incurred but not reported (IBNR), and represents approximately 5% (2015: 5%) of income earned from insurance contracts, based on past claims experience. The liabilities will be settled within the next year.
Insurance risk
Value Logistics Limited is a registered financial services provider in terms of the FAIS Act with the Financial Services Board. The objective is to mitigate insurance risk arising from insurance contracts. The principal risk faced under these insurance contracts is that the actual claims exceed the carrying amount of the insurance liabilities. This could occur due to the frequency or severity of claims which may be greater than estimated. Insurance events are random and the actual number and amounts of claims will vary from year to year from the estimate determined using statistical techniques. The key financial risk is that the proceeds from the financial assets are not sufficient to fund the obligations arising from insurance contracts and includes credit risk, interest rate risk, currency risk and liquidity risk.
Risks, which are spread over a large customer base, are managed internally. Risk is concentrated largely to motor insurance which covers the vehicle in the case of an accident as well as damage to third-party property. There is no specific geographical or sectoral concentrated risk. Exposure and sensitivity to insurance risk is limited by reinsuring the comprehensive motor insurance and by limiting the claims on goods in transit, multi-peril and marine insurance cover. The terms and conditions of these insurance contracts therefore do not have a material effect on the amount, timing and uncertainty of cash flows. There are currently no requirements for any additional financial support to the insurance operation.
Significant assumptions
The critical accounting judgements made in applying the Group’s accounting policies relate to the estimation of the ultimate liability arising from claims made under insurance contracts. The Group’s estimate for reported and unreported losses are continually reviewed and updated, and adjustments resulting from this review are reflected in profit or loss. The process relies upon the basic assumption that past experience adjusted for the effect of current developments and likely trends is an appropriate basis for predicting future events. The actual claims incurred did not materially differ from the estimates derived from the critical accounting judgements applied.
Consolidated financial statements •109•
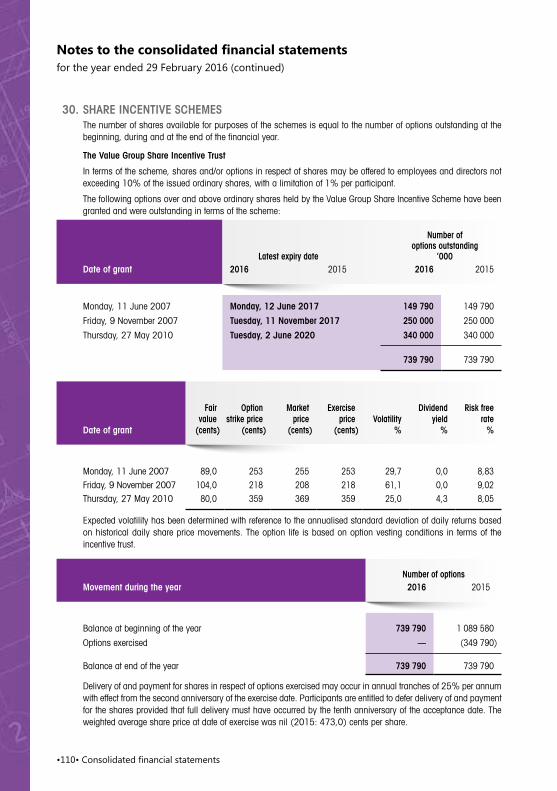
•110• Consolidated financial statements
Notes to the consolidated financial statementsfor the year ended 29 February 2016 (continued)
30. SHARE INCENTIVE SCHEMESThe number of shares available for purposes of the schemes is equal to the number of options outstanding at the beginning, during and at the end of the financial year.
The Value Group Share Incentive Trust
In terms of the scheme, shares and/or options in respect of shares may be offered to employees and directors not exceeding 10% of the issued ordinary shares, with a limitation of 1% per participant.
The following options over and above ordinary shares held by the Value Group Share Incentive Scheme have been granted and were outstanding in terms of the scheme:
Latest expiry date
Number of options outstanding
’000Date of grant 2016 2015 2016 2015
Monday, 11 June 2007 Monday, 12 June 2017 149 790 149 790
Friday, 9 November 2007 Tuesday, 11 November 2017 250 000 250 000
Thursday, 27 May 2010 Tuesday, 2 June 2020 340 000 340 000
739 790 739 790
Date of grant
Fairvalue
(cents)
Optionstrike price
(cents)
Marketprice
(cents)
Exerciseprice
(cents)Volatility
%
Dividendyield
%
Risk freerate
%
Monday, 11 June 2007 89,0 253 255 253 29,7 0,0 8,83Friday, 9 November 2007 104,0 218 208 218 61,1 0,0 9,02Thursday, 27 May 2010 80,0 359 369 359 25,0 4,3 8,05
Expected volatility has been determined with reference to the annualised standard deviation of daily returns based on historical daily share price movements. The option life is based on option vesting conditions in terms of the incentive trust.
Number of optionsMovement during the year 2016 2015
Balance at beginning of the year 739 790 1 089 580
Options exercised — (349 790)
Balance at end of the year 739 790 739 790
Delivery of and payment for shares in respect of options exercised may occur in annual tranches of 25% per annum with effect from the second anniversary of the exercise date. Participants are entitled to defer delivery of and payment for the shares provided that full delivery must have occurred by the tenth anniversary of the acceptance date. The weighted average share price at date of exercise was nil (2015: 473,0) cents per share.

30. SHARE INCENTIVE SCHEMES (continued)
Movements of shares owned by the Value Group Share Incentive Trust and associated loan values were as follows:
Number of shares Loan value R’000Movement during the year 2016 2015 2016 2015
Balance at beginning of the year 739 790 1 089 580 2 141 2 880
Options exercised — (349 790) — —
Repayments — — (106) (942)
Write-up of loan — — — 203
Balance at end of the year 739 790 739 790 2 035 2 141
The scheme owns sufficient shares to issue to participants to satisfy options granted over the Company’s ordinary shares.
Share options granted to executive directors
DirectorStrikedate
Exerciseprice
(cents)
Number ofoptions at
28 February2015*
Optionsgranted
Optionsexercised
Number ofoptions at
29 February2016
CL Sack 2 June 2020 359 340 000 — — 340 000
M Padiyachy 11 November 2017 218 250 000 — — 250 000
590 000 — — 590 000
* Notwithstanding the date of exercise, participants are only entitled to delivery of the shares in Value Group Limited in accordance with the terms of the scheme.
The Value Group Empowerment Trust
The trust was created in 2011 for the benefit of the current and future black employees of the Group who fall within the C and D Peromness bands and who satisfy a set of objective criteria as set by the Board.
Employees must remain in the service of the Group until 23 July 2017 to benefit from the trust.
The trust through its holding of 10 429 010 A ordinary shares holds approximately 5% of the issued capital of the Company.
The trust is divided into 10 429 010 units, which equates to one unit for each A share it holds. The Board will at its discretion nominate the beneficiaries of the trust and the number of units allocated to each employee.
Consolidated financial statements •111•

•112• Consolidated financial statements
Notes to the consolidated financial statementsfor the year ended 29 February 2016 (continued)
30. SHARE INCENTIVE SCHEMES (continued)
The following units have been allocated:
Latest expiry date Number of options outstanding
Date of grant 2016 2015 2016 2015
Friday, 23 July 2010 Sunday, 23 July 2017 2 800 000 3 000 000Thursday, 28 February 2013 Friday, 11 August 2017 3 100 000 3 600 000Tuesday, 24 February 2015 Friday, 11 August 2017 500 000 500 000Wednesday, 25 February 2015 Friday, 11 August 2017 500 000 500 000
6 900 000 7 600 000
Date of grant
Fairvalue
(cents)
Optionstrike price
(cents)
Marketprice
(cents)Volatility
%
Dividendyield
%
Riskfree rate
%
Friday, 23 July 2010 80,6 381 361 24,2 4,4 7,18Thursday, 28 February 2013 224,5 343 560 31,1 3,9 5,31Tuesday, 24 February 2015 145,0 400 469 33,6 2,7 7,64Wednesday, 25 February 2015 145,0 400 469 33,6 2,7 7,64
The option price has been based on the projected notional loan balance on 23 July 2017.
Expected volatility has been determined with reference to the annualised standard deviation of daily returns based on historical daily share price movements. The option life is based on option vesting conditions in terms of the trust deed.
Movement during the year 2016 2015
Balance at beginning of the year 7 600 000 8 000 000
Units allocated — 1 000 000
Units forfeited – resignations (700 000) (1 400 000)
Balance at end of the year 6 900 000 7 600 000
A notional loan has been deemed to attach to the A ordinary shares. On the assumption that all of the units have been allocated, the notional loan amounts to R39 567 000 (2015: R38 488 000) which equates to R3,79 (2015: R3,69) per ordinary share. The notional loan will be increased by notional interest calculated at 72% of the prime bank overdraft rate and decreased by notional distributions which will correspond to distributions to ordinary shareholders. If on 23 July 2017 the notional loan is not repaid, the Group can exercise its right to repurchase sufficient A ordinary shares at the weighted average price of the Group’s ordinary shares over the 30 trading days prior to 23 July 2017 to settle the outstanding notional loan. The remaining A ordinary shares will be converted into ordinary shares on a 1:1 basis and will be transferred to the beneficiaries who have met their service requirements.

30 SHARE INCENTIVE SCHEMES (continued)
BEE transaction
The Company entered into agreements in May 2010 in terms of which it issued 14 600 614 ordinary shares to Opsiweb Investments (RF) Proprietary Limited, an SPV owned by a trust controlled by Dr Mathews Phosa, a non-executive director of the Company and 6 257 406 ordinary shares to Diplobuzz Investments (RF) Proprietary Limited, an SPV owned by a trust controlled by Mano Padiyachy, an executive director of the Company at R3,50 per ordinary share.
The economic substance of these transactions for accounting purposes is the granting of a call option on the Company’s ordinary shares.
Date of grantValue
(cents)
Optionprice
(cents)
Marketprice
(cents)Volatility
%
Dividendyield
%
Riskfree rate
%
Friday, 23 July 2010 93,8 393 370 26,7 4,3 7,75
The option price has been based on the projected preference share obligation on 23 July 2017.
Expected volatility has been determined with reference to the annualised standard deviation of daily returns based on historical daily share price movements.
The subscription consideration of R73 003 000 was funded through the issue by a subsidiary company of 20 858 020 redeemable preference shares at R3,50 each which bear interest at 72% of the prime bank overdraft rate and are redeemable on 23 July 2017.
31. DIRECTORS’ INTEREST IN SHARE CAPITAL OF THE COMPANY
Beneficial number of ordinary shares
Non-beneficial number of ordinary shares
Director 2016 2015 2016 2015
The directors’ interests, directly and indirectly, in the issued share capital of the Company were as follows:
CD Stein– Direct 373 070 373 070 — —
SD Gottschalk– Indirect — — 95 929 020 94 183 036 CL Sack– Direct 1 700 000 1 700 000 — — M Padiyachy– Direct 375 000 375 000 — — – Indirect 6 257 406 6 257 406 — — IM Groves– Indirect 70 000 70 000 — — NM Phosa– Direct 45 500 250 000 — — – Indirect 14 600 614 14 600 614 — —
23 421 590 23 626 090 95 929 020 94 183 036
There have been no changes in directors’ interests between the financial year-end date and the date of approval of the consolidated financial statements.
Consolidated financial statements •113•

•114• Consolidated financial statements
Notes to the consolidated financial statementsfor the year ended 29 February 2016 (continued)
32. BUSINESS COMBINATIONS32.1 Business combinations effected during the reporting period On 1 March 2015, the Group acquired a majority stake, amounting to an 80% ownership interest in Core
Logistix Proprietary Limited (“Core”) which acquired and took control of the business of Nucleus Chain Stores Proprietary Limited on the same date. The business of Core focuses on both chain store and front door deliveries. The non-controlling interest has a 20% ownership interest in the entity, amounting to R20 recognised on acquisition date. Core’s principal place of business is South Africa. The goodwill that has been recognised is attributable mainly to the strong management and operational team and the synergies that are expected to be realised within the various divisions. Goodwill is not deductible for income tax purposes.
The purchase price for the business was R12,7 million. R7,1 million was paid in cash and the remaining R5,6 million has been raised as loan accounts in favour of the vendor. Acquisition related costs of R255 000 were recognised in operating expenses in the consolidated statement of comprehensive income.
As part of the business combination, the following assets were recognised at the acquisition date:
R’000
– Goodwill 10 670 – Property, plant and equipment 1 103 – Cash and cash equivalents 900
12 673
Acquisition date fair value of consideration paid: – Cash 7 097 – Liabilities assumed 1 774 – Contingent consideration arrangement 3 802
12 673
Summary financial information for the year ended 29 February 2016: – Revenue 54 609 – Net profit before tax 1 230
Contingent consideration arrangement The contingent consideration arrangement requires the Company to pay the previous owners of Nucleus an
amount of R3 802 000. This contingent consideration is subject to a 2015 revenue target being met. This target has been fully met during the current financial year.
32.2 Business combinations effected after the reporting period The Group acquired 100% of the ordinary share capital of Key, the effective date for the transaction being
1 March 2016, which is also the date on which the Group has taken control of its operations. Key carries on the business of warehousing, distributing and wholesaling a variety of fast moving consumer goods (FMCG) into the formal and informal trade, including independent traders, fuel forecourts and small retailers. The acquisition offers the Group sought after access into the informal market and will facilitate the opportunity for the Group to diversify its business. The goodwill that has been recognised is attributable mainly to these opportunities. Goodwill is not deductible for income tax purposes.
The cash consideration for the acquisition is R32,7 million, payable in three tranches. The second and third payments are subject to Key achieving certain profit warranties. The full consideration has been recognised at acquisition date as the warranties are likely to be met. Acquisition related costs of R412 000 were recognised in operating expenses in the consolidated statement of comprehensive income.

32. BUSINESS COMBINATIONS (continued)
As part of the business combination, the following assets and liabilities were recognised at the acquisition date:
R’000
– Goodwill 16 561 – Property, plant and equipment 14 034 – Inventories 36 816 – Fair value of trade receivables 14 736– Other current assets 9 433– Total liabilities (58 900)
32 680
Had the acquisition occurred as of the beginning of the current reporting period, the following summary financial information for the year ended 29 February 2016 would have been included in the consolidated statement of comprehensive income.– Revenue 357 278– Net profit before tax 7 363
33. DIVIDENDS PER SHARE Dividend number 17 of 12 cents per share was declared on 13 May 2015 and paid on 6 July 2015 to shareholders
registered on 26 June 2015.
Dividend number 18 of 5 cents per share was declared on 21 October 2015 and paid on 18 January 2016 to shareholders registered on 8 January 2016.
Dividend number 19 of 12 cents per share was declared on 11 May 2016 and paid on 4 July 2016 to shareholders registered on 24 June 2016.
34. NEW STANDARDS AND INTERPRETATIONS Standards and interpretations effective and adopted in the current year: The Group has adopted the following amendments for the 2016 financial statements. The impact of the
amendments are not material.
IFRS 2 Share-based Payments Annual improvements 2010–2012 cycle: Amendments added the definitions of performance conditions and
service conditions and amended the definitions of vesting conditions and market conditions.
IFRS 3 Business Combinations Annual improvements 2010–2012 cycle: Amendments to the measurement requirements for all contingent
consideration assets and liabilities including those accounted for under IFRS 9.
Annual improvements 2011–2013 cycle: Amendments to the scope paragraph for the formation of a joint arrangement.
IFRS 8 Operating Segments Annual improvements 2010–2012 cycle: Amendments to some disclosure requirements regarding the judgements
made by management in applying the aggregation criteria, as well as those to certain reconciliations.
IFRS 13 Fair Value Measurement Annual improvements 2010–2012 Cycle: Amendments to clarify the measurement requirements for those short-
term receivables and payables.
IAS 24 Related Party Disclosures Annual improvements 2010–2012 Cycle: Amendments to the definitions and disclosure requirements for key
management personnel.
Consolidated financial statements •115•

•116• Consolidated financial statements
Notes to the consolidated financial statementsfor the year ended 29 February 2016 (continued)
34. NEW STANDARDS AND INTERPRETATIONS (continued)
Standards and interpretations not yet effective The table below summarises the standards and interpretations issued but not yet effective. The standards below are
not expected to have a material impact on the Group’s financial statements.
STANDARD DETAILS OF AMENDMENT
EFFECTIVE FOR ANNUAL PERIODS BEGINNING ON OR AFTER
IFRS 5 Non-current assets held for sale and discontinued operations
Annual improvements 2012–2014 cycle:Amendments clarifying that a change in the manner of disposal of a non-current asset or disposal group held for sale is considered to be a continuation of the original plan of disposal, and accordingly, the date of classification as held for sale does not change.
1 January 2016
IFRS 7 Financial Instruments: Disclosures
Annual improvements 2012–2014 cycle:Amendment clarifying under what circumstances an entity will have continuing involvement in a transferred financial asset as a result of servicing contracts.
1 January 2016
Annual improvements 2012–2014 cycle:Amendment clarifying the applicability of previous amendments to IFRS 7 issued in December 2011 with regard to offsetting financial assets and financial liabilities in relation to interim financial statements prepared under IAS 34.
1 January 2016
IFRS 9 Financial Instruments
New standard which replaces IAS 39 Financial Instruments: Recognition and Measurement. The standard comprises guidance on classification and measurement, impairment considerations, hedge accounting and derecognition.
1 January 2018
IFRS 10 Consolidated Financial Statements and IAS 28 Investments in Associates and Joint Ventures
Narrow scope amendment addresses an acknowledged inconsistency between the requirements in IFRS 10 and those in IAS 28, in dealing with the sale or contribution of assets between an investor and its associate or joint venture
The effective date of this amendment has been deferred indefinitely until further notice.
IFRS 11 Joint Arrangements Amendments adding new guidance on how to account for the acquisition of an interest in a joint operation that constitutes a business which specify the appropriate accounting treatment for such acquisitions
1 January 2016
IFRS 15 Revenue from Contracts with Customers
IFRS 15 supersedes IAS 11 Construction contracts, IAS 18 Revenue, IFRIC 13 Customer loyalty programmes, IFRIC 15 Arrangements for the construction of real estate, IFRIC 18 Transfer of assets from customers and SIC 31 Revenue – barter transactions involving advertising services.
1 January 2018

STANDARD DETAILS OF AMENDMENT
EFFECTIVE FOR ANNUAL PERIODS BEGINNING ON OR AFTER
IFRS 16 Leases New standard that introduces a single lessee accounting model. IFRS 16 supersedes IAS 17 Leases, IFRIC 4 Determining whether an arrangement contains a lease, SIC 15 Operating leases incentives and SIC 27 Evaluating the substance of transactions involving the legal form of a lease. This standard requires a lessee to recognise assets and liabilities for all leases with the term of more than 12 months, unless the underlying asset is of a low value. The Group is unable to reliably estimate the impact of the standard on the financial statements.
1 January 2019
IAS 1 Presentation of Financial Statements
Disclosure initiative: Amendments designed to encourage entities to apply professional judgement in determining what information to disclose in their financial statements.
1 January 2016
IAS 7 Statement of Cash Flows
Disclosure initiative: Amendments requiring entities to disclose information about changes in their financing liabilities. The additional disclosures will help investors to evaluate changes in liabilities arising from financing activities, including changes from cash flows and non-cash changes (such as foreign exchange gains or losses).
1 January 2017
IAS 12 Income taxes Narrow scope amendment to clarify the requirements on recognition of deferred tax assets for unrealised losses on debt instruments measured at fair value.
1 January 2017
IAS 16 Property, Plant and Equipment and IAS 38 Intangible Assets
Amendments to clarify the basis for the calculation of depreciation and amortisation, as being the expected pattern of consumption of the future economic benefits of an asset. Clarifying that revenue is generally presumed to an inappropriate basis for measuring the consumption of economic benefits in such assets.
1 January 2016
IAS 27 Consolidated and Separate Financial Statements
Amendments to IAS 27 will allow entities to use the equity method to account for investments in subsidiaries, joint ventures and associates in their separate financial statements.
1 January 2016
IAS 34 Interim Financial Reporting
Annual improvements 2012 - 2014 cycle:Clarification of the meaning of disclosure of information “elsewhere in the interim financial report”.
1 January 2016
Consolidated financial statements •117•